1. Introduction
Understanding unsaturated zone processes is critical to improving our ability to mitigate contamination [
1], predict vadose groundwater flow paths and storage capacity [
2], and protect fragile cave resources [
3]. To understand these processes, a wide variety of techniques are implemented. Researchers utilized geophysical methods [
4], geochemical isotopic tracer methods [
5], hydrograph analyses [
6], and a combination of these approaches [
7]. Recent advances in lidar and photogrammetry techniques produce high resolution models of subsurface conduits that allow for the interactive analysis of cave features after data collection [
8,
9,
10]. While these modeling efforts provide substantial insight into unsaturated zone groundwater flow, these methods either rely on remote assessment of these processes or can only be applied to isolated sections of a conduit. As a result, these methods either do not provide the larger context or can only provide summations of regional scale patterns. Direct observations of conduit features and flow paths and their physical characteristics in the unsaturated zone may provide substantial information for documenting groundwater flow through this component of the critical zone.
Cave passages are one of the few places that allow direct access to subsurface flow paths, both in the saturated and unsaturated zones. These passages provide clear insight into modern and paleo hydrologic processes, from the surface to below the water table, including the unsaturated zone. Passage morphology and dissolution characteristics provide evidence of how these flow paths evolved: tube-shaped passages are clear signs of phreatic flow, canyons represent unsaturated zone flow path development, and cupolas are considered diagnostic of thermal water development [
11,
12,
13]. Additional evidence of water flow can be gleaned from other speleogens, such as scallops or flutes [
13,
14], and sedimentary deposits [
15]. Speleothem type and location can also be diagnostic of specific cave-forming processes. Stalagmites and stalactites are classic examples of vadose speleothems that form above the water table from descending meteoric waters, whereas calcite spar is a phreatic speleothem that forms underwater, and gypsum flowers form in dry evaporative environments. These cave features, including speleogens and speleothems, are documented using a resource inventory process that is established in many large cave exploration projects around the United States [
16,
17]. These resource inventories are spatially explicit, allowing direct comparisons with surface geomorphology and other geospatial datasets, and the interpretation of large-scale spatial patterns of cave features.
To develop a broader understanding of large-scale patterns in unsaturated zone flow, it is necessary to merge both the spatially explicit information of cave survey data and the feature-specific information of the resources present within a cave. Here, we show how combining cave survey and inventory datasets in a geospatial framework can provide insight into epikarst processes and allow for the interpretation of speleogenetic processes. Specifically, we address the following questions:
How do variations in cave passage size relate to potential controls on water flow?
How can spatial mineralogical patterns be used to interpret groundwater flow characteristics?
What can passage morphologies and mineralogies reveal about modern unsaturated zone flow through pre-existing preferential flow paths?
2. Materials and Methods
2.1. Study Sites
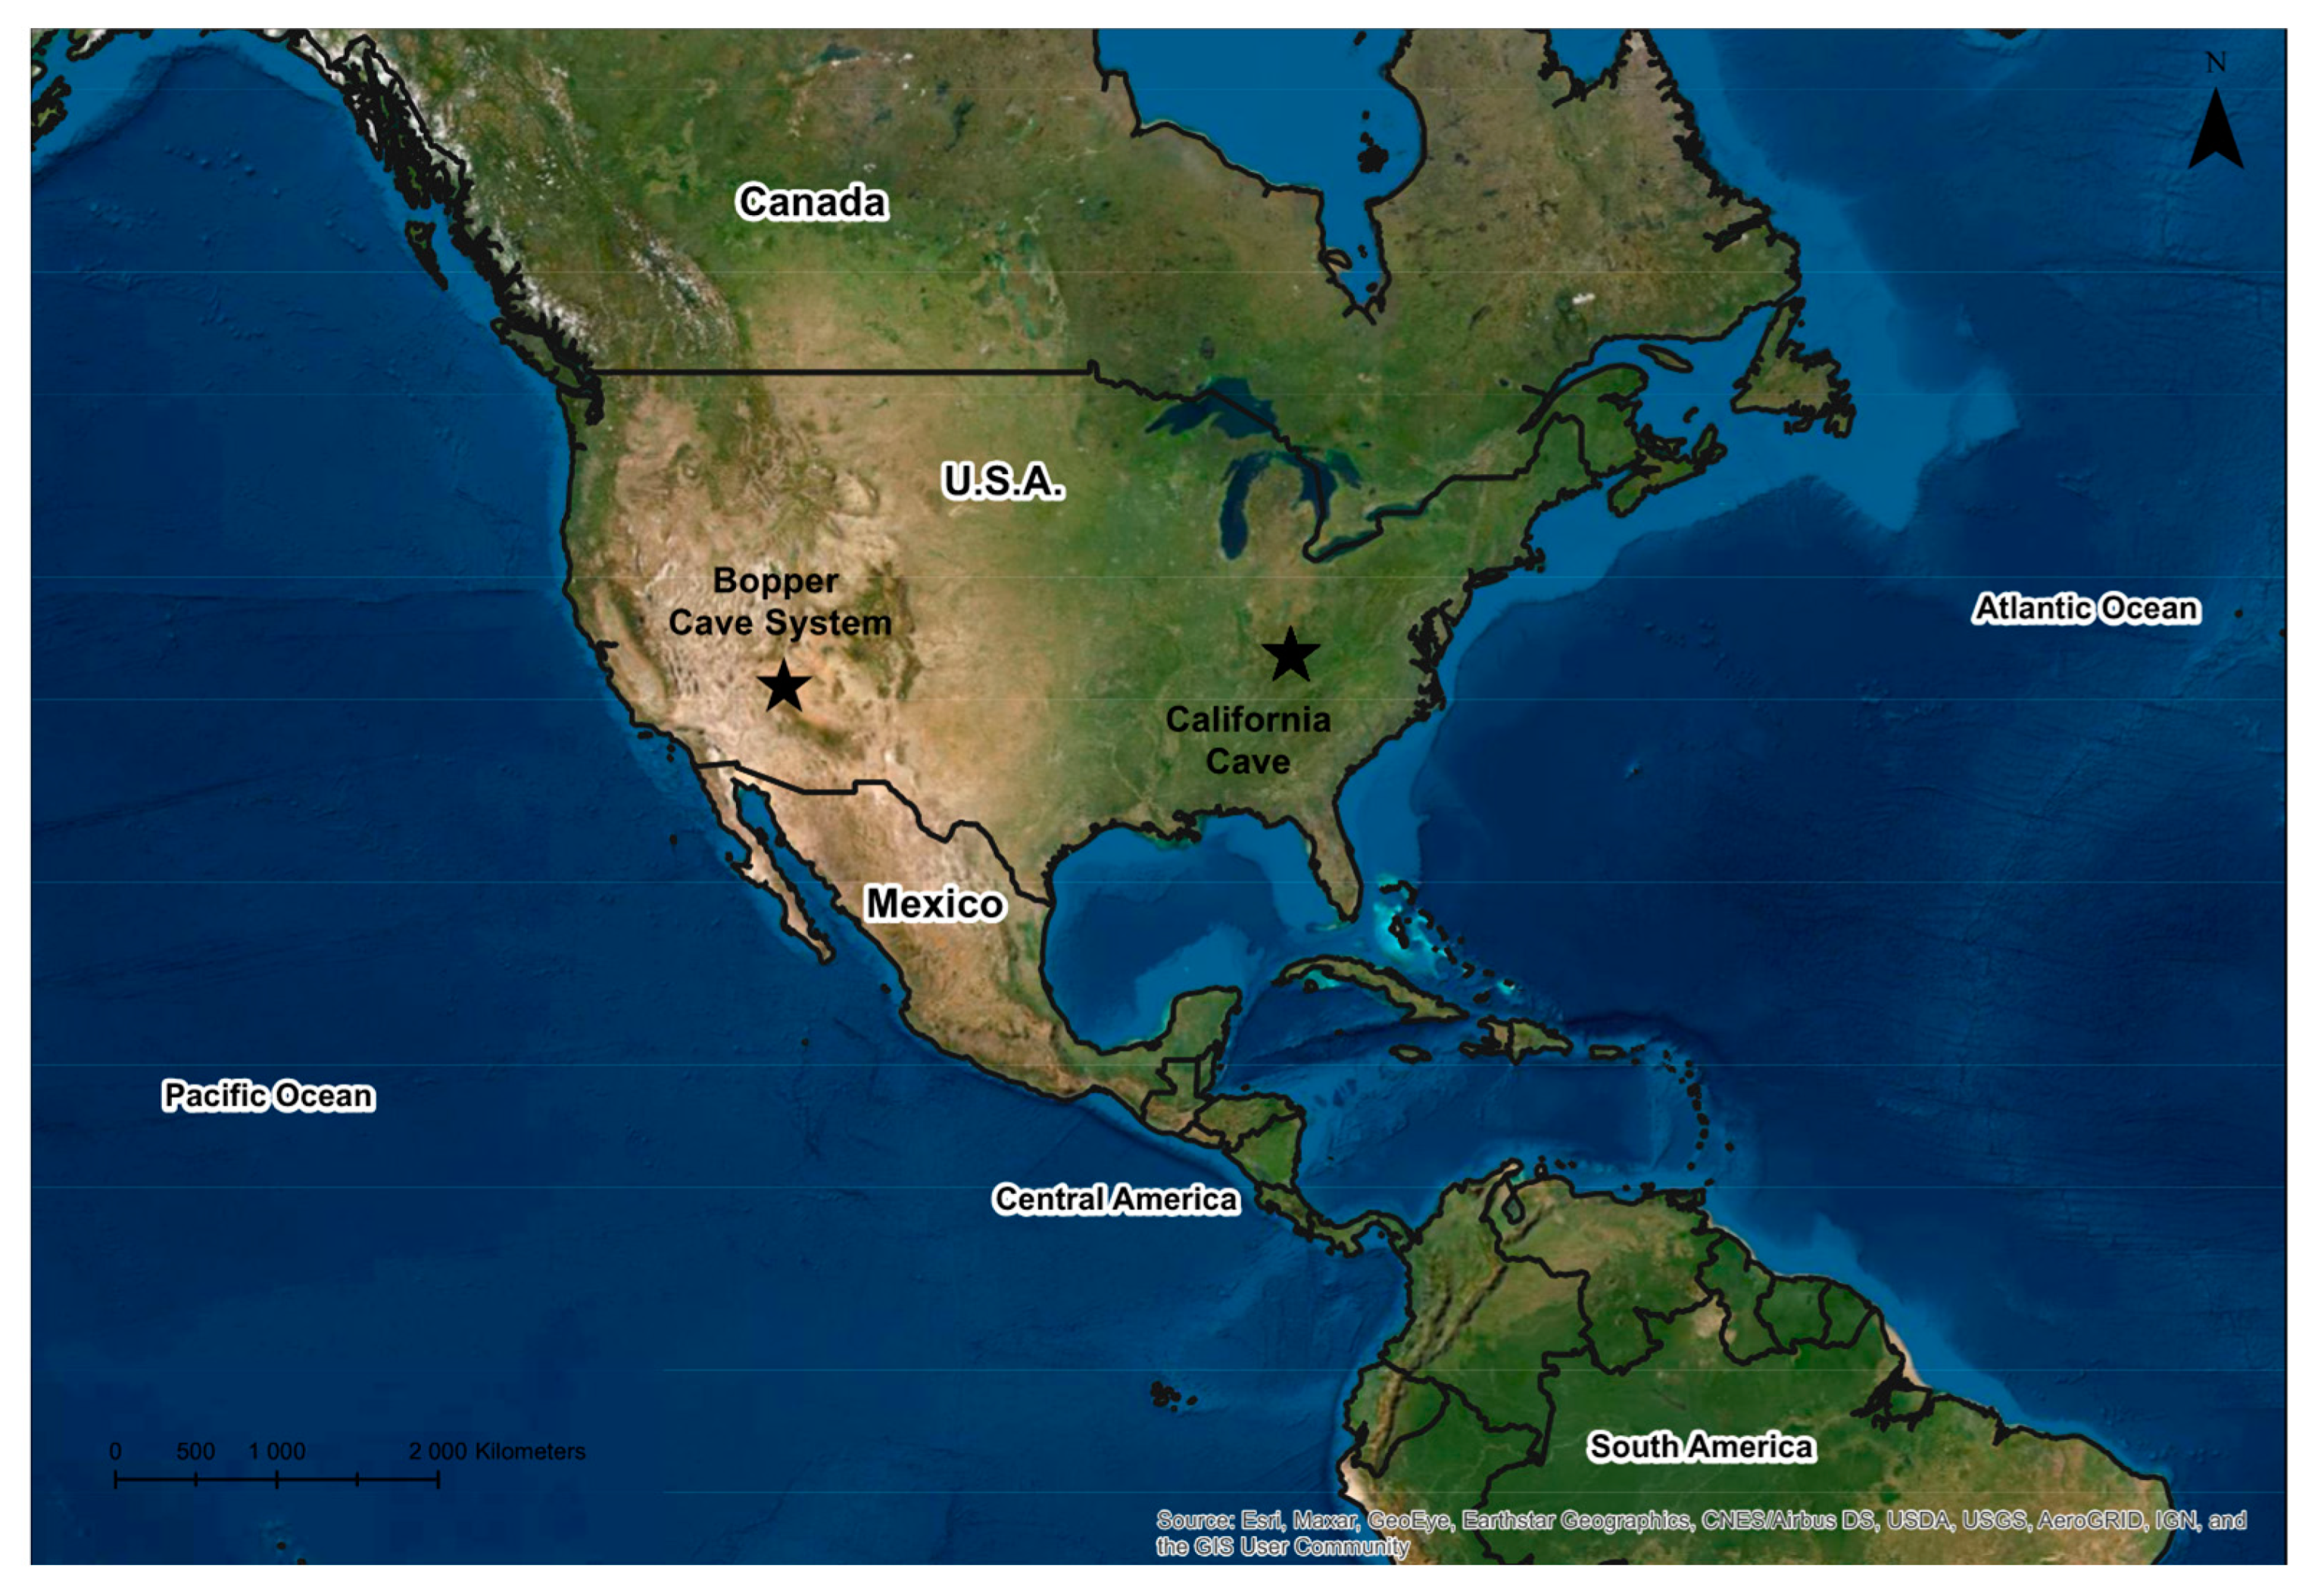
To address these questions, we focus on two cave systems with combined resource inventory and cave survey datasets. Bopper and California caves exist in vastly different environmental and hydrological settings and provide a variety of resources and cave passage morphologies to test our questions (
Figure 1).
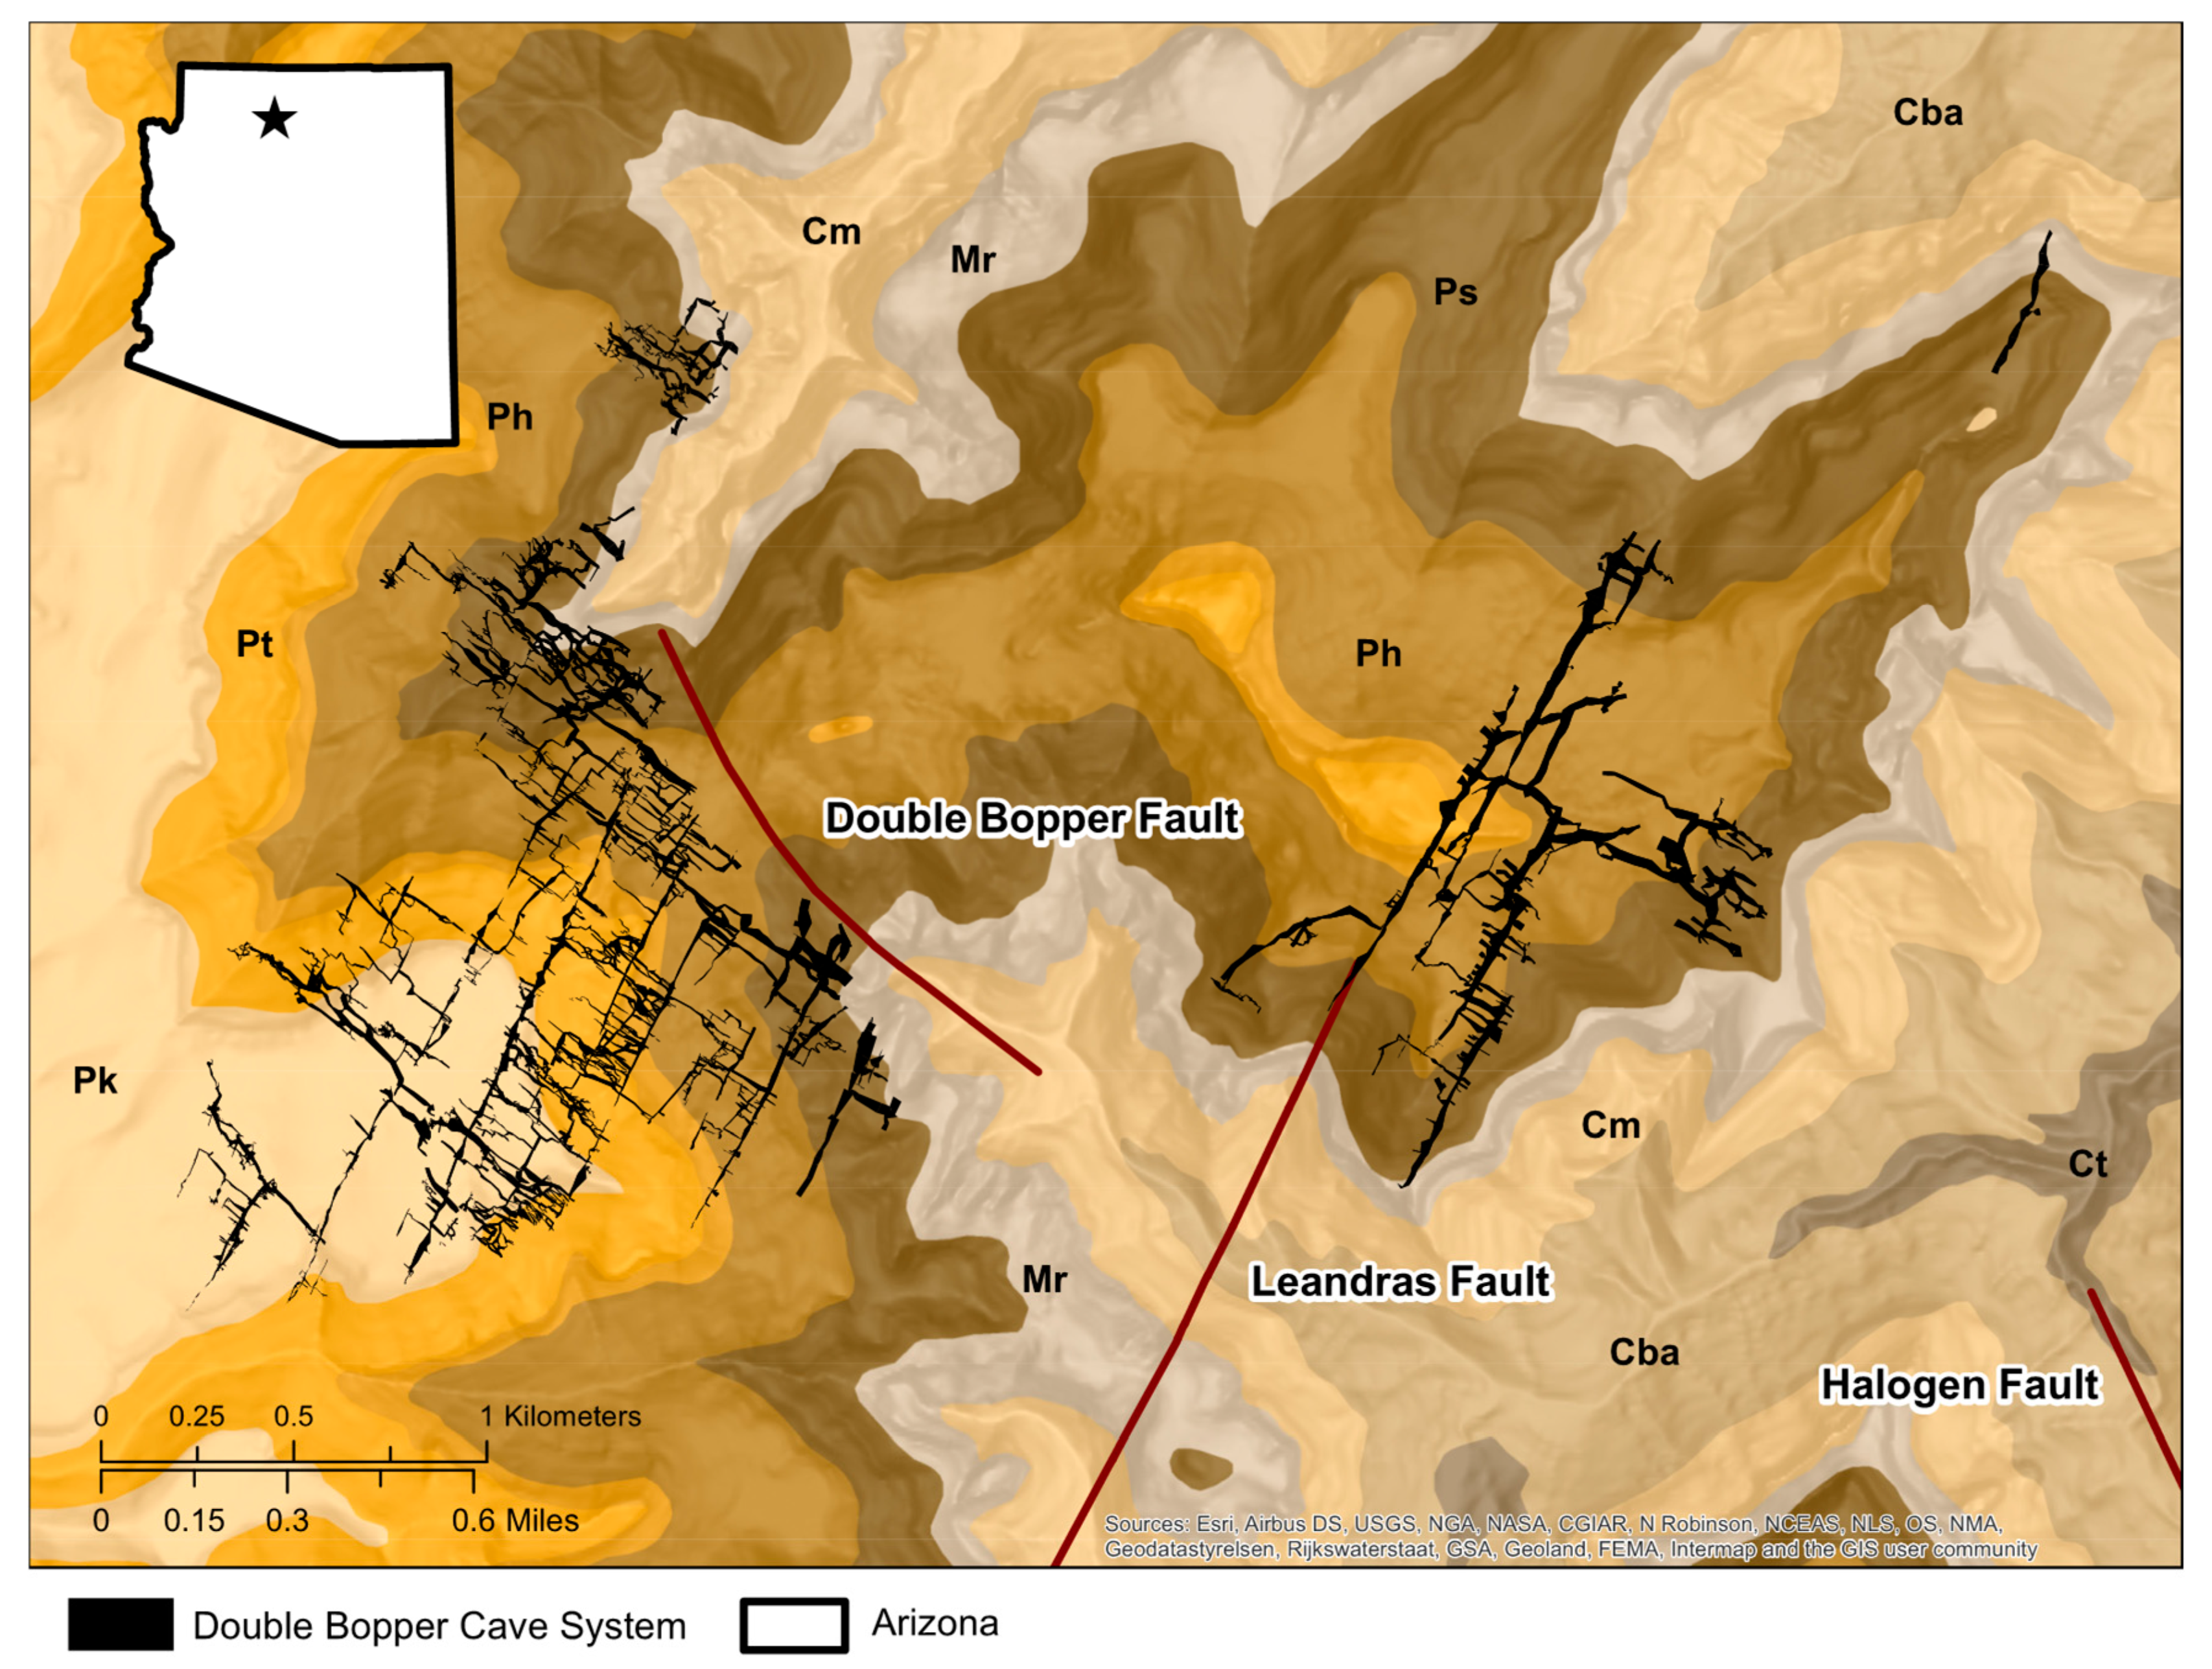
The Bopper cave system is formed in the Mississippian Redwall Limestone and overlain by one thousand meters of Paleozoic siliciclastic and carboniferous deposits. Local geologic structure near the caves is controlled by large, reactivated faults with three proximal to the cave systems: the Halogen Fault, the Double Bopper Fault, and the Leandras Fault (
Figure 2). The combined length of surveyed passages in this system exceeds 95 km, with the Double Bopper cave comprising over 64 of those kilometers.
The Bopper cave system is a series of hydrologically inactive caves, located over 250 m above the regional R-aquifer. The R-aquifer is a well-developed karst system that lies over 1000 m below the north rim of the Grand Canyon [
18]. The R-aquifer has a thickness of 400 m in the eastern Grand Canyon and thickens to 750 m in the west [
19]. The descent of the ancient R-aquifer occurred in response to incision of the Grand Canyon from the Colorado River. Caves in the ancient R-aquifer that were once in the phreatic zone are now abandoned in the unsaturated vadose zone. The Bopper caves are two-dimensional network maze caves with a large variety of passage sizes ranging from over 30 m in diameter to too tight for human passage. Double Bopper, the cave with the most complete resource inventory dataset, contains isolated areas of calcite-based speleothems: stalactites, stalagmites, and related drip stone features are found in a few areas of the cave, while calcite coatings are found in others. Gypsum deposits are found throughout most of the cave. Unidentified mineral deposits are also found in isolated areas of the cave. Since Double Bopper Cave has the most complete resource inventory dataset of caves in this system, it was used for resource inventory analysis. The entire Bopper cave system was used for passage morphology analysis.
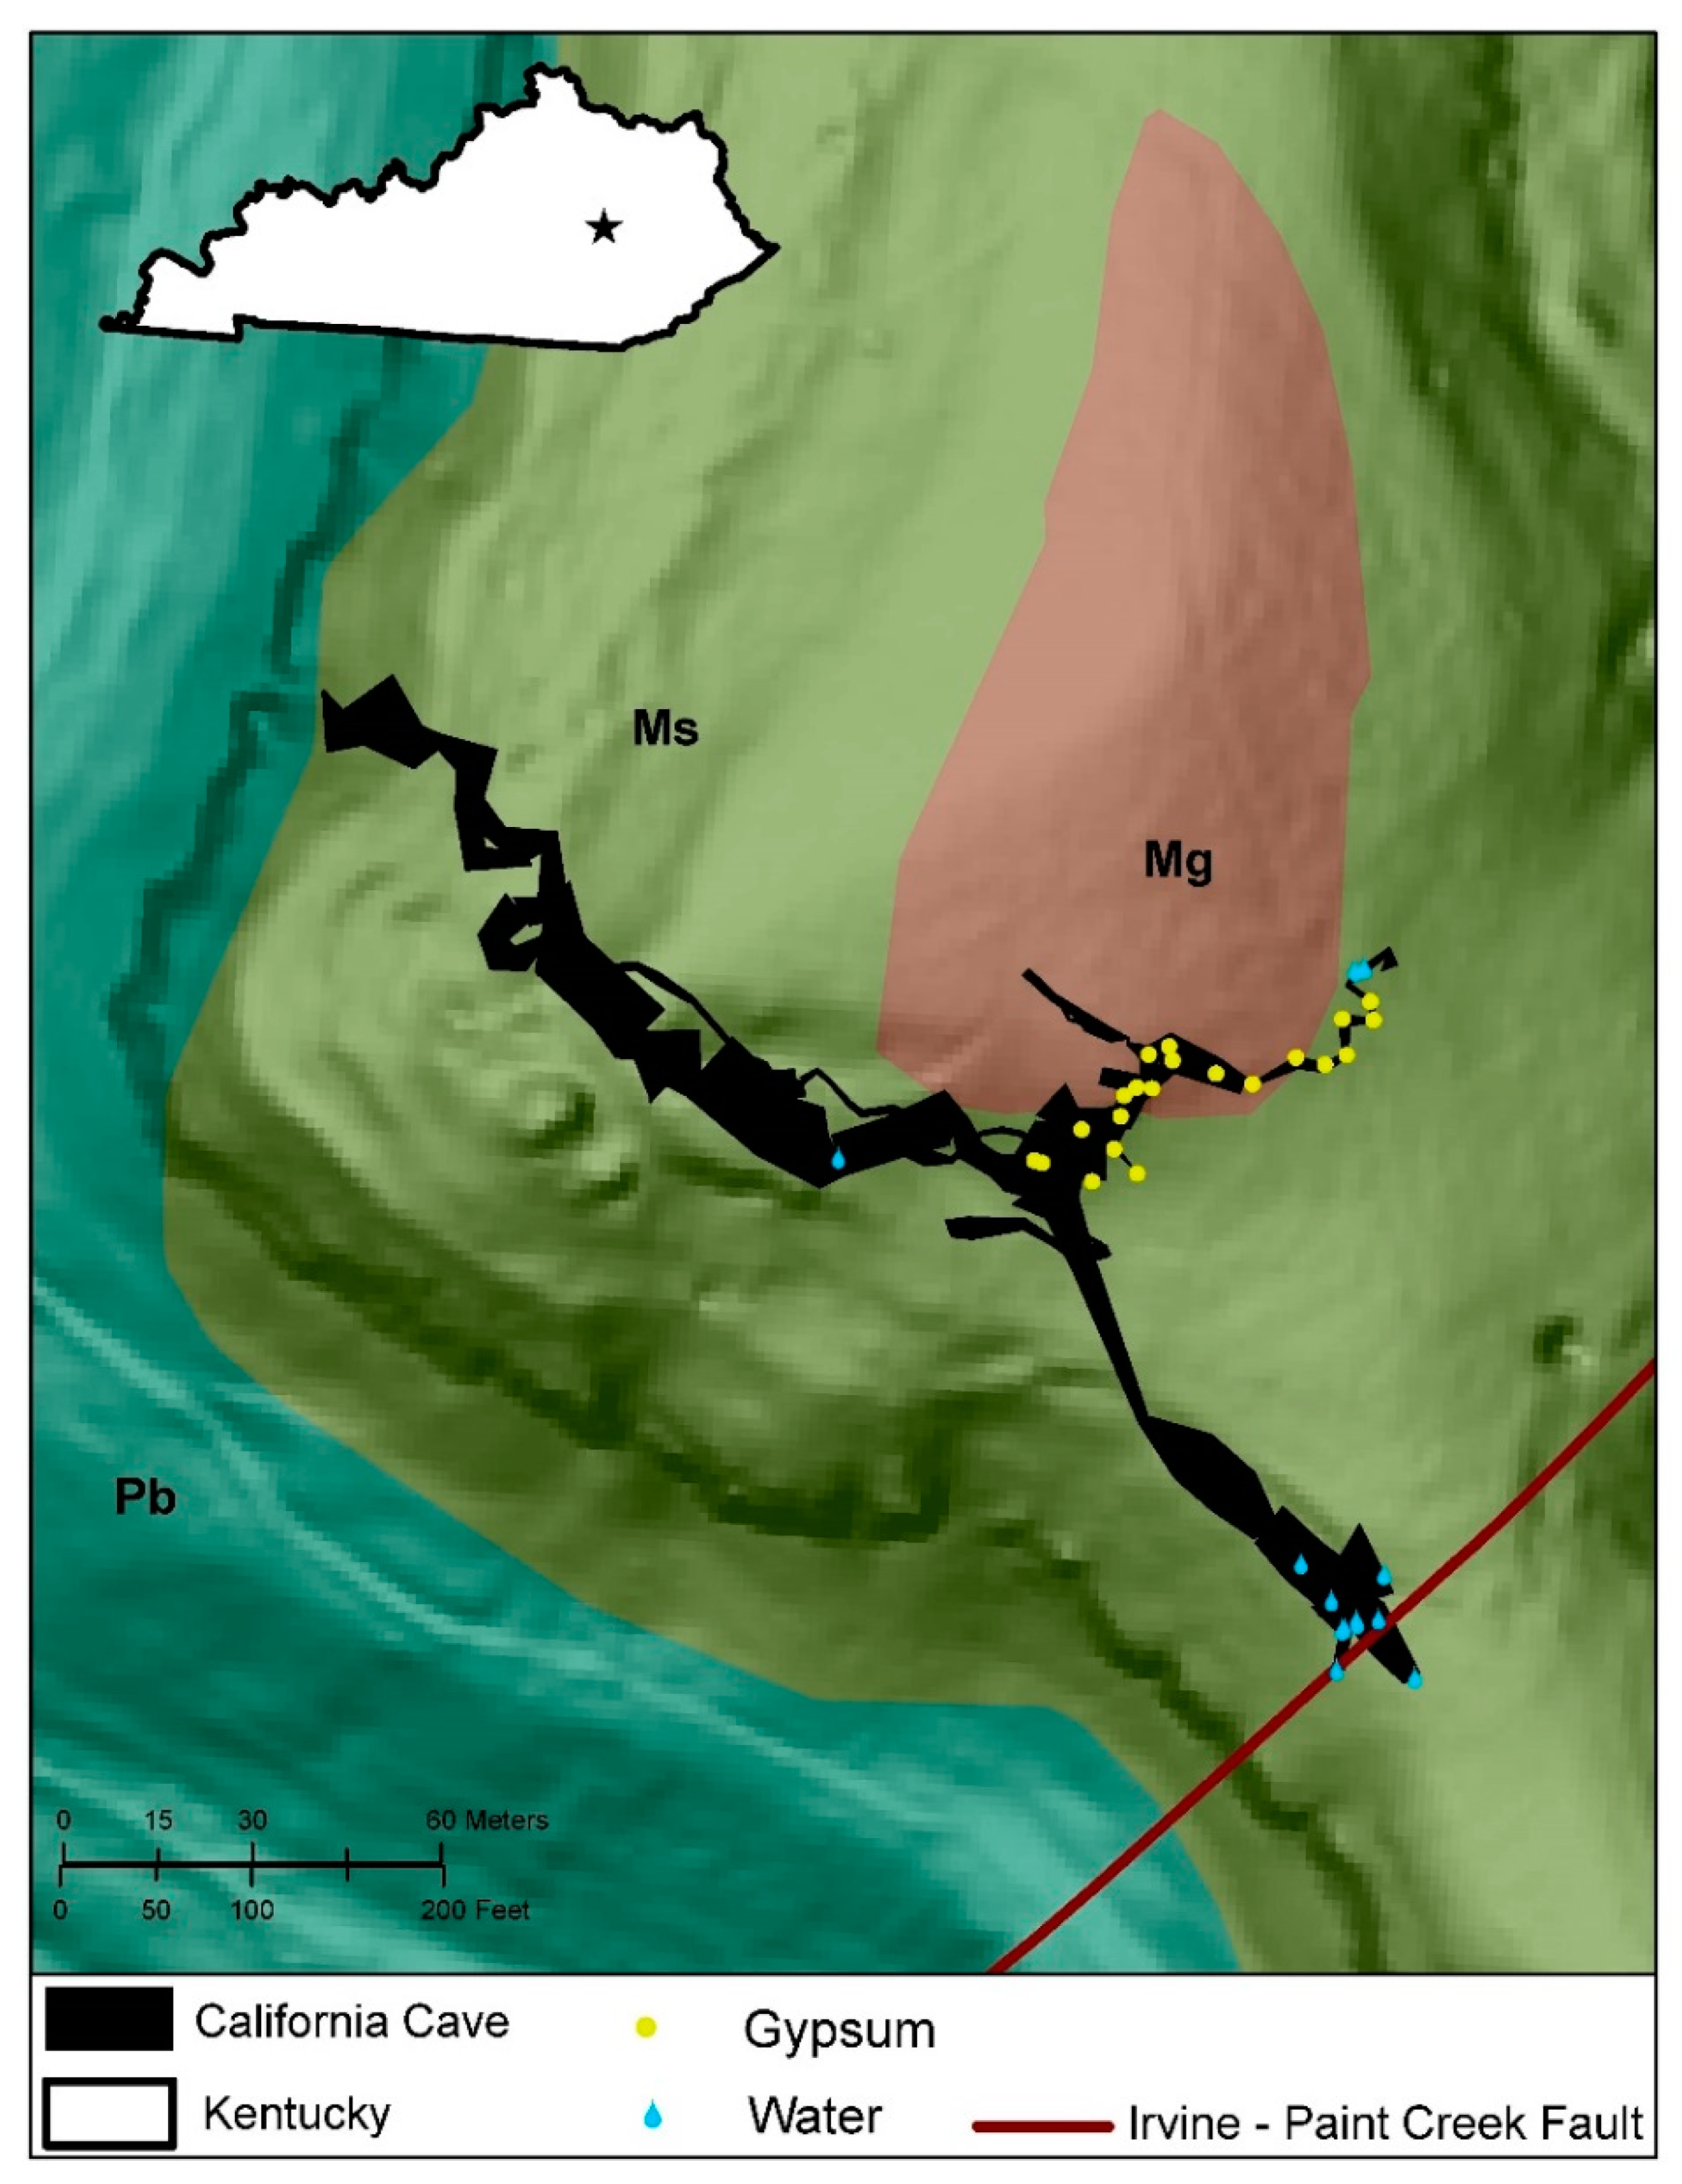
California Cave is located along the Irvine-Paint Creek fault on the Cumberland Escarpment of eastern Kentucky (
Figure 3). The cave is contained in the Slade Formation, a massive limestone unit approximately 100 m thick, overlain by the sandstone of the Grundy Formation and underlain by the shales of the Borden Formation. While the cave is 150 m above the regional base level, it is hydrologically active with dripping domes and small vadose streams. With just over 0.8 km of mapped passageway, the cave displays a branch-work, map-view pattern with a small variability in passage size. The cave is dominated by vadose-type canyons with phreatic tubes at some levels and a few dome complexes found in isolated sections of the cave. The resource inventory noted isolated areas of active water, in addition to secondary calcite and gypsum deposits.
2.2. Field Data Collection
For each cave in this study, cave map data were collected using traditional survey techniques [
20]. These data were collected utilizing Leica Disto laser range finders (manufactured in Heerbrugg, Switzerland) or Suunto compass and inclinometers (manufactured in Vantaa, Finland) to create a three-dimensional line survey through each humanly passable passage. Survey data were collected from one station to the next in the surveyor’s line of sight with distance, azimuth, and inclination recorded between stations. At each set of stations, front-sight and back-sight readings were taken with an acceptable agreement of ±2 degrees per reading. At each survey station, passage cross-sectional area was recorded so that a rudimentary three-dimensional conduit could be modeled from the data. Resource inventory data were collected simultaneously, noting all resources observed, including biology, geology, mineralogy, paleontology, archaeology, and hydrology. Each resource found was recorded and documented at the nearest survey station.
2.3. Geospatial Data Processing
Field data were digitized into a geodatabase for each cave that merged cave surveys and resource inventory data. Cave survey data were initially compiled into the COMPASS Cave Survey Software, a cave mapping software package (
https://www.fountainware.com/compass, accessed on 10 January 2022), and exported into the geodatabase with vector features representing cave passages in the form of points, lines, and polygons. Resource-inventory data were then compiled into a comma-separated file that produced a binary dataset for each resource at each station in the cave and joined with the cave survey data to create a single, spatially explicit resource dataset. For this study, we primarily focused on the presence or absence of water, and secondary mineral deposits noted in the resource inventory. For visualization and interpretation, these data were overlain on local geologic strata and structural data for each site using Grand Canyon National Park (
irma.npa.gov, accessed on 10 January 2022) and Kentucky Geological Survey (
kgs.uky.edu/kgsweb/main.asp, accessed on 10 January 2022) database websites for the Bopper cave system and California Cave, respectively.
2.4. Statistical Approaches
To address our research questions, we performed analyses in R Studio, a statistical computing and graphics software (
https://www.rstudio.com, accessed on 10 January 2022) to determine if there were significant relationships between variations in the passage sizes, secondary mineral deposits and nearby structural features.
2.4.1. Passage Morphology
Variability in passage size of the Bopper cave system was analyzed in relation to the distance from the Leandras, Double Bopper, and Halogen faults to quantify the relationship between these faults, potential flow paths or flow barriers, and cave passage size.
Passage cross-sectional area was used as the response variable and combinations of the distances from faults as predictor variables. We then modeled a series of linear regressions to determine if relationships exist between the distance from each of the nearby faults and passage size. Cross-sectional area was normalized using a Log
10 transformation and the distance from faults were normalized using a Z-score scaling transformation. The resulting models were then analyzed to determine the best fit model using Akaike information criterion (AICc) [
21].
2.4.2. Mineralogy Distribution
For Double Bopper Cave, a one-way ANOVA was used to determine if a relationship exists between passage area and the presence of specific cave mineral resources. Passage area data normalization was performed using a Log10 transformation. A Tukey Honest Significant Difference test was used to determine if these secondary speleothems were found in statistically larger or smaller passages.
2.4.3. Active Water Flow
To understand the relationships between geology and active flow in California Cave, water, dripstone speleothems, and gypsum deposits were plotted spatially along the cave survey. Geologic data were then projected over the cave survey data to determine spatial patterns in the resource inventory that could be qualitatively compared to the overlying geologic units and structural features. Due to the smaller sample size in California Cave, a statistical approach was not possible.
3. Results
3.1. Passage Morphology
The best fit model to explain passage size patterns incorporated the distances from the Leandras fault, Double Bopper fault, and the Halogen fault. The best fit model had an adjusted R-squared value of 0.08, indicating that 8% of the variability in passage size was explained by spatial relationships with major faults (
Table 1). The model coefficients for the best fit model indicated that passage area increased with distance from the Double Bopper fault and decreased with distance from the Leandras fault and Halogen fault (
Table 2).
3.2. Mineralogy Distribution
One-way ANOVA results showed that there were significant differences in passage size for the resources assessed. The Tukey Honest Significant Difference test identified a critical finding: secondary cave mineral deposits are found in passage sizes of significant differences at a 5% level (
Table 3). Gypsum flowers, gypsum needles and iron crusts were found in statistically smaller passages, whereas stalactites, stalagmites, moon milk, and dogtooth spar were found in statistically larger passages. The presence of flowstone was found to have no significant relationship with passage size area.
3.3. Active Water Flow
Combining regional structural and geologic datasets with the California Cave map indicates that the cave is partially overlain by the Grundy Formation and intersects the Irvine-Paint Creek fault (
Figure 3). Resource inventory data show that the spatial distribution of gypsum deposits are primarily located in the cave passage beneath the overlying Grundy sandstone. Water and dripstone formations are found near the Irvine-Paint Creek fault and along the contact between the permeable Slade Formation and impermeable retreating Grundy Formation.
4. Discussion
4.1. Bopper Cave System Speleogenetic Interpretation
Incision of the Grand Canyon and its subsequent drainages may have bisected an ancient continuous Bopper cave system. Cave entrance locations are oriented either adjacent to or directly across the canyon from one another and are completely devoid of active water flow, indicating that these caves are older than the Grand Canyon and are the result of older groundwater systems; they are suggested to be of hypogene origin [
7]. Modern hypogene waters were documented at various spring sites associated with large faults in the Grand Canyon [
22], indicating that hypogene conduits exist in the R-aquifer. The Bopper cave system is characterized as a series of network maze caves with many closed labyrinthine loops, indicating backwater flooding or diffuse infiltration [
23]. However, the Bopper cave system does not display floodwater maze characteristics, such as stream passage morphologies, collapse features, or fluvial sedimentary deposits such as sand or cobbles. Further, these caves have large concentrations of gypsum flowers and corrosion residue, which are commonly found at this scale in caves formed from sulfuric acid hypogene fluids [
24,
25].
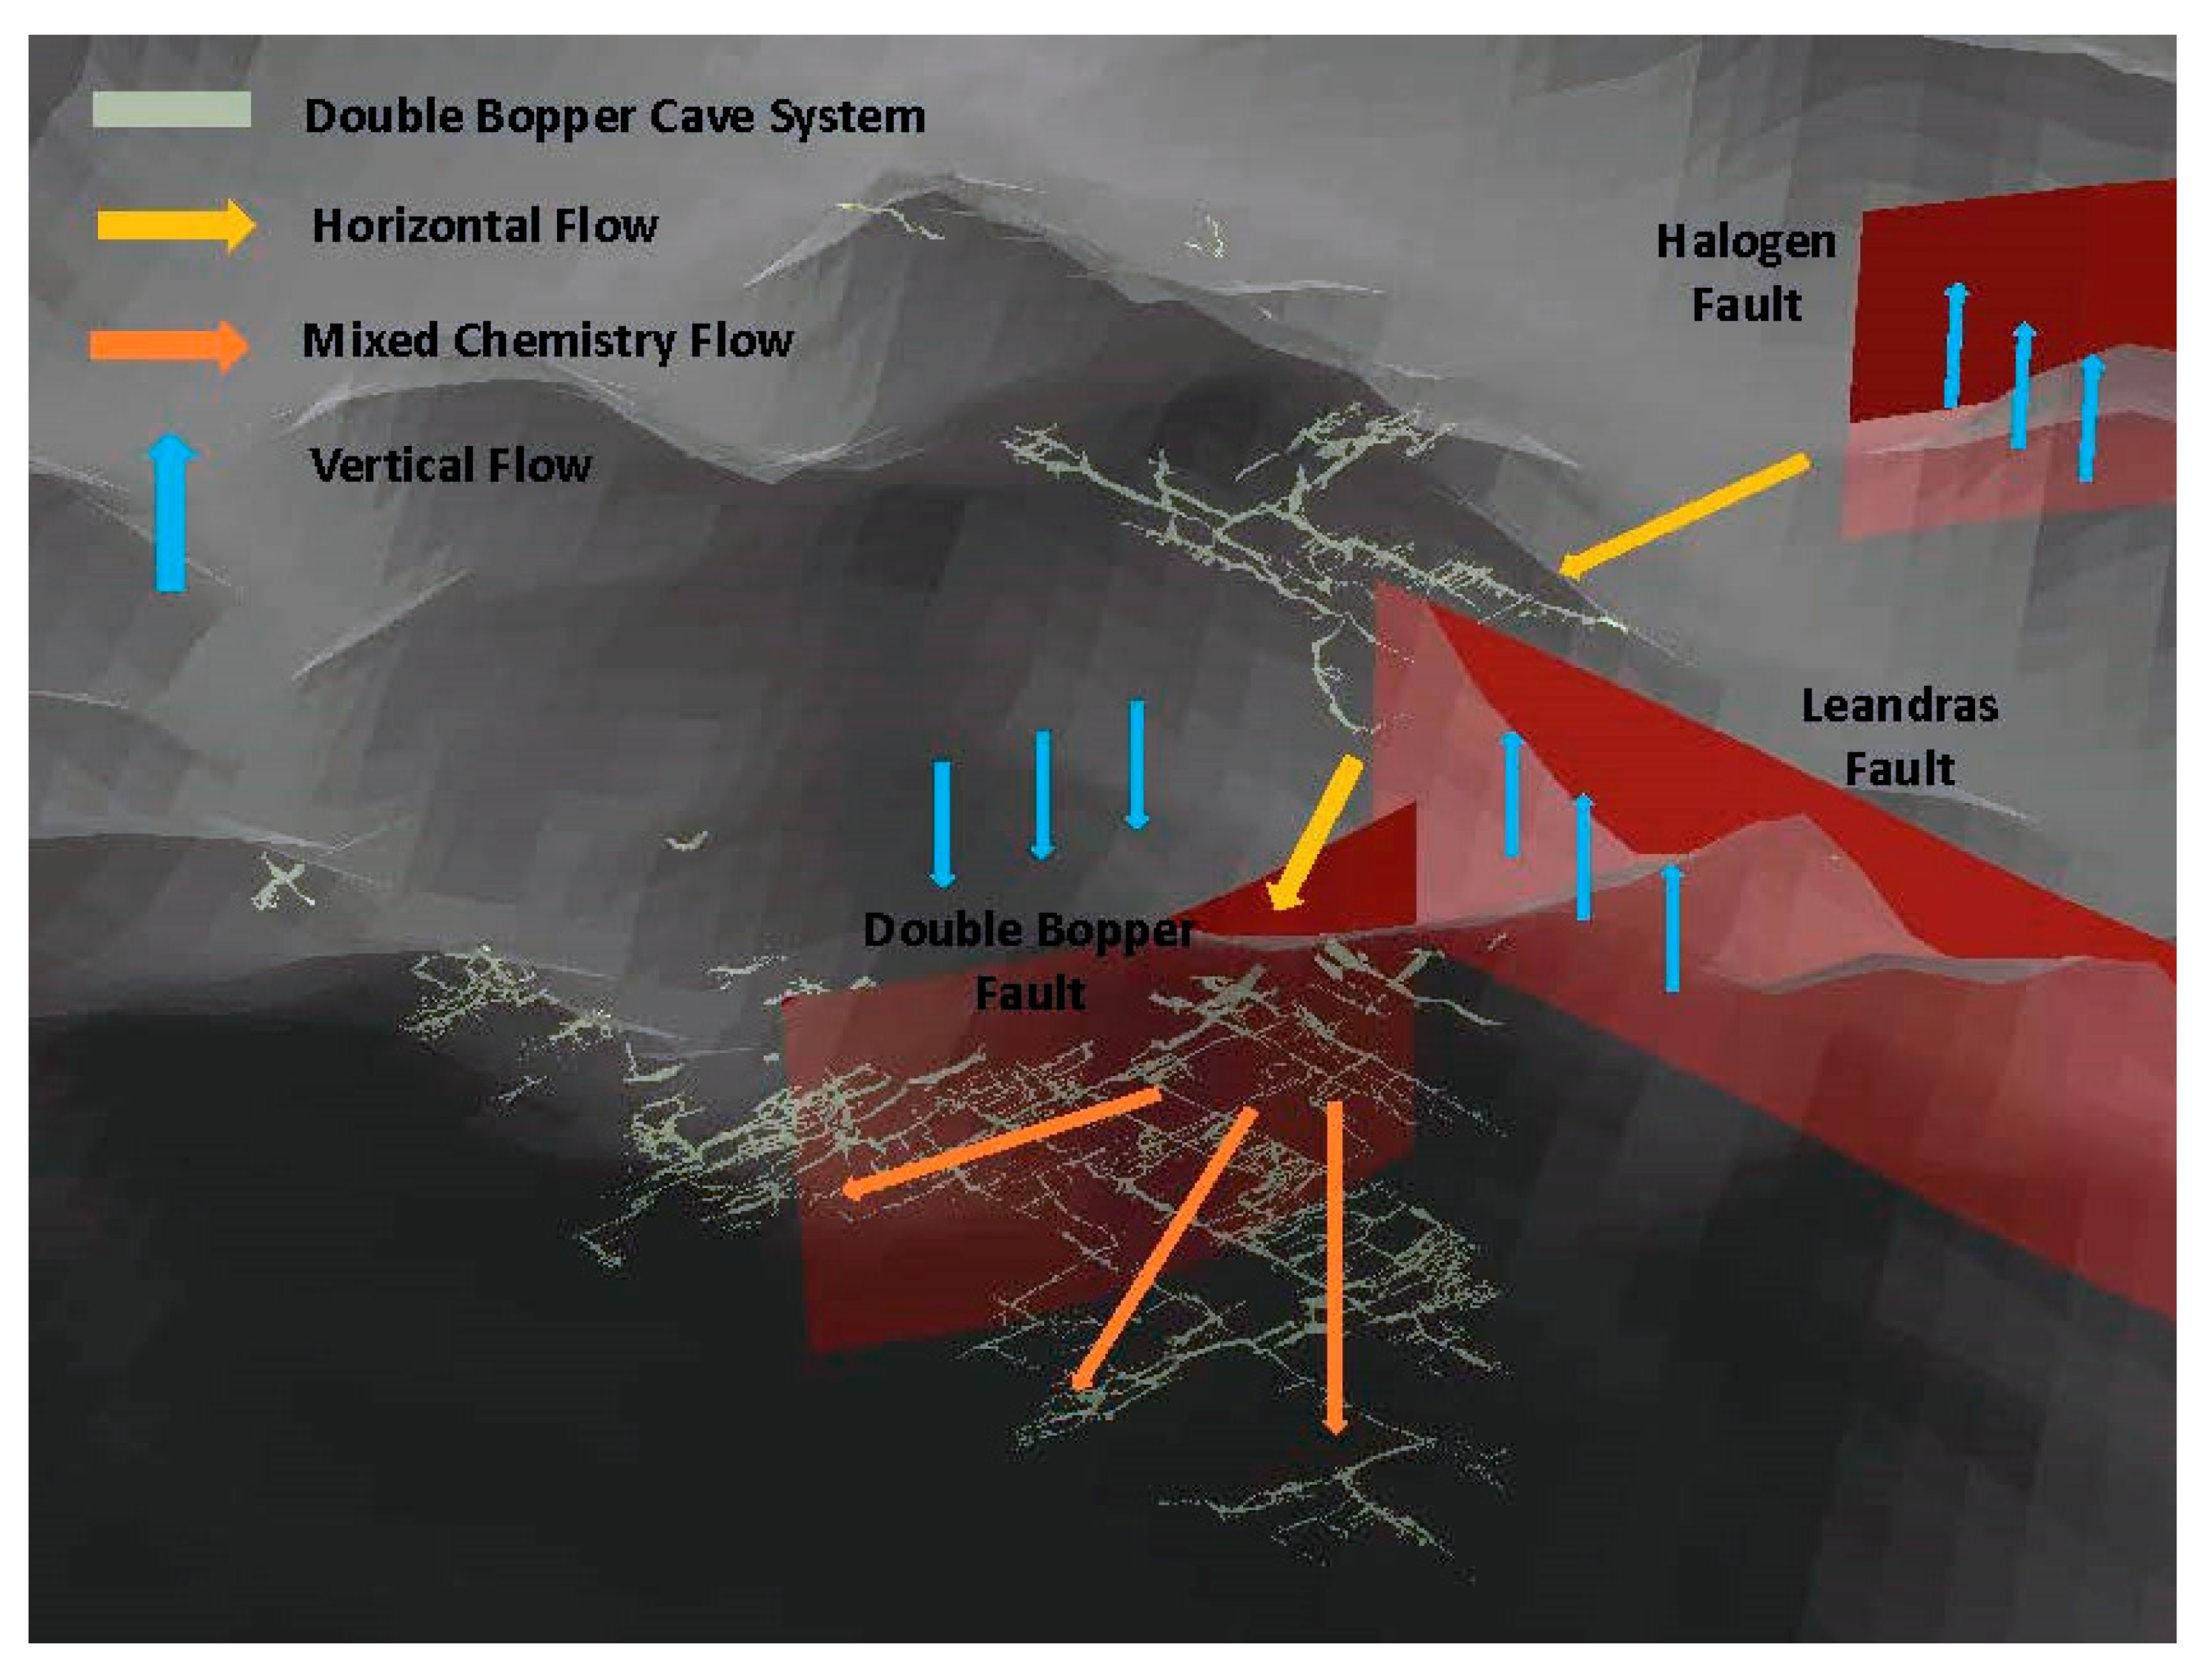
The results show a decrease in passage size with an increased distance from the Leandras fault and Halogen fault, suggesting that they may have been the source of the hypogene fluids which created the Bopper cave system. As these fluids rose along the faults, they would have been more aggressive near the Halogen or Leandras fault, resulting in increased dissolution near the faults. As these waters moved laterally away from these faults, their saturation relative to calcite would have increased, decreasing dissolutional capacity and resulting in larger passages closer to these faults [
26]. The inverse relationship with the Double Bopper fault suggests that it acted as a barrier to horizontal flow and upwelling hypogenic waters (
Figure 4).
Passage size appears to have significant relationships with the distance from nearby faults; however, low R2 values suggest that other factors not considered here, such as primary and secondary permeability pathways from fractures and varying lithologies in the Redwall Limestone, may be important in driving spatial patterns in passage size. Despite having low R2 values, our data not only show the sign of the relationship between passage size and the distance from faults, but also which fault has a bigger impact on passage size. Our results show that passage size changes twice as much relative to distance from the Halogen fault when compared to distance from the Double Bopper or Leandras faults.
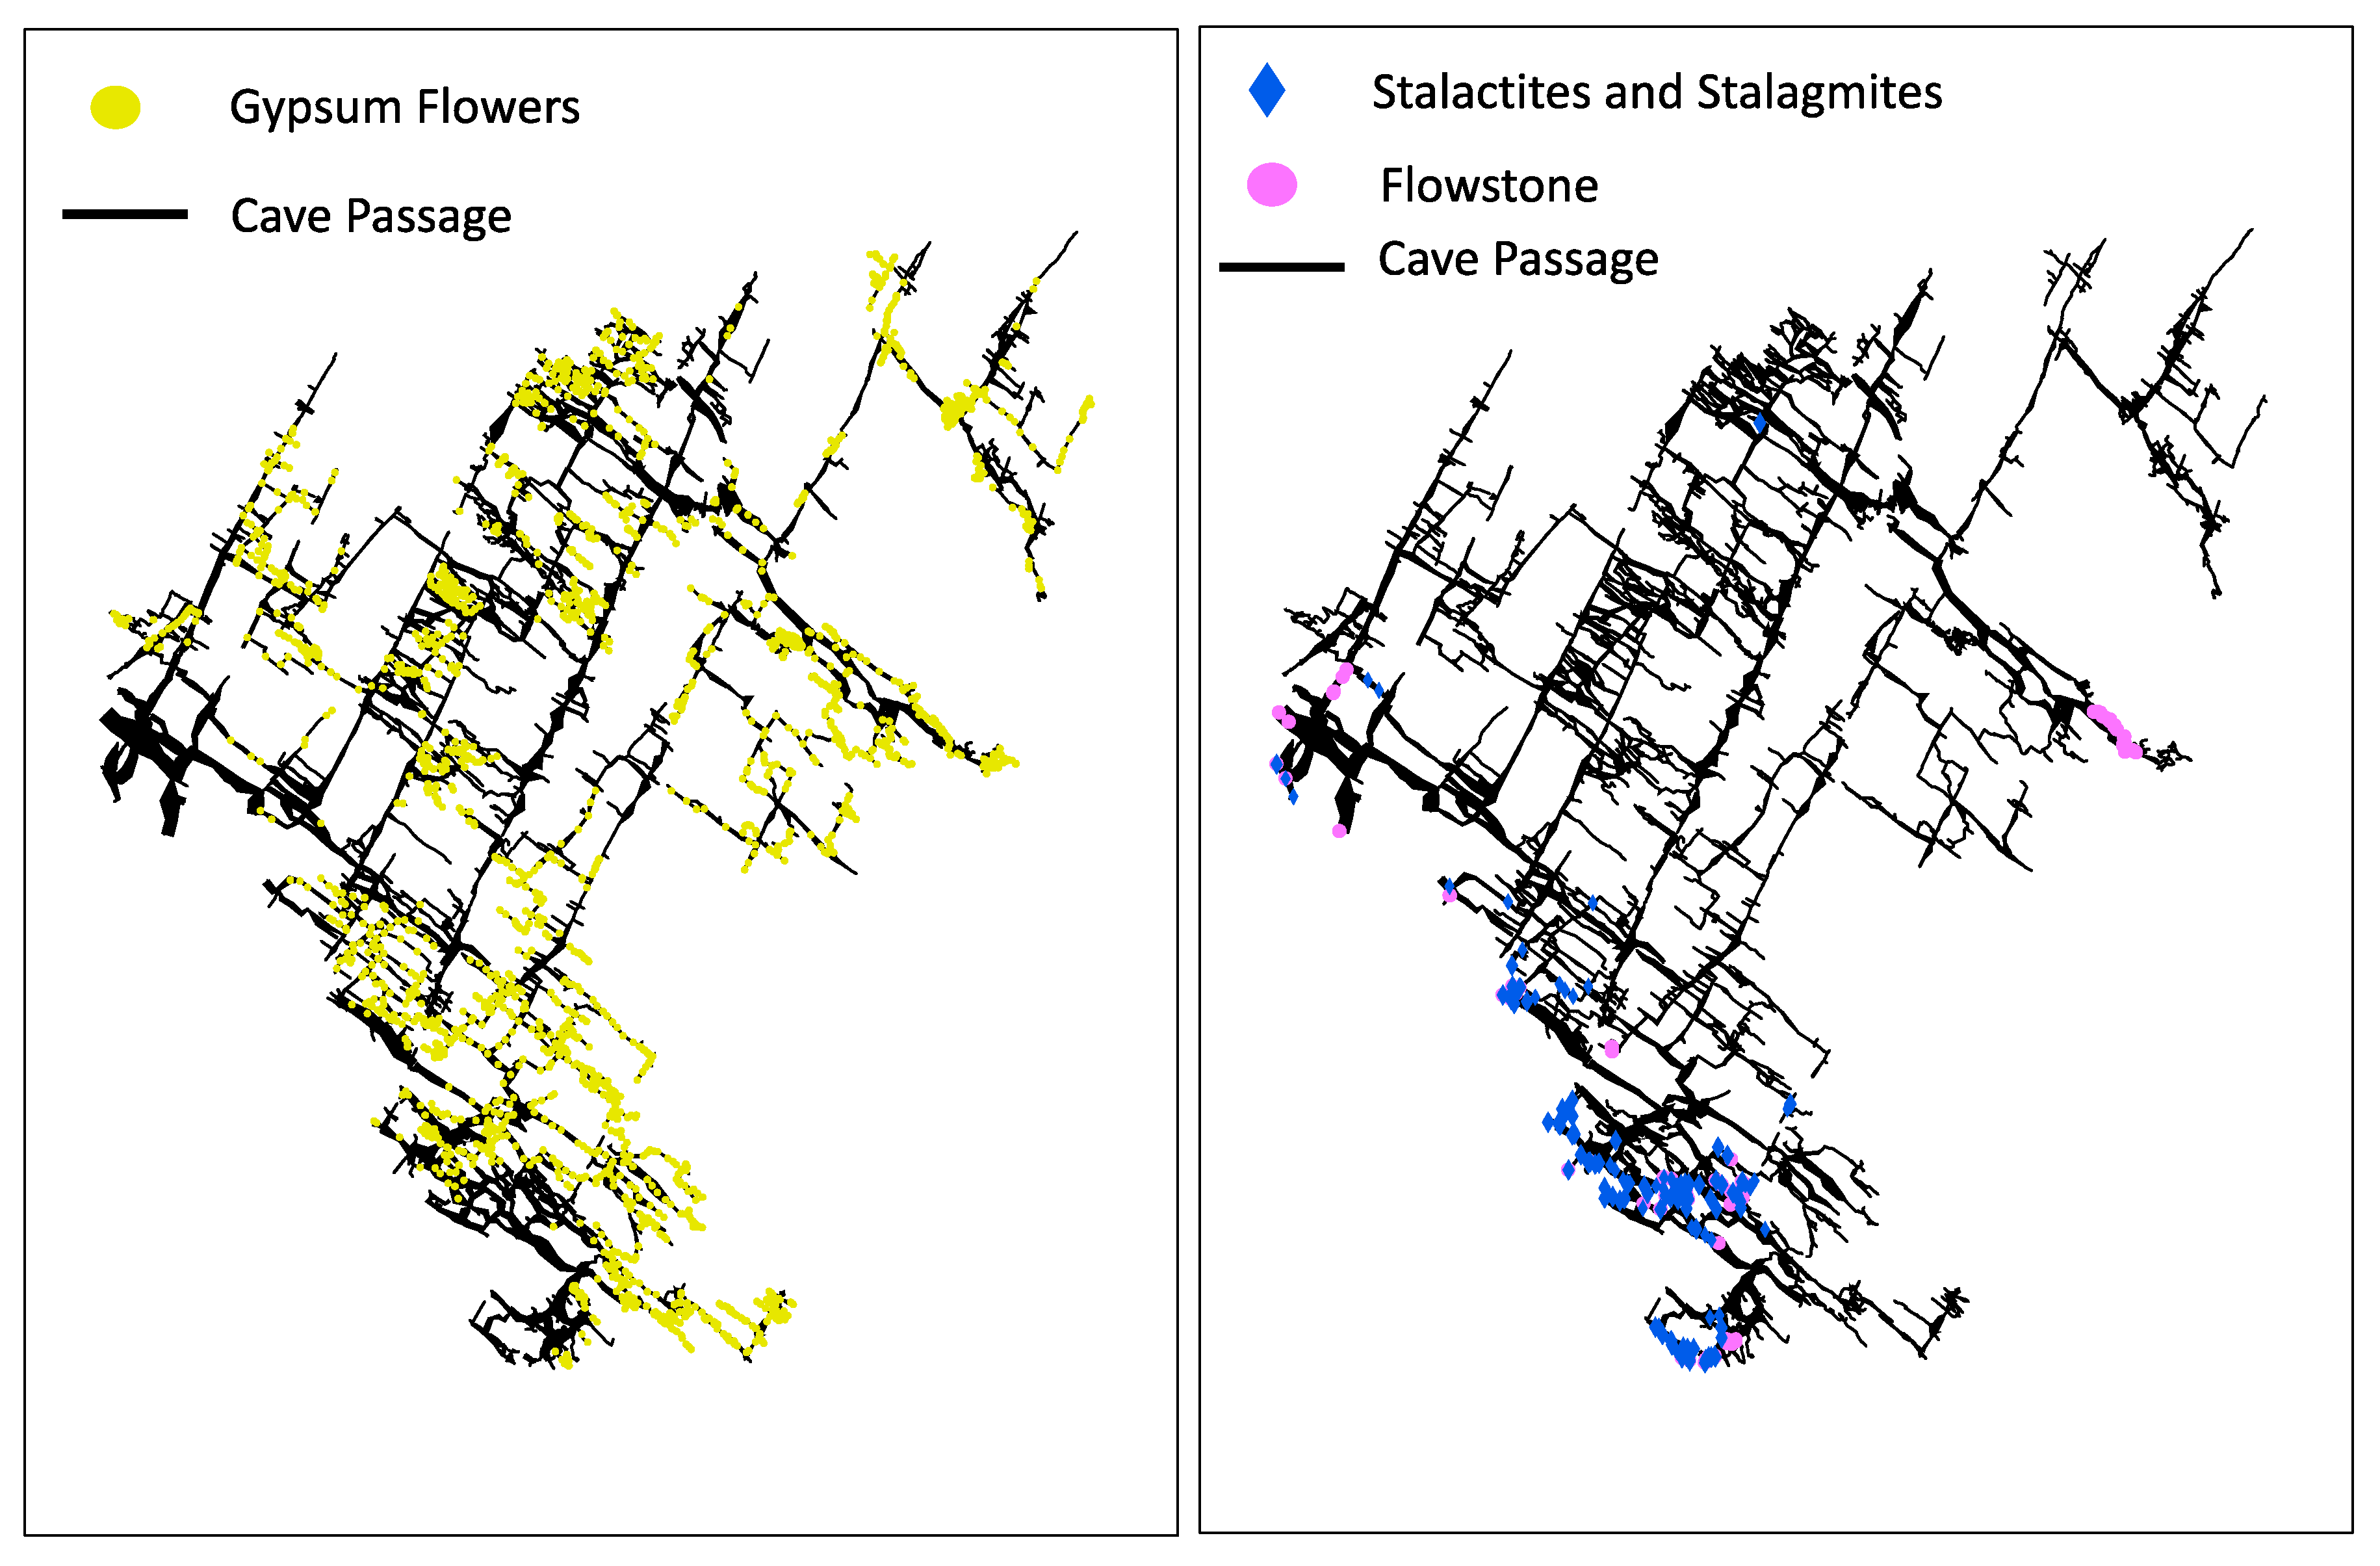
Spatial patterns in the distributions of calcite and sulfur-based speleothems in relation to each of the faults may indicate that Double Bopper was formed in the phreatic zone, transitioning into the unsaturated zone after the R-aquifer dropped below the level of the Redwall Limestone in this part of the canyon. Gypsum flowers are found ubiquitously throughout the cave and in statistically smaller passages (
Figure 5). The diffuse infiltration of sulfate-rich waters from the Leandras or Halogen faults created the phreatic structure of the cave and allowed for the mass deposition of evaporitic gypsum flowers after initial fluid retreat [
24,
25]. Once in the unsaturated zone, vadose speleogenesis commenced. Stalactites, stalagmites, moon milk and calcite spar deposits are found near entrances and statistically larger passages, with most vadose speleothems found near the Double Bopper fault. Vertical surface joints documented near the Double Bopper fault indicate meteoric recharge with fluid movement through the unsaturated zone creating dripstone speleothems [
27]. While the Double Bopper fault appears to act as a fluid barrier for cave passage formation (with passages terminating against it), it also acts as a fluid conduit for epigene waters migrating to the unsaturated zone. Fault displacement can both enhance and diminish fluid movement based on the permeabilities of displaced lithologies [
28], and our results suggest that both have happened in this system.
4.2. California Cave Speleogenetic Interpretation
The California Cave data demonstrate that geologic structure and overlying lithology are primary controls on unsaturated zone flow paths. Active water and dripstone formations proximal to the Irvine-Paint Creek fault indicate that this fault zone is an enhanced hydrologic pathway from the surface through the unsaturated zone. The overlying Grundy Sandstone acts as impermeable caprock, which can be observed by the presence or lack thereof of gypsum, water, and dripstone resources in the cave. The exclusive presence of gypsum deposits underneath the caprock shows that minimal water is moving through these sections of the cave [
29]. At the same time, the presence of dripstone formations and active water along the contact with the Slade Formation shows that water is being channeled on the surface and only infiltrating once the water reaches the limestone epikarst [
29]. The spatial distribution of gypsum, calcite, and water found in California Cave highlight traditional concepts in epigenic speleogenesis in the unsaturated zone [
23].
4.3. Conceptual Unsaturated Zone Development
While Grand Canyon caves and caves of the Cumberland Escarpment exist in very different environments, through the combination of cave survey and resource inventory data, some commonalities in unsaturated zone hydrogeology can be shown. While caves represent extreme permeability in the unsaturated zone, these systems show that much of this is not active hydrologically, which can be seen by the presence of evaporite minerals, such as gypsum, and lack of active water or water-associated speleothems, such as stalactites. The lithology overlying a cave system appears to exert a primary control on the spatial distribution of active unsaturated zone flowpaths. California Cave data show that overlying lithology funnels water to the contacts between soluble and retreating insoluble units. Similarly, the Bopper cave system, overlain by nearly 1000 m of siliciclastic and carbonate rock, only sees indications of unsaturated zone flow along existing geologic structure.
For existing cave passages to become hydrologically active, additional influences are needed to create connectivity between the surface and the underlying aquifer [
13]. These pathways are primarily controlled by geology; interactions between water, overlying lithology, and structure result in the activation of these pre-existing pathways. Faults can create enhanced permeability between the surface [
30,
31] and impermeable units overlying caves can focus the water at geologic contacts, which result in the active waterflow through caves and deposition of dripstone formations [
29]. Secondary bedrock, fracturing from tectonic forces or erosional stress relief, may also activate permeability pathways adjacent to major faults [
32].
The relationship between faults and water flow is likely dependent on the overall nature of the fault and how porosity and permeability changed with lithologic displacement. Passages in Double Bopper terminated against the Double Bopper fault, meaning that the fault acted as a barrier for hypogene speleogenesis. Modern epigenic water deposits form dripstone formations along this same fault, indicating vadose development near the Double Bopper fault. There are similarities with the relationship between the Irvine-Paint Creek fault and California cave. The Irvine-Paint Creek fault acts as a preferential flow path from the surface to the unsaturated zone, with the cave passage terminating near the fault, indicating that the fault may also act as a barrier to lateral flow. Data limitations for this study include not having fracture density, bedding plane, or stratigraphic data to support the geospatial and statistical analyses.
5. Conclusions
Spatially explicit resource inventories allow for the interpretation of large-scale spatial patterns of cave features. The spatial analysis of cave morphologies, speleothems, and flow path features can reveal relationships between these and other geologic controls on unsaturated zone hydrology.
Variations in cave passage size relate to potential controls on water flow when identifying the sources of speleogenetic fluids and the structural features that may have transported them. Faults act as both flow path barriers and sources of speleogenetic fluids, with passages terminating against faults and passages developing along fault traces, respectively. These relationships, however, are complex, as demonstrated by the Grand Canyon caves, where the spatial patterns in flow paths can both increase and decrease with distance from faults.
Spatial patterns of secondary speleothems can be used to interpret unsaturated zone flow characteristics when considering the elemental chemistry and conditions necessary for the precipitation of different mineral types. Speleothem type distributions provide clear insight into these processes. Dripstone formations represent vadose waters percolating from the surface to the unsaturated zone of a cave. Gypsum flowers and other evaporite speleothems are derived from sulfate-rich waters, and their presence indicates insufficient modern flow to allow for dissolution. Calcite spar is formed below the water table and in pools of water. The spatial patterns of these and other mineral resources indicate whether caves were formed in the phreatic or vadose zone by either epigenic or hypogenic fluids and how these processes may have interacted or changed over time.
Passage morphologies and mineralogies reveal the properties of modern unsaturated zone flow through pre-existing preferential flow paths when combined with other geospatial geologic datasets. Spatial patterns of active water and dripstone formations are closely tied to the presence of faults in both systems. Infiltration to the unsaturated zone also preferentially occurs along vertical joints and geologic contacts with differing solubilities. Dome and pit structures indicate vertical flowpath development from the surface, whereas canyons represent horizontal development nearer to the base level.
The data integration methodologies described in this paper show that combining spatially explicit cave survey data with feature-specific cave resource inventory data holds implications for the geospatial analysis of epikarst and unsaturated zone flowpath development. Spatial patterns in passage morphology, speleogen development, and speleothem distribution can be used in conjunction with regional geologic and structural datasets to make observations about porosity development and flowpath evolution, as it relates to speleogenesis. Additionally, the use of spatially explicit resource data, coupled with cave survey data, holds promise to provide insight into many other avenues of questions in cave research.
Author Contributions
Conceptualization, S.M.H. and B.W.T.; methodology, S.M.H. and B.W.T.; statistical software, B.W.T.; geospatial software, S.M.H.; resources, S.M.H.; data curation, S.M.H.; writing—original draft preparation, S.M.H. and B.W.T.; writing—review and editing, S.M.H. and B.W.T.; visualization, S.M.H.; supervision, B.W.T.; project administration, B.W.T.; funding acquisition, B.W.T. All authors have read and agreed to the published version of the manuscript.
Funding
This research was funded by Grand Canyon National Park. This research was conducted under Cooperative Ecosystem Studies Units National Network Cooperative Agreement #P18AC01331 and Grand Canyon National Park Scientific Research and Collecting Permit #GRCA-2021-SCI-0014.
Data Availability Statement
The data used in this study can be found here: (
irma.nps.gov, accessed on 10 January 2022) and here: (
kgs.uky.edu/kgsweb/main.asp, accessed on 10 January 2022). Grand Canyon National Park data was accessed through our research permit.
Acknowledgments
The value of volunteer collected data is immense when considering cave survey and resource inventory data collection. Caves such as Double Bopper (with over 65 km of mapped passageways) required dedicated volunteers to spend countless hours collecting data over a span of several years. Their persistent efforts yield numerous research opportunities, which would not be available without these citizen scientists’ efforts. We would like to make a special acknowledgement to Jason Ballensky for his discovery of Double Bopper and his dedicated and commandeering efforts in its exploration.
Conflicts of Interest
The authors declare no conflict of interest.
References
- Green, R.T.; Painter, S.L.; Sun, A.; Worthington, S.R.H. Groundwater contamination in karst terranes. Water Air Soil Pollut. Focus 2006, 6, 157–170. [Google Scholar] [CrossRef]
- Price, M.; Low, R.G.; McCann, C. Mechanisms of water storage and flow in the unsaturated zone of the Chalk aquifer. J. Hydrol. 2000, 233, 54–71. [Google Scholar] [CrossRef]
- William, R.E. Protecting caves and cave life. In Encyclopedia of Caves, 2nd ed.; Elsevier: Amsterdam, The Netherlands, 2004; pp. 428–467. [Google Scholar]
- Qu, S.; Zhu, S.; Qhao, Q.; Pei, L. Analysis of seismic reflection characters for carbonate karst reservoir. Chin. J. Geophys. 2012, 55, 2053–2061. [Google Scholar]
- Lerch, R.N.; Groves, C.G.; Polk, J.S.; Miller, B.V.; Shelley, J. Atrazine transport through a soil-epikarst system. J. Environ. Qual. 2018, 47, 1205–1213. [Google Scholar] [CrossRef] [PubMed] [Green Version]
- Donovan, K.M.; Springer, A.E.; Tobin, B.W.; Parnell, R.A. Karst spring processes and groundwater storage implications in high-elevation, semi-arid Southwestern United States. In Threats to Springs in a Changing World: Science and Policies for Protection; Northern Arizona University, ProQuest Dissertations Publishing: Flagstaff, AZ, USA, 2021; in press. [Google Scholar]
- Tobin, B.W.; Springer, A.E.; Ballensky, J.; Armstrong, A. Cave and Karst of the Grand Canyon World Heritage Site. Z. Fur Geomorphol. 2021, 62, 125–144. [Google Scholar] [CrossRef]
- Hammerle, M.; Hofle, B.; Fuchs, J.; Schroder-Ritzaru, A.; Vollweiler, N.; Frank, N. Comparison of kinect and terrestrial lidar capturing natural karst cave 3-D objects. IEEE Geosci. Remote Sens. Lett. 2014, 11, 1896–1900. [Google Scholar] [CrossRef]
- Van Rentergem, G.; McFarlane, D.; Lundberg, J.; Buchroithner, M. Lessons learned from a large-scale 3-D mapping project, with Faro laser scanners, of the Gomantong Caves, Borneo. In Proceedings of the 17th International Congress of Speleology, Sydney, NSW, Austrailia, 23–29 July 2017. [Google Scholar]
- Schertler, N.; Buchroithner, M.; McFarlane, D.; Rentergem, G.V.; Lundberg, J.; Gumhold, S. Deterministically defining chambers in 3D-scans of caves. In Proceedings of the 17th International Congress of Speleology, Sydney, NSW, Austrailia, 23–29 July 2017. [Google Scholar]
- Bretz, H.J. Vadose and phreatic features of limestone caverns. J. Geol. 1942, 50, 675–811. [Google Scholar] [CrossRef]
- Watson, R.A. Underground solution canyons in the Central Kentucky karst, U.S.A. Int. J. Speleol. 1966, 2, 369–376. [Google Scholar] [CrossRef] [Green Version]
- Palmer, A.N. Cave Geology, 1st ed.; CAVE BOOKS: Dayton, OH, USA, 2007; pp. 88–113. [Google Scholar]
- Curl, R.L. Deducing flow velocities in cave conduits from scallops. NSS Bull. 1974, 36, 1–6. [Google Scholar]
- Bosch, R.F.; White, W.B. Studies of cave sediments. In Lithofacies and Transport of Clastic Sediments in Karstic Aquifers; Sasowsky, I.D., Mylroie, J., Eds.; Springer: Boston, MA, USA, 2018. [Google Scholar] [CrossRef]
- DuChene, H.R. Resource Inventory: A tool for cave science, management, and restoration. Natl. Speleol. Soc. Huntsville 2006, 19–32. [Google Scholar]
- Kovarik, J.; Kambesis, P. Cave resource inventories: Why are they important? In Proceedings of the 2005 National Cave and Karst Management Symposia, Albany, NY, USA, 31 October–4 November 2005; Volume 270, pp. 745–5201. [Google Scholar]
- Huntoon, P.W. Groundwater Basins of the Kaibab Plateau, Arizona. Water Resour. Res. 1974, 10, 579–590. [Google Scholar] [CrossRef]
- Kent, W.N.; Rawson, R. Depositioal environments of the Missippian Limestone in northeastern Arizona. In Paleozoic Paleogeography of West-Central United States; Rocky Mountain Section, Society of Economic Paleontologists and Mineralogists: Denver, CO, USA, 1980; pp. 101–109. [Google Scholar]
- White, B.W. Surveying Caves. In Encyclopedia of Caves, 3rd ed.; White, W.B., Culver, D.C., Pipan, T., Eds.; Academic Press: San Diego, CA, USA, 2019; pp. 1063–1070. [Google Scholar]
- Burnham, K.P.; Anderson, D.R. Multimodel Inference: Understanding AIC and BIC in model selection. Sociol. Methods Res. 2004, 33, 261–304. [Google Scholar] [CrossRef]
- Crossey, L.J.; Karlstrom, K.E.; Springer, A.E.; Newell, D.; Hilton, D.R.; Fischer, T. Degassing of mantle-derived CO2 and He from springs in the southern Colorado Plateau region—Neotectonic connections and implications for groundwater systems. Geol. Soc. Am. Bull. 2009, 121, 1034–1053. [Google Scholar] [CrossRef]
- Palmer, A. Distinction between epigenic and hypogenic caves. Geomorphology 2011, 134, 9–22. [Google Scholar] [CrossRef]
- Klimchouk, A.; Sasowsky, I.; Engel, S.A. Hypogene Cave Morphologies. In Selected Papers and Abstracts of the Symposium Held February 2 through 7, 2014 San Salvador Island, Bahamas; Karst Waters Institute Special Publication 18; Karst Waters Institute: Leesburg, VA, USA, 2014. [Google Scholar]
- Kilimchouk, A. Hypogenic Speleogenesis. In Encyclopedia of Caves; Ukrainian Institute of Speleology and Karstology: Simferopol, Russia, 2012. [Google Scholar] [CrossRef]
- White, W.B.; Deike, G.H. Hydraulic geometry of cave passages. In Karst Hydrology; Springer: Boston, MA, USA, 1989; pp. 223–258. [Google Scholar]
- Young-Seog, K.; Sanderson, D.J. Inferred fluid flow through fault damage zones based on the observation of stalactites in carbonate caves. J. Struct. Geol. 2010, 32, 1305–1316. [Google Scholar] [CrossRef]
- National Research Council. Conceptual Models of Flow and Transport in the Fractured Vadose Zone; National Academies Press: Washington, DC, USA, 2001. [Google Scholar]
- White, B.W. Speleothems. In Encyclopedia of Caves, 3rd ed.; White, W.B., Culver, D.C., Pipan, T., Eds.; Academic Press: San Diego, CA, USA, 2019; pp. 1006–1017. [Google Scholar]
- Sigda, J.M.; Wilson, J.L. Are faults preferential flow paths through semiarid and arid vadose zones? Water Resour. Res. 2003, 39, 1–14. [Google Scholar] [CrossRef]
- Klimchouk, A.; Ford, D.C. Lithologic and structural controls of dissolutional cave development. In Speleogenesis: Evolution of Karst Aquifers; National Speleological Society: Huntsville, AL, USA, 2000; pp. 54–64. [Google Scholar]
- Mandl, G. Rock Joints; Springer: Berlin/Heidelberg, Germany, 2005. [Google Scholar]
Figure 1.
Study site locations in the context of the North American continent. Bopper cave system is located in Arizona and California Cave is located in Kentucky.
Figure 1.
Study site locations in the context of the North American continent. Bopper cave system is located in Arizona and California Cave is located in Kentucky.
Figure 2.
The Bopper cave system of Arizona. Ct = Cambrian Tapeats Sandstone, Cba = Cambrian Bright Angel Shale, Cm = Cambrian Muav Limestone, Dtb = Devonian Temple Butte Limestone, Mr = Mississippian Redwall Limestone, Ps = Permian Supai Formation (undivided), Ph = Permian Hermit Shale, Pt = Permian Toroweap Formation, and Pk = Permian Kaibab Limestone. Cave entrance locations and cardinal directions are obscured in figures in accordance with the National Park Service and Federal Cave Resource Protection Act of 1988.a.
Figure 3.
California Cave, Kentucky. Mg = Mississippian Grundy Formation, Ms = Mississippian Slade Formation, PB = Pennsylvanian Borden Formation. Cave entrance locations are obscured in figures in accordance with the National Park Service and Federal Cave Resource Protection Act of 1988.
Figure 3.
California Cave, Kentucky. Mg = Mississippian Grundy Formation, Ms = Mississippian Slade Formation, PB = Pennsylvanian Borden Formation. Cave entrance locations are obscured in figures in accordance with the National Park Service and Federal Cave Resource Protection Act of 1988.
Figure 4.
Conceptual Double Bopper speleogenetic model. Aggressive hypogene fluids were sourced from either the Halogen or Leandras faults, losing aggression and migrating towards the Double Bopper fault. Epigene fluid contributions migrate down the Double Bopper fault towards the unsaturated zone, leaving the possibility that waters of mixed chemistries may have been present during speleogenesis.
Figure 5.
Spatial distributions of sulfur- and calcite-based speleothems in Double Bopper cave. Dripstone formations, including stalactites, stalagmites, and moon milk, are formed from vadose waters and are primarily found along the fault-controlled margins of the cave, but also near entrances and in statistically larger passages. Gypsum flowers formed from sulfate-rich waters and were found in most of the cave and in statistically smaller passages.
Table 1.
Linear regression models assessed using Akaike Information Criterion (AICc). R2 is the amount of variance explained by the regression, the F value is the ratio of explained variance to unexplained variance, df are the degrees of freedom, i.e., the maximum number of independent values that have freedom to vary, and p values indicate whether the difference between means are significant. AICc are relative measures of model fit, the delta value measures relative differences in candidate models, and the AICc weights can be used in model averaging and represent the relative likelihood of a model. LF = Leandras Fault, HF = Halogen Fault, and DBF = Double Bopper Fault.
| Model | R2 | F | df | p | AICc | Delta | AICc Weights |
|---|
| Distance from LF | 0.04 | 197.6 | 4347 | <2 × 10⁻¹⁶ | 8461.2 | 173.17 | 0.00 |
| Distance from HF | 0.08 | 379.3 | 4347 | <2 × 10⁻¹⁶ | 8290.7 | 2.69 | 0.15 |
| Distance from DBF | 0.02 | 88.42 | 4347 | <2 × 10⁻¹⁶ | 8567.0 | 278.97 | 0.00 |
| Distance from LF + distance from HF + distance from DBF | 0.08 | 128.8 | 4345 | <2 × 10⁻¹⁶ | 8288.0 | 0.00 | 0.57 |
| Distance from LF + distance from HF | 0.08 | 190 | 4346 | <2 × 10⁻¹⁶ | 8291.9 | 3.93 | 0.08 |
| Distance from LF + DBF | 0.07 | 152 | 4346 | <2 × 10⁻¹⁶ | 8362.5 | 74.47 | 0.00 |
| Distance from HF + distance from DBF | 0.08 | 191.1 | 4346 | <2 × 10⁻¹⁶ | 8290.0 | 2.00 | 0.21 |
Table 2.
Regression coefficients indicate whether there is a positive or negative correlation between passage area and distance away from each of the faults. The standard error is an estimate of the standard deviation of the coefficient.
Table 2.
Regression coefficients indicate whether there is a positive or negative correlation between passage area and distance away from each of the faults. The standard error is an estimate of the standard deviation of the coefficient.
| Fault | Regression Coefficient | Standard Error |
|---|
| Double Bopper | 3.0 × 10⁻² | 1.2 × 10⁻² |
| Leandras | −3.1 × 10⁻² | 1.5 × 10⁻² |
| Halogen | −1.5 × 10⁻² | 1.7 × 10⁻² |
Table 3.
Pairwise comparisons tests using Tukey Honest Significant Difference test with 95% family wise confidence levels to indicate the relationship between passage size and present mineral resources.
Table 3.
Pairwise comparisons tests using Tukey Honest Significant Difference test with 95% family wise confidence levels to indicate the relationship between passage size and present mineral resources.
| Resource | F | p | Passage Classification |
|---|
| Stalactite | F1,3910 = 15.82 | <0.01 | Bigger |
| Stalagmite | F1,3910 = 12.18 | 0.00 | Bigger |
| Flowstone | F1,3910 = 0.04 | 0.84 | |
| Moon Milk | F1,3910 = 1.94 | 0.16 | Bigger |
| Dogtooth Spar | F1,3910 = 17.91 | <0.01 | Bigger |
| Iron Crust | F1,3910 = 53.66 | <0.01 | Smaller |
| Red Corrosion Residue | F1,3910 = 62.15 | <0.01 | Smaller |
| Gypsum Flower | F1,3910 = 126.33 | <0.01 | Smaller |
| Gypsum Needle | F1,3910 = 36.36 | <0.01 | Smaller |
| Publisher’s Note: MDPI stays neutral with regard to jurisdictional claims in published maps and institutional affiliations. |
© 2022 by the authors. Licensee MDPI, Basel, Switzerland. This article is an open access article distributed under the terms and conditions of the Creative Commons Attribution (CC BY) license (https://creativecommons.org/licenses/by/4.0/).


