
An Early-Warning System to Validate the Soil Profile during TBM Tunnelling


Department of Civil Engineering and Architecture, University of Catania, 95124 Catania, Italy
*
Author to whom correspondence should be addressed.
Geosciences 2022, 12(3), 113; https://0-doi-org.brum.beds.ac.uk/10.3390/geosciences12030113
Submission received: 15 October 2021
/
Revised: 15 February 2022
/
Accepted: 22 February 2022
/
Published: 2 March 2022
Abstract
:Identification of soil condition at the working face of a tunnel boring machine (TBM) is a key factor for the efficiency and safety of TBM tunneling. The paper presents the first application of the Horizontal-to-Vertical Spectral Ratio (HVSR) method on microtremors induced by a TBM during tunnelling. The innovative application is based on the development of an easy-to-use and economical early-warning system, which aims to confirm, or otherwise, the soil profile established in the design phase of tunnels by comparing the soil natural frequencies obtained from the soil profile carried out during the design phase and the soil natural frequencies coming from the HVSR analysis of the microtremors induced by the TBM during tunnelling. Just one or two geophones are necessary to use the proposed procedure. It can be applied to an area up to about 20 m ahead of the TBM excavation front and constitutes a powerful early warning system. Due to the great heterogeneity of the subsoil, dual-mode TBMs are often used, frequently changing from Open-Face (OF) mode for rock formations to Earth Pressure Balance (EPB) mode for cohesive and incoherent soil. Any “additional” information on the soil, which will be dug in the next days or hours is extremely useful for subsoil with great heterogeneity. The new procedure offers a reasonable time interval in which to modify the excavation method. This, in turn, can avoid damage to the TBM and existing structures and infrastructures. It allows us also to have a valuable geotechnical database for future works on the infrastructural networks. The proposed procedure has been successfully applied during the construction of the new underground lines in Catania (Italy).
1. Introduction
The need to maintain high levels of efficiency and environmental sustainability induces researchers to look at new solutions, leading to a lowering of the environmental pollution generated by road traffic, thus improving the quality of life and reducing costs for citizens. To meet these goals, underground lines in urban areas are developing more and more. Tunnels are very often dug using a Dual Mode TBM (tunnel boring machine), which can dig in two ways: in Open Face (OF) mode for the lava rock formations; in Earth Pressure Balance (EPB) mode for cohesive and incoherent soil. In OF mode the TBM excavates rock using disc cutters mounted in the cutter head. In EPB mode the TBM balances the soil/water pressure at the tunnel face. The pressure is maintained in the cutter head by controlling the rate of spoil extraction through the Archimedes screw and the advance rate. Additives such as bentonite, polymers, and foam are injected ahead of the face to increase soil stability.
Geological and geotechnical information about rocks and soils at the digging front is fundamental, firstly to define the appropriate digging mode and, consequently, to choose the correct front pressure to guarantee stability at the digging front [1,2,3,4]. An error in estimating the front pressure can cause subsidence or uplift problems with disastrous effects in urban areas [5,6,7,8,9,10,11].
Only a few numbers of researchers [12,13,14,15] have proposed approaches to solve the problem of the uncertainty of geological formations to be dug. The traditional ground prediction methods used in tunneling are drilling exploration at the ground surface and the horizontal probe drilling method in the shield machine. More recently geophysical exploration techniques have emerged. The latter have advantages of continuity and reduced impact on the normal working process and are electromagnetic- [16], soundwave- [17], and seismology-based methods [18,19]. In particular, Dickmann [13] shows a TSP (Tunnel Seismic Prediction) approach while excavating, allowing a continuous prediction of geological uncertainties ahead or around a tunnel. By this, a prediction range of more than 100 m ahead of the face is reachable. This approach is based on the reflection method observing and evaluating elastic body waves: these waves are excited by artificial sources such as detonation charges; they are reflected at interfaces with different mechanical properties such as density or seismic-wave-velocity. It is possible to deduct information about the mechanical properties of the ground from the travel times of reflected waves. In this way, important engineering parameters such as elastic moduli can be predicted. Dickmann [13] also describes a case study from a road tunnel project. Before the signal reading, 24 shots holes had been drilled along the tunnel wall side with 1.5 m spacing, and four seismic receivers had been installed in 2 m deep boreholes about 50 and 55 m apart from the tunnel face. Small explosive charges were used as seismic source. This method is very useful for a good prediction of geological formations during tunnelling. Still, it is costly because it requires drilling several holes for seismic exploration.
The procedure proposed in this paper does not require any additional cost, using the vibration induced by the TBM as the dynamic source and two geophones for recording the microtremors due to TBM digging. The authors suggest using the geophones prescribed by the DIN 4150-3 [20] for monitoring the safety of the buildings and infrastructures during TBM digging. The prescribed geophones were placed at the soil surface next to the buildings and infrastructures. So, they were exploited “for free” to give useful information about the geological formations during tunnelling. In the last 30 years several researchers have proposed investigating the nature of the ground crossed during tunnel digging by analyzing TBM-induced microtremors [21,22,23,24,25,26,27,28]. Zhang et al. [29] established a dynamic model for a TBM revolving system, considering the time-dependent mesh stiffness in a MFC. Sun et al. [30] and Huo et al. [31,32] set multiple dynamic models for a TBM cutter head system in hard rocks considering the external stochastic excitations, time-varying meshing stiffness, transmission errors, and so forth. Liu et al. [33] developed a movable microseismic monitoring system to characterize the rockburst type. Bilgin and Acun [34] studied the effect of ground transition zones on EPB-TBM performance in complex geology. Huanga et al. [35] developed a real-time monitoring system for the interaction between the TBM and surrounding rocks, proving that the vibration of the TBM head is related to the rock properties. Recently Liu et al. [36] conducted a very valuable field monitoring programme wherein a EPB-TBM was fitted with one triaxial accelerometer and three one-axial accelerometers.
This paper presents the first application of the well-known Horizontal-to-Vertical Spectral Ratio (HVSR) method [37,38] on microtremors induced by TBM during tunnelling. The innovative application is based on developing an easy-to-use and economic procedure, which aims to confirm, or otherwise, the soil profile established in the design phase of the tunnel by comparing the soil natural frequencies () obtained from soil profile established in the design phase with the soil natural frequencies obtained using the HVSR approach on the microtremors induced by the TBM. The HVSR method has been widely used to establish the soil profile in the design phase of structures and infrastructures [39,40,41,42,43]. On the contrary, in this paper, the HVSR method has been used for the first time concerning the microtremors produced by the TBM to develop an easy-to-use, economical procedure for advanced prediction of the soil profile for an area about 20 m ahead of the TBM digging front.
As reported in the SESAME (Site EffectS assessment using AMbient Excitations) Project [44,45,46] the H/V technique has been frequently adopted in seismic microzonation investigations due to its low-cost both for the survey and the analysis. The H/V technique alone is not sufficient to characterize the complexity of site effects, but it has proven to be useful to estimate the fundamental period of soil deposits, even if measurements and analyses should be performed with caution. The main recommended application of the H/V technique in microzonation studies is to map the fundamental period of the site and help constrain the geological and geotechnical models used for numerical computations. Despite its limitations, many papers show that the H/V technique is most effective in estimating the natural frequency of soft soil sites when there is a large impedance contrast with the underlying bedrock while the effectiveness for other purposes, such as the quantitative estimation of amplification phenomena, is not worldwide recognized [47,48,49,50,51,52].
The soil profile of the area involved in the tunneling process and the main soil properties of all the geological formations in this area are very often defined only in the design phase through in-situ and laboratory tests. Very often, no advanced prediction procedures are used for the large area ahead of the TBM excavation front during the tunneling. An analysis of the spoil gives valuable information on the nature of the soil. When the TBM works in earth-pressure balance mode, the measurement of the earth-pressure at the TBM cutting face is also valuable information for evaluating the nature of the soil. Unfortunately, both the spoil and the earth pressure at the TBM excavation front refer only to the soil at that point.
The procedure proposed in this paper regards a large area of soil ahead of the cutting face; thus, it constitutes a valuable early warning system, in contrast with the weak early warning system provided by the analysis of the TBM spoil and the earth-pressure at the TBM excavation front. The information provided by the TBM spoil and the earth-pressure at the TBM excavation front does not furnish a large enough time interval to modify the excavation methods, leading frequently to damage to the TBM and surrounding structures and infrastructures.
In the procedure that has been developed, the first natural frequency of the soil deposit computed by applying the well-known theoretical linear approach for ground response analysis [53,54] is constantly compared with that deriving from the HVSR method used to TBM microtremors. An agreement between the theoretically evaluated frequency (fn) and the experimentally evaluated frequency (fn*) confirms the previously defined soil profile; a disagreement between the frequencies suggests a disagreement between the profile defined in the previous design phase and the actual soil profile that the TBM will encounter next 20 m. Such disagreement sounds similar to an alarm and suggests taking a particular care in the choice of the digging mode and estimating the earth-pressure at the TBM front. Additional investigations could sometimes be required to evaluate the two critical parameters h (bedrock depth) and Vs (shear wave velocity), from which the fundamental frequency of the soil deposit depends, as will be discussed in Section 4. The TBM-induced microtremors differed significantly in magnitude and frequency content and the proposed procedure aims to exploit these differences to activate an early warning system to confirm the soil profile established in the design phase (if fn ≈ fn*) or to stress that probably the type of ground crossed by the TBM-induced microtremors is not that supposed in the design phase (if fn ≠ fn*). The magnitude and frequency content of TBM-induced vibrations are strictly related to the ground types through which the vibrations pass. This procedure is proposed, and should be considered, only as an early warning system. To know exactly the different ground types, we need additional in-situ and laboratory tests. However, the aim of the paper is not to understand exactly the ground types crossed during tunnel digging, but to develop an early-warning system to confirm, or not, the soil profile established in the design phase.
During the recording of TBM microtremors, the data collected give also a valuable geotechnical database for possible future works on the infrastructural networks.
The proposed procedure has been successfully applied during the construction of the new underground lines in Catania (Italy). Due to the great heterogeneity of the subsoil, the dual-mode TBM frequently switches from the OF mode to the EPB mode. This great heterogeneity is due to different lava flows from volcanic eruptions on Mount Etna near Catania [55,56,57,58,59,60,61]. For this kind of subsoil, any “additional” information on the soil profile is extremely useful. Data from an electric tomography and the TBM spoil confirmed the validity of the procedure proposed.
2. The New Railway Network
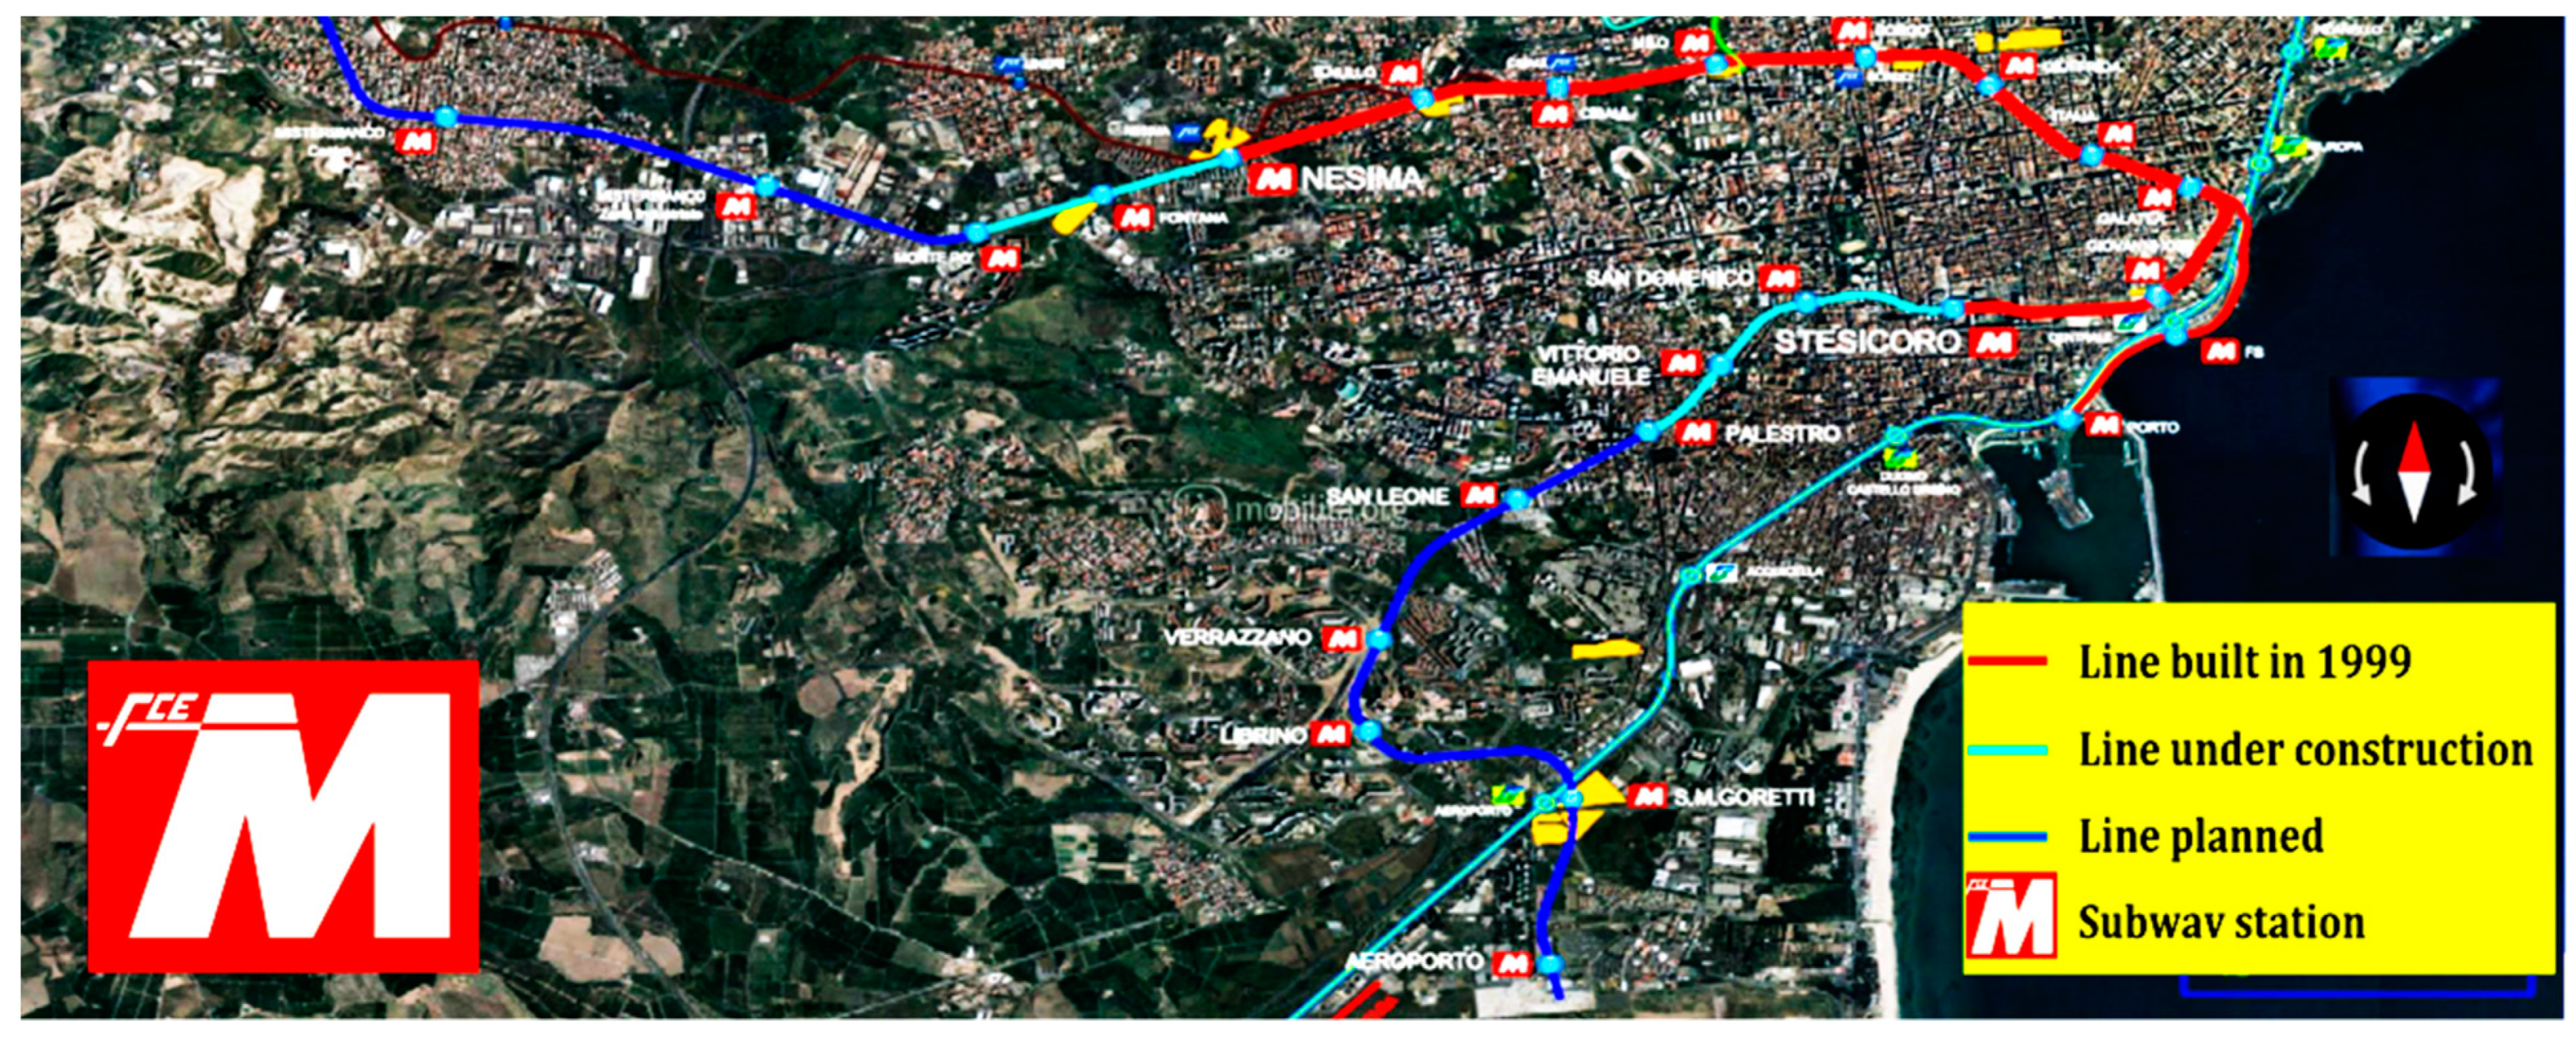
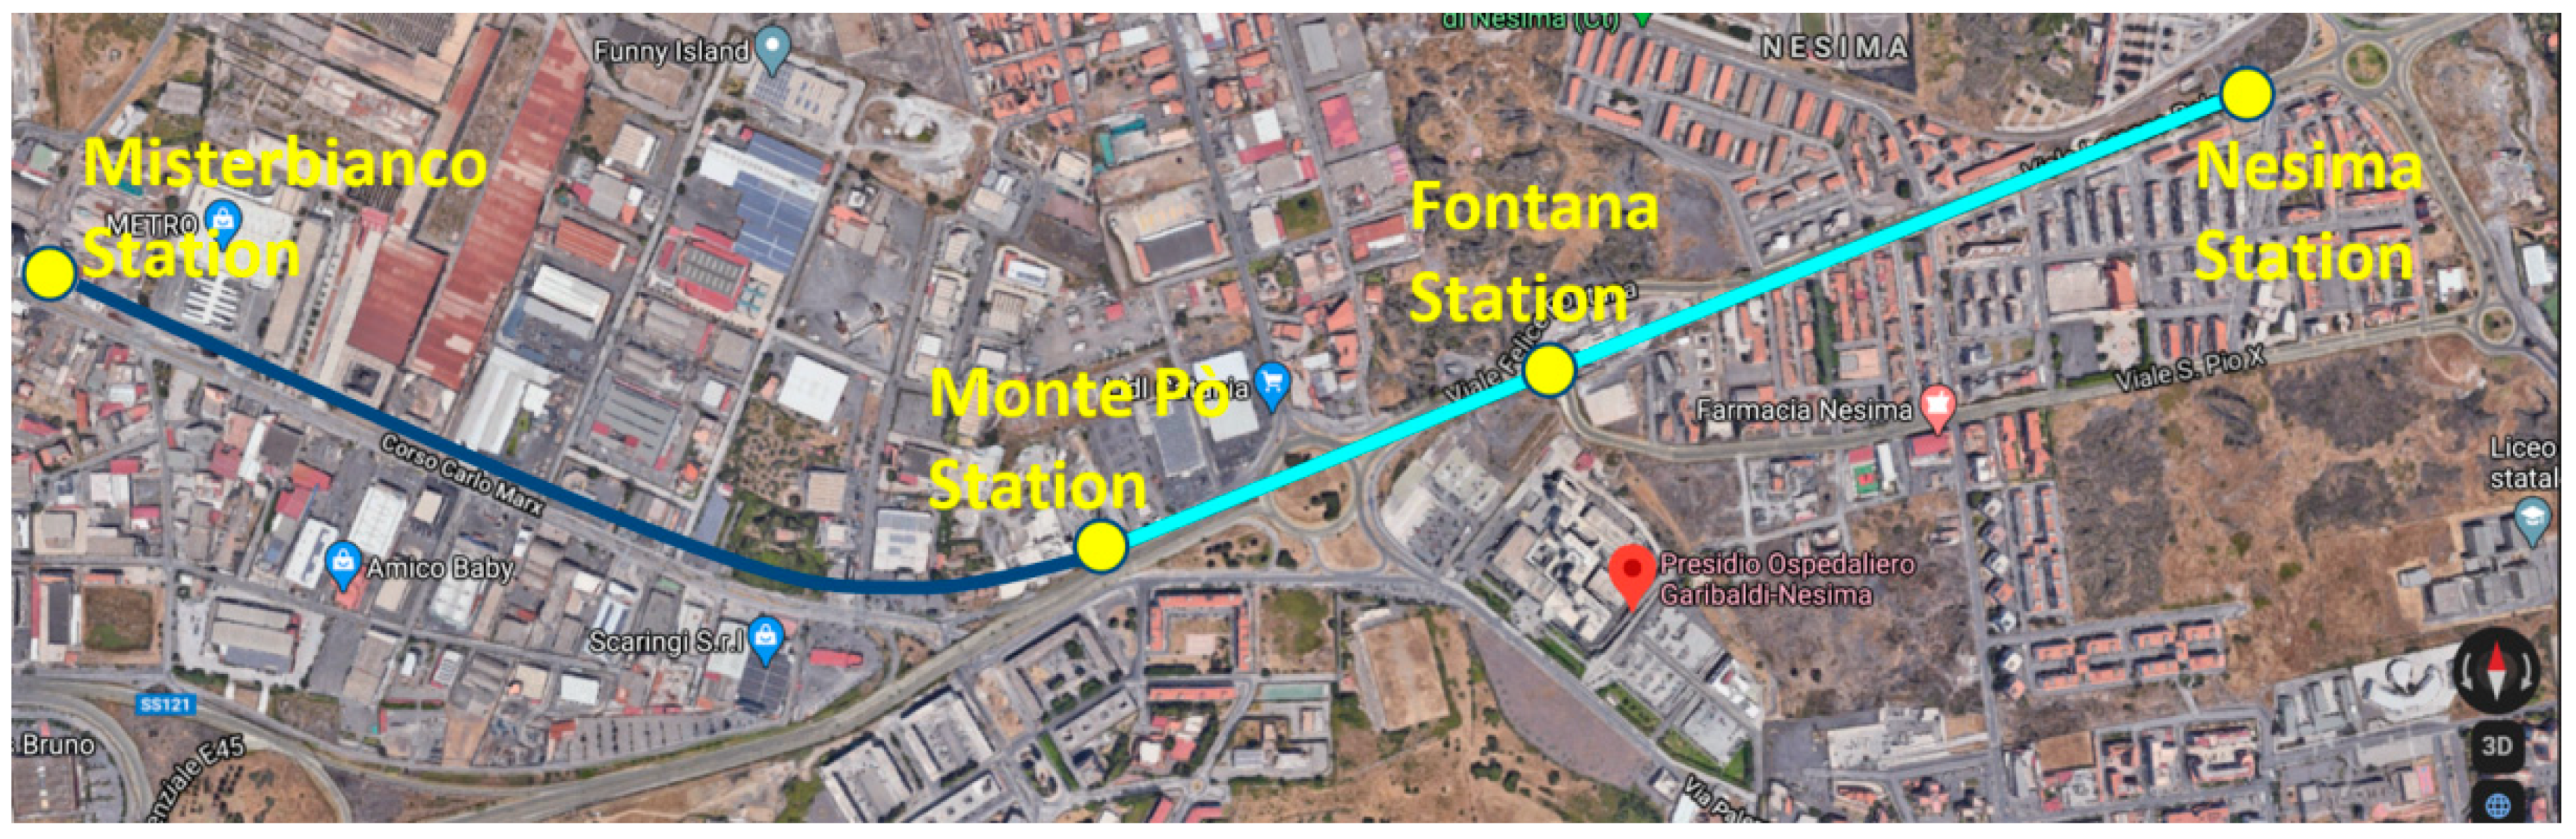
The design of the new railway network in Catania is part of a program to upgrade the current narrow-gauge single-track line. Two different railway lines (currently in operation) were built in 1999: an underground double-track railway in the center of the city (1.8 km long), and a surface single-track line (2.0 km long) in the suburbs. The aim is to extend the existing railway line, at present confined exclusively to the urban area of Catania, towards the sub-metropolitan area of Misterbianco and Paternò to the north-west, and towards the “Vincenzo Bellini” airport to the south-east [62,63,64,65]. Figure 1 shows the whole of the designed network. The present paper regards the line between the stations of Nesima and Misterbianco, at present under construction (Figure 1; Figure 2).
The Nesima-Misterbianco railway line is 3940 m long. The underground segment covers a length of 1748 m. Due to the strong heterogeneity of the geological profile in this area, digging has proceeded in both OF and EPB modes, with frequent switching from one to the other.
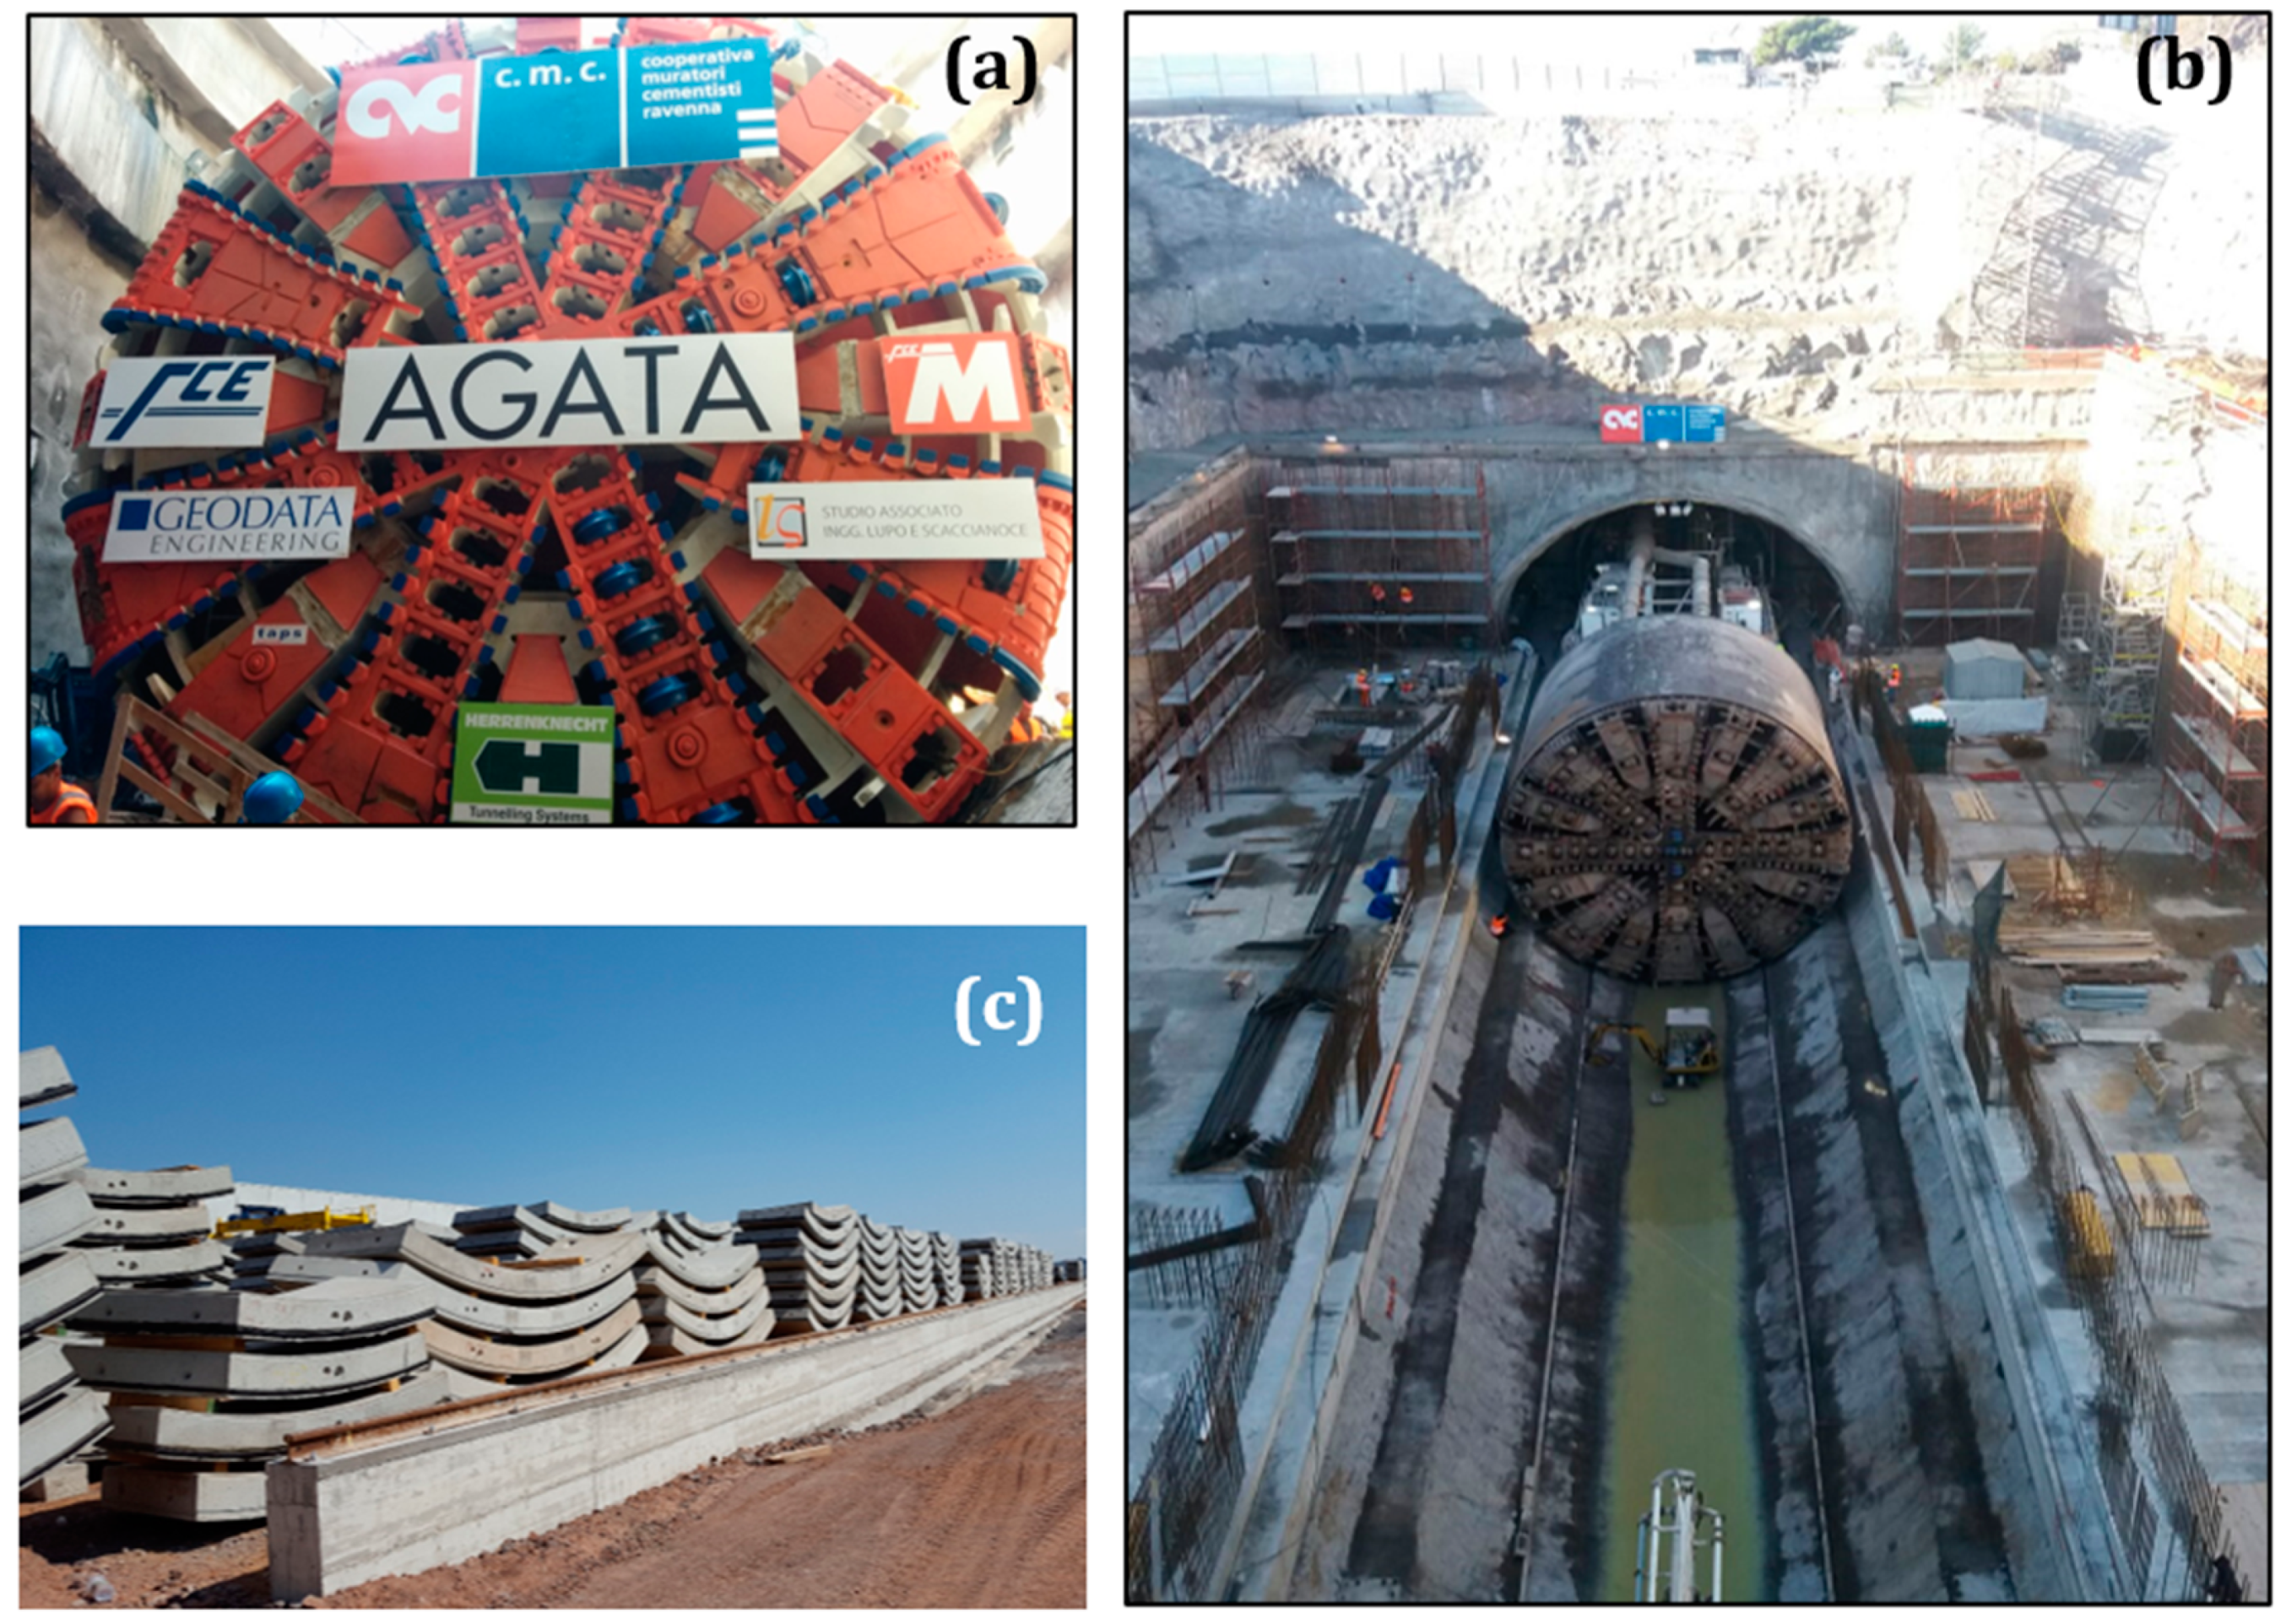
The main technical characteristics of the TBM (Herrenknecht S454.1) are: digging diameter = 10.65 m; shield length ≈ 9.35 m; shield thickness = 0.07 m; excavation chamber length = 1.00 m; total force of jacks = 100,370 KN; maximum torque = 26,026 KNm; head rotation speed = 0–3 rpm; tunneling speed = 10 m/day for rocks −20 m/day for soft soils. The pressure applied by the TBM to the excavation face varies according to the soil horizontal stress σh0. TBM also has 6 back-up wagons covering a length of about 100 m. The average digging depth is equal to about 25.00 m (Figure 3). The final tunnel lining consists of a precast reinforced concrete ring 0.32 m thick and 1.50 m deep. Each ring consists of 7 segments installed by an erector inside the TBM. The outside ring has a diameter of 10.24 m.
3. Geological and Geotechnical Characterization of the Investigated Segment
As will be discussed in Section 4, the advanced prediction procedure that has been developed is based on a comparison between the natural frequency of the surface layers evaluated using the HVSR method and the natural frequency of the surface layers computed considering the soil profile established in the tunnel design phase, through the well-known theoretical expression (1) shown in the following.
Two different geotechnical investigations were performed to define the soil profile and the geotechnical parameters of the soils and rocks in the design phase of the Nesima-Misterbianco segment: the first in 2004 during the preliminary design phase (see the 3 boreholes S2, S3 and S4 drawn in green in Figure 4); the second in 2015 for the executive design phase (see the 15 boreholes Si1, Si2, Si3, Si4, Si4bis, Si5, Si6, Si7, Si8, Si9, Si9bis, Si10, Si11, Si12, Si13, drawn in red in Figure 4). Furthermore, the investigations carried out in 1996 for the construction of a parking area around the Monte Pò station (see the 5 boreholes S1, S2, S3, S4, S5 drawn in black in Figure 4) and those performed in 2000 as part of the “The Catania Project” [66] (see the 3 boreholes S140, S1068, S1242 drawn in violet in Figure 4) were also considered.
Generally, an anthropic layer is found in the most superficial portion; then, lava rock layers are observed at greater depths. The geological formations directly involved in the digging process are: Volcanoclastic breccia and sand dating from 1669 from Si1 to Si8; Lava of Quartalaro from Si8 to Si10; Volcanoclastic breccia dating from 1669 from Si10 to shortly beyond Si11; finally, Lava of Quartalaro up to Si13.
The following in-situ tests were also performed in 2015 (inside several boreholes shown in Figure 4): 2 Dilatometric Tests; 15 Standard Penetration Tests; 7 Permeability Lefranc Tests; 6 absorption Lugeon Tests; 2 Dac-Tests and 6 Pocket Penetrometer Tests. Furthermore, 15 Open Piezometer Tests were performed to evaluate the depth of the groundwater. Also, Down-Hole, MASW, SPT tests and traditional Horizontal-to-Vertical Spectral Ratio (HVSR) tests were performed to define the shear wave velocity VS. Catania is characterized by a medium-high seismic hazard, so many researchers have focused their activity on detecting the shear wave velocities of the different geological formations [55,66,67,68,69,70]. Many samples were collected during the survey, and the undisturbed samples were subjected to the following laboratory tests: (a) classification tests; (b) tests to determine the resistance and deformability characteristics of the soil: oedometric tests, direct shear tests, triaxial tests; (c) tests to determine the resistance and deformability characteristics of the rock: uniaxial compression tests, point load tests, triaxial compression strength tests, indirect tensile strength tests and measurement of sonic waves. Table 1 shows all the geotechnical parameters obtained for each geological formation reported in Figure 4, being: γ the unit weight; φ′ the angle of shear strength and c′ the cohesion obtained by the direct shear test; cu the undrained cohesion obtained by the U-U triaxial tests and by the SPT and PPT tests; E0 the Young modulus at very small strains obtained by the VS values; Eu the undrained modulus of elasticity obtained by the U-U triaxial tests; k the coefficient of permeability obtained by the LE and LU tests and by the oedometric tests.
4. A Simple Procedure to Refine the Soil Profile
As mentioned earlier, it is fundamental to have as much knowledge of the soil profile as possible to choose the appropriate TBM digging method (OF mode or EPB mode) to guarantee safety during tunnelling.
According to the DIN4150-3 Technical Regulation [20], microtremors induced by a TBM must be continuously measured to guarantee the safety of the structures/infrastructures above or adjacent to the tunnel excavation front. The authors propose using these mandatory measurements also to confirm or refine the soil profile established in the design phase, using the HVSR method.
HVSR technique, known as Nakamura’s technique [37,38], is used for determining HVSR peak frequencies or periods and HVSR peak amplitude values (amplification) based on recording the ambient noise and microtremors. Microtremors are chiefly caused by artificial disturbances such as traffic, industrial machines and so on. The study concerning microtremors was started soon after seismology had been established as a branch of science [71]. From the mid-1900s, thanks to systematic measurements of microtremors, it was found that the properties of the ground as inferred from the characteristics of these microtremors can be used to determine the seismic factor related to earthquake-proof construction designs [72,73]. The HVSR technique for microtremor studies has gained much popularity over the past years [37,74,75,76].
Soil surface layers are typically exposed to tremors by natural forces (storm, sea waves, etc.…) and artificial forces (plant, cars, train, etc.). Sea waves induce tremors of a relatively long period (2–3 s or more), the so-called microseisms; while storms and artificial forces generate tremors of a short period, the so-called microtremors, which have a frequency range of 0.5–20 Hz.
The HVSR method assumes that the ratio of the horizontal (H) and vertical (V) Fourier spectra of surface microtremors is an approximate transfer function for the horizontal motion of surface layers. The validity of this assumption was proved by Nakamura [38,39,40,41] and many other researchers [39,77,78,79,80,81,82].
Microtremors can be measured using geophones instrumented by electrodynamic velocimeters, two of which are horizontally oriented, and one is vertically oriented. In the H/V vs. f diagram (being f the frequency), a peak indicates the amplification value of the horizontal components of the soil motion for the vertical component relative to the natural frequency of the surface layers, fn*. Thus, this non-invasive, rapid, low-cost procedure allows fn* to be estimated easily for the soil surface layers.
In the present paper, in line with the HVSR method, the H/V vs. f diagram deriving from the microtremors caused by the TBM was drawn up day by day. So, it was used to estimate the daily fn* for the Nesima-Misterbianco segment. Thus, the daily value of fn* was compared with the value of the natural frequency fn obtained by the well-known theoretical expression [53,54]:
being VS and h, respectively, the shear wave velocity and the height of the deformable geological formations over the bedrock, estimated in the design phase. Both VS and h are “critical” parameters in the evaluation of fn.
Two different conditions are possible (Figure 5): (i) fn* ≈ fn, i.e., (fn* − fn)/fn* ≤ 10%, (which corresponds in the case history under investigation to a tolerance of ±0.5 Hz), so the soil profile established during the design phase can be confirmed; (ii) fn* ≠ fn, i.e., (fn* − fn)/fn* > 10%, so the soil profile established during the design phase cannot be confirmed and it will be necessary to carry out further geotechnical surveys to establish the “real” profile. According to Equation (1), if (fn* − fn)/fn* > 10% the initially estimated VS and/or h should be wrong.
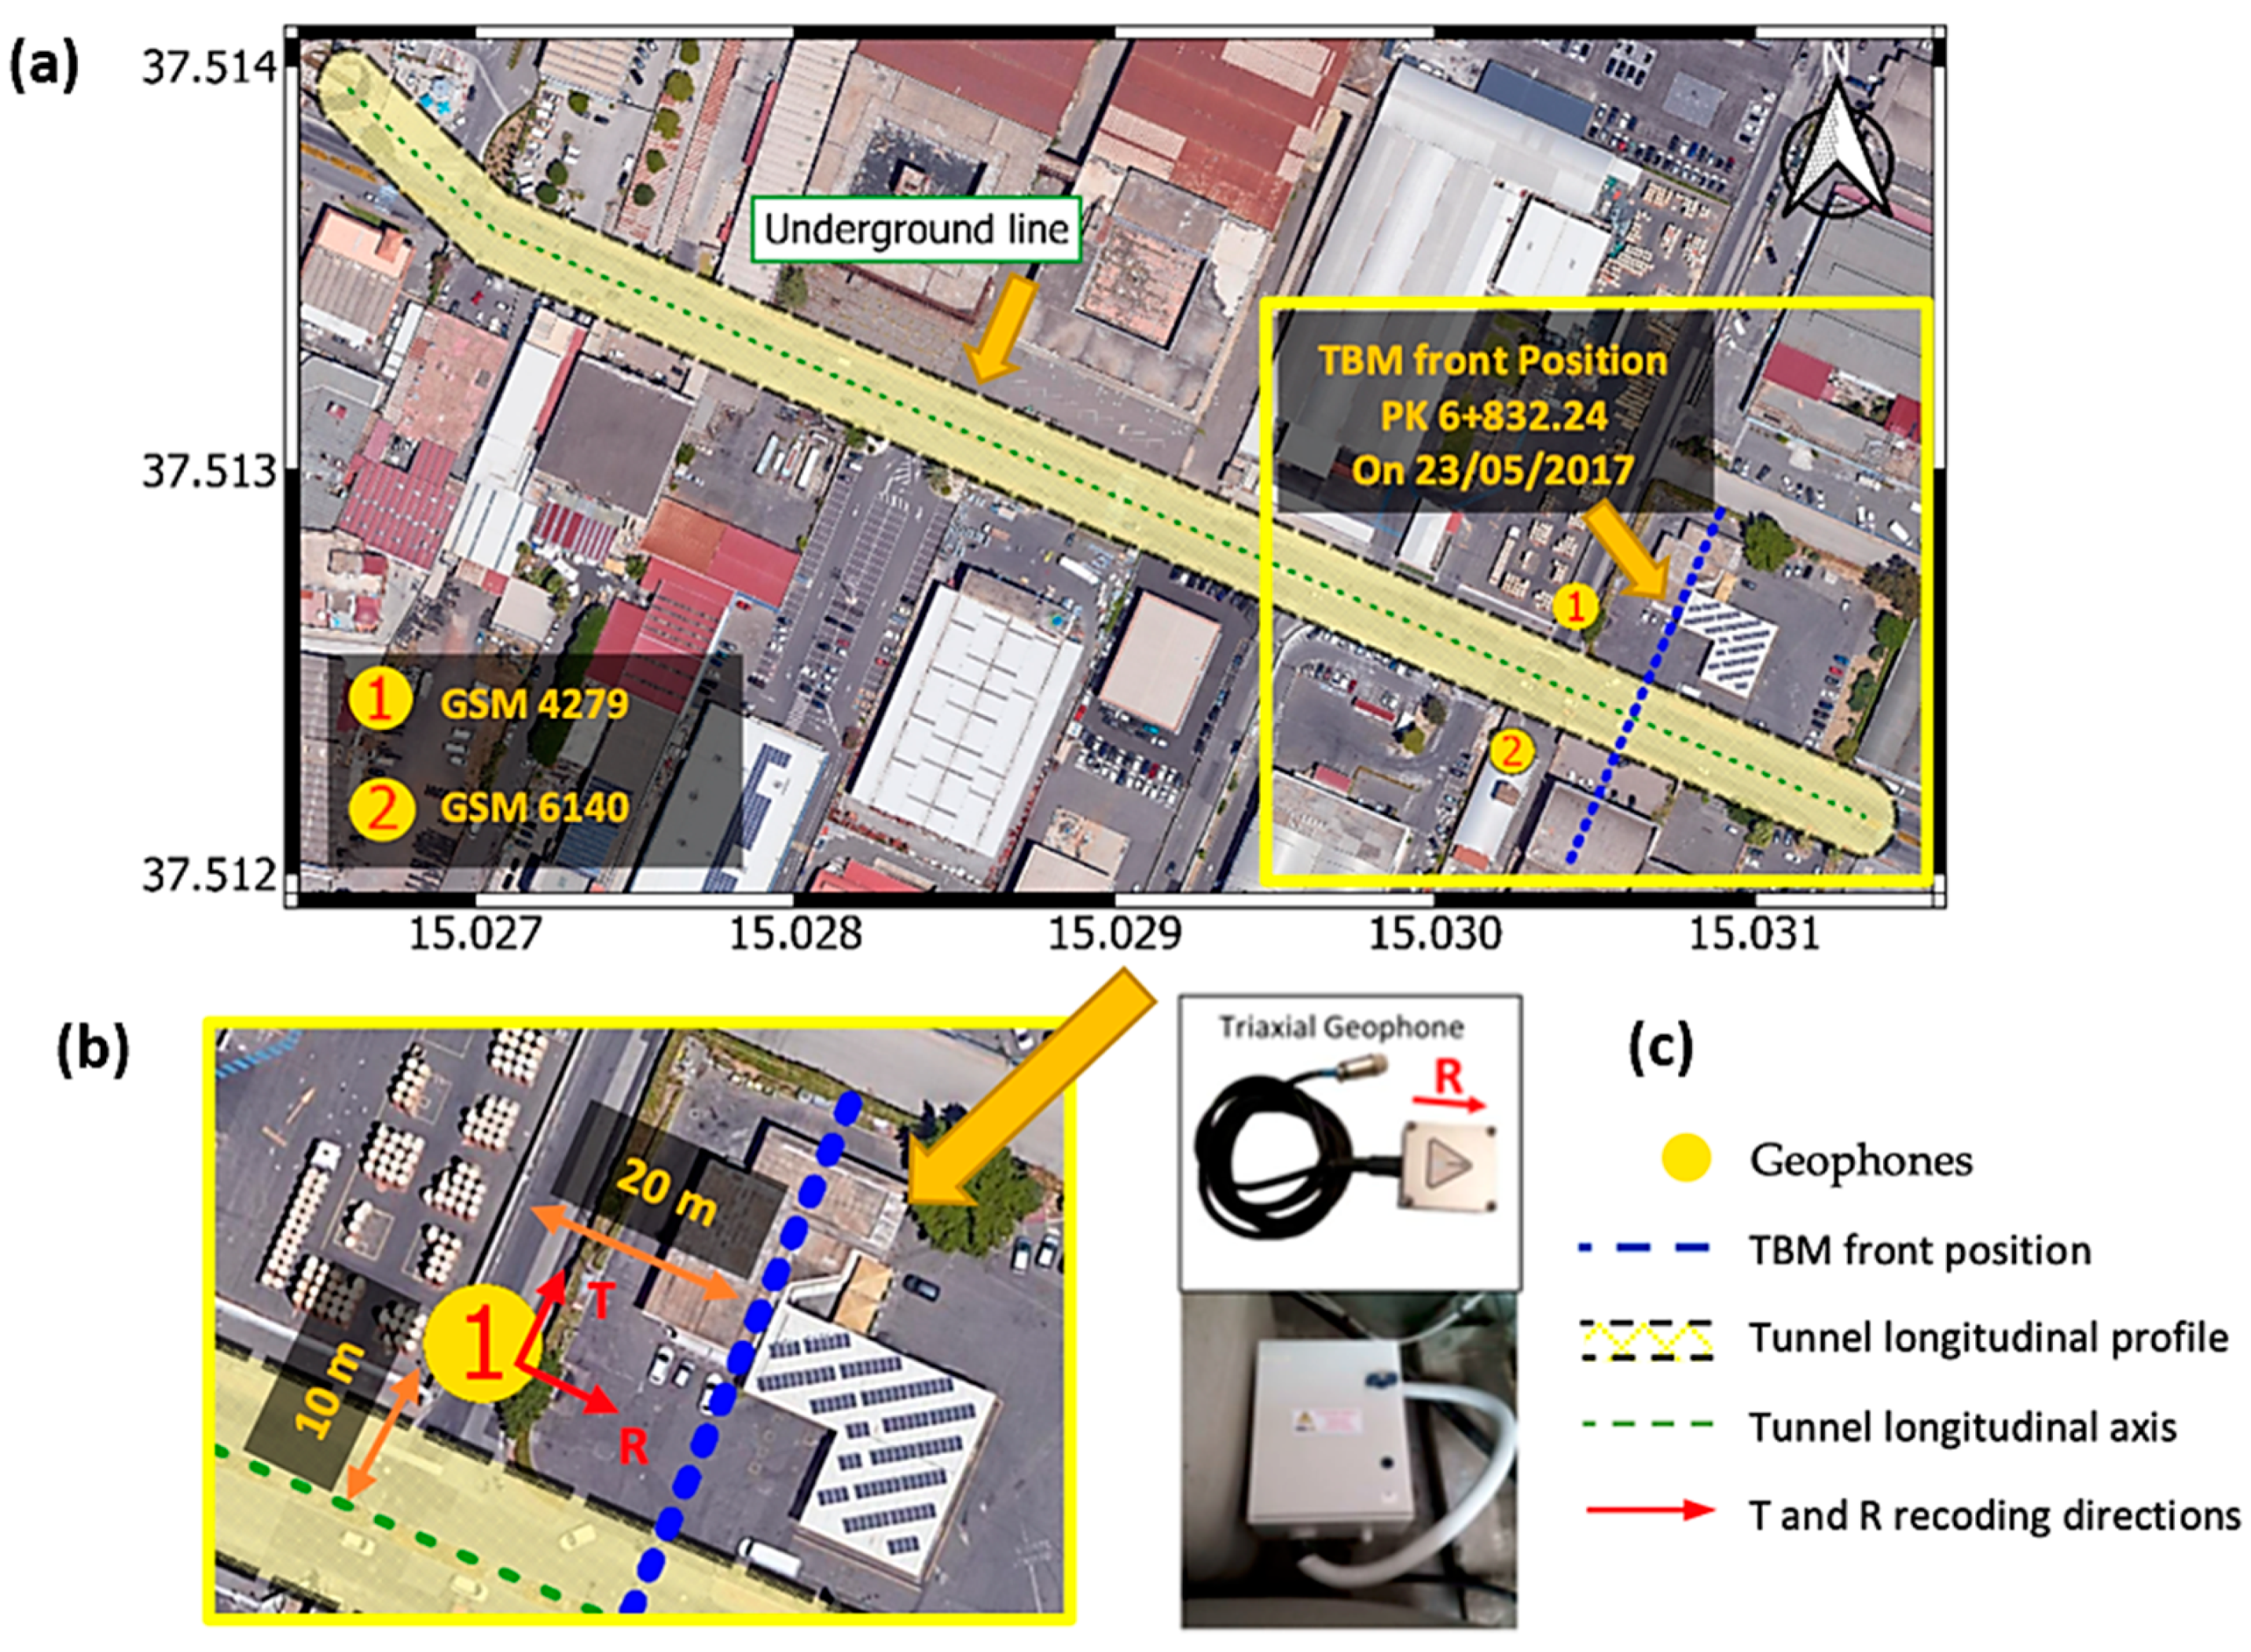
In the analyzed case history, two geophones were located at the soil surface at 20 m from the tunnel face, while the tunnel was being dug. The location of the geophones changed day after day. As an example, Figure 6 shows a plan view of the two geophones’ location and the TBM front on 23 May 2017. The location of the two geophones, labelled as GSM4279 and GSM6140, is shown by the two yellow circles in Figure 6a. In Figure 6b, that is a zoom of Figure 6a, it is also possible to see the R (radial) and T (transversal) recording directions of geophone n. 1 (GSM 4279). Figure 6.b also shows the direction of the tunnel cross-section at the TBM front represented by the blue dashed line and the distance (equal to 10 m) of the geophone n. 1 from the longitudinal axis of the tunnel, represented by the green dashed line. The geophone n. 2 (GSM 6140) was located at the same distance from the longitudinal axis of the tunnel, on the other hand, in respect to the tunnel.
After being positioned, the single geophone is connected to the control unit using aluminum pins. The registration of an event is carried out only when the measured values exceed a predetermined threshold, keeping the measurement even for the 0.5 s or for 1.0 s before the instant of the threshold. In case of measurement beyond 84 h without exceeding the alarm threshold, and therefore without registration, the control unit performs a check automatically on the geophone to verify their correct operation and positioning (self-calibration test). Calibration tests are stored in memory, confirming the measurement without exceeding the threshold. A maximum of 340 waveforms are stored in memory with date and time of events, instrument serial number and calibration data. As previously discussed, the recording duration varies from 1 to 24 s, with pre-threshold storage of 0.5 or 1.0 s. The sample rate of the two geophones is equal to 1024/s.
To avoid the recording of the surrounding noises that could have distorted the vibrations recordings, a threshold equal to 0.05 m/s has been set. According to this threshold, the distance between the TBM front and the geophones in the range 0–30 m were changed. Thanks to these several tests, the optimal distance between the geophones and the TBM front was established equal to 20 m. For distances greater than 20 m, the recorded signals were not significant. A distance minor than 20 m was not considered helpful for the aim of the proposed procedure. It does not allow us to have a reasonable time interval to confirm (or otherwise) the soil profile established in the design phase of tunnels by comparing the data obtained from the geotechnical survey carried out during the design phase and the data coming from the HVSR analysis of the microtremors induced by the TBM during tunnelling, in terms of soil natural frequency.
A reasonable time interval is necessary because the paper aims to propose an early-warning system to alert if there are differences between the soil natural frequency related to the soil profile hypothesized in the design phase (see Equation (1)) and the soil natural frequency furnished by the HVSR analysis. If differences are found, there must be enough time to choose the best tunnelling mode (OP mode or EPB mode) or, if necessary, to update the soil profile using additional investigations.
So, the proposed method, which allows predicting the soil natural frequencies up to 20 m ahead of the TBM cutting face, offers a reasonable time interval, compared with the TBM tunnelling speed, that changes from 10 m/day for rocks to 20 m/day for soft soils.
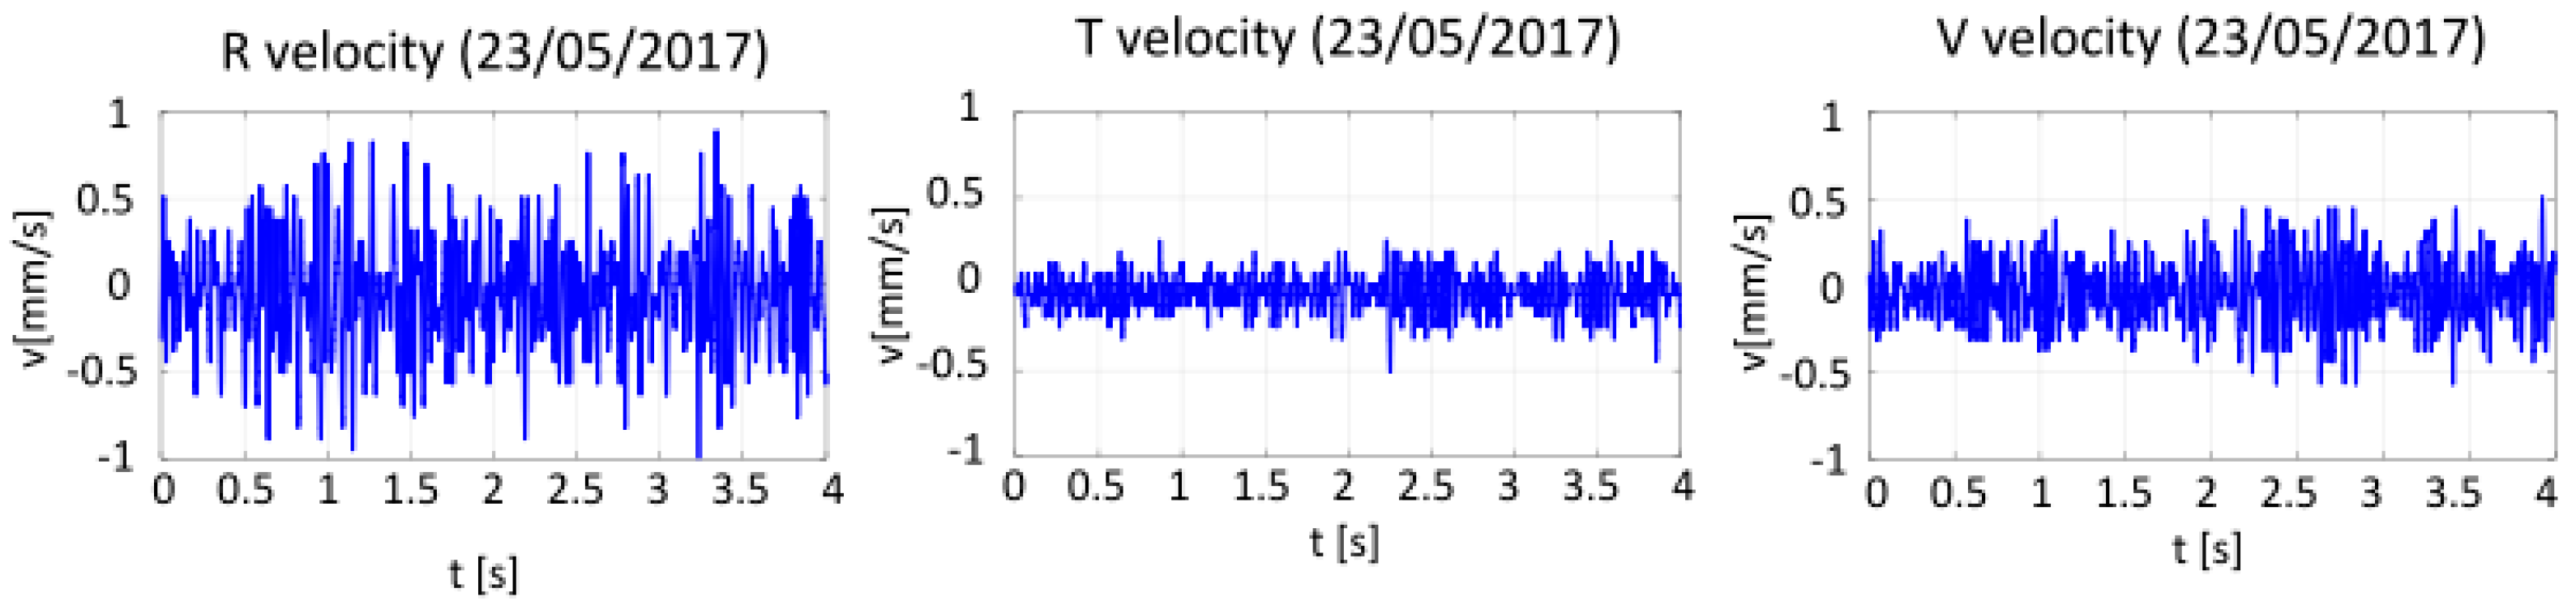
Every day, these geophones recorded a great quantity of velocity time histories in the Radial (R), Transversal (T) and Vertical (V) directions. The time histories recorded between March 2017 and November 2017 were analyzed. Figure 7 reports typically recorded velocity time histories and shows one of the 101 sets of registrations recorded on 23 May 2017, by the geophone labelled GSM4279 (see Figure 6). Using these data, it was possible to compute the related acceleration time-histories (Figure 8) and the corresponding Fourier spectra. The authors obtained the Fourier spectra using the MATLAB code, adopting the FFT Discrete Fourier Transform as data processing method. The process described below was repeated for all the data recorded on one day.
Firstly, the average R, T and V Fourier spectra per day were computed (Figure 9); secondly, the horizontal Fourier spectra (H) were calculated considering the R and T Fourier spectra, according to the following expression:
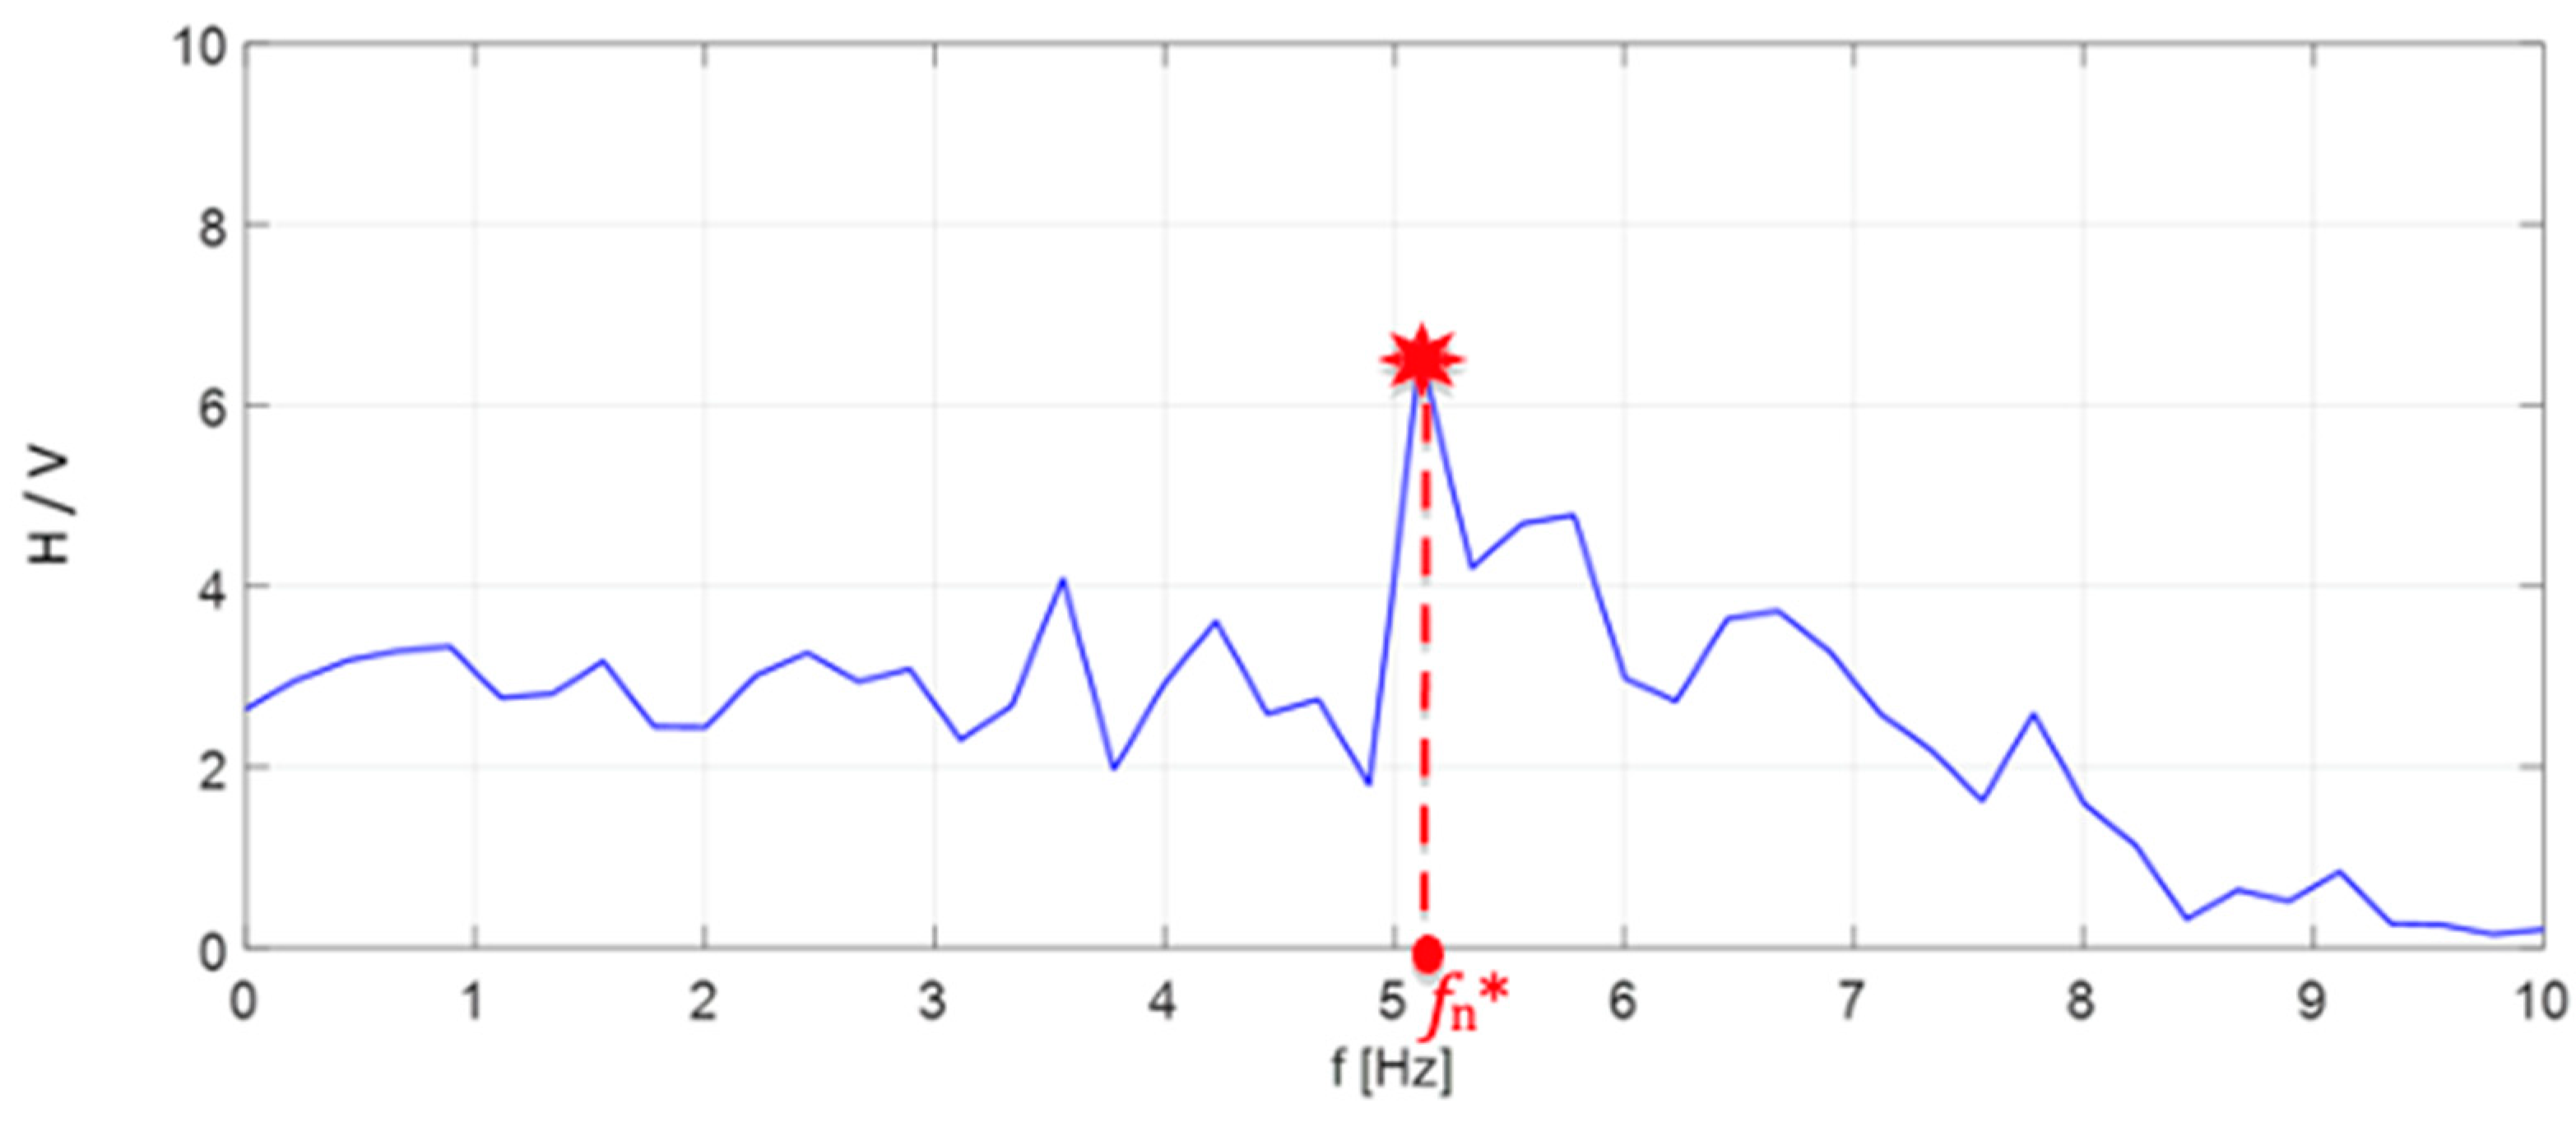
Finally, the H/V ratio between the horizontal H and vertical V Fourier spectra was evaluated. Figure 10 shows the corresponding H/V vs. f diagram. The frequency at which the H/V ratio reaches the peak represents the first natural frequency fn* of the subsoil affected by the TBM microtremors.
The same procedure was repeated for all the days from March 2017 to November 2017. Figure 11 shows the results achieved for 14 May 2017–12 July 2017. In particular, the black curves represent the daily H/V vs. f curves, the red line represents the fn* values obtained day by day. The latter red line is also reported in Figure 12a.
The authors performed numerous measurements in the same point with or without TBM working status (on/off). When the TBM did not work, no valuable vibrations were recorded.
Figure 12a shows not only the soil natural frequency fn* estimated day by day (red line) but also the corresponding average values (dashed blue line). Considering the latter dashed blue line, going from right to left, it is possible to detect five average values of fn*, equal to 6.5 Hz, 3.5 Hz, 7.9 Hz, 4 Hz, and 7.5 Hz. In contrast, Figure 12b reports the natural frequencies’ values obtained using the well-known theoretical expression (1). Figure 12c shows the original soil profile estimated in the design phase (see Section 3 and Figure 4). Figure 12d shows the soil profile updated during the tunnel excavation according to the values of fn* as well as to other boreholes and to the TBM spoil.
It can be seen in Figure 12a,b that there is generally good agreement between fn* and fn, i.e., it is always (fn* − fn)/fn* ≤ 10%. Only in two segments between the progressive section 6 + 150.00 and the progressive section 5 + 920.00, highlighted by the green box in Figure 12, is it possible to notice a disagreement between fn* and fn, with (fn* − fn)/fn* > 10%. Between the progressive section 6 + 150.00 and the progressive section 5 + 970.00 fn* is equal to 4 Hz while fn is equal to 7.5 Hz; this disagreement between fn* and fn could have been due to the suspected presence of sandy, silty clays (Agml-Agm) at lower depths (Figure 12d) than that reported in the soil profile evaluated in the design phase (Figure 12c). Between the progressive section 5 + 970.00 and the progressive section 5 + 920.00 fn * is equal to 7.5 Hz, while fn is equal to 4 Hz; this disagreement could have been due to suspected basalt (Lava of Quartalaro) at a lower depth (Figure 12d) than that expected in the design phase.
The TBM spoil and the additional in-situ tests discussed in the next Section 5 confirmed the updated soil profile of Figure 12d.
The values of fn* were also compared with the natural frequencies obtained by the traditional HVSR tests performed during the design phase, which were about 4.5 Hz and 6 Hz, respectively, for boreholes Si11 (progressive section 6 + 580.00) and Si12 (progressive section 6 + 950.00). These frequencies agree with the frequencies obtained by the proposed advance prediction procedure, which were 4 Hz and 7 Hz around boreholes Si11 and Si12, respectively. Unfortunately, the traditional HVSR tests performed in the design phase did not cover all the segments used in the investigation, so other comparisons cannot be performed.
The obtained H/V vs. f curves changed during the TBM construction (Figure 11). Nevertheless, it allowed us to obtain a quite clear trend of the average value of fn* day by day, as shown by the dashed blue line in Figure 12a. Of course, the proposed procedure is a rough procedure for evaluating the soil natural frequency, and it must be only considered as an easy-to use and not expensive early-warning system for confirming or not the soil profile established in the design phase, comparing fn* with fn.
The SESAME guidelines present criteria and recommendations to help in the result interpretation, considered in the presented analyses: (i) f0 > 10/lw, where f0 is the H/V peak frequency and lw is the window length; this condition is proposed so that, at the frequency of interest, there be at least 10 significant cycles in each window; (ii) A large number of windows and of cycles is needed; the total number of significant cycles has to be: nc·f0 = lw nw f0 > 200, being nw the number of windows selected for the average H/V curve. In the present analyses these conditions were always respected.
The analyzed soil profile is not characterized by strictly horizontal layers for which the simplified formula (1) was developed. Nevertheless, the aim of the proposed procedure is not to have a fine estimation of the soil natural frequency and so a fine estimation of the soil profile, but to have a fast and low-coast evaluation of the soil natural frequency as an early-warning system for increasing the efficiency and safety of TBM tunneling. Focusing on this goal, the authors consider the proposed procedure very valuable.
5. Validation of the Proposed Procedure of Soil Profile Advance Prediction Using Electric Tomographic Tests
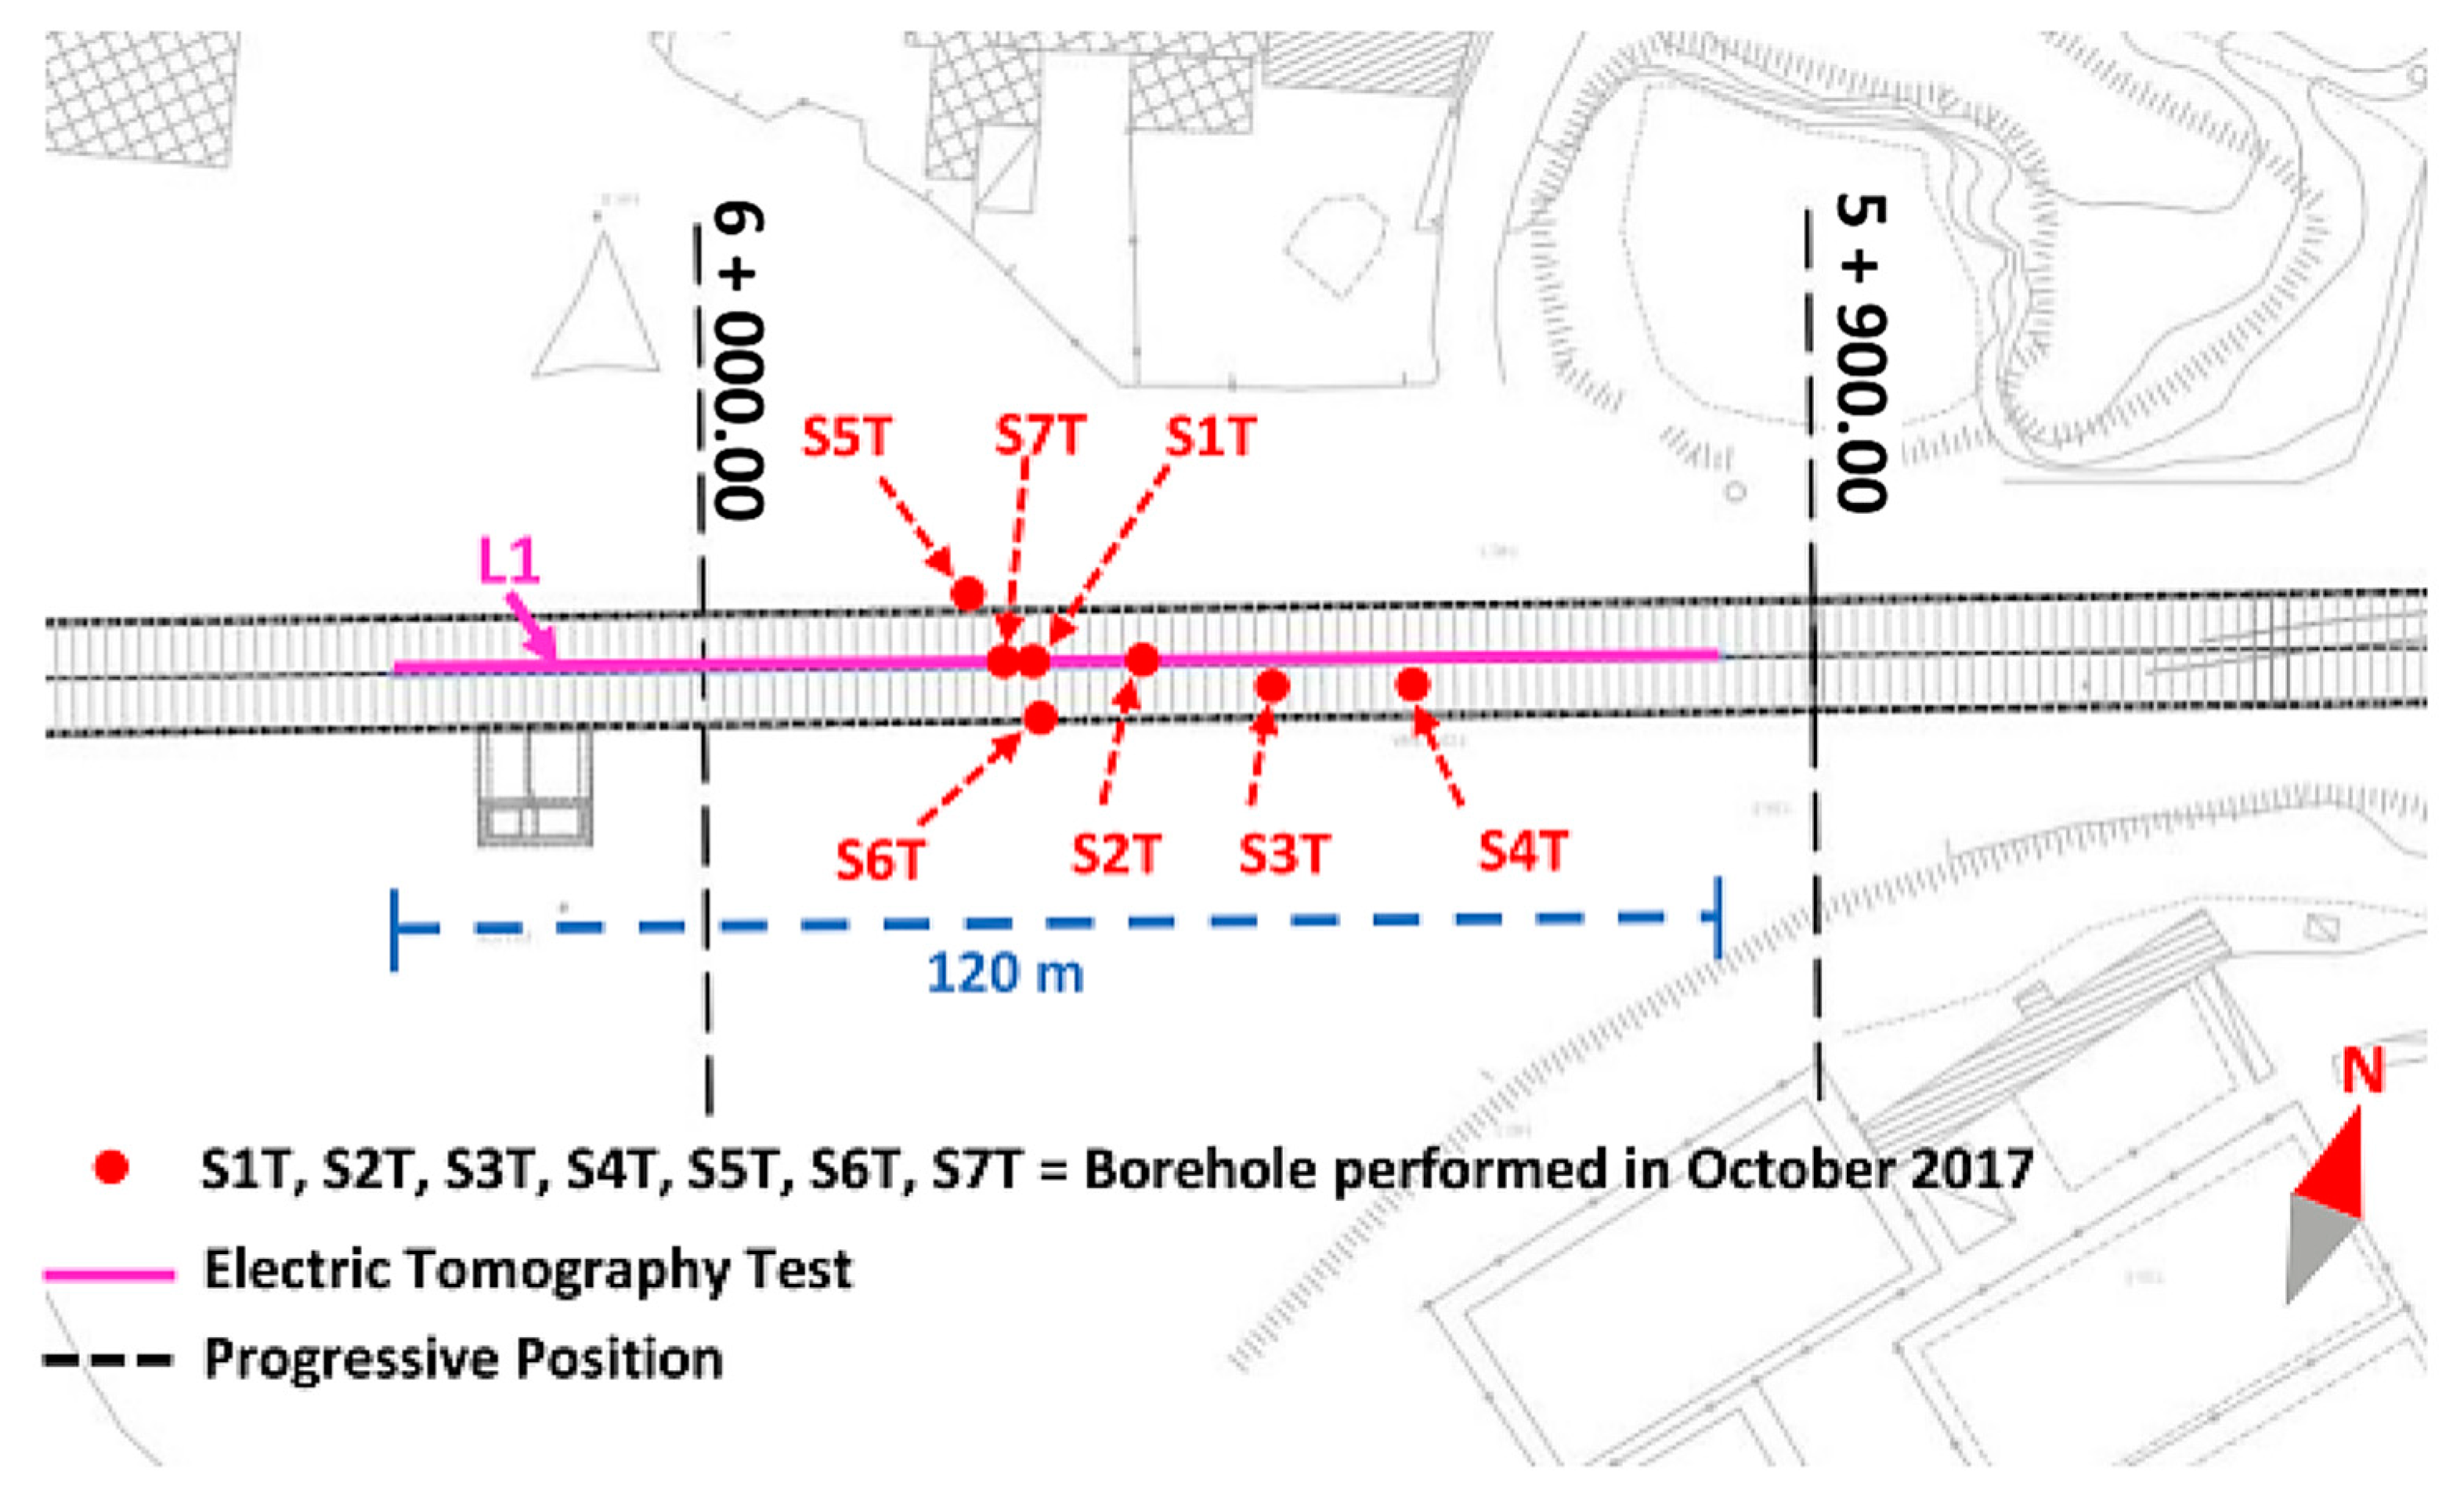
Figure 13a shows the zoom of the soil profile established before the tunnel excavation (see also Figure 4; Figure 12c), and Figure 13b shows the zoom of the soil profile updated during the excavation (Figure 12d), approximately between the progressive section 5 + 800.00 and the progressive section 6 + 300.00. In this section, as previously said, the soil profile established in the design phase appeared quite different from that found thanks to the evaluation of fn*. Thus, the TBM digging was stopped and additional tests were carried out in October 2017 to clarify the real nature of the soil in this area: an Electric Tomographic Test (ETT) and new boreholes (S1T, S2T, S3T, S4T and S7T). The red box in Figure 13 shows the segment of the soil profile in which these additional tests were carried out. Figure 14 shows the exact location of these tests. Figure 15 shows the results of the ETT. Figure 16 shows the typical resistivity ranges of rocks, soils and minerals according to Loke (2013).
As shown in Figure 15, soil layers characterized by resistivity values greater than 7000 ohm.m were found from the tunnel almost up to the soil surface. According to Figure 16, these resistivity values are typical of basalt, such as the Lava of Quartalaro, which the newly developed procedure estimated to be present in this area (Figure 13b). Instead, volcanoclastic breccia and volcanic sand, which were estimated to be present in this area in the design phase, are characterized by values of resistivity generally lower than 1000 ohm.m (Figure 16). The Electric Tomographic Test does not show these low values at the tunnel depth in this area (Figure 15). Thus, Figure 15; Figure 16 and the results of the new boreholes, which are not reported in the text due to lack of space, confirm the presence of basalt at a lower depth than that predicted in the design phase. Based on the updated soil profile, a natural frequency fn = 8 Hz was found according to the theoretical expression (1). The latter is very close to the value fn* = 7.5 Hz found by the new procedure (i.e., (fn* − fn)/fn* ≤ 10%).
6. Conclusions
The present paper proposes an easy-to-use and economical procedure to be applied during TBM digging to confirm, or otherwise, the soil profile established in the previous design phase, by comparing the soil natural frequencies obtained from the soil profile carried out during the design phase and the soil natural frequencies coming from the HVSR analysis of the microtremors induced by the TBM during tunnelling. The proposed procedure is based on an innovative application of the well-known HVSR method and was successfully applied to the new underground lines in Catania (Italy).
A great heterogeneity characterizes the Catania subsoil; thus, the tunnel is being dug using a TBM, frequently switching from the OF (Open Face) mode for rock formations to EPB (Earth Pressure Balance) mode for cohesive and incoherent soil. The great heterogeneity of the subsoil is due to the different lava flows from volcanic eruptions on Mount Etna. For this kind of soil, it is fundamental to know the geological formations present during the digging.
DIN 4150-3 Technical Regulation [12] requires that the microtremors induced by the TBM must be measured to detect the behavior of existing buildings or infrastructures during the TBM tunnelling using two geophones. The authors propose using these TBM microtremor measurements also to confirm or not the soil profile established during the tunnel design phase.
The two geophones were located at the soil surface during digging works at 20 m from the tunnel face. This distance has been selected based on accurate evaluations of the microtremors recordings. Moreover, the TBM tunnelling speed ranges from 10 m/day to 20 m/day; so, the proposed method offers a reasonable time interval for choosing the best tunnelling mode (OP mode or EPB mode).
Considering that the HVSR method is particularly suitable in the estimation of the soil natural frequency, the proposed procedure is based on the comparison between the soil natural frequency fn*obtained using the HVSR method on the microtremors recorded by the two geophones and the soil natural frequency fn = Vs/4H obtained by the well-known theoretical linear approach for soil response analysis. The value of fn is computed according to the soil profile established in the design phase.
So, the procedure can be summarized as follows. The H/V ratio, between the horizontal H and vertical V Fourier spectra of the signals recorded, was daily evaluated. The frequency at which the H/V ratio reaches the peak represents fn*. This fn* was compared with fn. If fn* is very close to fn, i.e., (fn* − fn)/fn* ≤ 10%, the soil profile established in the design phase can be confirmed; if fn* is quite different from fn, i.e., (fn* − fn)/fn* > 10%, the soil profile found in the design phase cannot be confirmed, warning that particular care in the choice of the digging mode and the estimation of the earth-pressure at the TBM front must be taken. Moreover, supplementary investigations could sometimes be required to carefully evaluate the two critical parameters h (bedrock depth) and Vs (shear wave velocity), on which the fundamental frequency of the soil deposit depends.
This procedure was successfully applied to a long segment of the Catania underground, at present under construction. The agreement between fn* and fn confirmed the soil profile established in the design phase for most of the segments under investigation; nevertheless, for one large area, fn* was considerably different from fn. For this area, considering the valuable difference between fn* and fn it was immediately decided to stop the digging and to perform additional in-situ tests, consisting in an Electric Tomographic Test and new boreholes. The additional in-situ tests did not confirm the soil profile established in the design phase. So, an updated value of fn was computed according to new updated soil profile achieved by the additional tests. The new value of fn was very close to fn*, confirming the validity of the innovative application of the HVSR method proposed in this paper.
The proposed procedure is certainly a rough procedure for estimating the soil natural frequency, but it can be considered a valuable, early warning system during tunnel digging for confirming or not the soil profile established in the design phase. Moreover, the proposed procedure allows us to investigate a large area ahead of the TBM excavation front, by surely less expensive techniques than additional geotechnical investigations or other advance prediction procedures. Finally, the TBM microtremors analysis results constitute a geotechnical database of the investigated soil, useful for possible future works on the infrastructural network.
The authors hope that the proposed procedure will be used in different other sites to acquire a large amount of data that will be able to validate or improve it.
Author Contributions
G.A., S.C., S.G. and M.R.M. carried out the investigation and prepared the original manuscript according to the following percentages: 25% G.A., 25% S.C., 25% S.G. and 25% M.R.M. All authors have read and agreed to the published version of the manuscript.
Funding
The research reported in this paper was performed with the financial supports provided by the Research Projects TIMUC—PIA.CE.RI. 2020–2022 and DPC/ReLUIS 2016.
Institutional Review Board Statement
Not applicable.
Informed Consent Statement
Not applicable.
Data Availability Statement
Not applicable.
Acknowledgments
The research reported in this paper was performed with the financial supports provided by the Research Project TIMUC—PIA.CE.RI. 2020–2022 Line 2—University of Catania and by the DPC/ReLUIS 2016 Research Project “Geotechnical Line: WP3—Tunnels in urban areas”—Italian Civil Protection Department.
Conflicts of Interest
The authors declare no conflict of interest.
References
- Mohammadi, J.; Shahriar, K.; Moarefvand, P. Tunnel Face Stability Analysis in Soft Ground by EPB Method (Case Study: 7th Tehran Metro). Aust. J. Basic Appl. Sci. 2011, 5, 589–601. [Google Scholar]
- Anagnostou, G.; Kovári, K. Face stability in slurry and EPB shield tunnelling. In Geotechnical Aspects of Underground Construction in Soft Ground; Progressive Media Markets: Rotterdam, The Netherlands, 1996; pp. 453–458. [Google Scholar]
- Anagnostou, G.; Kovari, K. The face stability of slurry-shield driven tunnels. Tunn. Undergr. Space Technol. 1994, 9, 165–174. [Google Scholar] [CrossRef]
- Carranza-Torres, C.; Reich, T.; Saftner, D. Stability of shallow circular tunnels in soils using analytical and numerical models. In Proceedings of the 61st Minnesota Annual Geotechnical Engineering Conference, Minneapolis, MN, USA, 22 February 2013. [Google Scholar]
- Broere, W. Influence of excess pore pressures on the stability of the tunnel face. In Proceedings of the Third International Symposium on Geotechnical Aspects of Underground Construction in Soft Ground, Toulouse, France, 23–25 October 2002; pp. 179–184. [Google Scholar]
- Atkinson, J.H.; Potts, D.M. Subsidence above shallow tunnels in soft ground. J. Geotech. Eng. Div. 1977, 103, 307–325. [Google Scholar] [CrossRef]
- Attewell, P.B.; Taylor, R.K. Ground Movements and Their Effects on Structures; Surrey University Press: Glasgow, UK, 1984; pp. 132–212. [Google Scholar]
- Attewell, P.B. Ground movements caused by tunnelling in soil. In International Conference on Large Ground Movements and Structures; Geddes, J.D., Ed.; Pentech Press: London, UK, 1978; pp. 812–948. [Google Scholar]
- Burland, J.P. Assessment of risk of damage to buildings due to tunnelling and excavation. In Proceedings of the First International Conference on Earthquake Geotechnical Engineering of Tokyo, Tokyo, Japan, 1–12 November 1995. [Google Scholar]
- Shi, S.; Zhao, R.; Li, S.; Xie, X.; Li, L.; Zhou, Z.; Liu, H. Intelligent prediction of surrounding rock deformation of shallow buried highway tunnel and its engineering application. Tunn. Undergr. Space Technol. 2019, 90, 1–11. [Google Scholar] [CrossRef]
- Gao, X.; Shi, M.; Song, X.; Zhang, C.; Zhang, H. Recurrent neural networks for real-time prediction of TBM operating parameters. Autom. Constr. 2019, 98, 225–235. [Google Scholar] [CrossRef]
- Dickmann, T. The Role of Tunnel Seismic prediction in Tunneling projects: Best practices. In Proceedings of the Indorock-2014: Fifth Indian Rock Conference, Delhi, India, 12–14 November 2014. [Google Scholar]
- Dickmann, T.; Méndez, J.H. Look-ahead seismic investigations during tunneling with shield tunnel boring machines. In Proceedings of the 2017 Word Congress on Advances in Structural Engineering and Mechanics, Ilsan, Korea, 28 August–1 September 2017. [Google Scholar]
- Liu, M.; Liao, S.; Li, J. Evaluation of the construction effectiveness for shield tunneling in complex ground based on FCE and AHP. In Geotechnical Frontiers 2017: Transportation Facilities, Structures, and Site Investigation; Brandon, T.L., Valentine, R.J., Eds.; American Society of Civil Engineers (ASCE): Reston, VA, USA, 2017; pp. 556–565. [Google Scholar]
- Liu, M.; Liao, S.; Xiao, L.; Cheng, C. Stratigraphic classification based on the evaluated difficulty of the construction by using shield tunneling machine. In Transportation Research Congress 2016: Innovations in Transportation Research Infrastructure; Wang, L., Ling, J., Liu, P., Zhu, H., Gong, H., Huang, B., Eds.; ASCE: Reston, VA, USA, 2018; pp. 577–589. [Google Scholar]
- Li, S.; Liu, B.; Xu, X.; Nie, L.; Liu, Z.; Song, J.; Sun, H.; Chen, L.; Fan, K. An overview of ahead geological prospecting in tunneling. Tunn. Undergr. Space Technol. 2017, 63, 69–94. [Google Scholar] [CrossRef]
- Bigot, A.; Farotto, G. Tunnel boring machine vibration impact prediction method based on surface vibration measurement and tunnel to surface transfer function calculation. In Proceedings of the 23rd International Congress on Sound and Vibration: From Ancient to Modern Acoustics, New York, NY, USA, 10–14 July 2016; pp. 909–916. [Google Scholar]
- Petronio, L.; Poletto, F. Seismic-while-drilling by using tunnel boring machine noise. Geophysics 2002, 67, 1798–1809. [Google Scholar] [CrossRef]
- Liu, M.; Liao, S.; Yang, Y.; Men, Y.; He, J.; Huang, Y. Tunnel boring machine vibration-based deep learning for the ground identification of working faces. J. Rock Mech. Geotech. Eng. 2021, 13, 1340–1357. [Google Scholar] [CrossRef]
- DIN 4150-3. Vibrations in Buildings—Part 3: Effects on Structures; DIN: Berlin, Germany, 2016. [Google Scholar]
- Hiller, D.M. The Prediction of Groundborne Vibration Caused by Mechanised Construction Works; University of Surrey: Guildford, UK, 1999. [Google Scholar]
- Hiller, D.M. The prediction and mitigation of vibration impacts of tunnelling. In Proceedings of the Australian Acoustical Society Conference 2011, Acoustics 2011: Breaking New Ground, Gold Coast, Australia, 2–4 November 2011; pp. 1–8. [Google Scholar]
- Hiller, D.M.; Crabb, G.I. Groundborne vibration caused by mechanised construction works. In Crowthorne, Berkshire; Transport Research Foundation Group of Companie: Berkshire, UK, 2000. [Google Scholar]
- Petronio, L.; Poletto, F.; Schleifer, A.; Morino, A. Geology prediction ahead of the excavation front by Tunnel-Seismic-While-Drilling (TSWD) method. SEG Tech. Progr. Expand. Abstr. 2003, 22, 1211–1214. [Google Scholar] [CrossRef]
- Brückl, E.; Chwatal, W.; Mertl, S.; Radinger, A. Exploration ahead of a tunnel face by TSWD—tunnel seismic while drilling. Geomech. Tunnelbau. 2008, 1, 460–465. [Google Scholar] [CrossRef]
- Mooney, M.; Walter, B.; Steele, J.; Cano, D. Influence of geological conditions on measured TBM vibration frequency. In North American Tunneling: 2014 Proceedings; Davidson, G., Howard, A., Jacobs, L., Pintabona, R., Zernich, B., Eds.; Society for Mining, Metallurgy and Exploration (SME): Englewood, CO, USA, 2014; pp. 32–41. [Google Scholar]
- Kreutzer, I. TSWD—State of the art and current developments. In Symposium on the Application of Geophysics to Engineering and Environmental Problems 2014; Environmental & Engineering Geophysical Society: Denver, CO, USA, 2014; pp. 533–536. [Google Scholar]
- Lazarová, E.; Kruľáková, M.; Labaš, M.; Ivanicova, L.; Feriančiková, K. Vibration signal for identification of concrete drilling process and drill bit wear. Eng. Fail. Anal. 2020, 108, 104302. [Google Scholar] [CrossRef]
- Zhang, K.; Yu, H.; Liu, Z.; Lai, X. Dynamic characteristic analysis of TBM tunnelling in mixed-face conditions. Simul. Model Pract. Theory 2010, 18, 1019–1031. [Google Scholar] [CrossRef]
- Sun, W.; Ling, J.; Huo, J.; Guo, L.; Zhang, X.; Deng, L. Dynamic characteristics study with multidegree-of-freedom coupling in TBM cutterhead system based on complex factors. Math. Probl. Eng. 2013. [Google Scholar] [CrossRef]
- Huo, J.; Sun, X.; Li, T.; Sun, W. Multi-degree-of-freedom coupling dynamic characteristic of TBM disc cutter under shock excitation. J. Cent. South Univ. 2015, 22, 3326–3337. [Google Scholar] [CrossRef]
- Huo, J.; Wu, H.; Yang, J.; Sun, W.; Li, G.; Sun, X. Multi-directional coupling dynamic characteristics analysis of TBM cutterhead system based on tunnelling field test. J. Mech. Sci. Technol. 2015, 29, 3043–3058. [Google Scholar] [CrossRef]
- Liu, Q.S.; Wu, J.; Zhang, X.P.; Tang, L.X.; Bi, C.; Li, W.W.; Xu, J.L. Microseismic monitoring to characterize structure-type rockbursts: A case study of a TBM-excavated tunnel. Rock Mech. Rock Eng. 2020, 53, 2995–3013. [Google Scholar] [CrossRef]
- Bilgin, N.; Acun, S. The effect of rock weathering and transition zones on the performance of an EPB-TBM in complex geology near Istanbul. Turkey Bull. Eng. Geol. Environ. 2021, 80, 3041–3052. [Google Scholar] [CrossRef]
- Huanga, X.; Liu, Q.; Liu, H.; Zhan, P.; Pan, S.; Zhang, X.; Fang, J. Development and in-situ application of a real-time monitoring system for the interaction between TBM and surrounding rock. Tunn. Undergr. Space Technol. 2018, 81, 187–208. [Google Scholar] [CrossRef]
- Liu, M.B.; Liao, S.M.; Men, Y.Q.; Xing, H.T.; Liu, H.; Sun, L.Y. Field Monitoring of TBM Vibration During Excavating Changing Stratum: Patterns and Ground Identification. Rock Mech. Rock Eng. 2021, 1–8. [Google Scholar] [CrossRef]
- Nakamura, Y. A Method for Dynamic Characteristics Estimation of Subsurface Using Microtremor on the Ground Surface. Q. Rep. Railw. Tech. Res. 1989, 30, 25–33. [Google Scholar]
- Nakamura, Y. What is the Nakamura method? Seismol. Res. Lett. 2019, 90, 1437–1443. [Google Scholar] [CrossRef]
- Grippa, A.; Bianca, M.; Tropeano, M.; Cilumbriello, A.; Gallipoli, M.R.; Mucciarelli, M.; Sabato, L. Use of the HVSR method to detect buried paleomorphologies (filled incised valleys) below a coastal plain: The case of the Metaponto plain (Basilicata, southern Italy). Boll. Geofis. Teor. Appl. 2011, 52, 225–240. [Google Scholar]
- Mokhberi, M.; Davoodi, M.; Haghshenas, E.; Jafari, M.K. Experimental evaluation of the H/V spectral ratio capabilities in estimating the subsurface layer characteristics. IJST Trans. Civ. Eng. 2013, 37, 457–468. [Google Scholar]
- Pinzón, L.A.; Pujades, L.G.; Macau, A.; Carreño, E.; Alcalde, J.M. Seismic Site Classification from the Horizontal-to-Vertical Response Spectral Ratios: Use of the Spanish Strong-Motion Database. Geosciences 2019, 9, 294. [Google Scholar] [CrossRef] [Green Version]
- Rong, M.; Li, H.; Yu, Y. The difference between horizontal-to-vertical spectra ratio and empirical transfer function as revealed by vertical arrays. PLoS ONE 2019, 14, e0210852. [Google Scholar] [CrossRef] [PubMed]
- Stanko, D.; Markušic, S.; Gazdek, M.; Sankovic, V.; Slukan, I.; Ivančic, I. Assessment of the Seismic Site Amplification in the City of Ivanec (NW Part of Croatia) Using the Microtremor HVSR Method and Equivalent-Linear Site Response Analysis. Geosciences 2019, 9, 312. [Google Scholar] [CrossRef] [Green Version]
- Atakan, K.; Duval, A.-M.N.; Theodulidis, P.-Y.B.; the SESAME-Team 2004. On the Reliability of the H/V Spectral Ratio Technique; ICSDEE & ICEGE: Berkeley, CA, USA, 2004. [Google Scholar]
- Duval, A.-M.; Chatelain, J.-L.; Guillier, B.; the SESAME WP02 Team 2004. Influence of Experimental Conditions on H/V Determination Using Ambient Vibrations (Noise); ICSDEE & ICEGE: Berkeley, CA, USA, 2004. [Google Scholar]
- Bard, P.-Y. The SESAME project: An overview and main results. In Proceedings of the 13th world conference in Earthquake Engineering, Vancouver, BC, USA, 1–6 August 2004. [Google Scholar]
- Khan, A.B.A.; Yokoi, T. Validation of SPAC and HVSR methods, an experimental study. Bull. Int. Inst. Seismol. Earthq. Eng. 2011, 45, 37–42. [Google Scholar]
- Kamarudin, A.F.; Daud, M.E.; Ibrahim, Z. Part 1: Verification of HVSR Method at Minyak Beku Outcrop Bedrock in Johor, Peninsular Malaysia. Int. J. Appl. Eng. Res. 2015, 10, 1–5. [Google Scholar]
- Gosar, A. Study on the applicability of the microtremor HVSR method to support seismic microzonation in the town of Idrija (W Slovenia). Nat. Hazards Earth Syst. Sci. 2017, 17, 925–937. [Google Scholar] [CrossRef] [Green Version]
- Chahyani, R.; Manan, A.; Puspitafury, C.; Kasmawati, K. Identification of surface-basement layer distribution of Wangi-Wangi Island based on HVSR method of microtremor data. J. Phys. Theor. Appl. 2020, 4, 94. [Google Scholar] [CrossRef]
- Ryanto, T.A.; Iswanto, E.R.; Indrawati, Y.; Setiaji, A.B.W.; Suntoko, H. Sediment Thickness Estimation in Serpong Experimental Power Reactor Site Using HVSR Method. J. Pengemb. Energi Nukl. 2020, 22, 29–37. [Google Scholar] [CrossRef]
- Tanjung, N.A.F.; Permatasari, I.; Yuniarto, A.H.P. Mapping of weathered layer thickness and Seismic Vulnerability in Tegal using HVSR method. In Proceedings of the International Symposium on Physics and Applications (ISPA 2020), Surabaya, Indonesia, 17–18 December 2020; IOP Publishings: Bristol, UK, 2021. [Google Scholar] [CrossRef]
- Kramer, S.T. Geotechnical Earthquake Engineering; Prentice-Hall Inc.: Hoboken, NJ, USA, 1996; ISBN 0-13-374943-6. [Google Scholar]
- Lanzo, G.; Silvestri, F. Risposta Sismica Locale: Teorie Ed Esperienze; Helvius Edizioni: Napoli, Italy, 1999. [Google Scholar]
- Caruso, S.; Ferraro, A.; Grasso, S.; Massimino, M.R. Site Response Analysis in eastern Sicily based on direct and indirect Vs measurements. In Proceedings of the 1st IMEKO TC4 International Workshop on Metrology for Geotechnics, MetroGeotechnics, Benevento, Italy, 17–18 March 2016; pp. 115–120. [Google Scholar]
- Ferraro, A.; Grasso, S.; Massimino, M.R.; Maugeri, M. Influence of geotechnical parameters and numerical modelling on local seismic response analysis. In Geotechnical Engineering for Infrastructure and Development—Proceedings of the XVI European Conference on Soil Mechanics and Geotechnical Engineering, ECSMGE 2015; ICE Publishing: London, UK, 2015; pp. 2183–2188. [Google Scholar]
- Abate, G.; Massimino, M.R.; Romano, S. Finite Element Analysis of DSSI Effects for a Building of Strategic Importance in Catania (Italy). Procedia Eng. 2016, 158, 374–379. [Google Scholar] [CrossRef] [Green Version]
- Castelli, F.; Cavallaro, A.; Ferraro, A.; Lentini, V.; Massimino, M.R. Static and dynamic properties of soils in Catania (Italy). Ann. Geophys. 2018, 61, SE221. [Google Scholar] [CrossRef]
- Ferraro, A.; Grasso, S.; Massimino, M.R. Site effects evaluation in Catania (Italy) by means of 1-D numerical analysis. Ann. Geophys. 2018, 61, SE224. [Google Scholar] [CrossRef]
- Massimino, M.R.; Abate, G.; Corsico, S.; Louarn, R. Comparison Between Two Approaches for Non-linear FEM Modelling of the Seismic Behavior of a Coupled Soil–Structure System. Geotech. Geol. Eng. 2019, 37, 1957–1975. [Google Scholar] [CrossRef]
- Capilleri, P.P.; Massimino, M.R. Geotechnical characterization of ash collected during recent eruptions of Mount Etna: From dangerous waste material to environmental friendly resource. Geomech. Geophys. Geo-Energy Geo-Resour. 2019, 5, 383–403. [Google Scholar] [CrossRef]
- Abate, G.; Massimino, M.R. Numerical modelling of the seismic response of a tunnel–soil–aboveground building system in Catania (Italy). Bull. Earthq. Eng. 2017, 15, 469–491. [Google Scholar] [CrossRef]
- Abate, G.; Corsico, S.; Massimino, M.R. Behavior of coupled tunnel-soil-aboveground building systems in seismic conditions evaluated by means of parametric analyses. In Proceedings of the Earthquake Geotechnical Engineering for Protection and Development of Environment and Constructions—7th International Conference on Earthquake Geotechnical Engineering, Roma, Italy, 17–20 June 2019; pp. 985–992. [Google Scholar]
- Abate, G.; Grasso, S.; Massimino, M.R. The role of shear wave velocity and non-linearity of soil in the seismic response of a coupled tunnel-soil-above ground building system. Geosciences 2019, 9, 473. [Google Scholar] [CrossRef] [Green Version]
- Abate, G.; Corsico, S.; Grasso, S.; Massimino, M.R.; Pulejo, A. Analysis of the vibrations induced by a TBM to refine soil profile during tunneling: The Catania case history. In Proceedings of the Tunnels and Underground Cities: Engineering and Innovation meet Archaeology, Architecture and Art. WTC 2019 ITA-AITES World Tunnel Congress 2019, Naples, Italy, 3–9 May 2019; pp. 567–576, ISBN 978-1-138-38865-9. [Google Scholar]
- Faccioli, E.; Pessina, V. The Catania Project: Earthquake damage scenarios for a risk area in the Mediterranean. In CNR-Gruppo Nazionale per la Difesa dei Terremoti; Faccioli, E., Pessina, V., Eds.; 2000; ISBN 88-900449-0-X. Available online: http://hdl.handle.net/2122/12181 (accessed on 14 October 2021).
- Cavallaro, A.; Maugeri, M.; Lo Presti, D.C.F.; Pallara, O. Characterising shear modulus and damping from in situ and laboratory tests for the seismic area of Catania. In Proceedings of the 2nd International Symposium on Pre-failure Deformation Characteristics of Geomaterials, Torino, Italy, 28–30 September 1999; pp. 51–58. [Google Scholar]
- Cavallaro, A.; Grasso, S.; Maugeri, M. Volcanic soil characterisation and site response analysis in the city of Catania. In Proceedings of the 8th US National Conference on Earthquake Engineering 2006, San Francisco, CA, USA, 18–22 April 2006; pp. 835–844. [Google Scholar]
- Cavallaro, A.; Grasso, S.; Ferraro, A. Study on seismic response analysis in “Vincenzo Bellini” garden area by seismic dilatometer Marchetti tests. In Proceedings of the 5th International Conference on Geotechnical and Geophysical Site Characterisation, Gold Coast, Australia, 5–9 September 2016; pp. 1309–1314. [Google Scholar]
- Grasso, S.; Maugeri, M.R. The seismic microzonation of the city of Catania (Italy) for the maximum expected scenario earthquake of January 11, 1693. Soil Dyn. Earthq. Eng. 2009, 29, 953–962. [Google Scholar] [CrossRef]
- Omori, F. On microtremors. Res. Imp. Earthq. Inv. Comm. 1908, 6, 1–6. [Google Scholar]
- Kanai, K.; Tanaka, T. On microtremors I. Bull. Earthq. Res. Inst. 1954, 32, 199–209. [Google Scholar]
- Kanai, K.; Tanaka, T. On microtremors VIII. Bull. Earthq. Res. Inst. 1961, 39, 97–114. [Google Scholar]
- Lermo, J.; Chavez-Garcia, F.J. Site effect evaluation using spectral ratios with only one station. Bull. Seismol. Soc. Am. 1993, 83, 1574–1594. [Google Scholar] [CrossRef]
- Konno, K.; Ohmachi, T. Ground-motion characteristics estimated from spectral ratio between horizontal and vertical components of microtremor. Bull. Seismol. Soc. Am. 1998, 88, 228–241. [Google Scholar] [CrossRef]
- Nakamura, Y. Clear identification of fundamental idea of Nakamura’s technique and its applications. In Proceedings of the 12th World Conference on Earthquake Engineering, Auckland, New Zealand, 30 January–4 February 2000. [Google Scholar]
- Castellaro, S.; Mulargia, F. VS30 Estimates Using Constrained H/V Measurements. Bull. Seismol. Soc. Am. 2009, 99, 761–773. [Google Scholar] [CrossRef]
- Foti, S.; Parolai, S.; Albarello, D.; Picozzi, M. Application of Surface-Wave Methods for Seismic Site Characterization. Surv. Geophys. 2011, 32, 777–825. [Google Scholar] [CrossRef] [Green Version]
- Luzi, L.; Puglia, R.; Pacor, F.; Gallipoli, M.R.; Bindi, D.; Mucciarelli, M. Proposal for a soil classification based on parameters alternative or complementary to Vs,30. Bull. Earthq. Eng. 2011, 9, 1877–1898. [Google Scholar] [CrossRef]
- Kawase, H.; Matsushima, S.; Satoh, T.; Sa‘nchez-Sesma, F.J. Applicability of theoretical horizontal-to-vertical ratio of microtremors based on the diffuse field concept to previously observed data. Bull. Seismol. Soc. Am. 2015, 105, 3092–3103. [Google Scholar] [CrossRef]
- Molnar, S.; Cassidy, J.F.; Castellaro, S.; Cornou, C.; Crow, H.; Hunter, J.A.; Matsushima, S.; Sánchez-Sesma, F.J.; Yong, A. Application of Microtremor Horizontal-toVertical Spectral Ratio (MHVSR) Analysis for Site Characterization: State of the Art. Surv. Geophys. 2018, 39, 613–631. [Google Scholar] [CrossRef]
- Nelson, S.; McBride, J. Application of HVSR to estimating thickness of laterite weathering profiles in basalt. Earth Surf. Process Landf. 2019, 44, 1365–1376. [Google Scholar] [CrossRef]
- Loke, M.H. Tutorial: 2-D and 3-D Electrical Imaging Surveys; Geotomo Software: Gelugor, Malaysia, 2011. [Google Scholar]
Figure 1.
The underground network in Catania (modified from https://catania.mobilita.org/opere/metropolitana-di-catania-storia-e-sviluppi-futuri/, accessed on 1 September 2021).
Figure 1.
The underground network in Catania (modified from https://catania.mobilita.org/opere/metropolitana-di-catania-storia-e-sviluppi-futuri/, accessed on 1 September 2021).

Figure 2.
The Nesima-Misterbianco segment under investigation.

Figure 3.
The TBM utilized along the Nesima-Misterbianco segment: (a) front view of the TBM; (b) TBM across Fontana station; (c) precast concrete segments.
Figure 3.
The TBM utilized along the Nesima-Misterbianco segment: (a) front view of the TBM; (b) TBM across Fontana station; (c) precast concrete segments.

Figure 4.
Soil profile and positions of the boreholes along the Nesima-Misterbianco segment from the design phase.
Figure 4.
Soil profile and positions of the boreholes along the Nesima-Misterbianco segment from the design phase.

Figure 5.
Flow chart of the proposed procedure (fn is the natural frequency obtained by the well-known theoretical expression fn = Vs/4h; fn* is the natural frequency estimated by the H/V vs. f curve).
Figure 5.
Flow chart of the proposed procedure (fn is the natural frequency obtained by the well-known theoretical expression fn = Vs/4h; fn* is the natural frequency estimated by the H/V vs. f curve).

Figure 6.
Layout of the geophones at the soil surface: (a) plan view; (b) zoom of the location of geophone n. 1 and TBM front; (c) detail of the used geophones.
Figure 6.
Layout of the geophones at the soil surface: (a) plan view; (b) zoom of the location of geophone n. 1 and TBM front; (c) detail of the used geophones.

Figure 7.
Radial (R), Transversal (T) and Vertical (V) velocity time-histories recorded by geophone “GSM 4279” during TBM tunnelling at 00:39 (Italian time) on 23 May 2017 (see Figure 6).
Figure 7.
Radial (R), Transversal (T) and Vertical (V) velocity time-histories recorded by geophone “GSM 4279” during TBM tunnelling at 00:39 (Italian time) on 23 May 2017 (see Figure 6).

Figure 8.
Radial (R), Transversal (T) and Vertical (V) average acceleration time histories derived from the velocity time histories shown in Figure 7.
Figure 8.
Radial (R), Transversal (T) and Vertical (V) average acceleration time histories derived from the velocity time histories shown in Figure 7.

Figure 9.
Fourier spectra derived by the acceleration time histories coming from all the recordings on 23 May 2017.
Figure 9.
Fourier spectra derived by the acceleration time histories coming from all the recordings on 23 May 2017.

Figure 10.
H/V vs. f curve obtained by the Fourier spectra shown in Figure 9 (23 May 2017): fn* is the natural frequency estimated by this curve.
Figure 10.
H/V vs. f curve obtained by the Fourier spectra shown in Figure 9 (23 May 2017): fn* is the natural frequency estimated by this curve.

Figure 11.
Frequency-day-amplitude curves obtained by the new procedure in the period 14 May 2017–12 July 2017.
Figure 11.
Frequency-day-amplitude curves obtained by the new procedure in the period 14 May 2017–12 July 2017.

Figure 12.
Updating of the soil profile thanks to the proposed procedure of advance prediction of soil profile: (a) evaluation of the soil fundamental frequency fn* by means of the HVSR method: the red line shows the peak values estimated day after day, the blue line shows the average values; (b) soil fundamental frequency evaluated by the well-known theoretical expression fn = Vs/4h; (c) soil profile estimated in the design phase according to the previous in-situ and laboratory tests; (d) soil profile updated during tunnelling thanks to the new proposed procedure, i.e., based on the values of fn*, and by the additional in-situ tests.

Figure 13.
Zoom of the soil profile: (a) established during the design phase (see Figure 12c); (b) updated during tunnelling (see Figure 12d).

Figure 14.
Layout of the Electric Tomography Test and the new boreholes performed in October 2017.

Figure 15.
Results of the Electric Tomography Test performed in October 2017.

Figure 16.
The resistivity of rocks, soils and minerals (after [83]).
Figure 16.
The resistivity of rocks, soils and minerals (after [83]).


Table 1.
Geotechnical parameter for each geological formation.
| Geological Formation | γ [kN/m3] | φ′ [°] | C′ [kPa] | cu [kPa] | VS [m/s] | E0 [MPa] | Eu [MPa] | k [m/s] |
|---|---|---|---|---|---|---|---|---|
| Rp | ||||||||
| All | ||||||||
| Sbv-L1669 | ||||||||
| Agm | ||||||||
| Agml | ||||||||
| Ls | ||||||||
| Bvlc-Bvlc(F)-L1669 | ||||||||
| Lqua-L1669 |
Publisher’s Note: MDPI stays neutral with regard to jurisdictional claims in published maps and institutional affiliations. |
© 2022 by the authors. Licensee MDPI, Basel, Switzerland. This article is an open access article distributed under the terms and conditions of the Creative Commons Attribution (CC BY) license (https://creativecommons.org/licenses/by/4.0/).
Share and Cite
MDPI and ACS Style
Abate, G.; Corsico, S.; Grasso, S.; Massimino, M.R. An Early-Warning System to Validate the Soil Profile during TBM Tunnelling. Geosciences 2022, 12, 113. https://0-doi-org.brum.beds.ac.uk/10.3390/geosciences12030113
AMA Style
Abate G, Corsico S, Grasso S, Massimino MR. An Early-Warning System to Validate the Soil Profile during TBM Tunnelling. Geosciences. 2022; 12(3):113. https://0-doi-org.brum.beds.ac.uk/10.3390/geosciences12030113
Chicago/Turabian StyleAbate, Glenda, Sebastiano Corsico, Salvatore Grasso, and Maria Rossella Massimino. 2022. "An Early-Warning System to Validate the Soil Profile during TBM Tunnelling" Geosciences 12, no. 3: 113. https://0-doi-org.brum.beds.ac.uk/10.3390/geosciences12030113
Note that from the first issue of 2016, this journal uses article numbers instead of page numbers. See further details here.