
Quantifying Strombolian Activity at Etna Volcano
by
 , ,
, ,
Laura Pioli
1,*, 
Marco Palmas
1,
Boris Behncke
2,
Emanuela De Beni
2,
Massimo Cantarero
2 and
Simona Scollo
2
1
Department of Chemical and Geological Sciences, University of Cagliari, 09124 Cagliari, CA, Italy
2
Istituto Nazionale di Geofisica e Vulcanologia, Osservatorio Etneo, Sezione di Catania, 95125 Catania, CT, Italy
*
Author to whom correspondence should be addressed.
Geosciences 2022, 12(4), 163; https://0-doi-org.brum.beds.ac.uk/10.3390/geosciences12040163
Submission received: 4 March 2022
/
Revised: 23 March 2022
/
Accepted: 28 March 2022
/
Published: 6 April 2022
(This article belongs to the Special Issue Magma Degassing from Magma at Depth to the Surface)
Abstract
:Understanding the dynamics of mild explosive activity is a fundamental tool for hazard assessment at open conduit volcanoes. This is a particularly critical task for Etna volcano. Etna is in fact characterized by frequent, mild explosive activity, punctuated by lava flows and paroxysmal events (‘lava fountains’), which, because of their greater impact, have been the main target for hazard studies, whereas more frequent Strombolian activity has been overlooked. As a result, their impact and associated hazards have been never quantified, despite the extensive monitoring and surveillance activities carried out on this volcano. In this paper, we analyze video recordings of a sequence of Strombolian explosions occurring at the summit craters of Mt. Etna, in Italy, in February 2020. Data were also integrated with a petrographic analysis of collected samples, and drone surveys were performed at the same time as the video recordings. We estimate the frequency of explosions (20–12 per min); particle exit speeds (1–50 m/s), and erupted mass (100–102 kg) of those explosions. A very regular, small-scale activity (marked by a single burst of gas breaking the magma free surface into bombs and lapilli fragments) was occasionally punctuated by larger explosions, (at least one every 5 min), with a longer duration, fed by larger magma volumes, and consisting of two to three distinct pulses followed by a stationary phase. We found that the repose times between explosions follows a log logistic distribution, which is in agreement with the behavior of open vent explosive activity. The four largest explosions of the sequence were analyzed in detail: they emitted particles with median diameters (Mdphi) ranging from −10.1 to −8.8 phi, with bimodal distributions.
1. Introduction
Basaltic eruptions are characterized by a wide variability of eruptive styles, ranging from lava effusion, mild intensity Strombolian explosions, and paroxysmal activity, with the formation of high eruption columns that can reach the stratosphere [1,2]. In this context, explosive activity in the basaltic system requires detailed quantification, as the variability in the intensity and eruptive style constitutes a major obstacle for preventing disasters and forecasting volcanic risks [3,4]. Strombolian activity is often characterized by short and low intensity explosions occurring as sequences that can last from hours to years [5]. The speed of the ejected pyroclasts during this activity can exceed 200 m/s for the finer material, while it typically varies between 50–100 m/s for bombs [5,6]; the pyroclast speed is strongly controlled by the velocity of the gas stream which precedes and accompanies pyroclast emission [7,8]. The explosions are typically associated with the rise of gas pockets, whose rapid expansion leads to the fragmentation and release of bombs, lapilli, variable quantities of ash and, more rarely, a small quantity of lithics [9].
In the last few years, the use of remote sensing techniques has been increasingly and more widely used in studies which aim to better understand eruptive dynamics, and to improve monitoring and surveillance activities [10]. Most methods, however, can detect large amounts of tephra or gas, and quantify large scale (i.e., violent strombolian to subplinian) activity. Moreover, fine volcanic ash is well-detected by both ground-based instruments such as LIDAR [11,12], and satellite-based sensors [13]; radar systems are able to retrieve the main eruption source parameters of paroxysmal activity. Thermal sensors have been widely used since 1965 to map thermal anomalies, to determine the onset of an eruption, lava flow extension, and flow rate, and to investigate explosive activity (see [14] for a review) but also Strombolian explosions [6,15,16]. Other methods focus on investigating the dynamics of degassing, which is associated with open conduit systems using ultraviolet camera imagery on volcanoes such as Stromboli [17] and Etna [18]. When dealing with mild explosive activity, such as Strombolian scale explosions, methods guaranteeing a high spatial (at least cm) and temporal (at least tenths of seconds) scale are required. Usually, automatic detection and quantification of such signals requires capable computing resources. For this reason, quantitative analysis on eruption dynamics is still scant [5,19,20] and is mainly based on video recordings, and on analyzing the activity of easily accessible, frequently erupting volcanoes such as Etna, Stromboli, and Yasur [5,19,21].
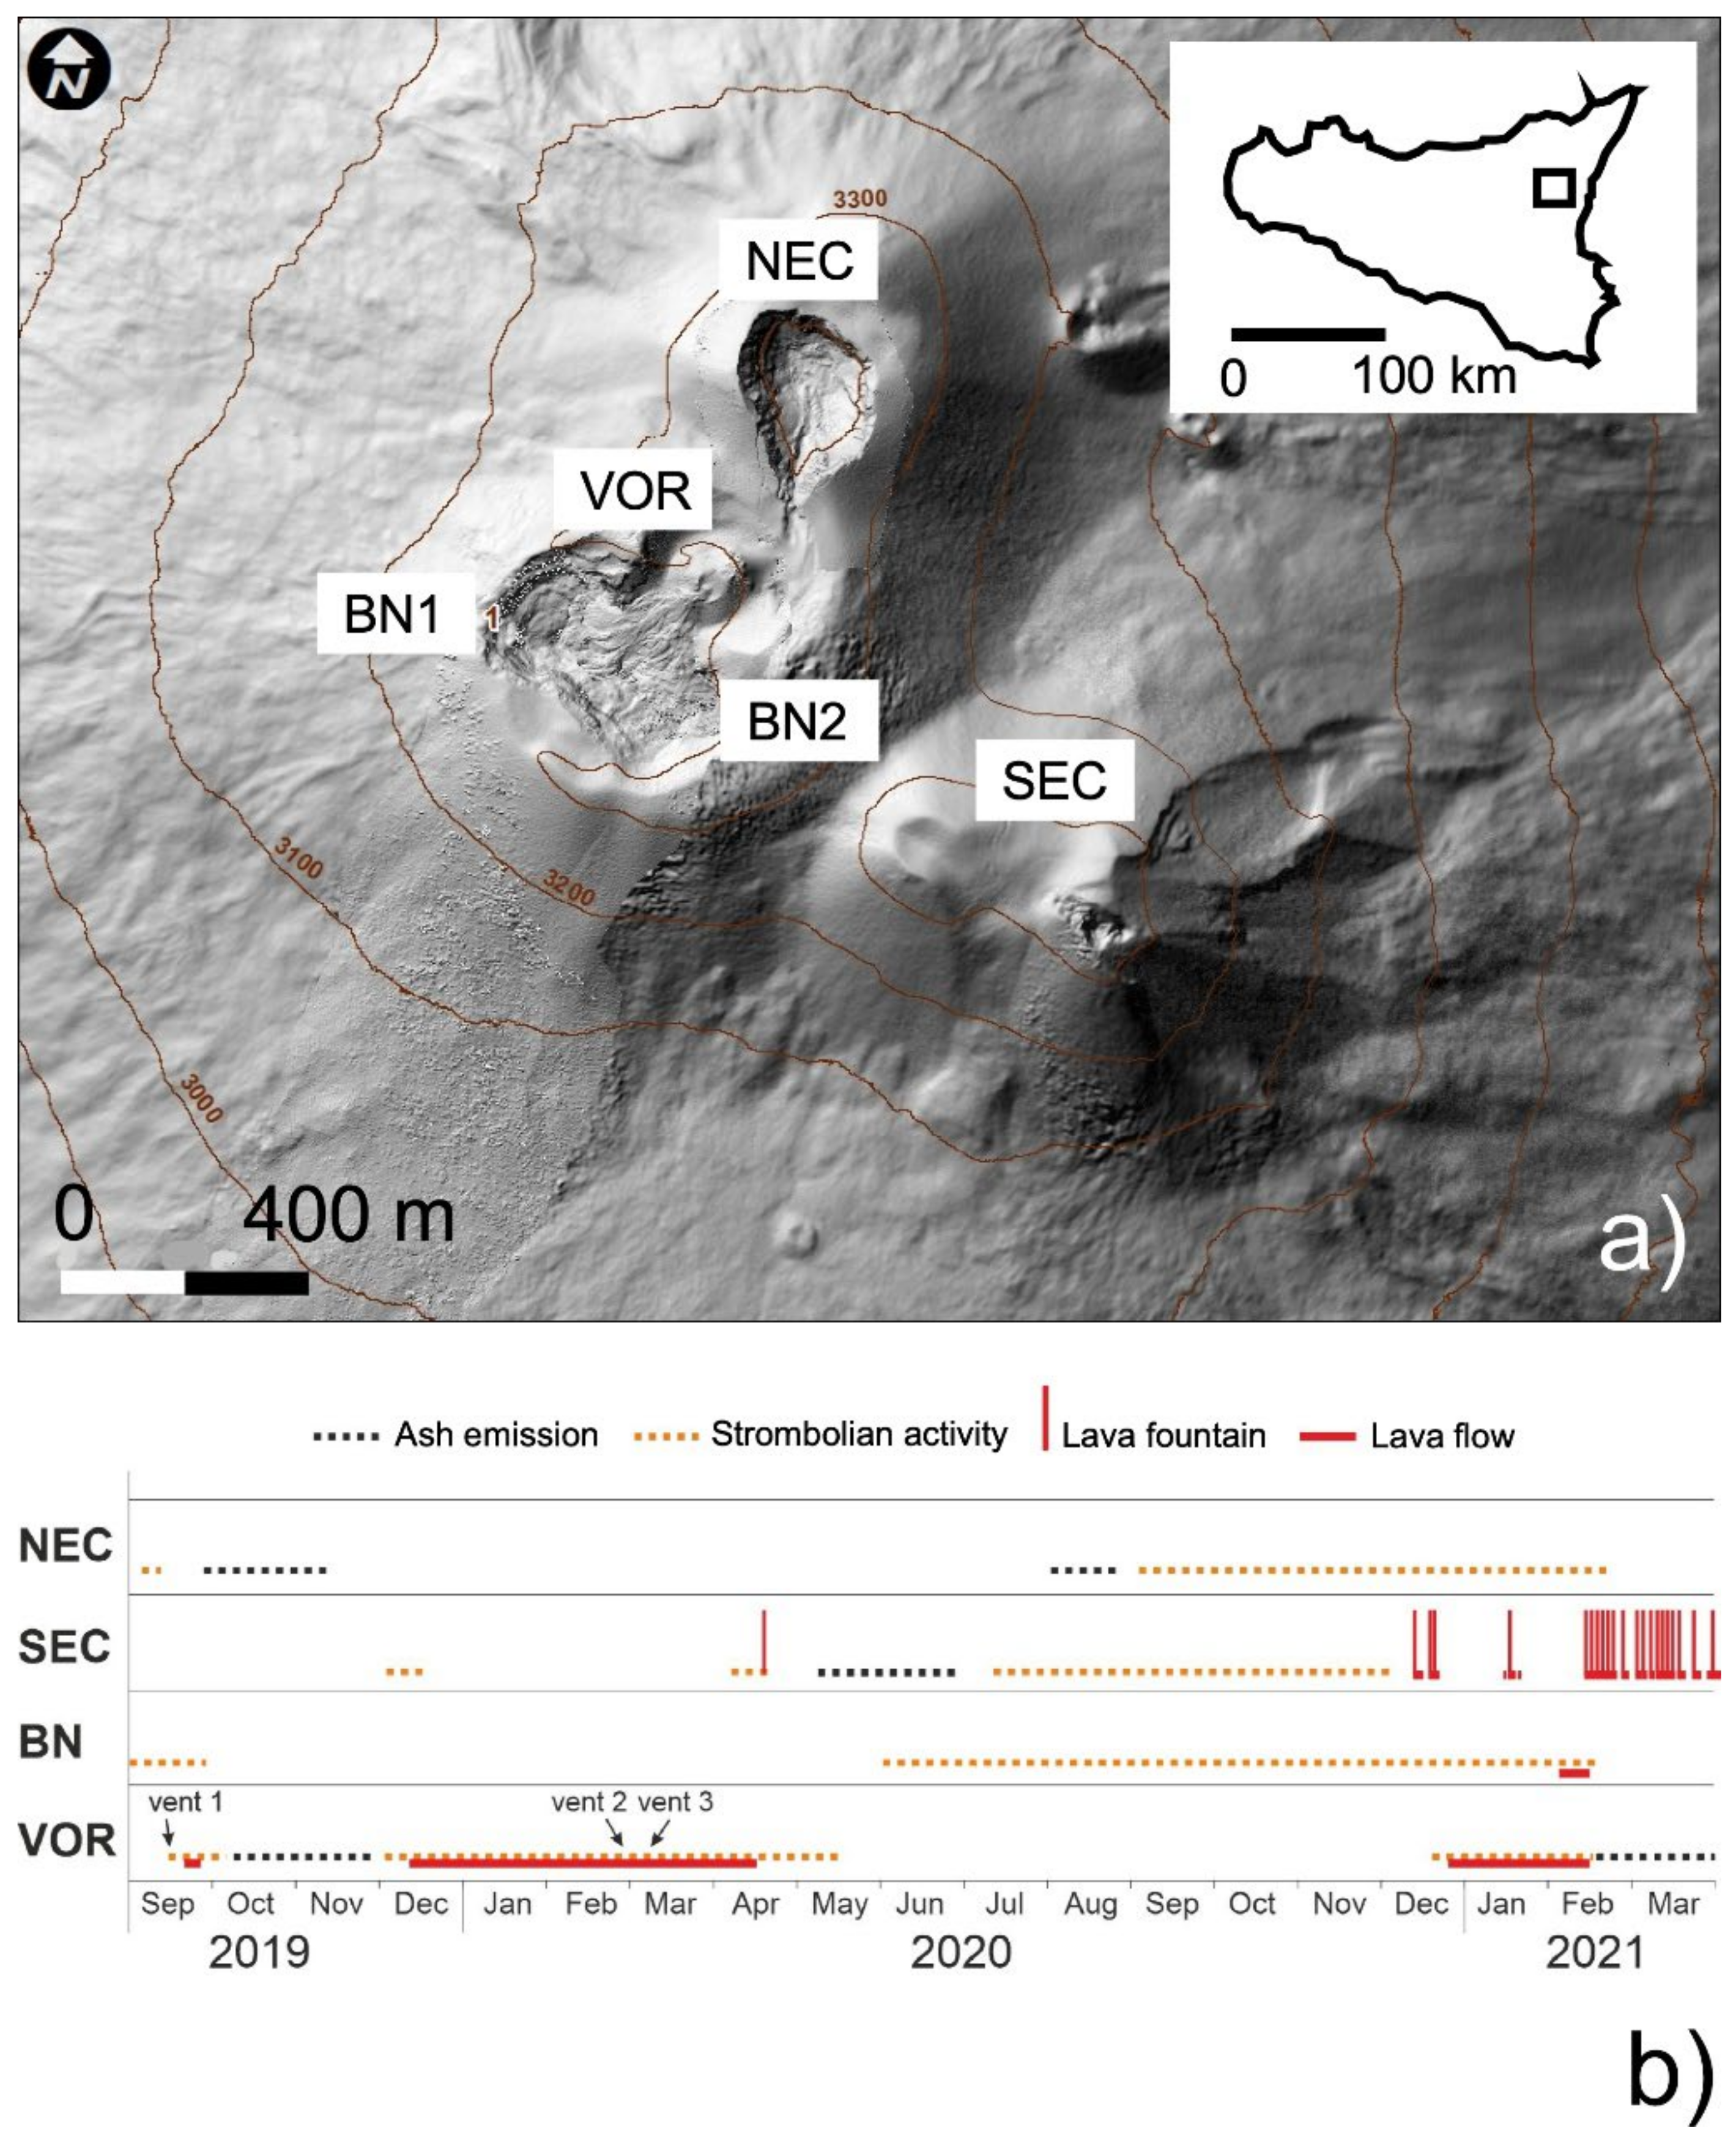
In this study, we focus on Etna volcano, as it is a typical case of an open-conduit mafic system; it is characterized by a highly variable style of activity and is one of the best monitored volcanoes in world. There are four craters (Figure 1), namely Voragine (VOR), Bocca Nuova (BN) (which splits into two minor craters, BN1 and BN2), North-East Crater (NEC), and South-East Crater (SEC) that are involved in both degassing and explosive activity (Figure 1; [22]). Occasionally, explosions are associated with lava emissions from the crater or fractures opening at the base of the cone.
Etna is the subject of many hazard studies quantifying tephra fallout and larger clast sedimentation (e.g., [3,23,24]), as well as the impact of ash emission on human health [25]. Finally, studies of the hazard associated with lava flows are also performed both during and after major events [26,27]. Thanks to these studies, volcanic ash monitoring and forecasting activities have been developed to give rapid information to the Italian Civil Protection which can implement actions to minimize risk during eruptive crises [1,28]. Etna is also one of the most active volcanoes in the world and it is part of the UNESCO list of world heritage sites [29]. Hundreds of thousands of tourists visit the volcano summit daily to watch the summit craters and their activity [24]; however, due to persistent explosive activity, the access to Etna’s summit is often closed off, with only volcanologists, volcanological guides, and journalists allowed to visit. Tourists are allowed to visit the summit craters when the activity is at a low level and only with authorized guides; however, scheduling visits for tourists is not straightforward, due to frequent fluctuations in eruptive status and poor understanding of the volcanic processes by the authorities. A more precise hazard assessment, which would further minimize the risk associated with tourist and scientific activities in very proximal areas, such as the four summit craters, requires not only the quantification of the dynamics of mild (Strombolian) explosions, the average eruptive parameters, and their possible variability within and across each summit crater, but also the effect of crater/shallow conduits’ morphological changes, which are frequent due to the persistent volcanic activity [30]. This work requires collecting statistically relevant data from different craters and several eruptions. In this study, we address this issue by analyzing hundreds of explosions from a never studied before Strombolian sequence at the VOR crater recorded in February 2020 within a field campaign monitoring the ongoing eruptive crisis. The aim of this work is to provide eruption parameters of fundamental relevance for the quantification of the activity, and thus, the associated hazard.
February 2020 Activity
Explosive activity resumed at VOR on 12 September 2019, after more than three years of quiescence, and rapidly built a scoria cone in the central portion of the crater. Lava effusion from a vent at the base of the scoria cone was first observed on 19 September, and continued intermittently into early December, when it became continuous. The lava cascaded into the deep pit of the adjacent BN and began to fill the crater, which had been subsiding continuously after the paroxysmal eruptions at the VOR in December 2015 and May 2016. These eruptions had filled BN with pyroclastics (about 7 × 10⁶ m3; [22]) and lava (approximately 3 × 10⁶ m3; [31]), leading to lava overflowing onto the western flank of the volcano. Renewed subsidence of BN started in October 2016, which led to the progressive enlargement and deepening of the collapsed area; by mid-2019 the crater had largely recovered its pre-2015 morphology.
During the second half of February 2020, Strombolian and effusive activity were continuing at the VOR, with minor fluctuations from day to day. This activity produced explosions at intervals of a few minutes, forming clasts which reached heights of 150–200 m. The effusive activity took place from a vent on the southern flank of the new scoria cone (Figure 2b). The lava flows spread out in the western portion of BN at about 3310 m a.s.l., while a new collapse depression was starting to form in its central part. This represented the classic “persistent activity” [32], which often occurs at Etna’s summit craters, either for prolonged periods [33], or during the early and late phases of paroxysmal eruptive episodes [5,34].
Activity at NEC and SEC was instead characterized by sporadic ash emissions and degassing, respectively. Over the next few weeks, explosive activity increased, and two new vents opened on the northern and eastern sides of the scoria cone, whereas effusive activity gradually diminished; all activity at the VOR ended in mid-May 2020. By that time, the focus of eruptive activity had started shifting toward the SEC, heralding a major eruptive period with numerous paroxysmal eruptive episodes in 2021 [35]. Explosive activity accompanied by sporadic lava effusion once more took place at the VOR between December 2020 and April 2021.
2. Materials and Methods
Videos and pictures of the eruption were collected on 25th February 2020 from various locations on, and nearby, the VOR (Figure 1), using a Nikon Coolpix P1000 camera equipped with a 4.3–539 mm optical zoom and sensor size of 6.16 × 4.62 mm. The camera acquired pictures and videos at 1080 × 1920 pixels and 25 fps resolution. At the same time, 147 aerial images were acquired with a CMOS of 20 MPx camera mounted on a DJI Mavic 2 Pro quadricopter flying at an altitude ranging from 3500 up to 3800 m a.s.l. Due to the extremely dangerous situation, it was not possible to set out ground control points on the field, thus the georeferencing of the obtained Digital Elevation Models (DEMs) have been refined by aligning them with a 2014 DEM [36], following the technique already tested by [37,38].
Lava and scoria cone volume has been calculated by DEM subtraction [39]. The pre- and post-eruption surfaces are two DEMs obtained from images taken on the 4th of July 2017 and 25th of February 2020, respectively [38]. Volume was calculated using the ArcGIS Cut and Fill tool (3D Analyst toolbox) that enables the creation of a map based on two input surfaces, before and after the eruption:
where X is the linear dimension of the square DEM cells, and is the height difference between the post and pre-eruption surfaces for each pixel within the lava flow, whose number is n [38,39]. Errors on the volume estimate have been calculated from the standard variance propagation law as follows:
taking into account that the only measurable or perceivable error in the DEMs is the vertical one ([38] and reference within); therefore, the maximum error for the volume calculation is linearly dependent on the standard deviation of the height variations calculated inside the regions where no change occurred. Considering that the subsidence affected the BN crater floor (Figure 1), the DEMs difference is not useful for calculating the volume of the lava flow into it. For this reason, the lava volume has been obtained by a planimetric approach (area x average thickness). The average thickness has been calculated by dividing the volume of the lava flow into the Voragine crater by the covered area. This approach allowed us to estimate a minimum volume because lava flow generally thickens in flat areas such as the crater floor.
Videos and images were calibrated based on one DEM and one orthomosaic obtained by combining the aerial pictures. Four videos taken from two different positions on the crater rim (Figure 2, Table 1) were analyzed in detail to gather information on the eruptive activity and to quantify eruption parameters. The videos were split into individual frames and studied with image analysis techniques using the Fiji software [40]. Vertical exit speeds were measured for each explosion, based on the maximum height reached by the jet and considering their gravitational effects. For explosions where the particles rose beyond the camera Field of View (FOV), instantaneous velocities were calculated by measuring the distance traveled between 2–3 consecutive frames and calculating their reverse path based on their positions (above the vent) [41]. Temporal parameters were calculated from each explosion based on criteria shown in Table 2 and statistically analyzed.
The four largest and longest explosions of the sequences were selected for in-depth analysis of their dynamics. Selected particles were manually tracked using the ImageJ plugin MTrackJ to provide above vent height and 2D particle velocities. For each explosion sequence of frames, one in every five was selected, starting from the onset image in order to avoid repeated counting of the same particle. In these frames, particles larger than 5 px2, intersecting a window 100 px high, and as large as the jet set just above the crater rim, were counted and measured.
For a first order assessment of the mass ejected in the explosions, we selected one frame for 78 random explosions; the frames were selected based on the atmospheric conditions (i.e., the intensity of degassing), to allow for better thresholding and particle identification. In these frames, particles were counted and their areas and equivalent Feret diameters were measured. Particle volume was calculated by multiplying the particle area by the minimum Feret diameter (as automatically calculated from thresholded images by Fiji macros), which was multiplied by the scoria density to retrieve its mass, based on the method suggested by [41], which assumes roughly equidimensional shapes of the clasts.
To quantify the dynamic regimes controlling conduit flow and magma fragmentation in the jets, the properties of magma (density, viscosity) were estimated. They were necessary for a first order calculation of Ohnesorge (Oh) and Reynolds (Re) numbers which are fundamental for quantifying fragmentation conditions [42]:
with ρm = magma density, η = magma viscosity, U = exit velocity, σ = surface tension, D = jet diameter.
Particle density and crystallinity was estimated based on two thin sections cut from two lapilli collected on 17 February and emitted the previous days, when the activity was of similar intensity. Particle vesicularity and crystallinity were measured using point counting techniques; particle density was estimated based on a DRE density of 2890 kg/m3 [41]. Unfortunately, it was not possible to recover samples on 25 February for safety reasons.
3. Results
3.1. Field Observations and Particle Properties
At the time of our 25 February 2020 survey, Strombolian and effusive activity was taking place at the scoria cone that had started growing on the crater floor of the VOR in September 2019 (Figure 3a,b). The cone had grown 66 m above the former crater floor at an elevation of 3264 m a.s.l. and had reached the elevation of the highest (eastern) crater rim at 3330 m a.s.l. (Figure 4a). Strombolian explosions occurred from a single vent as sequences of minor bursts, followed by stronger ones, and more rarely as isolated explosions. Incandescent bombs and scoriae were thrown several tens of meters above the vent and fell back onto the cone (Figure 4c,d). A few fresh scoriae were also found on the VOR/BN crater rims, such as the scoria sampled on 17 February, though none fell there during the observation period. Lava oozed from a single vent on the upper southern slope of the scoria cone, feeding a narrow flow that descended toward the nearby BN (Figure 4a,b), bifurcating into two lobes before spreading out fanwise in its western portion (Figure 3b). During the several hours of observation, the activity underwent no appreciable variations. The lava flow covered an area of 3.5 × 10⁴ m2 (Figure 3c), the minimum lava flow volume emitted until the day of the survey is 6.18 ± 0.35 × 10⁵ m3. The scoria cone with an elliptical base elongated in an ENE direction has a basal area of 2.02 × 10⁴ m2 and the resulting volume is 6.69 ± 0.36 × 10⁵ m3.
Analyzed scoria has a crystallinity of 28 ± 3 vol % and a vesicularity of 56 ± 1 vol %. Based on a DRE density of 2890 kg/m3 [43], these values suggest an average scoria density of 1271 kg/m3.
Taking into account the eruption duration (166 days, namely the interval between the eruption beginning and the day of the survey), that lava has the same DRE density as above, and assuming an average vesicularity of 30 vol %, we calculated an average lava effusion rate of 9 × 10² kg/s. Moreover, assuming the same scoria density as the scoria sampled, and a cone vesicularity of 23% (due to close packing of scoria), we obtain a scoria mass of 6.6 × 10⁸ kg, which converts to an average magma feeding rate of 46 kg/s.
3.2. Statistical Analysis
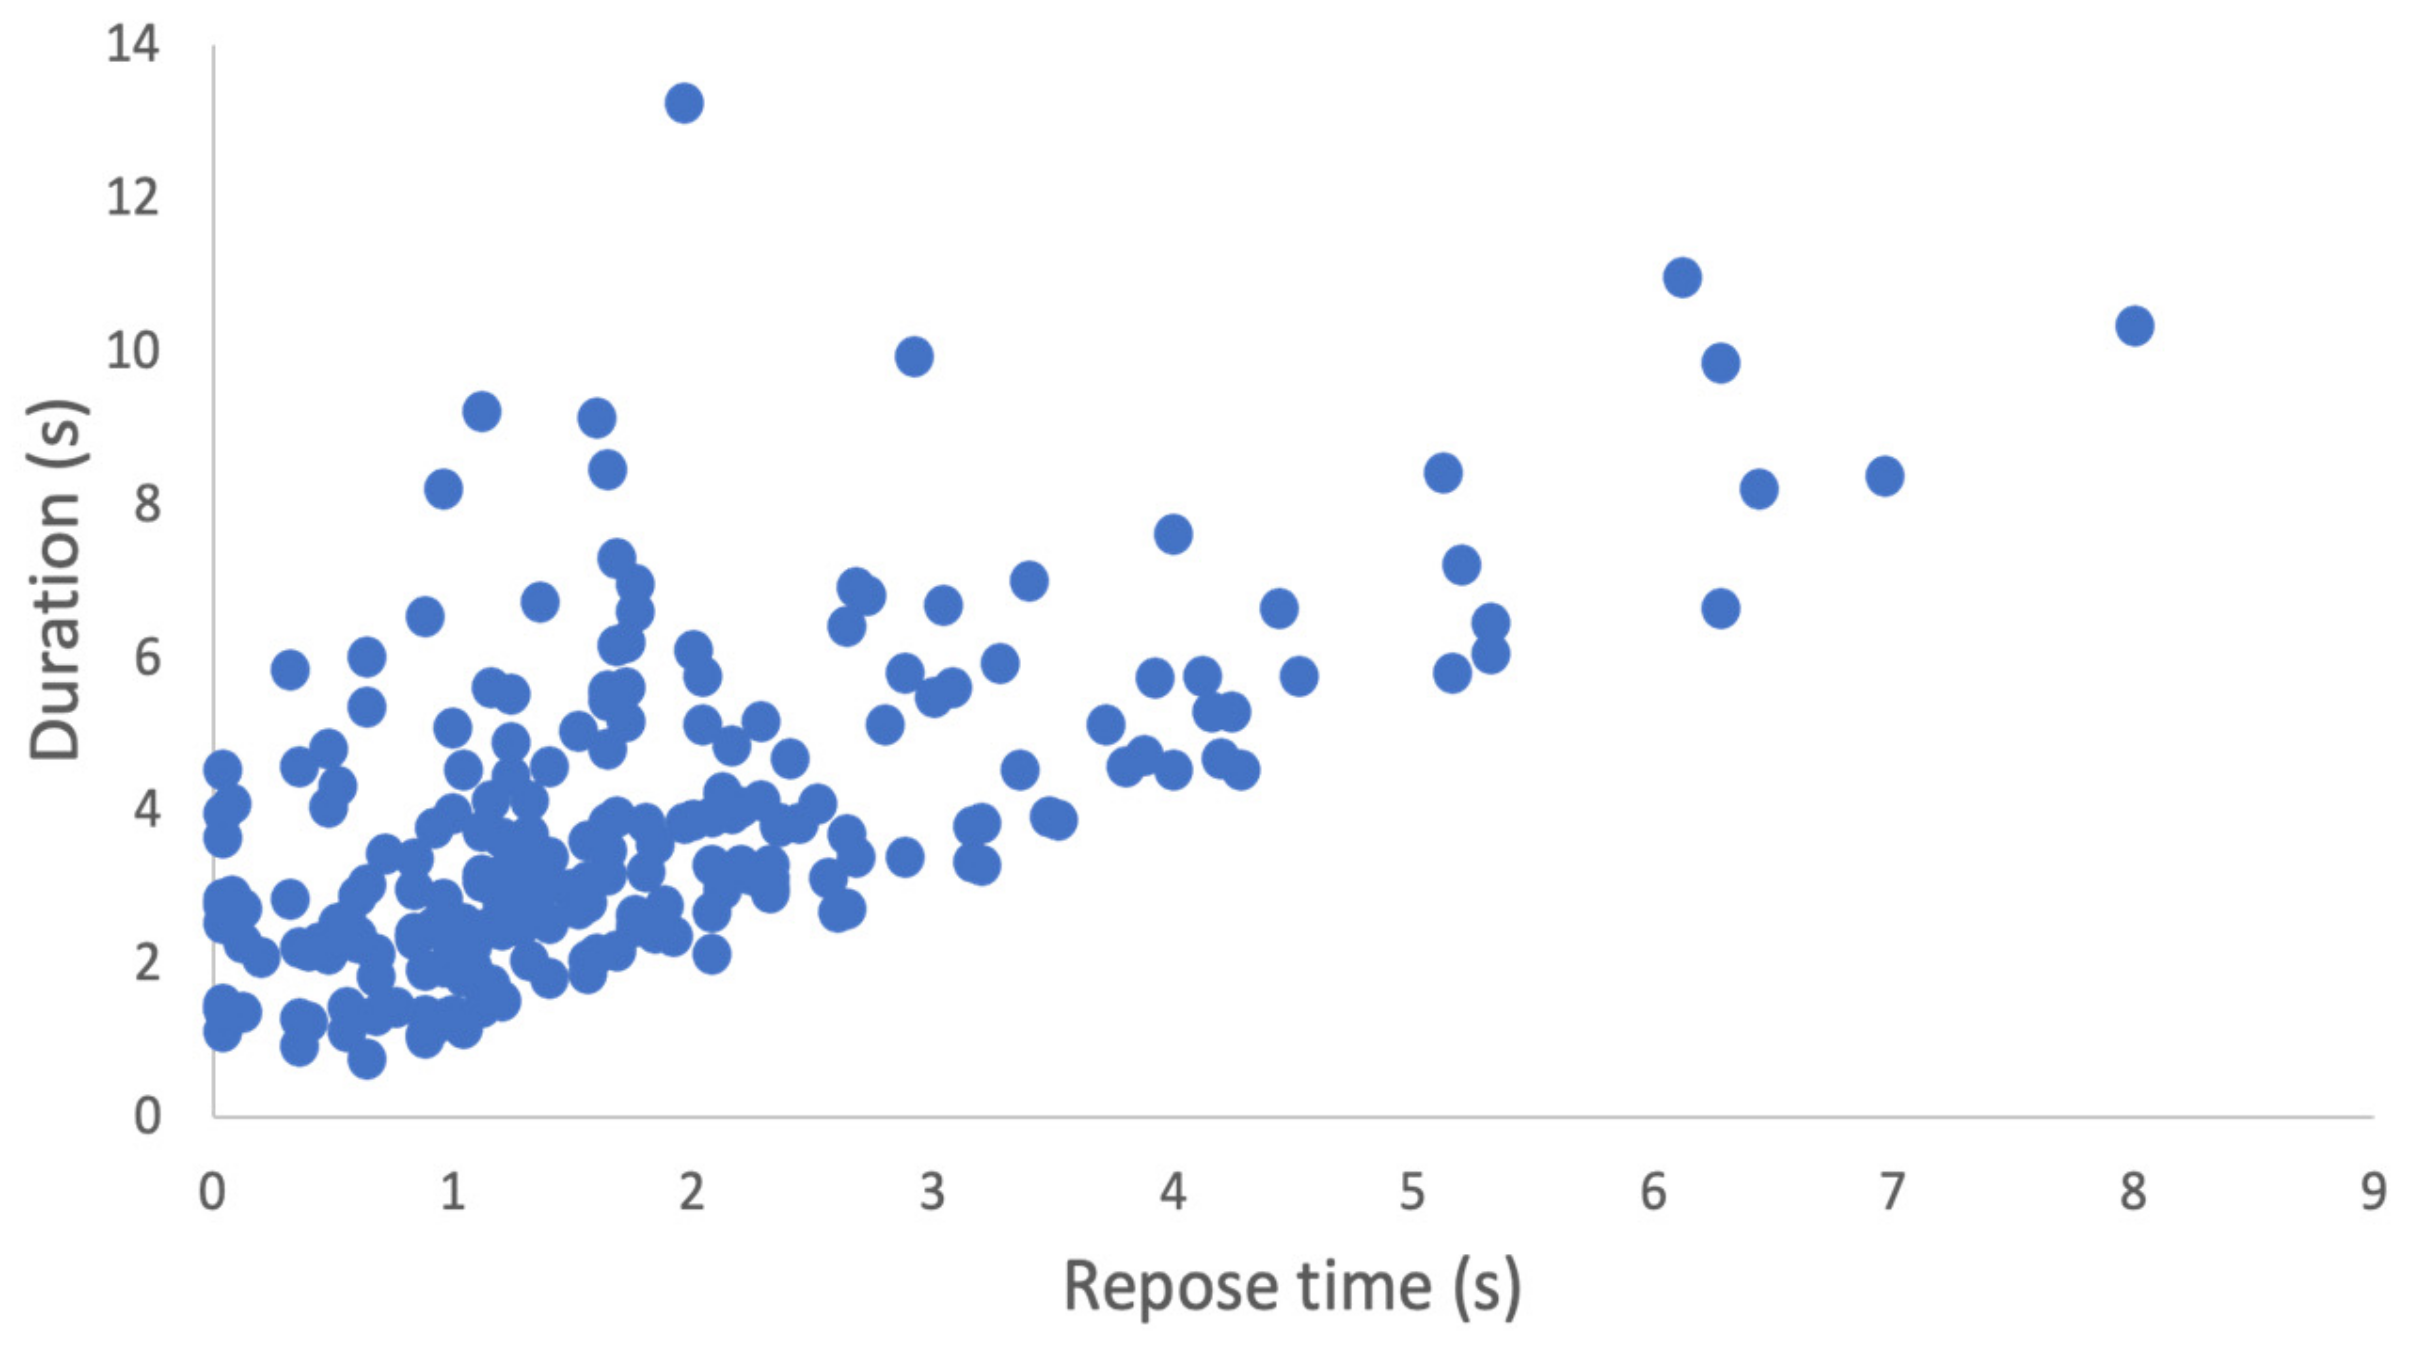
A total of 222 explosions were recorded (Table 1). The explosions ranged in duration and intensity; their duration varied from 0.04 (i.e., they were visible only in one frame) to 6.96 s with very similar median values in the recordings (Table 3). The repose times range from 0.76 to 13.2 s, and on average, are largest in video 4, compared with the others (Table 3). Repose times generally increase with increasing eruption duration. Data from different videos are slightly shifted, suggesting some fluctuation in the activity. We notice a linear correlation between the two parameters, with a larger scattering for events shorter than 2 s: long events are better correlated than short events to repose times. Recording 4 displays significantly different results compared with the others, and is marked by the lowest eruption frequency and the highest percentage, probably due to the larger FOV, compared with the other recordings (Figure 5).
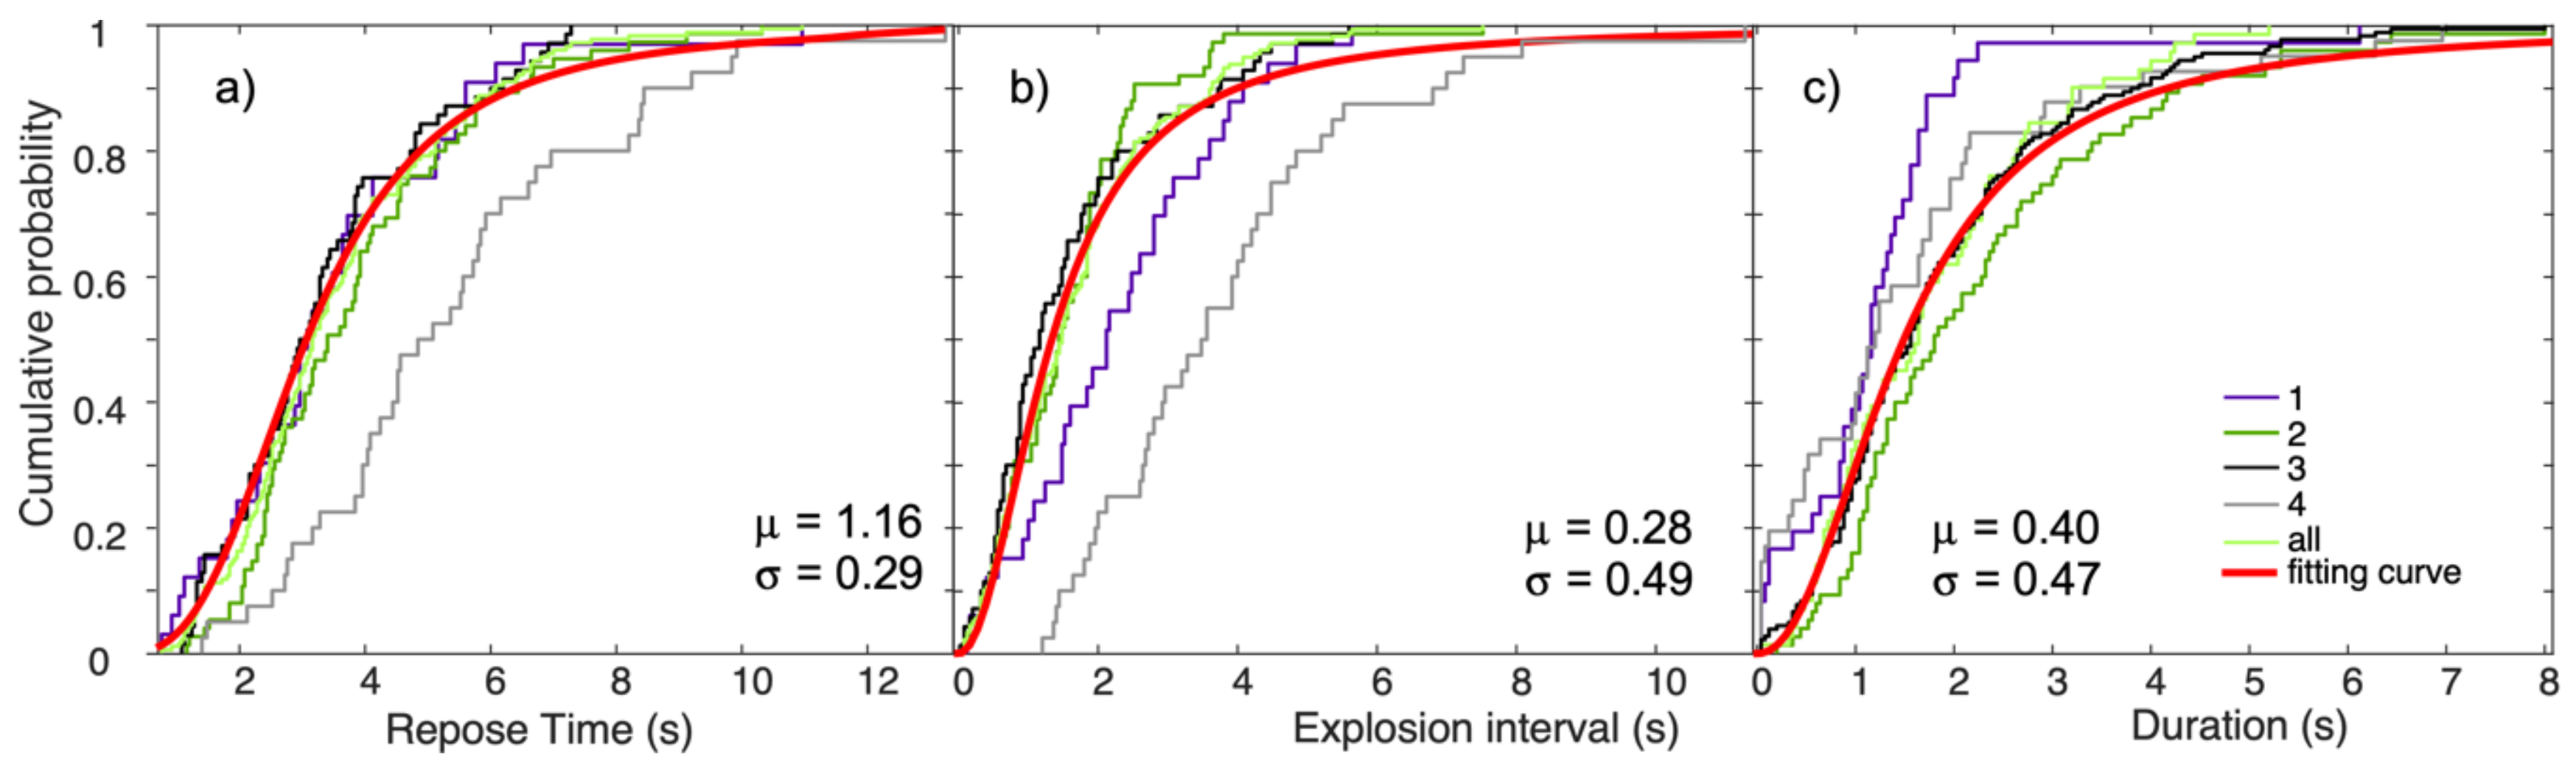
Repose times, duration, and times between eruptions are not autocorrelated and distributed as log logistic functions (Figure 6). Due to their similarity in shape and median values, all distributions except recording 4 were merged; the corresponding distribution was best fit by a log logistic distribution, whose fit parameters are shown in Figure 6.
Measured vertical exit speeds range from 1.3 to 47.7 m/s and reach maximum values in the largest explosions (chapter 3.2). They do not correlate with explosion duration, interval, or repose times; they cluster around the median value of 20.3 m/s and are marked by a symmetrical distribution (Figure 7a). In each of the selected explosions, 8 to 1060 particles were counted. They corresponded to total masses ranging from 1.5 to 2780 kg, with a median of 108 kg (Figure 7b); about 40% of explosions have erupted masses ranging from 100 to 500 kg. Taking into account the periodicity of the explosions (Table 3), the measured masses correspond to an average magma feeding rate of about 3 × 10 kg/s.
3.3. Main Explosion Dynamics
Four explosions were selected as the largest and longest of the sequences (Table 4). They also had more complex dynamics developing into two to four phases, whereas the others consisted of a single, short-lived pulse (Table 4).
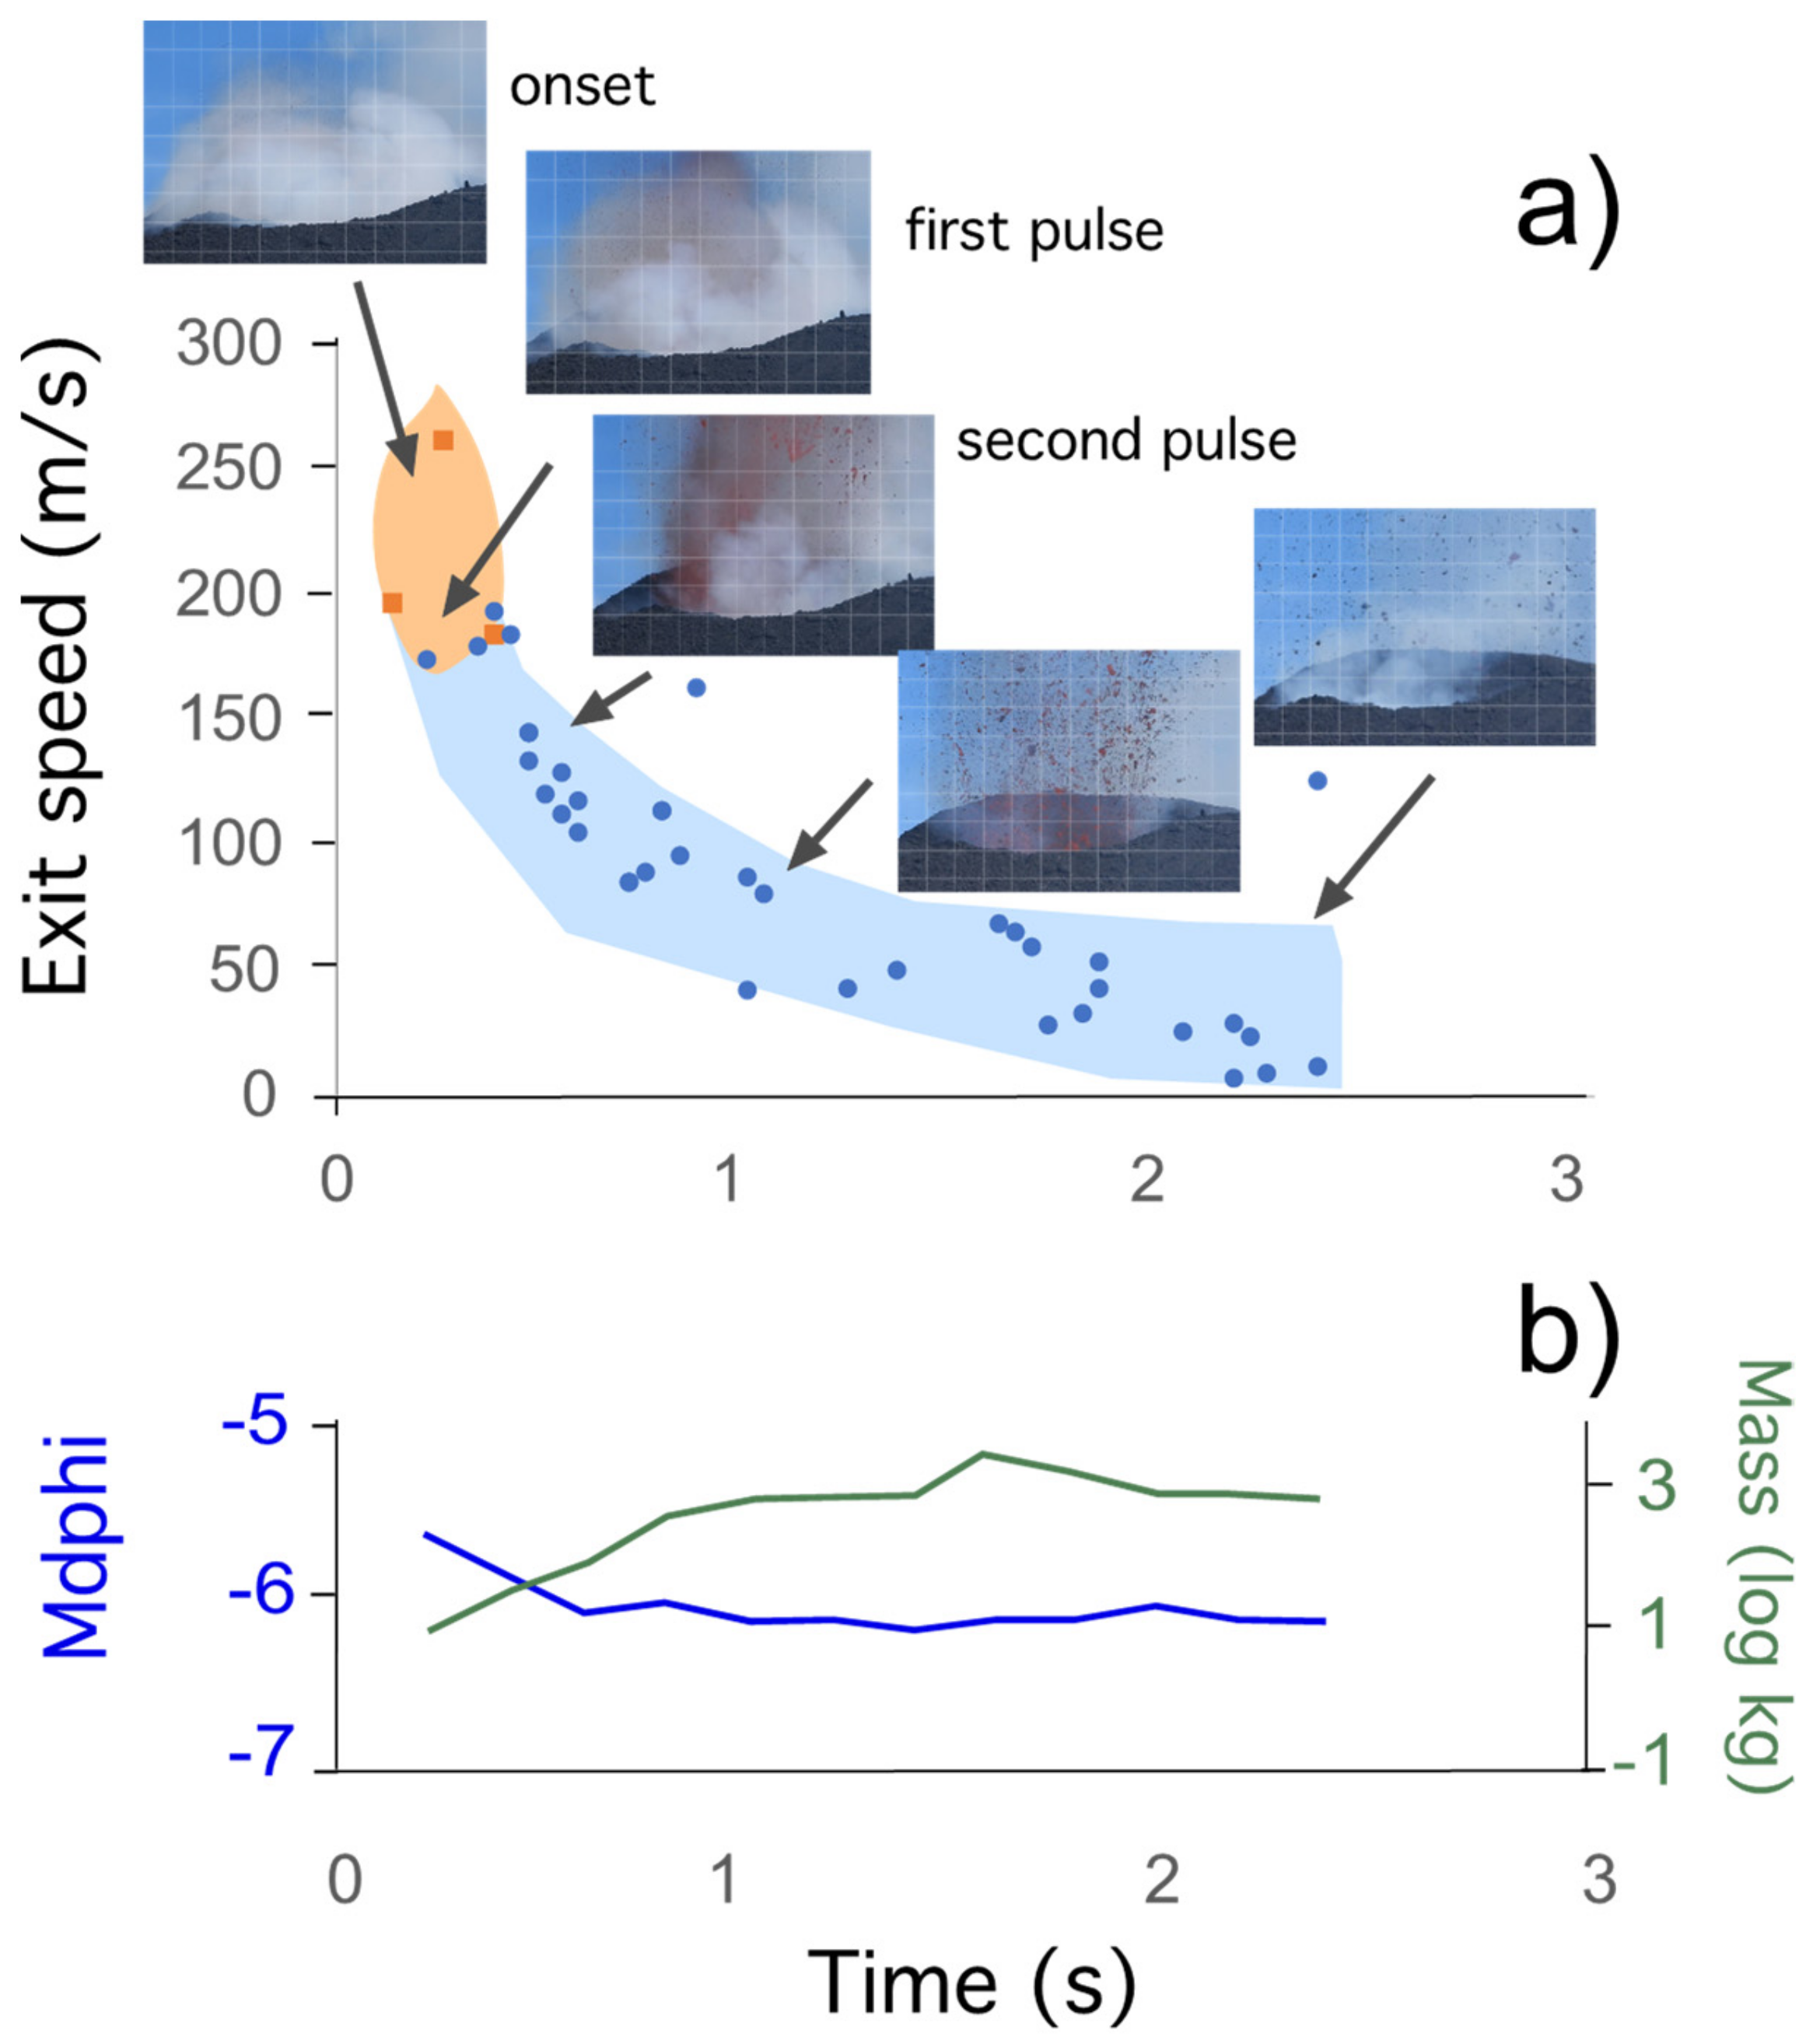
The four largest explosions were all marked by an initial transient phase consisting of one–two pulses that were marked by a vertical jet of gas and pyroclasts, followed by a stationary, approximately 2 s long phase where the jet had constant particle concentration and speed (Figure 8). The multiphase nature of the explosions was clearly visible after analyzing the ejection speed of particles emitted with time (Figure 8a). In the onset phase, only gas and rare particles are emitted. The maximum speed for both gas and particles are attained in the first pulse, where gas ejection velocity reaches up to 260 m/s, dragging volcanic aerosol; bombs are then dragged by the gas stream to speeds of up to 150 m/s; then, the particle exit speed decreases to about 10 m/s until the explosion ends. The fast, non-linear decay trend of particle speed (and gas velocity) is observed in all four major explosions. In addition, there is no significant change in measured median particle size (Figure 8b). Measured instantaneous erupted mass is very low for the onset, and rapidly increased from the first pulse, becoming almost constant (103 kg) in the steady phase. Data in Figure 8, however, do not show the large amount of small particles which are visible in the jet, but are not detected by image analysis.
The distribution of particle sizes detected by image analysis is truncated for particles with visible areas smaller than 5 px2 (i.e., 5–6 phi diameters). They could, however, be considered representative of the mass ejected, as suggested by the particle size distributions (Figure 9), which show that the majority of the mass emitted consisted of particles larger than phi −7, which is well above the minimum size detected by our analysis. The distributions of explosions 1e, 2e, 3e are bimodal, whereas explosion 4e is unimodal. The maximum size of measured particles range from −11 phi to −9.5 phi.
4. Discussion
4.1. General Eruption Dynamics
The explosive sequence of the VOR crater analyzed in this study presents the classic properties of Strombolian activity, such as the very regular periodicity (Figure 4), the limited mass of pyroclasts that erupted during a single event (100 to 104 kg), and the magma feeding rate (3 × 10 kg/s), which classify it within the low intensity endmember [9,43]. Results are also in agreement with previously published studies of Strombolian activity at other summit craters at Etna (i.e., BN: [18,44,45]).
Classical models of Strombolian activity associate explosions with the rise of gas pockets or slugs within an open conduit, and they assign a major role to magma degassing in controlling this style. Even for constant outgassing rates, gas bubbles decoupled with magma tend to cluster and eventually coalesce, because bubble rise velocity decreases with bubble volume concentration. Bubbles will slow down when interacting with each other and concentrate, forming gas-rich regions rising in the conduit [46]. In light of this, the periodicity of Strombolian explosions directly reflects the interplay between degassing rates, slug/bubble cluster rise speed, and spacing in the conduit [47,48]. Although the slug/cluster rise speed depends on magma properties, conduit geometry (which control the Froude number), and magma rise rate [49], their spacing decreases and their length increases with increasing gas flow, eventually transitioning to churn and annular flow regimes [50,51]. Within the sequences studied in this work, explosions and their durations distribute in time as log logistic functions. Log logistic distributions are unimodal, skewed, two-parameter, increasing failure rate models with wider tails than log normal distributions, which involve a larger probability of ‘extreme’ events [52]. Statistical studies on explosion sequences [45] showed that log logistic distributions describe the periodicity of explosive sequences of various styles well, and that the median of repose times correlates with magma viscosity (which, in turn, controls gas rise velocity). They also showed that the shape of the distribution generally correlates with the median response time; the smaller the shape parameter the more regular the activity (i.e., the shorter the tails of the distribution). In the sequence studied here, we observed a positive correlation between explosion durations and repose times; this relationship suggests that explosions might be marked by a similar mass eruption rate, and thus, their duration is proportional to the mass emitted. In a steady system (i.e., when magma feeding rate is constant), this correlates with the time needed to recharge the system and thus the time required for feeding the following explosion (i.e., the repose time). We anticipate that this characteristic, even if not previously identified, could be relatively common in Strombolian systems.
We also note that the eruption at VOR was split among two vents, each marked by a distinct eruption style (Figure 10). The majority of magma was emitted at the lava vent, within the same cone structure, and a few tens of meters below the Strombolian vent. As previously suggested by experimental models, such a system implies a conduit bifurcation within the cone itself, and gas segregation in the vertical conduit structure which feeds the explosive activity [53]. The bifurcation is formed in the cone itself, due to the burial of the active lava flow by cinder. The explosive activity was then not only associated but directly correlated with lava emission because they are both connected to the same conduit [54]. Calculations on the volume of the scoria cone and the lava flow suggest that during the September 2019–February 2020 activity, the average magma feeding rate was in the order of 102 kg/s. This is a low-end member eruption of Etna [5], for which no significant tephra blanket formation is expected [53]; however, calculations show that the ratio between effusion and the explosion rate was at least 1:2, suggesting that a significant volume of magma was involved in the explosive manifestations.
4.2. Strombolian Dynamics
In the studied sequences, most explosions were single-pulse transients where a limited amount of magma was dragged and fragmented by the gas stream reaching the free magma surface. Only a limited number of explosions (about one every 3–4 min) showed a more complex dynamic, suggesting the emission of a larger gas volume and distinct rise dynamics of the gas in the conduit. Constant mass discharge rates, associated with a rapid decrease of ejection velocity were already observed at Stromboli [5,16], BN [54], and Yasur [19], and were modeled as the evacuation of a gas slug and its wake; we agree with this hypothesis, which implies that the major Strombolian events (the four largest explosions) are formed by large gas slugs, whereas the minor explosions, which are closely spaced, should be associated with gas pockets/bubble clusters of smaller volumes, analogous to the so called ‘puffing’ activity (i.e., the periodic outgassing of a magma column at open vent systems, [55,56].
Based on the data collected here, and following the method of [16], we calculated the Reynolds number of the explosion jet to gather information on the magma fragmentation regime. We assumed a shallow (i.e., in the cone structure) conduit diameter between 1 and 5 m, a magma viscosity ranging from 2–3 log Pa s [45], and calculated a representative magma rise rate based on the average mass erupted per explosion, its duration, and a gas fraction of 0.5 [48]. We obtained maximum Ohnesorge numbers for the jet at around 1 and a range of Re comprised between 10−1 to 101. These conditions suggest that the main role of capillary forces is magma fragmentation (Oh), with a possible contribution of shearing forces (and thus formation of a significant number of small particles, [57,58]), but only in the onset phase of the larger explosions (Figure 8) when particles in the gas stream attain velocities exceeding 150 m/s. In this case, the particle size distribution should be very similar in all explosions, and independent of the jet speed. The median size of the particles should correspond to the size of the capillary instabilities associated with magma stretching and acceleration [59]. We observed that this appears to be a low energy activity, and fragmentation dynamics is closer to low intensity Hawaiian explosions such as Piton de la Fournaise [41], rather than average explosions at Stromboli [42].
Finally, we noted that the size distribution of particles from the four largest eruptions of the sequences show a bimodality, which is not typical of Strombolian events recorded elsewhere (i.e., Stromboli, Yasur [6,19]). The occurrence of two main size modes suggest the involvement of two slightly different magma types, marked by a different crystallinity (and thus, viscosity). A crystal rich magma component was identified at Stromboli from both direct observations and clast textural studies [60,61]. It was interpreted as being degassed, with cold magma accumulating at the top of the conduit. Within this model, the occurrence of occasional larger explosions could be due to temporary clogging of the vent. Images of the explosions we recorded show a constant recycling of the larger clasts (Figure 4d), which could progressively accumulate at the bottom of the crater, eventually agglutinating into a lower permeability plug. A lack of samples of the activity of that day prevents specific textural studies which would confirm this hypothesis.
4.3. Hazard Implications
In this paper, we focus on the dynamics of typical Strombolian activity occurring at Etna; hence, this study has important implications for the hazard assessment, as it produced mild explosive activity. Hazard zones affected by the fallout of large clasts (>5 mm) mainly depend on the dynamics of the explosions [60]. During more intense explosive activity, the larger particles can reach great distances from the vent (e.g., 5–6 km from the vent), such as the one that affected tourist areas in 2013 at Etna [24,62]; although, during the mild explosive activity of September 2019–February 2020, volcanic particles fell near the vent, building a secondary cone within the Bn crater, which provided significant information. Indeed, when the activity is at a low intensity, the proximal area is accessible to scientists, journalists, and volcanology guides leading tourist trips. For this reason, a correct assessment of the hazard associated with this activity is critical. During our observations, it was mainly volcanic particles that built the new scoria cone (Figure 10) and never reached the rim of BN and VOR. However, fresh scoria was collected at the rim of BN three days before, suggesting the occasional occurrence of Strombolian explosions at a greater intensity than, or a different ejection angle to, the ejected particles. Based on models of gas segregation during magma rise across conduit bifurcations [63], we also suggest that any increase in the magma feeding rate would have resulted in an increase in explosivity, and at the same time, an increase in lava flow rate. Moreover, as the volcanic vent could grow during a persistent eruptive activity [38,64], particles could also reach a larger distance due to the morphological changes of the new pyroclastic cone. Consequently, any small variations in volcanic activity and/or the morphological features of the pyroclastic cone should be considered when people approach the summit area during mild explosive activity, as they often underestimate the associated hazard. For this reason, we suggest that further studies quantifying both gas emission and lava effusion rate, coupled with assessment of the intensity of the Strombolian explosions (for example, by monitoring the maximum height reached by the explosion jet), could provide crucial data for devising a quantitative model on the activity. This model should be aimed at quantifying and forecasting conditions, leading to an increase in the explosivity of the Strombolian sequence and the occurrence of larger intensity (i.e., paroxysmal) explosions which could impact the area that is usually open for guided tours or monitoring activities.
5. Conclusions
The analysis of videos of Strombolian activity occurring at the VOR crater of Etna in February 2022 showed that:
- explosions occurred in swarms, each on average were 3 s apart, and distributed as log logistic functions, they erupt 108 kg on average;
- explosion duration and repose times were correlated, suggesting constant feeding rates. The average magma feeding rate was about 3 × 10 kg/s;
- vertical exit speeds of pyroclasts ranged from 1.3 to 47.7 m/s, with the exception of large, high intensity explosions where they reach speeds exceeding 150 m/s;
- in large scale explosions, particle size distribution had median values ranging from −10 to −9 phi, with good sorting;
- the magma feeding rate partly converted during the lava effusion rate, implying a regime of decoupled degassing controlling the mild explosive activity;
- both lava emission and the explosive system should have been in a steady state;
- despite its low intensity, the study of the September 2019–February 2020 eruption provided significant information for a better assessment of the hazard associated with Strombolian activity at Etna.
Author Contributions
Conceptualization, L.P. and S.S.; methodology, L.P.; field data collection B.B., E.D.B. and M.C. image analysis, M.P., L.P. and S.S.; E.D.B. volume calculations and mapping; writing—original draft preparation, L.P. and S.S.; writing—review and editing, all the authors. All authors have read and agreed to the published version of the manuscript.
Funding
B.B., E.D.B. and M.C. acknowledge the funding provided by the Italian Presidenza del Consiglio dei Ministri—Dipartimento della Protezione Civile (DPC) for the fieldwork and UAS survey. This paper does not necessarily represent DPC official opinion and policies. The research was also supported by the EU e-shape (grant agreement: 820852) for S.S. and by the INGV project Pianeta Dinamico (CUP D53J19000170001), funded by MIUR (“Fondo finalizzato al rilancio degli investimenti delle amministrazioni centrali dello Stato e allo sviluppo del Paese,” legge 145/2018), Tema 8—PANACEA 2021 for S.S. and B.B. L.P. acknowledges the project Fondazione di Sardegna 2018 (CUP F74I19000960007).
Data Availability Statement
Videos and maps are stored in INGV servers and are available on request to E. De Beni and B. Behncke.
Acknowledgments
We would like to thank the technologists and technicians of INGV-OE for the camera network maintenance. We thank Lucia Miraglia and Rosanna Corsaro for storing the samples at the rock repository of INGV-OE.
Conflicts of Interest
The authors declare no conflict of interest.
References
- Scollo, S.; Prestifilippo, M.; Bonadonna, C.; Cioni, R.; Corradini, S.; Degruyter, W.; Rossi, E.; Silvestri, M.; Biale, E.; Carparelli, G.; et al. Near-Real-Time Tephra Fallout Assessment at Mt. Etna, Italy. Remote Sens. 2019, 11, 2987. [Google Scholar] [CrossRef] [Green Version]
- Andronico, D.; Cannata, A.; Di Grazia, G.; Ferrari, F. The 1986–2021 paroxysmal episodes at the summit craters of Mt. Etna: Insights into volcano dynamics and hazard. Earth-Sci. Rev. 2021, 220, 103686. [Google Scholar] [CrossRef]
- Scollo, S.; Coltelli, M.; Bonadonna, C.; Del Carlo, P. Tephra hazard assessment at Mt. Etna (Italy). Nat. Haz. Earth Syst. Sci. 2013, 13, 3221–3233. [Google Scholar] [CrossRef] [Green Version]
- Blong, R.J. Volcanic Hazards: A Sourcebook on the Effects of Eruptions; Academic Press: Orlando, FL, USA, 1984; 441p. [Google Scholar]
- Taddeucci, J.; Scarlato, P.; Capponi, A.; Del Bello, E.; Cimarelli, C.; Palladino, D.M.; Kueppers, U. High-speed imaging of Strombolian explosions: The ejection velocity of pyroclasts. Geophys. Res. Lett. 2012, 39, L02301. [Google Scholar] [CrossRef] [Green Version]
- Cobden, L.; Goes, S.; Ravenna, M.; Styles, E.; Cammarano, F.; Gallagher, K.; Connolly, J.A.D. Anatomy of a Strombolian eruption: Inferences from particle data recorded with thermal video. J. Geophys. Res. Solid Earth 2015, 120, 2367–2387. [Google Scholar] [CrossRef]
- Steinberg, G.; Babenko, J. Experimental velocity and density determination of volcanic gases during eruption. J. Volcanol. Geotherm. Res. 1978, 3, 89–98. [Google Scholar] [CrossRef]
- Ripepe, M.; Rossi, M.; Saccorotti, G. Image processing of explosive activity at Stromboli. J. Volcanol. Geotherm. Res. 1993, 54, 335–351. [Google Scholar] [CrossRef]
- Taddeucci, J.; Edmonds, M.; Houghton, B.; James, M.R.; Vergniolle, S. Chapter 27—Hawaiian and Strombolian Eruptions, 2nd ed.; The Encyclopedia of Volcanoes; Sigurdsson, H., Ed.; Academic Press: Orlando, FL, USA, 2015; pp. 485–503. [Google Scholar]
- Pyle, D.M.; Mather, T.A.; Biggs, J. Remote sensing of volcanoes and volcanic processes: Integrating observation and modelling—Introduction. Geol. Soc. Lond. Spéc. Publ. 2013, 380, 1–13. [Google Scholar] [CrossRef]
- Sassen, K.; Zhu, J.; Webley, P.; Dean, K.; Cobb, P. Volcanic ash plume identification using polarization lidar: Augustine eruption, Alaska. Geophys. Res. Lett. 2007, 34, L08803. [Google Scholar] [CrossRef]
- Mereu, L.; Scollo, S.; Mori, S.; Boselli, A.; Leto, G.; Marzano, F.S. Maximum-Likelihood Retrieval of Volcanic Ash Concentration and Particle Size from Ground-Based Scanning Lidar. IEEE Trans. Geosci. Remote Sens. 2018, 56, 5824–5842. [Google Scholar] [CrossRef]
- Prata, A.J.; Grant, I.F. Retrieval of microphysical and morphological properties of volcanic ash plumes from satellite data: Application to Mt Ruapehu, New Zealand. Q. J. R. Meteorol. Soc. 2001, 127, 2153–2179. [Google Scholar] [CrossRef]
- Spampinato, L.; Calvari, S.; Oppenheimer, C.; Boschi, E. Volcano surveillance using infrared cameras. Earth-Sci. Rev. 2011, 106, 63–91. [Google Scholar] [CrossRef]
- Patrick, M.R.; Harris, A.J.L.; Ripepe, M.; Dehn, J.; Rothery, D.A.; Calvari, S. Strombolian explosive styles and source conditions: Insights from thermal (FLIR) video. Bull. Volcanol. 2007, 69, 769–784. [Google Scholar] [CrossRef]
- Pioli, L.; Harris, A.J.L. Real-Time Geophysical Monitoring of Particle Size Distribution During Volcanic Explosions at Stromboli Volcano (Italy). Front. Earth Sci. 2019, 7, 52. [Google Scholar] [CrossRef] [Green Version]
- La Spina, A.; Burton, M.R.; Harig, R.; Mure, F.; Rusch, P.; Jordan, M.; Caltabiano, T. New insights into volcanic processes at Stromboli from Cerberus, a remote-controlled open-path FTIR scanner system. J. Volcanol. Geoth. Res. 2013, 249, 66–76. [Google Scholar] [CrossRef] [Green Version]
- Pering, T.D.; Tamburello, G.; McGonigle, A.J.S.; Aiuppa, A.; James, M.R.; Sciotto, M.; Cannata, A.; Patanè, D. Dynamics of mild strombolian activity on Mt. Etna. J. Volcanol. Geoth. Res. 2015, 300, 103–111. [Google Scholar] [CrossRef] [Green Version]
- Gaudin, D.; Taddeucci, J.; Scarlato, P.; Moroni, M.; Freda, C.; Gaeta, M.; Palladino, D.M. Pyroclast Tracking Velocimetry illuminates bomb ejection and explosion dynamics at Stromboli (Italy) and Yasur (Vanuatu) volcanoes. J. Geophys. Res. Solid Earth 2014, 119, 5384–5397. [Google Scholar] [CrossRef]
- Witsil, A.J.; Johnson, J.B. Analyzing Continuous Infrasound from Stromboli Volcano, Italy Using Unsupervised Machine Learning. Comput. Geosci. 2020, 140, 104494-1–104494-12. [Google Scholar] [CrossRef]
- Scollo, S.; Prestifilippo, M.; Pecora, E.; Corradini, S.; Merucci, L.; Spata, G.; Coltelli, M. Eruption column height estimation of the 2011-2013 Etna lava fountains. Ann. Geophys. 2014, 57, S0214. [Google Scholar] [CrossRef] [Green Version]
- Corsaro, R.A.; Andronico, D.; Behncke, B.; Branca, S.; Caltabiano, T.; Ciancitto, F.; Cristaldi, A.; De Beni, E.; La Spina, A.; Lodato, L.; et al. Monitoring the December 2015 summit eruptions of Mt. Etna (Italy): Implications on eruptive dynamics. J. Volcanol. Geoth. Res. 2017, 341, 53–69. [Google Scholar] [CrossRef]
- Barsotti, S.; Andronico, D.; Neri, A.; Del Carlo, P.; Baxter, P.J.; Aspinall, W.P.; Hincks, T. Quantitative assessment of volcanic ash hazards for health and infrastructure at Mt. Etna (Italy) by numerical simulation. J. Volcanol. Geotherm. Res. 2010, 192, 85–96. [Google Scholar] [CrossRef]
- Osman, S.; Rossi, E.; Bonadonna, C.; Frischknecht, C.; Andronico, D.; Cioni, R. Exposure-based risk assessment and emergency management associated with the fallout of large clasts at Mount Etna. Nat. Haz. Earth Syst. Sci. 2019, 19, 589–610. [Google Scholar] [CrossRef] [Green Version]
- Andronico, D.; Del Carlo, P. PM10 measurements in urban settlements after lava fountain episodes at Mt. Etna, Italy: Pilot test to assess volcanic ash hazard to human health. Nat. Hazards Earth Syst. Sci. 2016, 16, 29–40. [Google Scholar] [CrossRef] [Green Version]
- Rogic, N.; Cappello, A.; Ferrucci, F. Role of Emissivity in Lava Flow ‘Distance-to-Run’ Estimates from Satellite-Based Volcano Monitoring. Remote Sens. 2019, 11, 662. [Google Scholar] [CrossRef] [Green Version]
- Del Negro, C.; Cappello, A.; Bilotta, G.; Ganci, G.; Hérault, A.; Zago, V. Living at the edge of an active volcano: Risk from lava flows on Mt. Etna. GSA Bull. 2020, 132, 1615–1625. [Google Scholar] [CrossRef]
- Scollo, S.; Prestifilippo, M.; Spata, G.; D’Agostino, M.; Coltelli, M. Monitoring and forecasting Etna volcanic plumes. Nat. Hazards Earth Syst. Sci. 2009, 9, 1573–1585. [Google Scholar] [CrossRef] [Green Version]
- World Heritage Centre. Understanding World Heritage in Europe and North America; Final Report on the Second Cycle of Periodic Reporting, 2012–2015; World Heritage Reports: Paris, France, 2016; p. 43. [Google Scholar]
- Bisson, M.; Spinetti, C.; Andronico, D.; Palaseanu-Lovejoy, M.; Buongiorno, M.F.; Alexandrov, O.; Cecere, T. Ten years of volcanic activity at Mt Etna: High-resolution mapping and accurate quantification of the morphological changes by Pleiades and Lidar data. Int. J. Appl. Earth Obs. Geoinf. 2021, 102, 102369. [Google Scholar] [CrossRef]
- Ganci, G.; Cappello, A.; Bilotta, G.; Corradino, C.; Del Negro, C.; Negro, D. Satellite-Based Reconstruction of the Volcanic Deposits during the December 2015 Etna Eruption. Data 2019, 4, 120. [Google Scholar] [CrossRef] [Green Version]
- Rittmann, A. Les Volcans et Leur Activité; Masson et Cie: Paris, France, 1963; 461p. [Google Scholar]
- Chester, D.K.; Duncan, A.M.; Guest, J.E.; Kilburn, C. Mount Etna: The Anatomy of a Volcano; Chapman and Hall: London, UK, 1985. [Google Scholar]
- Behncke, B.; Neri, M.; Pecora, E.; Zanon, V. The exceptional activity and growth of the Southeast Crater, Mount Etna (Italy), between 1996 and 2001. Bull. Volcanol. 2006, 69, 149–173. [Google Scholar] [CrossRef]
- Bonaccorso, A.; Carleo, L.; Currenti, G.; Sicali, A. Magma Migration at Shallower Levels and Lava Fountains Sequence as Revealed by Borehole Dilatometers on Etna Volcano. Front. Earth Sci. 2021, 9, 800. [Google Scholar] [CrossRef]
- De Beni, E.; Behncke, B.; Branca, S.; Nicolosi, I.; Carluccio, R.; Caracciolo, F.D.; Chiappini, M. The continuing story of Etna’s New Southeast Crater (2012–2014): Evolution and volume calculations based on field surveys and aerophotogrammetry. J. Volcanol. Geotherm. Res. 2015, 303, 175–186. [Google Scholar] [CrossRef]
- De Beni, E.; Cantarero, M.; Messina, A. UAVs for volcano monitoring: A new approach applied on an active lava flow on Mt. Etna (Italy), during the 27 February–02 March 2017 eruption. J. Volcanol. Geotherm. Res. 2018, 369, 250–262. [Google Scholar] [CrossRef]
- De Beni, E.; Cantarero, M.; Neri, M.; Messina, A. Lava flows of Mt Etna, Italy: The 2019 eruption within the context of the last two decades (1999–2019). J. Maps 2021, 3, 17. [Google Scholar] [CrossRef]
- Coltelli, M.; Proietti, C.; Branca, S.; Marsella, M.; Andronico, D.; Lodato, L. Analysis of the 2001 lava flow eruption of Mt. Etna from three-dimensional mapping. J. Geophys. Res. Earth Surf. 2007, 112, F02029. [Google Scholar] [CrossRef]
- Schindelin, J.; Arganda-Carreras, I.; Frise, E.; Kaynig, V.; Longair, M.; Pietzsch, T.; Preibisch, S.; Rueden, C.; Saalfeld, S.; Schmid, B.; et al. Fiji: An open-source platform for biological-image analysis. Nat. Methods 2012, 9, 676–682. [Google Scholar] [CrossRef] [Green Version]
- Edwards, M.J.; Pioli, L.; Harris, A.J.L.; Gurioli, L.; Thivet, S. Magma fragmentation and particle size distributions in low intensity mafic explosions: The July/August 2015 Piton de la Fournaise eruption. Sci. Rep. 2020, 10, 13953. [Google Scholar] [CrossRef]
- Edwards, M.J.; Eychenne, J.; Pioli, L. Formation and Dispersal of Ash at Open Conduit Basaltic Volcanoes: Lessons from Etna. Front. Earth Sci. 2021, 9, 1–19. [Google Scholar] [CrossRef]
- Houghton, B.F.; Taddeucci, J.; Andronico, D.; Gonnermann, H.M.; Pistolesi, M.; Patrick, M.R.; Orr, T.R.; Swanson, D.A.; Edmonds, M.; Gaudin, D.; et al. Stronger or longer: Discriminating between Hawaiian and Strombolian eruption styles. Geology 2016, 44, 163–166. [Google Scholar] [CrossRef] [Green Version]
- Gouhier, M.; Donnadieu, F. Systematic retrieval of ejecta velocities and gas fluxes at Etna volcano using L-Band Doppler radar. Bull. Volcanol. 2011, 73, 1139–1145. [Google Scholar] [CrossRef]
- Dominguez, L.; Pioli, L.; Bonadonna, C.; Connor, C.B.; Andronico, D.; Harris, A.J.L.; Ripepe, M. Quantifying unsteadiness and dynamics of pulsatory volcanic activity. Earth Planet Sci. Lett. 2016, 444, 160–168. [Google Scholar] [CrossRef] [Green Version]
- Wallis, G.B. One Dimensional Two Phase Flow; McGraw-Hill: New York, NY, USA, 1969; 408p. [Google Scholar]
- Azzopardi, B.J.; Pioli, L.; Abdulkareem, L.A. The properties of large bubbles rising in very viscous liquids in vertical columns. Int. J. Multiph. Flow 2014, 67, 160–173. [Google Scholar] [CrossRef]
- James, M.R.; Lane, S.J.; Wilson, L.; Corder, S.B. Degassing at low magma-viscosity volcanoes: Quantifying the transition between passive bubble-burst and Strombolian eruption. J. Volcanol. Geoth. Res. 2009, 180, 81–88. [Google Scholar] [CrossRef]
- Davies, R.M.; Taylor, G.I. The mechanics of large bubbles rising through liquids in tubes. Proc. R. Soc. Lond. 1950, A200, 375–390. [Google Scholar]
- Pering, T.; McGonigle, A.; James, M.; Capponi, A.; Lane, S.; Tamburello, G.; Aiuppa, A. The dynamics of slug trains in volcanic conduits: Evidence for expansion driven slug coalescence. J. Volcanol. Geotherm. Res. 2017, 348, 26–35. [Google Scholar] [CrossRef]
- Hasan, A.H.; Mohammed, S.K.; Pioli, L.; Hewakandamby, B.N.; Azzopardi, B.J. Gas rising through a large diameter column of very viscous liquid: Flow patterns and their dynamic characteristics. Int. J. Multiph. Flow 2019, 116, 1–14. [Google Scholar] [CrossRef]
- Maiti, K.; Kayal, S. Estimating Reliability Characteristics of the Log-Logistic Distribution Under Progressive Censoring with Two Applications. Ann. Data Sci. 2020, 1–40. [Google Scholar] [CrossRef]
- Pioli, L.; Azzopardi, B.; Cashman, K. Controls on the explosivity of scoria cone eruptions: Magma segregation at conduit junctions. J. Volcanol. Geotherm. Res. 2009, 186, 407–415. [Google Scholar] [CrossRef] [Green Version]
- Pering, T.D.; Mcgonigle, A.; James, M.R.; Tamburello, G.; Aiuppa, A.; Donne, D.D.; Ripepe, M. Conduit dynamics and post explosion degassing on Stromboli: A combined UV camera and numerical modeling treatment. Geophys. Res. Lett. 2016, 43, 5009–5016. [Google Scholar] [CrossRef] [Green Version]
- Gaudin, D.; Taddeucci, J.; Scarlato, P.; Harris, A.; Bombrun, M.; Del Bello, E.; Ricci, T. Characteristics of puffing activity revealed by ground-based, thermal infrared imaging: The example of Stromboli Volcano (Italy). Bull. Volcanol. 2017, 79, 24. [Google Scholar] [CrossRef]
- Pering, T.D.; McGonigle, A.J.S. Combining Spherical-Cap and Taylor Bubble Fluid Dynamics with Plume Measurements to Characterize Basaltic Degassing. Geosciences 2018, 8, 42. [Google Scholar] [CrossRef] [Green Version]
- Reitz, R.D. Atomization and other Breakup Regimes of a Liquid Jet. Ph.D. Thesis, Princeton University, Princeton, NJ, USA, 1978. [Google Scholar]
- Jones, T.J.; Reynolds, C.D.; Boothroyd, S.C. Fluid dynamic induced break-up during volcanic eruptions. Nat. Commun. 2019, 10, 3828. [Google Scholar] [CrossRef] [PubMed] [Green Version]
- Lefebvre, A.H.; McDonell, V.G. Atomisation and Sprays; CRC Press: Boca Raton, FL, USA, 2017; 300p. [Google Scholar]
- Gurioli, L.; Colo’, L.; Bollasina, A.J.; Harris, A.J.L.; Whittington, A.; Ripepe, M. Dynamics of Strombolian explosions: Inferences from field and laboratory studies of erupted bombs from Stromboli volcano. J. Geophys. Res. Solid Earth 2014, 119, 319–345. [Google Scholar] [CrossRef]
- Capponi, A.; Taddeucci, J.; Scarlato, P.; Palladino, D.M. Recycled ejecta modulating Strombolian explosions. Bull. Volcanol. 2016, 78, 13. [Google Scholar] [CrossRef] [Green Version]
- Alatorre-Ibargüengoitia, M.A.; Scheu, B.; Dingwell, D.B.; Delgado-Granados, H.; Taddeucci, J. Energy consumption by magmatic fragmentation and pyroclast ejection during Vulcanian eruptions. Earth Planet. Sci. Lett. 2010, 291, 60–69. [Google Scholar] [CrossRef]
- Andronico, D.; Scollo, S.; Cristaldi, A. Unexpected hazards from tephra fallouts at Mt Etna: The 23 November 2013 lava fountain. J. Volcanol. Geotherm. Res. 2015, 304, 118–125. [Google Scholar] [CrossRef]
- Behncke, B.; Branca, S.; Corsaro, R.A.; De Beni, E.; Miraglia, L.; Proietti, C. The 2011–2012 summit activity of Mount Etna: Birth, growth and products of the new SE crater. J. Volcanol. Geotherm. Res. 2014, 270, 10–21. [Google Scholar] [CrossRef]
Figure 1.
(a) Map of Etna summit craters, with a map of Sicily in the inset. The open square in the map indicates the location of Etna’s summit. (b) Graphic timeline of eruptive activity at the summit craters of Etna, September 2019–March 2021. NEC = Northeast Crater; SEC = Southeast Crater; BN = Bocca Nuova; VOR = Voragine. Vent 1, vent 2, and vent 3 denote dates on which the three vents within the VOR became active (all three were active during the December 2020–March 2021 period).

Figure 2.
(a) Researcher monitoring the activity on 25 February 2020; (b) shaded relief of Etna summit craters; blue dots indicate camera positions.
Figure 2.
(a) Researcher monitoring the activity on 25 February 2020; (b) shaded relief of Etna summit craters; blue dots indicate camera positions.


Figure 3.
Shaded relief of Etna summit (a) on the 4th of July 2017 (b) during the survey (25 February 2020) and (c) difference in m between the 2020 and 2017 DEMs. The given colors of the legend represent the ranges of thickness values in m of the volcanic products, both lava flow and tephra.
Figure 3.
Shaded relief of Etna summit (a) on the 4th of July 2017 (b) during the survey (25 February 2020) and (c) difference in m between the 2020 and 2017 DEMs. The given colors of the legend represent the ranges of thickness values in m of the volcanic products, both lava flow and tephra.

Figure 4.
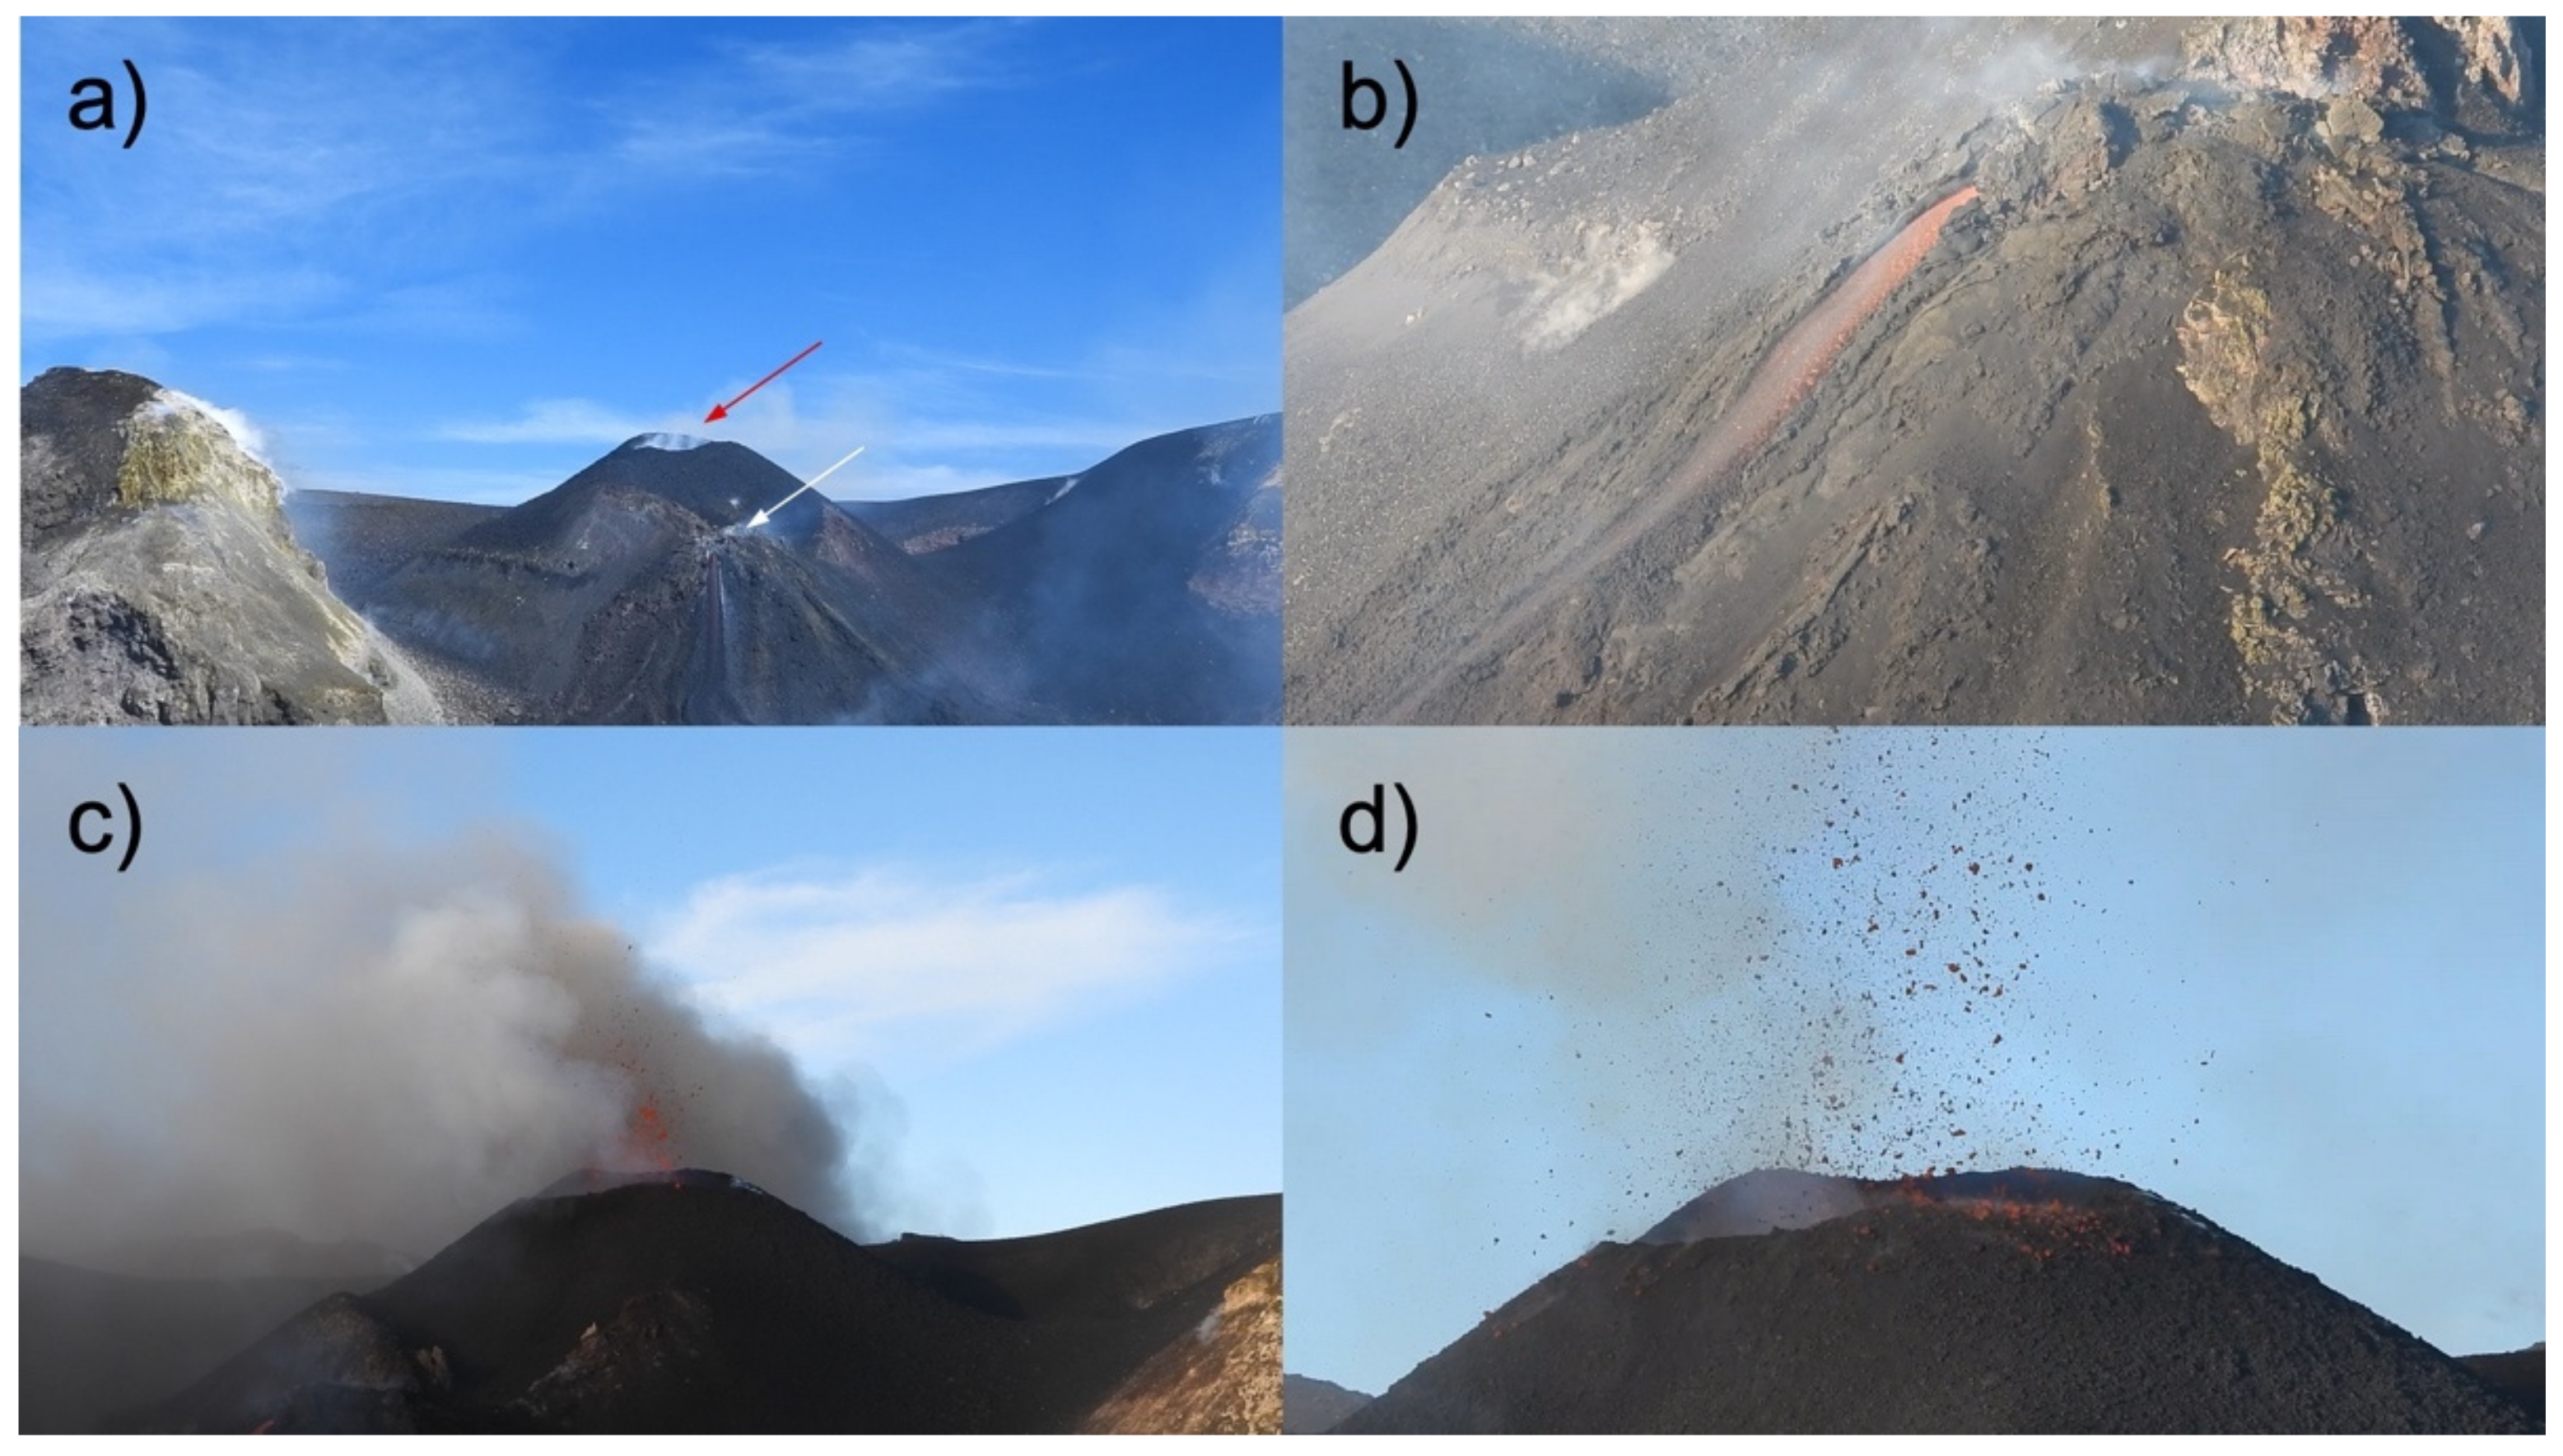
(a) Eruptive activity at the Voragine (VOR), as observed from the edge of the Bocca Nuova Crater (BN) on 25 February 2020. Red arrow points to the explosive vent, white arrow to the lava vent. (b) Close-up of the active lava flow. (c) Strombolian explosion and (d) close-up of explosion; bombs are partly falling back in the crater and on the crater rim and partly on the slopes of the cone.
Figure 4.
(a) Eruptive activity at the Voragine (VOR), as observed from the edge of the Bocca Nuova Crater (BN) on 25 February 2020. Red arrow points to the explosive vent, white arrow to the lava vent. (b) Close-up of the active lava flow. (c) Strombolian explosion and (d) close-up of explosion; bombs are partly falling back in the crater and on the crater rim and partly on the slopes of the cone.

Figure 5.
Repose times vs. explosion duration of the explosions studied in this work. Symbols are larger than the error associated to data.
Figure 5.
Repose times vs. explosion duration of the explosions studied in this work. Symbols are larger than the error associated to data.

Figure 6.
Cumulative probability plot of (a) repose times, (b) explosion intervals (c) explosion duration. The fitting curve corresponds to a log logistic distribution calculated over data from videos 1, 2, 3. The numbers in the legend indicate the label of videos as in Table 3. The red thick line (fitting curve) is the best log logistic distribution fitting the data from videos 1, 2, 3. The numbers in each plot refer to the scale (μ) and shape (σ) parameters of the best fit curve. See text for further details.

Figure 7.
(a) Distribution of vertical exit speeds of the sequence of explosions. The four largest explosions are not considered in the computations. (b) Distribution of mass erupted in single explosions.
Figure 7.
(a) Distribution of vertical exit speeds of the sequence of explosions. The four largest explosions are not considered in the computations. (b) Distribution of mass erupted in single explosions.

Figure 8.
(a) Variation of particle exit speed with time in explosion 1e (Table 4). Orange squares: gas stream velocity, blue dots, particle velocity. Data uncertainty is highlighted by colored areas; (b) variation of measured Mdphi and instantaneous emitted mass with time. The explosions start with a weak gas emission which is not recorded in these plots.

Figure 9.
Size distribution of particles emitted in (a) explosion 1e, (b) explosion 2e, (c) explosion 3e, (d) explosion 4e of Table 4.
Figure 9.
Size distribution of particles emitted in (a) explosion 1e, (b) explosion 2e, (c) explosion 3e, (d) explosion 4e of Table 4.

Figure 10.
(a) Reconstruction of the activity monitored on Etna on 25 February 2020 and (b) sketch of the conduit dynamics.
Figure 10.
(a) Reconstruction of the activity monitored on Etna on 25 February 2020 and (b) sketch of the conduit dynamics.


Table 1.
Main characteristics of the video recorded on 25/02/2022 and its analysis. hFOV = Horizontal Field of View, vFOV = Vertical Field of view, * the focal length of the optics was changed during recording.
Table 1.
Main characteristics of the video recorded on 25/02/2022 and its analysis. hFOV = Horizontal Field of View, vFOV = Vertical Field of view, * the focal length of the optics was changed during recording.
| Video | Time | Duration (mins) | Explosions (n) | Distance from Vent (m) | hFOV × VFOV(m) |
|---|---|---|---|---|---|
| 1 | 12:39 | 1:57 | 34 | 136 | 32.6 × 18.4 |
| 2 | 13:22 | 4:53 | 76 | 403 | 169.0 × 95.0 |
| 3 | 13:29 | 3:58 | 71 | 403 | 48.0 × 27.0 * 32.6 × 18.4.0 * |
| 3 | 13:58 | 3:41 | 41 | 136 | 122.9 × 69.12 * 55.7 × 31.4 |
Table 2.
Criteria for calculating temporal parameters from recordings.
| Explosion Onset | Explosion End | Repose Time between Explosions Rt(s) | Time between Explosions Te (s) | Explosion Duration |
|---|---|---|---|---|
| Frame showing the first pyroclast leaving the vent | Frame showing the last pyrocast leaving the vent | Number of frames between consecutive explosions onset/fps | Number of frames between end and onset of two consecutive explosions/fps | Number of frames between explosion onset and end/fps |
Table 3.
Main temporal parameters of the Strombolian explosions. St Dev = Standard Deviation.
| Video | Explosion Duration (s) | Rt (s) | Rt (s) |
|---|---|---|---|
| Median (St Dev) | Median (St Dev) | Median (St Dev) | |
| 1 | 1.2 (1.1) | 3.1 (2.0) | 2.1 (1.4) |
| 2 | 1.8 (1.6) | 3.4 (1.8) | 1.4 (1.1) |
| 3 | 1.6 (1.1) | 3.0 (1.7) | 1.2 (1.3) |
| 4 | 1.2 (1.6) | 5.0 (2.6) | 3.5 (2.1) |
Table 4.
Dynamics of the four major explosions of the studied sequence. The numbers in ‘Label’ indicate the corresponding video. GSD= Grain Size Distribution.
Table 4.
Dynamics of the four major explosions of the studied sequence. The numbers in ‘Label’ indicate the corresponding video. GSD= Grain Size Distribution.
| Label | Phase | Time (s) | Max 2D Speed (m/s) | GSD Mdphi (Sorting) |
|---|---|---|---|---|
| 1e | Onset (gas emission) | 0 | 260 | |
| First Pulse | 0.02 | 180 | −8.8 (0.82) | |
| Second Pulse | 0.24 | 160 | ||
| End | 2.36 | |||
| 2e | First Pulse | 0 | 148.8 | |
| Second pulse | 0.16 | 107.2 | −8.8 (0.97) | |
| Sustained Phase | 0.32 | 122.5 | ||
| End | 3.06 | |||
| 3e | First Pulse | 0 | 68.9 | |
| Intense degassing | 0.92 | 17.9 | −9.2 (1.08) | |
| Sustained Phase | 1.14 | 83.1 | ||
| End | 2.56 | |||
| 4e | First Pulse | 0 | 107.6 | |
| Sustained Phase | 0.24 | 41.1 | −10.1 (0.61) | |
| End | 2.04 |
Publisher’s Note: MDPI stays neutral with regard to jurisdictional claims in published maps and institutional affiliations. |
© 2022 by the authors. Licensee MDPI, Basel, Switzerland. This article is an open access article distributed under the terms and conditions of the Creative Commons Attribution (CC BY) license (https://creativecommons.org/licenses/by/4.0/).
Share and Cite
MDPI and ACS Style
Pioli, L.; Palmas, M.; Behncke, B.; De Beni, E.; Cantarero, M.; Scollo, S. Quantifying Strombolian Activity at Etna Volcano. Geosciences 2022, 12, 163. https://0-doi-org.brum.beds.ac.uk/10.3390/geosciences12040163
AMA Style
Pioli L, Palmas M, Behncke B, De Beni E, Cantarero M, Scollo S. Quantifying Strombolian Activity at Etna Volcano. Geosciences. 2022; 12(4):163. https://0-doi-org.brum.beds.ac.uk/10.3390/geosciences12040163
Chicago/Turabian StylePioli, Laura, Marco Palmas, Boris Behncke, Emanuela De Beni, Massimo Cantarero, and Simona Scollo. 2022. "Quantifying Strombolian Activity at Etna Volcano" Geosciences 12, no. 4: 163. https://0-doi-org.brum.beds.ac.uk/10.3390/geosciences12040163
Note that from the first issue of 2016, this journal uses article numbers instead of page numbers. See further details here.