Article

Estimating Water Content in Water–Oil Mixtures and Porous MEDIA They Saturate: Joint Interpretation of NMR Relaxometry and Dielectric Spectroscopy

Geophysics Division, Siberian Branch Russian Academy of Sciences, Trofimuk Institute of Petroleum Geology and Geophysics, 630090 Novosibirsk, Russia
*
Author to whom correspondence should be addressed.
Submission received: 30 December 2021 / Revised: 7 April 2022 / Accepted: 13 April 2022 / Published: 17 April 2022

Abstract

:
This article deals with the topical problem of estimating water content in water–oil mixtures within porous media they saturate, according to low-field NMR relaxometry and dielectric spectroscopy. The aim of the research is experimental validation of the capability of complex data interpretation to acquire information on the filtration-volumetric properties of drill cuttings, relaxation characteristics of oil-containing fluids, the water/oil ratio in water–oil mixtures, and their saturation of drill cuttings to control the composition of liquids produced from boreholes. The studies are carried out on samples of cuttings and oils taken from fields in the Northern regions of the West Siberian oil-and-gas province, where NMR studies have not been performed before. Based on the experimental data obtained, the possibility of water content assessment in water-in-oil mixtures and porous media they saturate were proved through NMR relaxometry. With the use of the proposed methodology, the amount of water in oil–water mixtures was established, and their main NMR characteristics were determined. The relative error in evaluating the proportion of water in mixtures based on high-viscosity oils is less than 10%, and about 20% for those based on light oils. When determining the oil–water ratio in the pore space of the drill cuttings, the error is about 15%. It was proven that joint use of these two techniques makes it possible to increase the reliability of the oil–water ratio assessment of all the samples studied. Furthermore, it was revealed that the NMR spectrum shifts to the right, and the spectrum of the complex permittivity shifts downwards during the transition from high-viscosity oils to light ones.

1. Introduction

The West Siberian oil-and-gas province is one of the largest petroleum-productive regions in the world and the richest petroleum province in Russia and the former Soviet Union [1]. Interest in its hydrocarbon (HC) prospects arose as early as in the 1930s, with the second half of the 20th century in Russia being marked by the unequaled development of the West Siberian oil-and-gas complex [2]. However, the situation drastically changed at the beginning of the 21st century, due to the high depletion of large earlier discovered fields in the central part of the West Siberia. One of the top priorities for the oil-and-gas complex of Russia since then has been the formation of new centers of oil-and-gas production in its northern and Arctic parts. Therefore, the creation of techniques that minimize costs and errors in the process of geological examination and development is currently an urgent scientific and practical task.
Water contamination in crude oil may cause severe problems at any stage of petroleum production. Therefore, water testing is always a part of oil recovery and refining. Water can coexist in an oil sample in three phases: dissolved, emulsion, and free. The last two pose the greatest risk for industrial applications and have to be always under control. There are various techniques for measuring water in oil [3]. They vary in methodological basis, extent of application, accuracy, time, and labor expenditures. Presently, the last and a most promising method of water-in-oil determination is infrared spectroscopy, characterized by a chemical-free and rapid analysis. However, its equipment is expensive and matching the results with those of the Karl Fischer titration calls for further investigations.
In addition, such tasks can be addressed through analyzers based on the nuclear magnetic resonance (NMR) phenomenon. They allow an automatic express-control and analysis of raw materials’ and oil products’ parameters on a grand scale.
Concerning the petroleum industry, the NMR method is most widely used in relation to evaluating the petrophysical parameters of rocks exposed by a borehole during nuclear magnetic logging, or those of rock samples of arbitrary shape and size (cores, drill cuttings) in laboratory examinations [4,5,6,7]. For formation fluids (liquid hydrocarbons, formation water, etc.), one can carry out their typification, component composition assessment [4,8], diffusion coefficient and viscosity estimation [9,10]. At the same time, many works in the field of NMR studies are devoted to the study of high-viscosity oils and oil-saturated shales [9,11,12,13], since the issue of effective development of fields with hard-to-recover reserves is becoming increasingly urgent. As for determining the composition of produced fluids with the conventional techniques, this is rather a complex technical problem that requires either separation of the mixture (at least gas separation), or deployment of one of the methods for accounting for the presence of gas in the mixture. In the NMR method, when measuring water content, dissimilar values of the nuclear relaxation time for water and oil protons are given consideration to, whereas gas content manifests itself in the amplitude of the measured signal only [14]. In the works devoted to the study of the water–oil ratio by NMR, heavy oils were mainly used for the preparation of emulsions. In addition, studies at high frequencies (more than 20 MHz) do not allow comparing the data obtained with logging data (NMR logging frequency is about 2 MHz) [15,16]. The authors of these works experimentally established that with an increase in the amount of emulsifier in the emulsion, the distance between the peaks of water and oil decreases, which makes it impossible to use them in the study of oil–water mixtures based on light oils and condensates, since the time spectra of transverse relaxation of light oils and distilled water intersect. In our study, we use oil samples with different viscosity and density values in order to confirm the influence of physical-chemical properties on NMR characteristics and the accuracy of determining the water content in the mixture from NMR data.
With advances in instrumentation technology and the appearance of new magnetic materials, the capabilities of NMR instruments are constantly growing and in perspective have great potential, including when combined with other methods, such as for instance, dielectric spectroscopy. It is effective for analyzing such complex systems, such as organic and water systems, complex viscous liquids, polymers, microemulsions and oil dispersed systems. A combination of two dielectric spectroscopy methods (time-domain and frequency domain) enables encompassing the frequency range from the micro- to terahertz region and scrutinize a wide range of substances in the temperature range from −160 °C to +400 °C. Numerous studies showed that in the frequency domain from units of kilohertz to units of gigahertz there can be pronounced a frequency dispersion of the complex dielectric permittivity (CDP), which some authors associate with a manifestation of the interlayer (intersurface) polarization at phase boundaries [17,18]. The paper [19] provides a comparative analysis of dielectric and NMR methods in examining the electrophysical parameters of a medium. It was shown that NMR may serve as an auxiliary tool for interpreting dielectric data. Thus, the implementation of complex interpretation of NMR relaxometry and dielectric spectroscopy in appraising water–oil mixtures and drill cuttings they saturate will make it possible to control the composition of fluids produced from boreholes, as well as to determine in shortest possible time the filtration-volumetric properties of reservoirs under development.
With the use of the proposed NMR-methodology for water content estimation in mixtures for samples with a known oil–water ratio, the amount of water in oil–water mixtures was established. The relative error in determining the proportion of water in mixtures based on high-viscosity oils is less than 10%, and on the basis of light oils is about 20%. When determining the oil–water ratio in the pore space of the drill cuttings, the error is approximately 15%. Thus, the relevance and scientific novelty of this study is due to several factors. First, the relevance is attributed to the specifics of the studied objects –of the oils’ and condensates’ characteristics. Our collection of oil samples includes samples with different physical-chemical properties, from condensates to very heavy high-viscosity oils. This approach allows us to study how the physico-chemical properties of oil affect the accuracy of determining the oil–water ratio from NMR data. Second, the samples under study have never been examined by NMR-spectroscopy before. Conversely, the fields where the samples were taken, are characterized by complexities of the geological structure and development, which makes an examination of their reservoir fluids’ properties an urgent scientific and practical task. In addition, the last but not the least, we conduct our experiments at a frequency comparable to the NMR logging frequency, which makes it possible, if necessary, to introduce correction coefficients for the petrophysical interpretation of logging data.

2. Research Methods and Sample Preparation

The study was carried out via the standard set of organic geochemistry laboratory methods, pulsed NMR relaxometry and dielectric spectroscopy, with a comparative analysis of data from these methods.
NMR measurements were made on the MST-05 relaxometer with an operating frequency of 2.2 MHz and a magnetic field of 0.05 T. The technique is based on recording the decay of nuclear magnetization from a hydrogen-containing sample and allows for determining the total hydrogen content of a fluid or rock, pore size distribution, viscosity, and component composition of the fluid under analysis [4,20]. Processing and interpretation of the initial NMR signal (relaxation curve) consists of the inverse transformation of the signal into the spectrum of transverse relaxation times T2 [21,22,23]. This procedure is reduced to solving the Fredholm integral equation of the second kind. The inverse problem is solved by the Tikhonov regularization method [24]. The obtained NMR spectrum is further analyzed and employed for a quantitative and qualitative interpretation [25].
CDP measurements were performed in the frequency range 100 Hz–5 MHz in a capacitor cell with the LCR GWInstek meter (Taiwan). The measurement procedure is a modification of the classical technique for measuring the dielectric permittivity in a flat capacitor [26]. The diameter of the cell electrodes is selected such that the field in the central part of the capacitor, where the sample under investigation is placed, is uniform. At the stage of determining CDP values, the sample is located in the experimental cell in the form of a flat capacitor with an electrode diameter of 28 mm, and 10 mm interelectrode distance. The cell is connected with wires to the LCR-G measuring device with an operating frequency range of 0.02–5000 kHz. After obtaining the impedance components, the values of the capacitance for the empty cell are calculated, and then for that with the sample. The data obtained are made use of to find CDP values at the corresponding frequency [19,27].
From a thermodynamic point of view, water–oil mixtures belong to unstable systems that strive to achieve an equilibrium state with a minimum interface area. Therefore, the main indicator in this context is their stability, i.e., the ability not to disintegrate and delaminate for a certain time that depends on the physicochemical properties of the constituent fluids.
To prepare water–oil mixtures and afterwards saturate drill cuttings, we applied four oil samples (B, C, D, E) and one condensate sample (A), taken from the Jurassic-Cretaceous deposits of the West Siberian fields (Table 1).
The study of the composition and properties of hydrocarbon fluids of these fields is in itself an urgent scientific and practical task. For some fields, this is due to the peculiarities of their geological structure, to the properties of hydrocarbon fluids contained in their deposits and, as a result, to the technical aspects of their development. For other fields, the significance of such studies is attributed to their weak geological and geochemical state of knowledge. Thus, the Russkoye gas and oil field is complex in the context of development due to the high-viscosity of oil in the deposits–more than 200 cP; The Salymskoye oil field is the largest in terms of reserves and oil production from unconventional reservoirs–the Bazhenov formation (layer Yu0), where fluid properties are highly variable laterally; the Pravdinskoe oil field is characterized by a very short period of the waterless period of oil production, which implies the need to monitor the water content of the extracted fluids; the Salmanovskoye oil and gas condensate field is located in the north-west of the Gydan peninsula, the most poorly studied area of the West Siberian oil and gas province, and despite the unique hydrocarbon reserves, is only going to enter the active phase of development in 2023 with the launch of the first LNG production line in the “Arctic LNG 2” project.
The samples selected are characterized by a wide range of physico-chemical properties (Table 1): density (from 0.7751 to 0.9365 g/cm3), dynamic viscosity (from 0.92 to 34.53 MPa∙s), content of saturated and aromatic hydrocarbons (from 83.7 to 99.8%), as well as of resinous-asphaltic components (from 16.3 to 0.2%). The listed characteristics were determined by the standard organic geochemistry laboratory methods. More specifically, the density of the samples (kg/m3) was measured at 20 °C with the VIP-2MR vibration density meter [28]; kinematic viscosity (mm2/s) at 20 °C—with glass viscometers of various configurations [29]; dynamic viscosity (MPa∙s) by means of recalculation from the kinematic viscosity [29]; and group hydrocarbon composition by column liquid chromatography after separating the asphaltenes.
On the basis of each of the five hydrocarbon fluid samples, five oil–water mixtures were prepared (Table 2). Immediately before the measurements on the NMR relaxometer, the specified volumes of distilled water and oil/condensate (dry) were homogenized with a mixer for 2 min, after which they were placed to stand at room temperature for 1 min. With this approach, the authors tried to obtain samples of water–oil mixtures containing dissolved, emulsion, and free water.
For the study of the filtration-volumetric properties, seven samples of drill cuttings were taken from the 960–1040 m depth interval from the Medvezhye oil-gas-condensate field, located in the northeastern part of the West Siberian oil-and-gas province (Table 3). According to the data available, the studied samples are characterized by an increased clay content (about 20%). The clay is mainly represented by chlorite. There is no additional information about pore sizes in the cuttings’ samples, because the size of the particles does not allow us to conduct a standard set of petrophysical studies and make their thin sections to carry out appropriate measurements.
At the first stage of sample preparation, the drill cuttings were washed out with hot extraction with chloroform for 3–4 days. This was followed by holding the samples in an oven at a temperature of 105 °C over 24 h for complete evaporation of the solvent. Then the samples were placed in 45 cm3 containers and filled with brine with a mineralization of 6 g/L up to the middle of the sample height, and set under vacuum for 24 h to remove air bubbles at the bottom of the container. After that, the brine was added to the edges of the container, and the samples were set under vacuum for another five days for complete saturation. At the subsequent stage, the samples were put in an oven to evaporate excess moisture and achieve the required brine content by mass relative to the dry and 100% brine-saturated samples. On reaching the sought-for brine content, the samples were saturated with oil according to the same scheme. In this way, we obtained the drill cuttings samples with a given oil/water ratio (50/50, 70/30 and 90/10). It should be noted that at the initial stage of sample preparation the attempt was made to use distilled water in the oil-C-based mixture to saturate the drill cuttings with a 50/50 oil–water content. Nevertheless, the clay in the samples swelled strongly, which led to partial destruction of the samples. In this connection, brine with a mineralization of 6 g/L was used for the remaining samples.

3. NMR Investigations

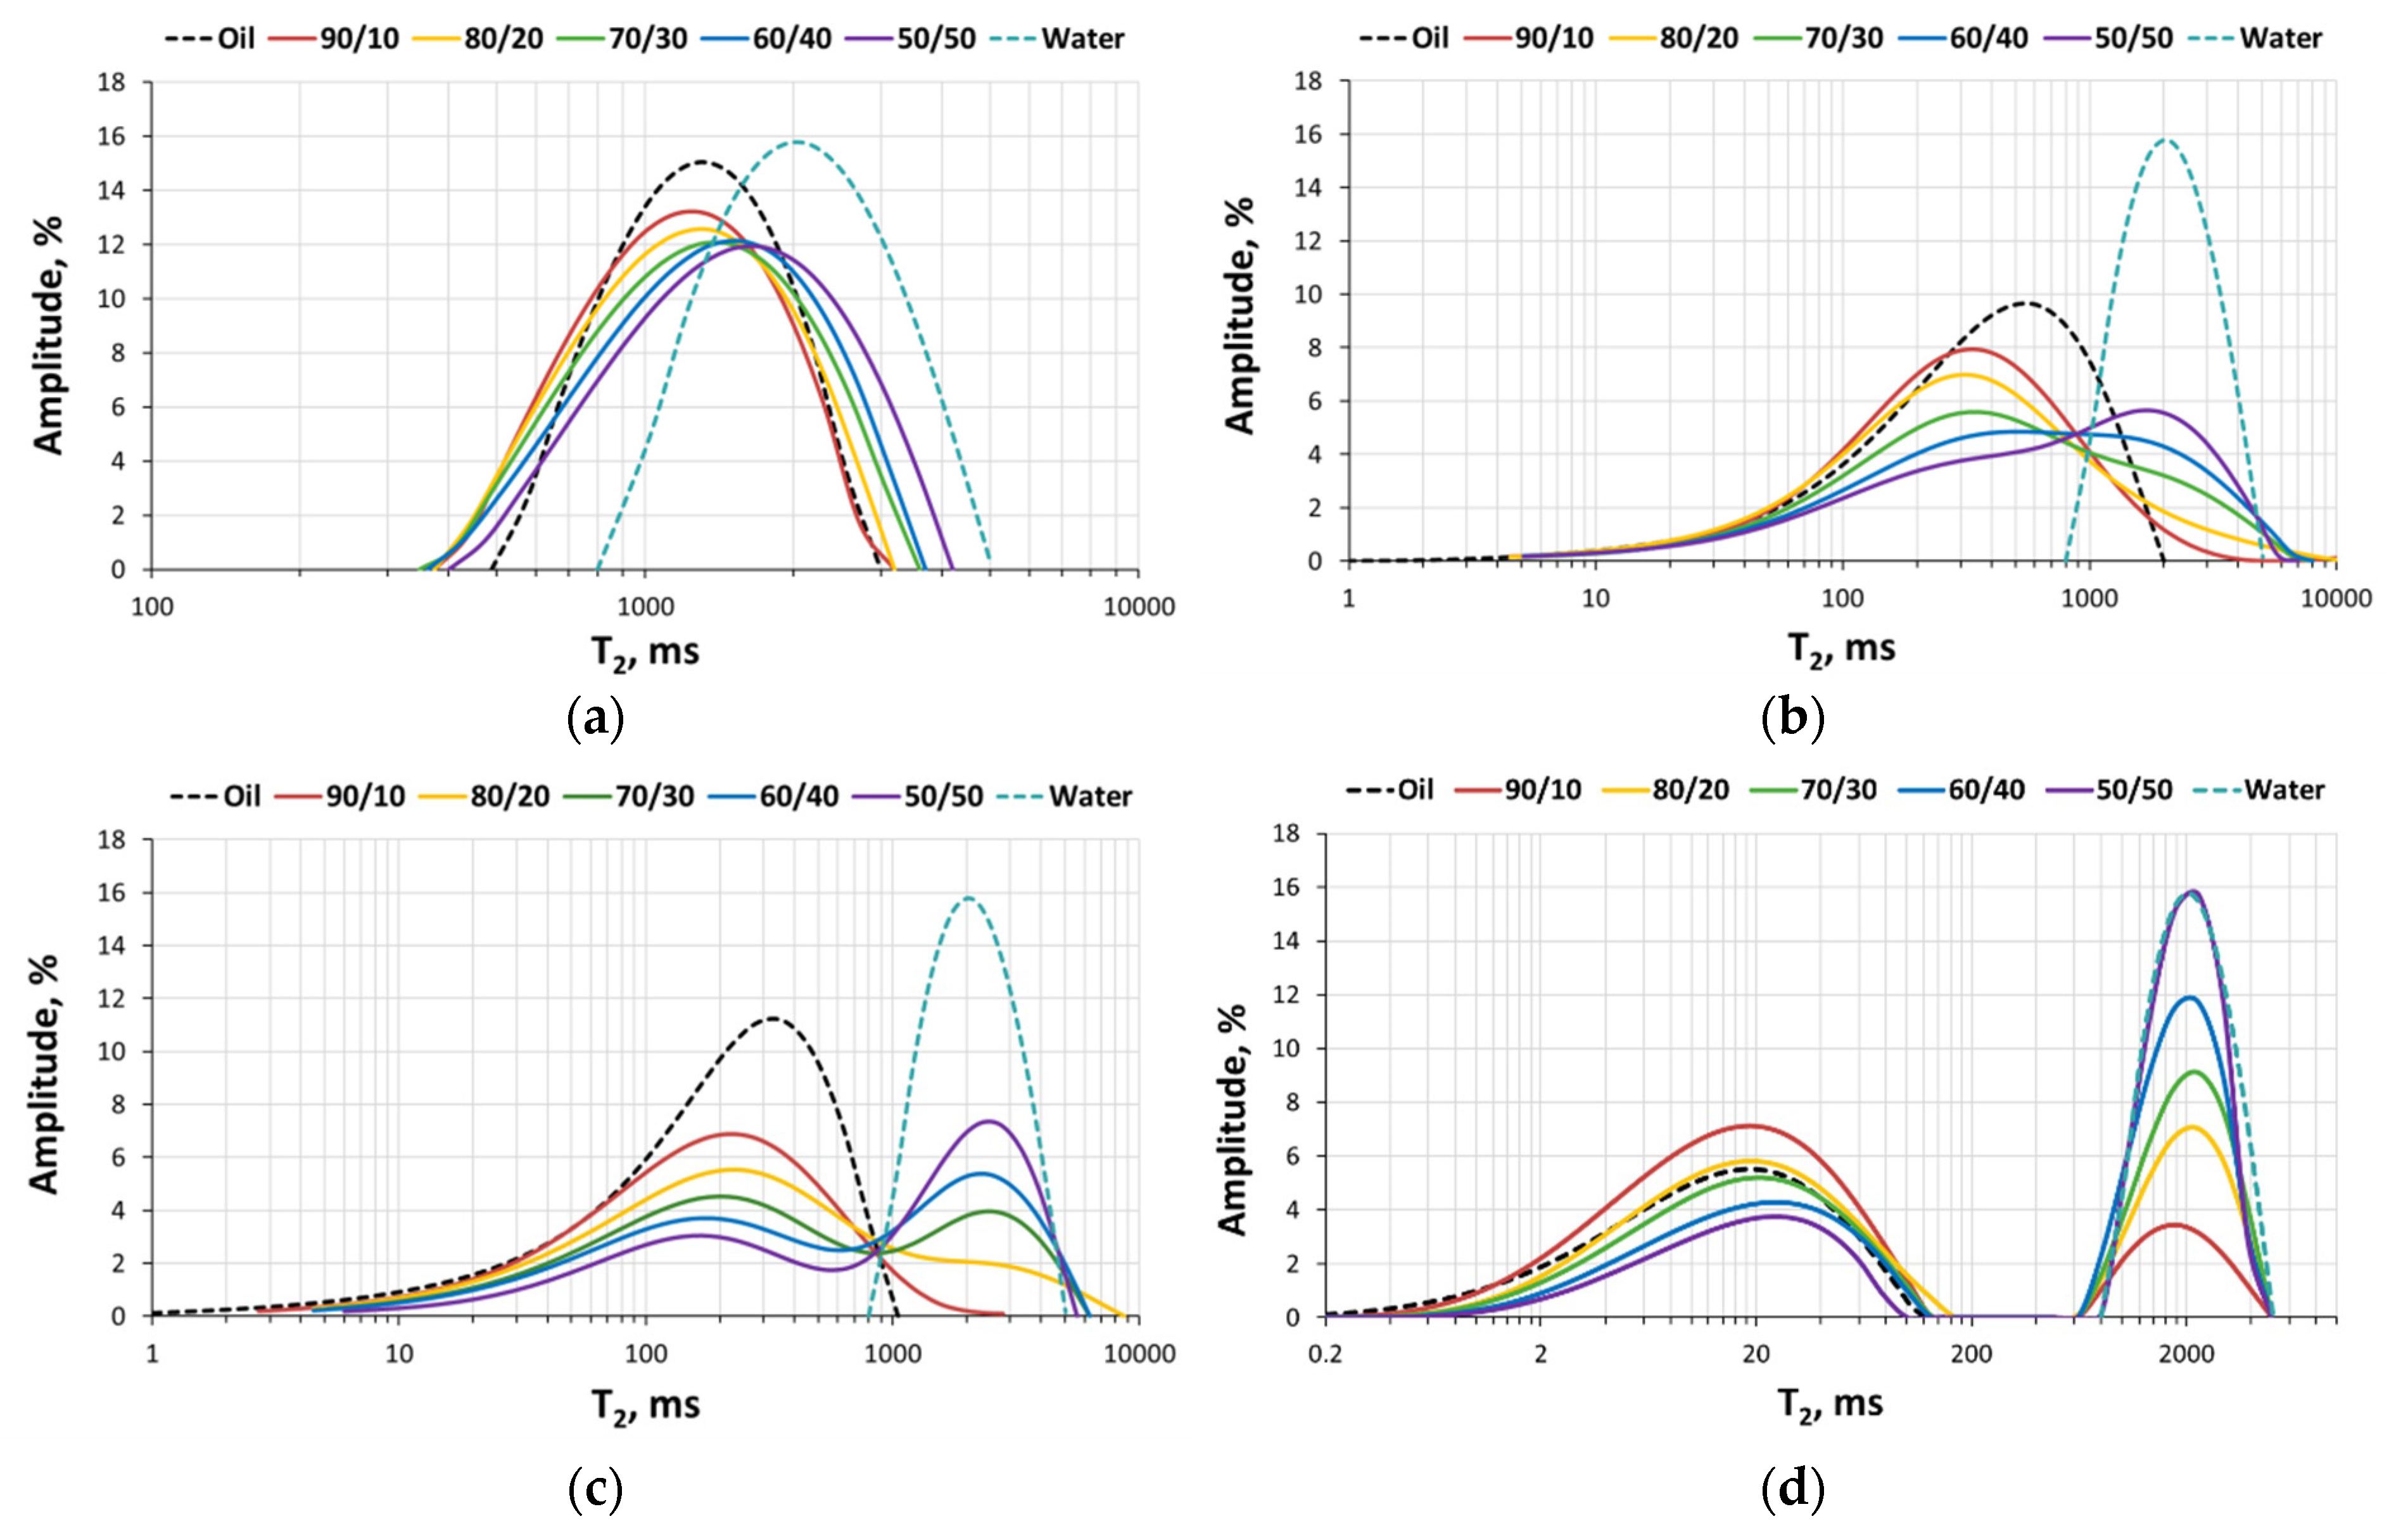
3.1. NMR Studies of Water–Oil Mixtures

Following the results of the experimental NMR studies, T2 spectra were derived for each sample. Figure 1 shows the spectra for the most representative samples prepared on the basis of the oils with very different viscosities and densities (Table 1). With an increase in the water content in the light- and medium-oil-based mixtures, the spectra shift toward large T2 times. As concerns those based on the heavy oils, the positions of the spectra on the relaxation time axis change insignificantly, while the amplitude of the peaks varies in proportion to the oil/water ratio in the mixture.
Table 1a shows a unimodal form at any water content (10–50%), the average T2 value being 1000–1500 ms; the spectra of the mixtures intersect with that of distilled water at the point of the maximum amplitude. Regarding the spectra of the mixtures based on the medium-viscosity oil (Figure 1b), they have a unimodal form with the water content in the sample up to 30%; when the content exceeds 30%, an ‘inflection’ appears in the region of 1000 ms. The oil and water spectra intersect at 1500 ms. The spectra of the oil-D-based mixtures (Figure 1c) are bimodal when the water content in the sample exceeds 20%, with the maximum peaks at the relaxation times of free oil (150–200 ms) and distilled water (2000–2500 ms), respectively. The oil and water spectra virtually do not intersect; the separation of the peaks is observed at relaxation times of the order of 1000 ms. In this case, the amplitude of the water-related peak increases in proportion to the water content growth in the mixture. Figure 1d shows that the spectra of the mixtures based on the heaviest oil (E) always have a bimodal form with peak maxima at the times of volumetric relaxation of oil (20–30 ms) and distilled water (2000–2500 ms), respectively. At the same time, the peaks corresponding to the oil and water do not intersect, which indicates completely different NMR properties of these oil and water. The amplitudes of the peaks corresponding to the water/oil change proportionally to the water/oil content in the mixture, as is the case of the oil-D-based mixture (Figure 1c).
To find water content in the mixtures from NMR measurements, we proposed considering the integral area under that part of the mixture spectrum, which is to the right of the intersection point of the water and mixture spectra. The calculation results for all the samples are displayed in Table 4. One can see that for the mixtures based on heavy oils water content is obtained with the greatest accuracy. This is because the water and oil spectra do not intersect, their NMR properties being significantly different, which makes it possible to determine the contribution of each fluid to the signal with high accuracy. We have to point out that the results obtained for oil–water mixtures based on oil D (density 0.8632 g/cm3) are consistent with the data published in [16]. The authors say that the relative error is below 3% when the water content exceeds 20%, and the relative error is greater than 60% when the water content is less than 10%. We obtained an average water detection accuracy of 11.4%, which equals 4% for a water content of more than 20%. In [17], the oil–water ratio was determined only for the water content of 30 and 40% in a mixture of water and white oil. We determined the water content for mixtures based on oils of different viscosities. At the same time, the greatest error of determination is observed in mixtures based on light and medium oils with a water content of less than 20%: the error exceeds 40%. This is due to the fact that the transverse relaxation times of such oils and water intersect, which makes it impossible to separate the contribution from each fluid within the framework of studying only the transverse relaxation times. Probably, 2D T1-T2 maps can be used for the solution of this problem. However, the equipment used in this study does not allow measurements of longitudinal relaxation times. The authors consider this task as the next major stage and the continuation of the current study. With a water content of more than 20% in mixtures based on light oils, the error is about 20%.

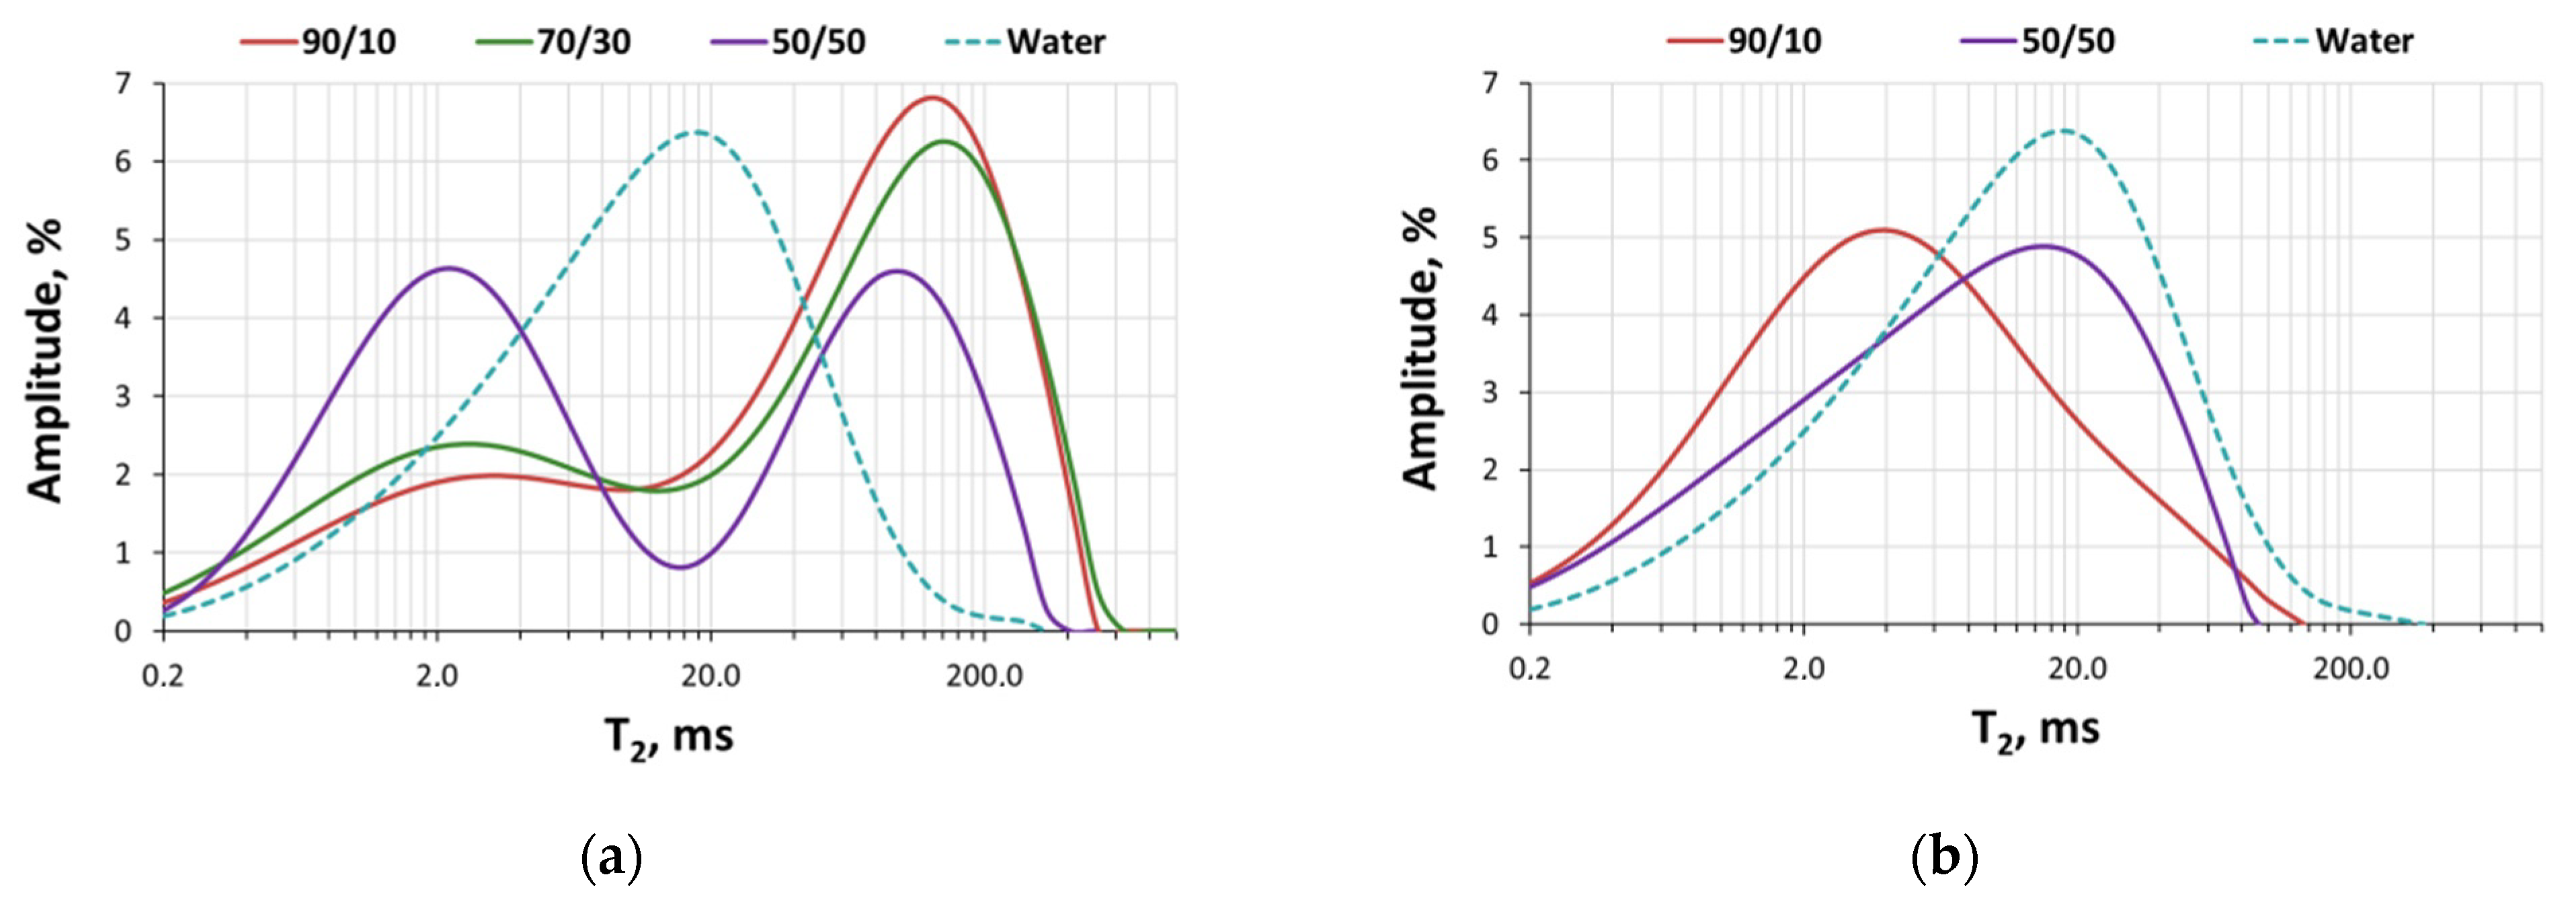
3.2. NMR Studies of Drill Cuttings at Mixed Saturation

On the drill cuttings samples (Table 3) saturated with the mixtures from oils C and E, NMR measurements were performed at a given saturation: 50/50, 70/30, and 90/10 (Figure 2). Since the volumes of oils A, B, and D were limited, the full cycle of drill cuttings saturation was carried out only with oil–water mixtures based on oils C and E. For the mixture associated with oil E, we did not manage to obtain a saturation of 70/30, since the authors had a limited volume of this oil. To minimize “effect” of the bimodal pore size (inner pores and voids between drill cuttings), after each saturation stage, we removed the water between the drill cuttings pieces with filter paper. For clarity, the graphs exhibit the spectrum of the drill cuttings saturated with brine with a mineralization of 6 g/L. It is unimodal with T2 times < 100 ms, the maximum amplitude of the spectrum occurring at a relaxation time of ≈10 ms.
The drill cuttings saturated with the oil-C-based mixture are characterized by bimodal spectra with a clear peak separation at 50/50 saturation, and by a smooth inflection at 70/30 and 90/10 saturations (Figure 2a). In this case, the inflection point and/or the separation point of the spectrum into two peaks lie in the region of 10 ms. With the rising oil content in the mixture, the spectra shift, albeit insignificantly, to the right, their amplitude increasing. The peak at longer times (about 100 ms) is close to the volumetric relaxation of oil C (Figure 1b). This fact may indicate that the oil phase does not wet the drill cuttings’ surface and, as a result, its relaxation occurs at a rate close to that of volumetric relaxation. Some authors showed that in partially saturated oil/water cores, a volumetric relaxation signal appears from the non-wetting phase [30,31].
The cuttings with the oil-E-based mixture are distinguished by unimodal spectra without inflections (Figure 2b). Meanwhile, the spectrum of the sample with a higher water content is located to the right on the T2 axis. Oil E contains more asphaltenes and can be more wetting, which eventually leads to lower T2 values than those of water. The deposition of asphaltenes on the surface of rocks mainly occurs unevenly, depending on the shape of the pores, surface roughness and mineralogical composition. This can lead to a complete or partial change in the wettability of the rock. The adsorption of asphaltenes can change the chemical composition of the pore surface, which will lead to a reduction in the relaxation time T2, since asphaltenes enhance the surface relaxation processes [32]. It worth noting that in Figure 2b we observe very low relaxation times (about 2 ms for drill cuttings saturated with the 90/10 mixture, and about 20 ms with the 50/50 mixture). This can be explained not only by the increased asphaltenes content in oil E, but also by the large amount of chlorite clay in the drill cuttings (about 20%), which leads to a high surface relaxation. The presence of paramagnetic and/or ferromagnetic ions in clays, such as iron, nickel, and magnesium, can complicate the analysis of NMR data when characterizing porous media. This is related to the gradient of the internal magnetic field created by clay minerals [33].
As provided by the described above methodology—through the intersection point of the water and mixture spectra but regarding the saturation with oil (since the spectrum is to the right of the water spectrum)—we calculated the saturations of the cuttings from NMR data and matched them against the mass-derived saturation values (Table 5). The 70/30 and 90/10 saturations are determined most accurately (average error being 16%); however, in general, this approach does not provide quantitative results, but drawing on the T2 spectra we can qualitatively determine the presence of water in the mixture.

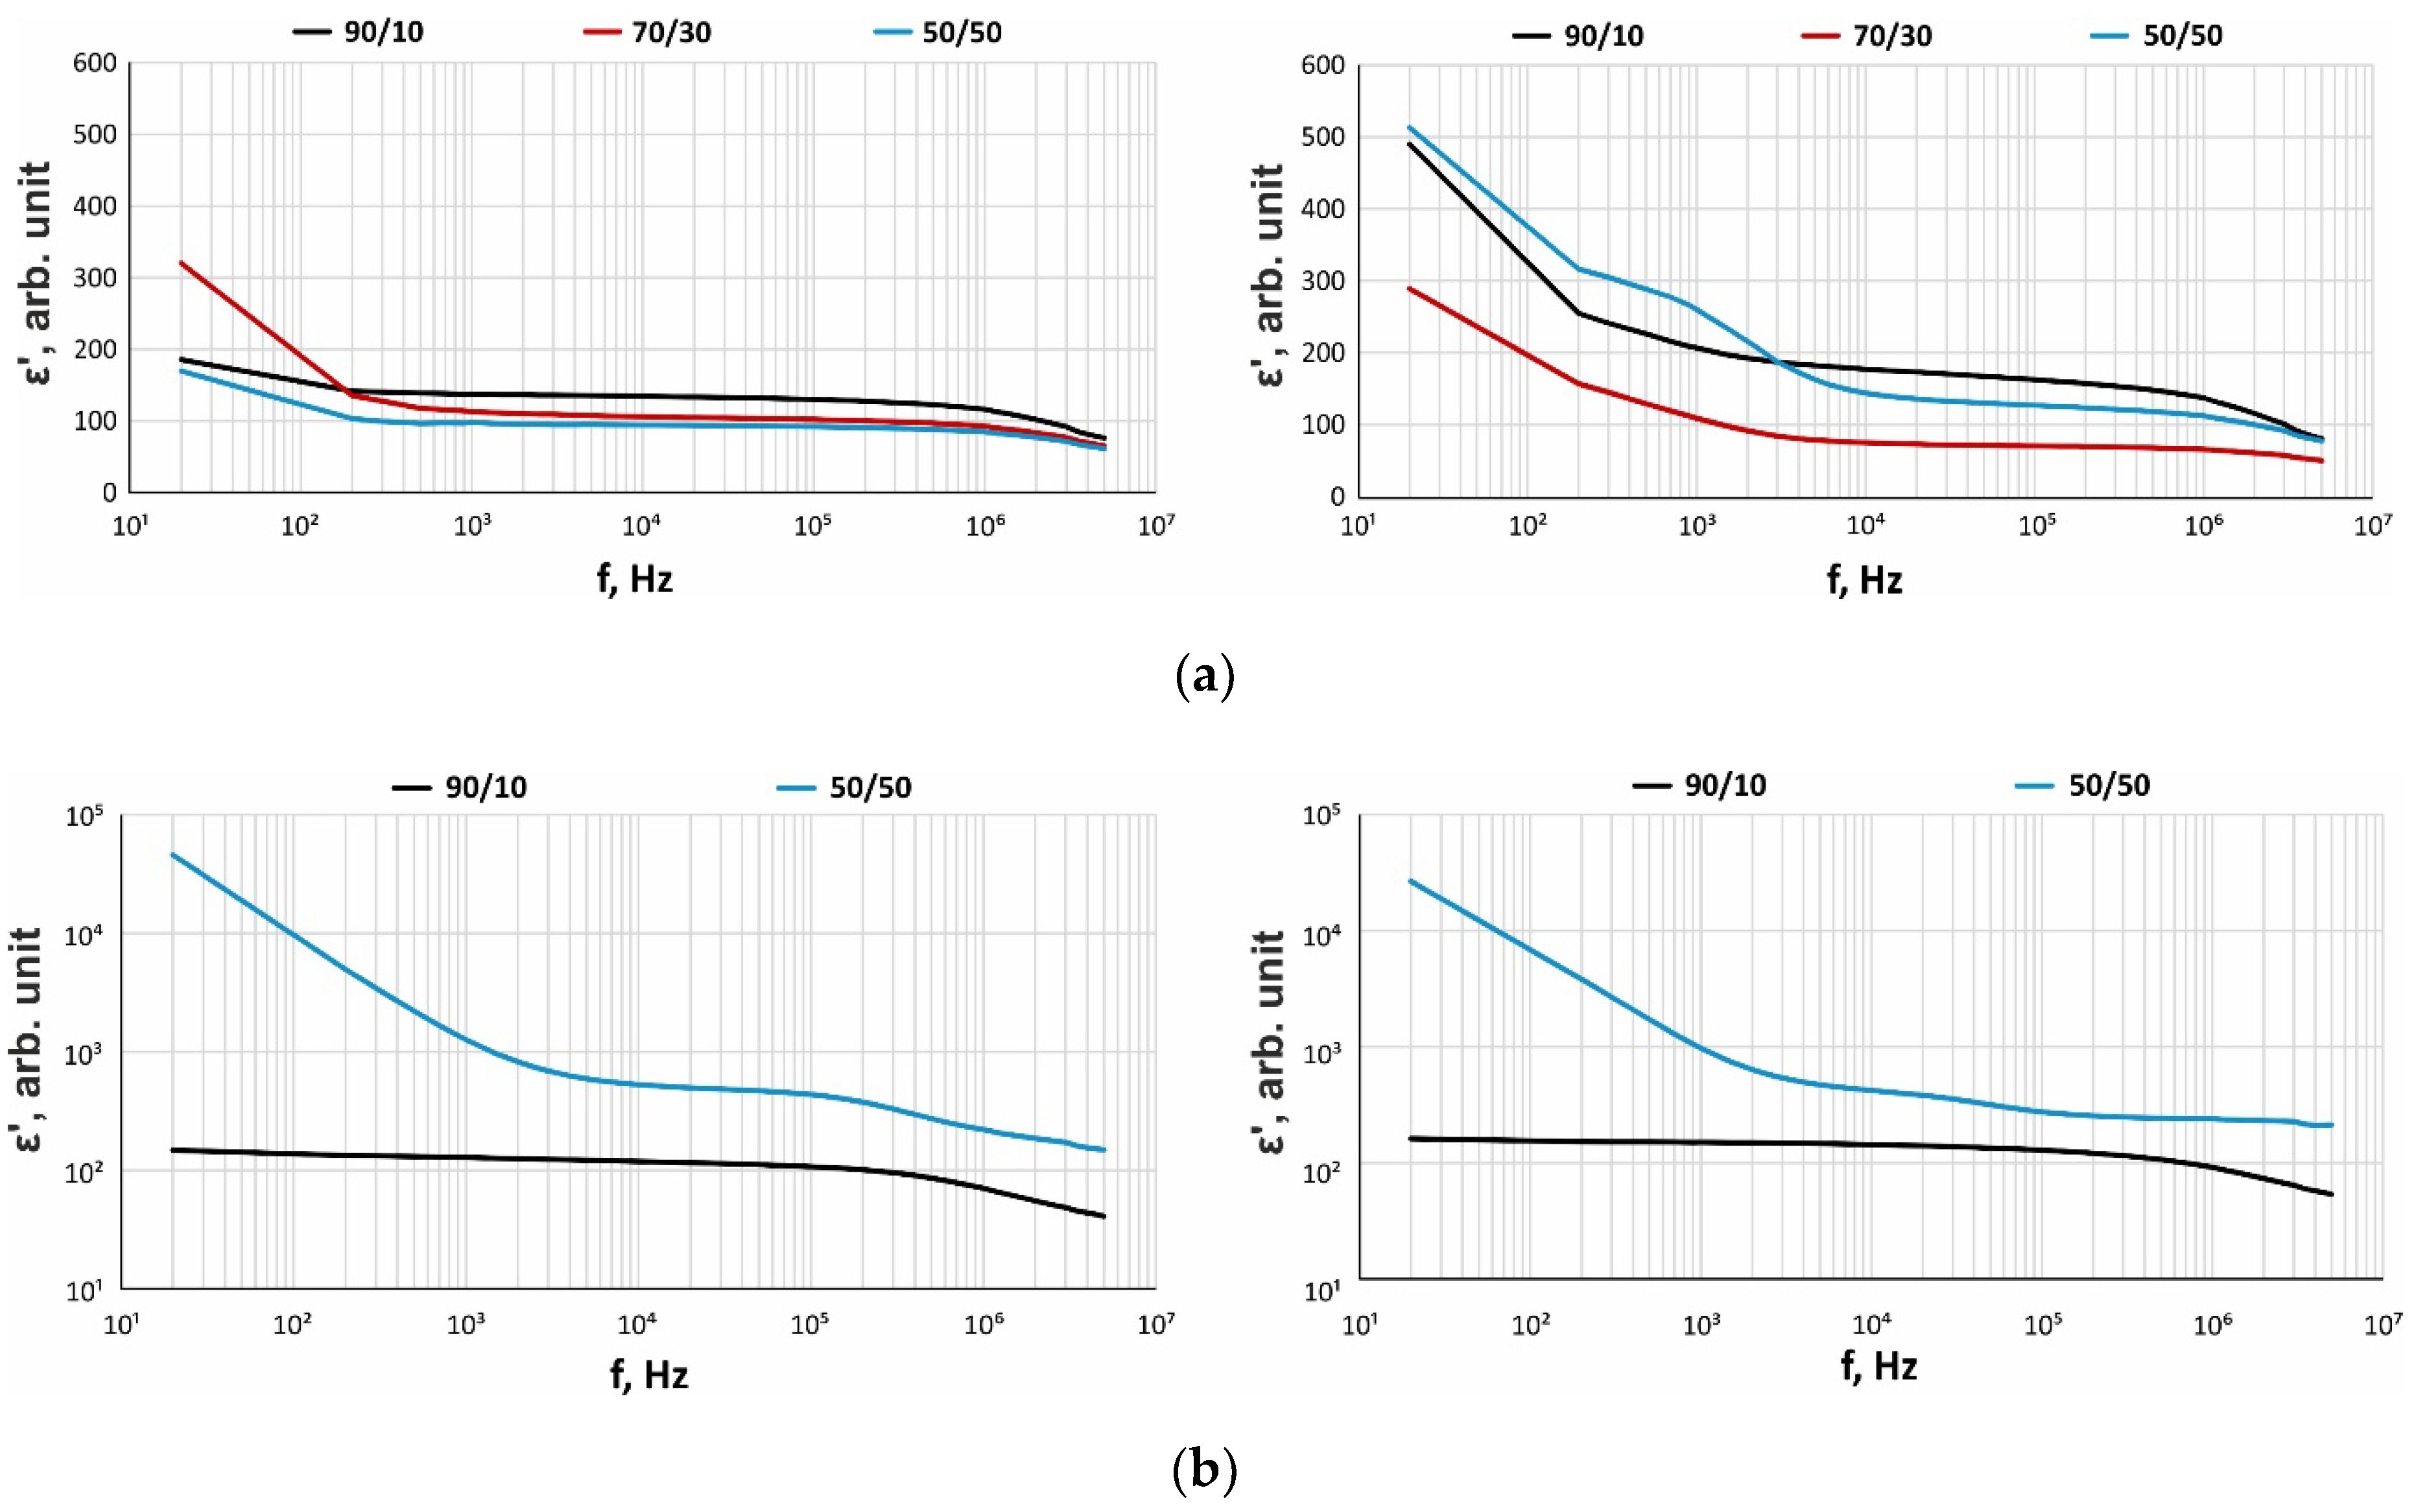
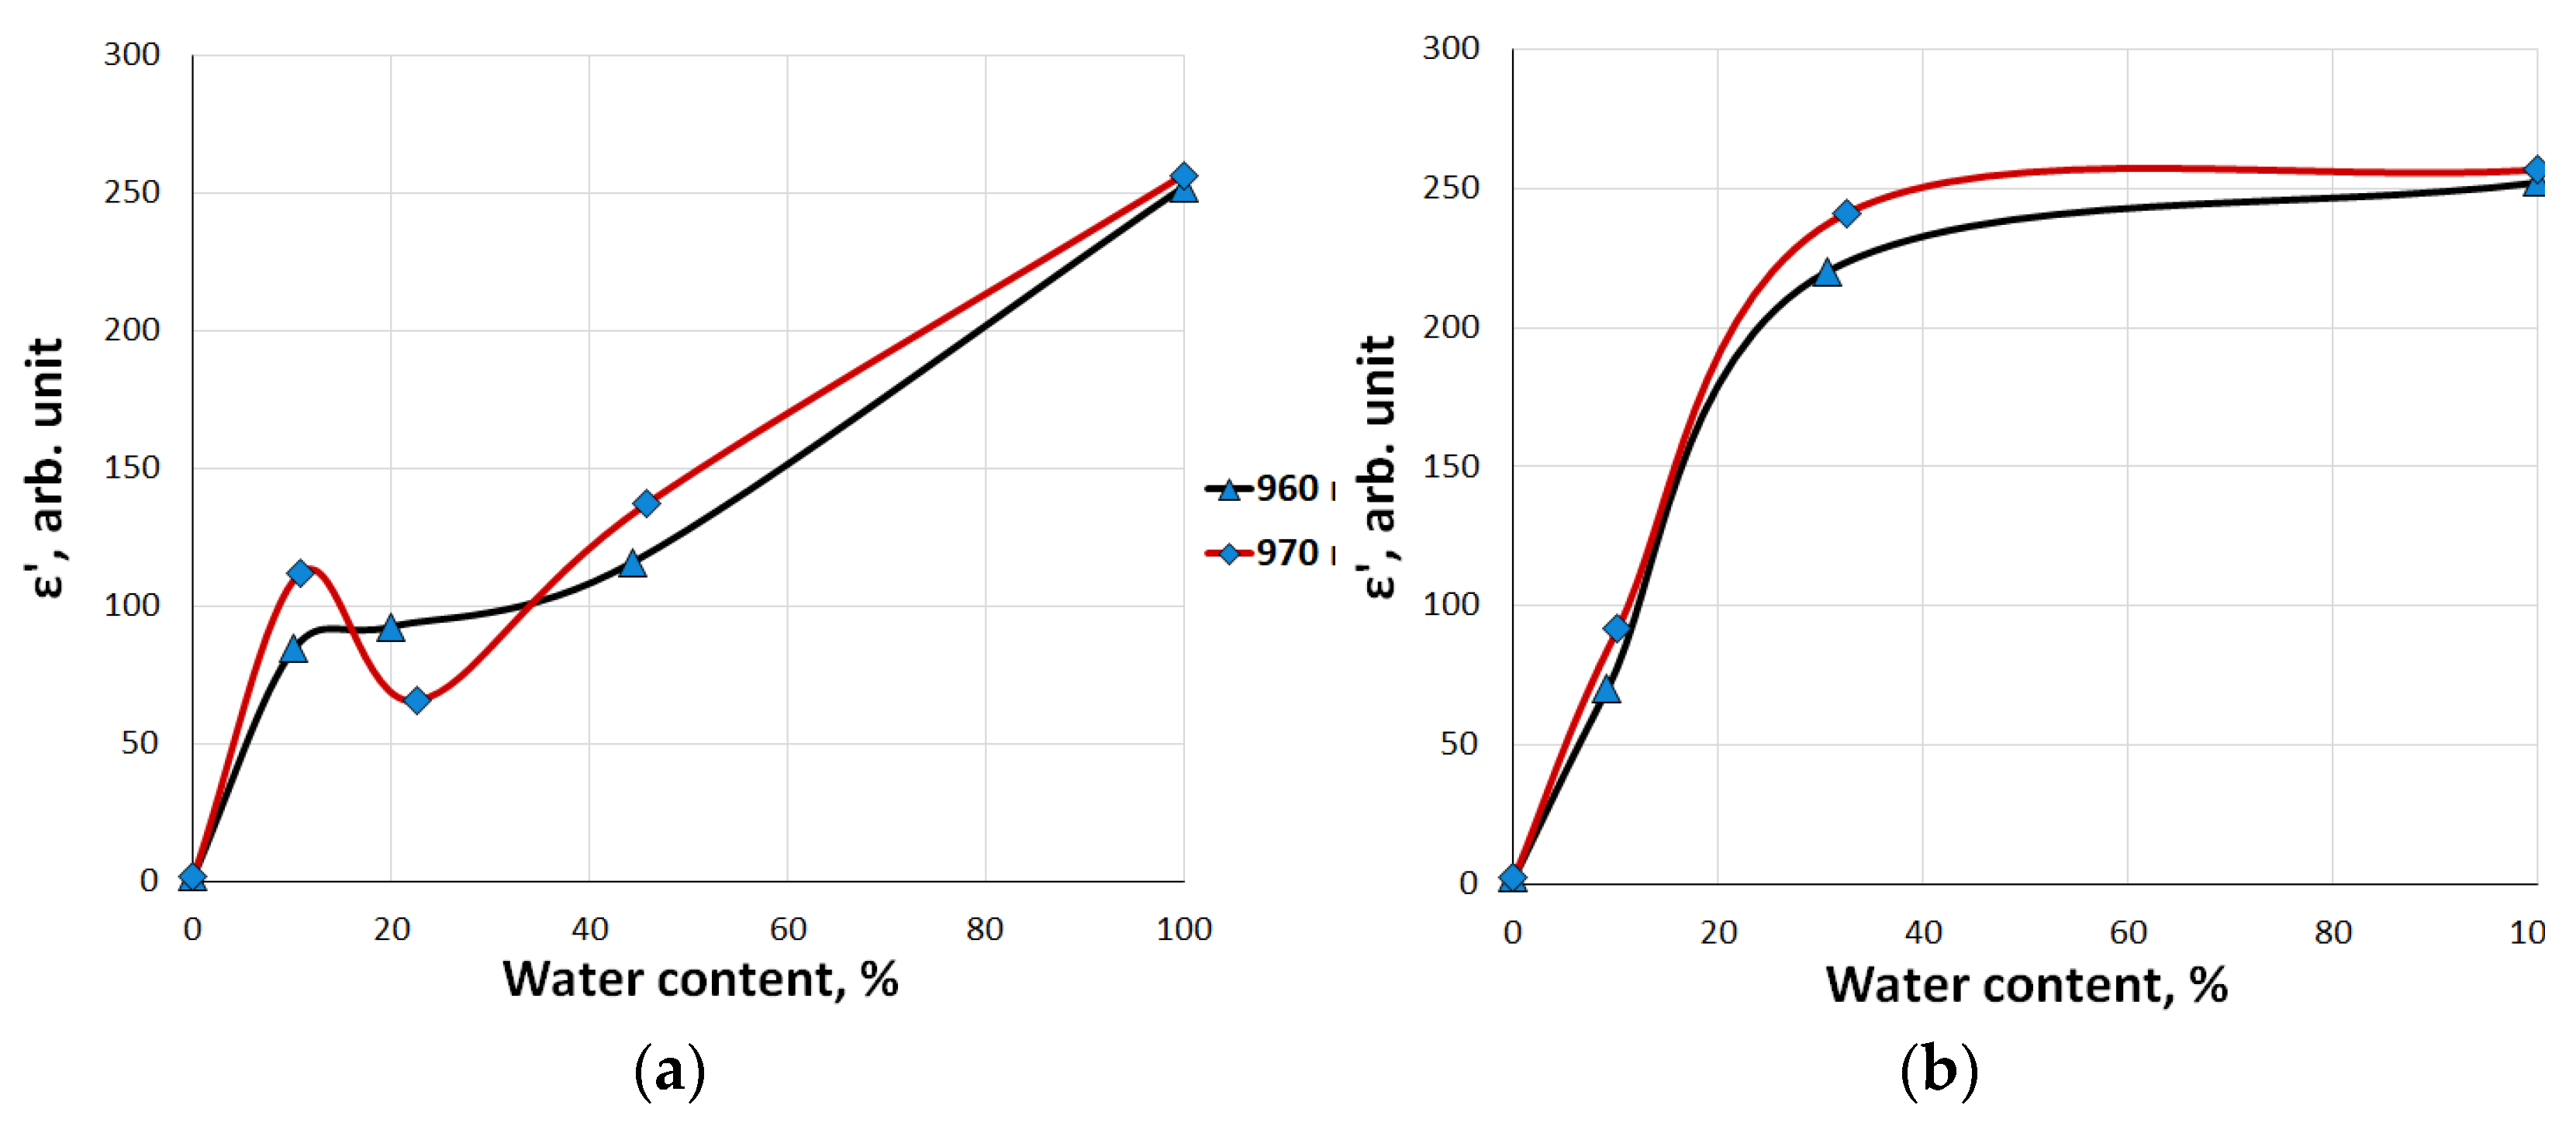
4. Dielectric Studies of Drill Cuttings

Following the results of the experimental study, the CDP spectra were obtained for all the drill cuttings samples (Table 3). Figure 3 displays the most representative spectra of the real part of CDP (ε′) for the samples saturated with the oil–water mixture related to oils C and E (Table 1).
The graphs demonstrate that for the sample with the high-viscosity oil E (Figure 3b), the real part of CDP increases with the growing water content in the sample. Accordingly, in the high-frequency region (f = 1 MHz) it regularly grows larger by about three times (70–220 rel. units for the sample from 960 m and 90–240 rel. units for the sample from 970 m). When the samples are saturated with the oil-C-based oil–water mixture (Figure 3a), an unambiguous conclusion cannot be drawn, since the behavior of the curves is irregular. Perhaps this is because the density of oil C differs from that of brine so much that the liquids in the pore space of the sample do not form a single system. Instead, they are present in the pores, for example, in the form of oil droplets in the void space (oil does not wet the surface of drill cuttings), whereas the water is adjacent to the grain surface. Such being the case, the oil and water separately contribute to the overall signal. In this regard, there is an additional relaxation in the frequency range of 1 kHz in the spectra of the real part of CDP for the sample from 970 m; this effect was observed by many researchers [34]. Such relaxation is valid only for the samples saturated with light oil C; for those with heavy oil E a similar effect is not shown. It seems not to be possible to estimate the amount of water/oil in the sample, because the liquids in the pore space manifest themselves differently in the spectra.
The graph in Figure 4 gives the dependence of the real part of CDP on the water content. For the samples saturated with the mixture from heavy oil E, the value consistently goes up with the growing water content. As for the samples based on light oil C, the type of the dependence changes with the water content exceeding 10%. Presumably, at such a water content, the saturating fluid transforms into a mixture in which a further increase in the water content leads to a uniform growth of the analyzed signal.
Examinations of the dielectric characteristics of the water–oil mixtures were not carried out, since the geometric parameters of the available experimental cell do not allow measurements of liquid samples with a large real part of CDP as in distilled water (ε = 80 rel. units). To conduct such investigations, the necessary experimental cell was designed and is currently under development.

5. Conclusions

The research was aimed at the experimental examination of complex interpretation of NMR relaxometry and dielectric spectroscopy data when studying the filtration-volumetric properties of drill cuttings and NMR characteristics of oil-containing reservoir fluids, as well as assessing the water ratio in water–oil mixtures and porous media they saturate. For the first time, the authors obtained NMR characteristics of oil samples from several fields in the north of West Siberia. It was experimentally established that the physical-chemical properties of the oils, which are the basis of oil–water mixtures, affect the accuracy of determining the water content in the mixture from NMR data. Viscous-oil-based mixtures are characterized by bimodal spectra of transverse relaxation times, whereas light oil-based ones are marked by unimodal spectra or having a slight inflection. With a growth in the water content in the mixture, the spectra shift toward large relaxation times for the mixtures based on light and medium oils. However, for those based on heavy oils, the position of the spectra on the relaxation time axis changes insignificantly, while the amplitude variates proportionally to the water/oil content in the mixture. To estimate the water content from NMR, we proposed to consider the area under that part of the mixture spectrum, which is to the right of the intersection point with the distilled water spectrum. At the same time, for the heavy-oil-based mixtures the accuracy of water–oil ratio calculation is 4% with a water content of 20% in the mixture. This is because of their NMR properties being significantly different, which makes it possible to determine the contribution of each fluid to the signal with high accuracy. The data obtained are consistent with the data published in open sources. For mixtures based on the light oils, the accuracy of determination exceeds 20% with a water content exceeding 20%, and 40% with the content less than 20%. The reason for such a high error is that the intervals of characteristic transverse relaxation times of water and light oil intersect.
The NMR experiments on drill cuttings present another picture: the spectra are unimodal when the mixture is based on viscous oil, and bimodal in the case of medium-viscosity-oil. It was experimentally confirmed that a volume relaxation signal from a non-wetting phase can appear in rocks partially saturated with oil/water. At the same time, the increased content of asphaltenes in the composition of the saturating fluid can lead to a complete or partial change in the wettability of the rock because of the deposition of asphaltenes on its surface. When studying samples of drill cuttings saturated with an oil–water mixture based on medium-viscosity oil, it was determined by dielectric spectroscopy that a sharp increase in the value of the real part of the CDP occurs for all samples at a water saturation of the sample of 10%, followed by a decrease in the CDP at the saturation of about 20%. Such a feature in the behavior of the real part of the CDP is most likely related to the hydrophobicity of the studied samples. When samples are saturated with a mixture based on heavy oil, the values of the dielectric permittivity increase with a growth in the percentage of water in the sample, but not proportionally. Thus, it is established that the actual part of the CDP is disproportionate to the amount of water in the sample. Therefore, to determine the water saturation of drilling mud samples, an integrated approach should be applied, including the interpretation of both dielectric and NMR data. The combination of these two methods makes it possible to estimate the oil–water ratio in the pore space of a rock with an accuracy of about 15%.
We experimentally established the NMR relaxometry method to be effective for determining water content in water–oil mixtures based on high-viscosity and medium oils, as well as in samples of saturated with them drill cuttings. Dielectric spectroscopy, on the other hand, gives reliable results when studying cuttings partially saturated with light oil. Thus, with the complex interpretation of these methods, it is possible to obtain reliable data on the water content in hydrocarbon fluids over a wide range of their physicochemical properties.
Later on, the attained results can make it possible to monitor the composition of fluids produced from boreholes, as well as to evaluate the petrophysical parameters of reservoirs under development.

Author Contributions

Conceptualization, M.S.; methodology, M.S., A.M. and N.G.; investigation, A.M., A.B. and E.C. and S.M.; writing—original draft preparation, M.S., N.G., A.M., A.B., E.C. and S.M; writing—review and editing, M.S., A.M., A.B., E.C. and N.G.; supervision, M.S.; project administration, M.S.; funding acquisition, M.S. All authors have read and agreed to the published version of the manuscript.

Funding

The research was funded by RFBR and Novosibirsk region, project number 20-45-540002.

Institutional Review Board Statement

Not applicable.

Informed Consent Statement

Not applicable.

Data Availability Statement

The data presented in this study are available on request from the corresponding author. The data are not publicly available due to the new line of research.

Acknowledgments

The authors are grateful to Vladimir A. Cheverda and Vyacheslav Glinskikh for offering to publish this article in this Special Issue.

Conflicts of Interest

The authors declare no conflict of interest.

References

  1. Ulmishek, G.F. Petroleum Geology and Resources of the West Siberian Basin, Russia; 2201-G; US Geological Bulletin: Reston, VA, USA, 2003; p. 53.
  2. Komgort, M.V. The problem of Siberian oil in scientific polemics during the period from 1920 to 1930. Bull. Tyumen State Univ. 2010, 1, 90–95. [Google Scholar]
  3. Rajinder, P. Techniques for measuring the composition (oil and water content) of emulsions—A state of the art review. Colloids Surf. A Physicochem. Eng. Asp. 1994, 84, 141–193. [Google Scholar] [CrossRef]
  4. Coates, G.; Xiao, L.; Prammer, M. NMR Logging. Principles and Application; Halliburton energy Services: Houston, TX, USA, 2001; p. 342. [Google Scholar]
  5. Flaum, M.; Hirasaki, G.J.; Flaum, C.; Straley, C. Measuring pore connectivity by pulsed field gradient diffusion editing with hydrocarbons gases. Magn. Resonan. Imaging 2005, 23, 337–339. [Google Scholar] [CrossRef] [PubMed]
  6. Mirotchnik, K.; Kantzas, A.; Starosud, A.; Aikman, M. A New method for group analysis of petroleum fractions in unconsolidated porous media. J. Can. Petrol. Technol. 2001, 40, 38–44. [Google Scholar] [CrossRef]
  7. Howard, J.J. Quantitative estimates of porous media wettability from proton NMR measurements. Magn. Resonan. Imaging 1998, 16, 529–533. [Google Scholar] [CrossRef]
  8. Hürlimann, M.D.; Freed, D.E.; Zielinski, L.J.; Song, Y.Q.; Leu, G.; Straley, C.; Cao Minh, C.; Boyd, A. Hydrocarbon Composition from NMR Diffusion and Relaxation Data. Petrophysics 2009, 50, 116–129. [Google Scholar]
  9. Korb, J.P.; Vorapalawut, N.; Nicot, B.; Bryant, R.G. Relation and Correlation between NMR Relaxation Times, Diffusion Coefficients, and Viscosity of Heavy Crude Oils. J. Phys. Chem. 2015, 119, 24439–24446. [Google Scholar] [CrossRef]
  10. Freedman, R.; Heaton, N. Fluid characterization using nuclear magnetic resonance logging. Petrophysics 2004, 45, 241–250. [Google Scholar]
  11. Shkalikov, N.V.; Skirda, V.D.; Archipov, R.V. Solid-like component in the spin-spin NMR-relaxation of heavy oils. Magn. Resonan. Solids Electron. J. 2006, 8, 38–42. [Google Scholar]
  12. Bryan, J.; Kantzas, A.; Bellehumeur, C. Oil-viscosity predictions from low-field NMR measurements. SPE Reserv. Eval. Eng. 2005, 8, 44–53. [Google Scholar] [CrossRef]
  13. Birdwell, J.E.; Washburn, K.E. Multivariate Analysis Relating Oil Shale Geochemical Properties to NMR Relaxometry. Energy Fuels 2015, 29, 2234–2243. [Google Scholar] [CrossRef]
  14. Kashaev, R.S. Viscosity Correlations with Nuclear (Proton) Magnetic Resonance Relaxation in Oil Disperse Systems. Appl. Magn. Resonan. 2018, 49, 1–7. [Google Scholar] [CrossRef]
  15. Liu, J.; Feng, X.; Wang, D. Determination of water content in crude oil emulsion by LF-NMR CPMG sequence. Petrol. Sci. Technol. 2019, 37, 1123–1135. [Google Scholar] [CrossRef]
  16. Zhand, R.; Huo, J.; Peng, Z.; Feng, Q.; Wang, J.; Zhang, J. Research on Oil-Based Drilling Fluids Emulsion Droplet by Low-Field NMR. Appl. Magn. Resonan. 2016, 47, 1339–1352. [Google Scholar] [CrossRef]
  17. Rinaldi, V.A.; Francisca, F.M. Impedance analysis of soil dielectric dispersion (1 MHz–1 GHz). J. Geotech. Geoenviron. Eng. 1999, 125, 111–121. [Google Scholar] [CrossRef]
  18. Bobrov, P.P.; Belyaeva, T.A.; Kroshka, E.S.; Rodionova, O.V. Relationship of low-frequency dielectric permittivity with the conductivity of low-salted sand samples. Radio Commun. Technol. 2020, 3, 85–94. [Google Scholar] [CrossRef]
  19. Akselrod, S.M. New trends in dielectric logging (based on foreign press materials). Karotazhnik 2012, 4, 78–112. (In Russian) [Google Scholar]
  20. Dzhafarov, I.S.; Syngaevsky, P.E.; Khafizov, S.F. Application of the Method of Nuclear Magnetic Resonance to Characterize the Composition and Distribution of Reservoir Fluids; Chemistry: Moscow, Russia, 2002; p. 439. [Google Scholar]
  21. Abragam, A. The Principles of Nuclear Magnetism; Clarendon Press: Oxford, UK, 1962; p. 599. [Google Scholar]
  22. Axelrod, S.M. Nuclear Magnetic Resonance in Oil and Gas Geology and Geophysics; Nedra: Moscow, Russia, 1990; p. 192. [Google Scholar]
  23. Dunn, K.J.; Bergman, D.J.; LaTorracca, G.A. Nuclear Magnetic Resonance. Petrophysical and Logging Application; PERGAMON: London, UK, 2002; p. 294. [Google Scholar]
  24. Tikhonov, A.N.; Goncharsky, A.V.; Stepanov, V.V.; Yagola, A.G. Numerical Methods for Solving Ill-Posed Problems; Nedra: Moscow, Russia, 1992; p. 232. [Google Scholar]
  25. Turakhanov, A.H.; Shumskayte, M.Y.; Ildyakov, A.V.; Manakov, A.Y.; Smirnov, V.G.; Glinskikh, V.N.; Duchkov, A.D. Formation of methane hydrate from water sorbed by anthracite: An investgation by low-field NMR relaxation. Fuel 2020, 262, 1–6. [Google Scholar] [CrossRef]
  26. Brandt, A.A. Investigation of Dielectrics at Ultrahigh Frequencies; State Publishing House of Physical and Mathematical Literature: Moscow, Russia, 1963; p. 404. [Google Scholar]
  27. Lapina, A.S.; Bobrov, P.P.; Golikov, N.A.; Repin, A.V.; Shumskayte, M.Y. Hysteresis of the NMR response and the complex relative permittivity of the quartz granules powders and solid sandstones during the water imbibition and drainage. Meas. Sci. Technol. 2016, 28, 7. [Google Scholar] [CrossRef]
  28. ASTM D5002-19; Standard Test Method for Density, Relative Density, and API Gravity of Crude Oils by Digital Density Analyzer. ASTM International: West Conshohocken, PA, USA, 2019. Available online: www.astm.org (accessed on 7 October 2021).
  29. ASTM D445-17; Standard Test Method for Kinematic Viscosity of Transparent and Opaque Liquids (and Calculation of Dynamic Viscosity). ASTM International: West Conshohocken, PA, USA, 2017. Available online: www.astm.org (accessed on 6 April 2022).
  30. Fleury, M.; Deflandre, F. Quantitative evaluation of porous media wettability using NMR relaxometry. Magn. Resonan. Imaging 2003, 21, 385–387. [Google Scholar] [CrossRef]
  31. Al-Garadi, K.; El-Husseiny, A.; Elsayed, M.; Connolly, P.; Mahmoud, M. A rock core wettability index using NMR T2 measurements. J. Petrol. Sci. Eng. 2022, 208, 109386. [Google Scholar] [CrossRef]
  32. Mohammed, I.; Mahmoud, M.; El-Husseiny, A.; Al Shehri, D.; Al-Garadi, K.; Kamal, M.S.; Alade, O.S. Impact of Asphaltene Precipitation and Deposition on Wettability and Permeability. ACS Omega 2021, 6, 20091–20102. [Google Scholar] [CrossRef] [PubMed]
  33. Elsayed, M.; Glatz, G.; El-Husseiny, A.; Alqubalee, A.; Adebayo, A.; Al-Garadi, K.; Mahmoud, M. The Effect of Clay Content on the Spin–Spin NMR Relaxation Time Measured in Porous Media. ASC Omega 2020, 5, 6545–6555. [Google Scholar] [CrossRef] [PubMed]
  34. Vasilyeva, M.A.; Gusev, Y.A.; Shtyrlin, V.G.; Greenbaum (Gutina), A.; Puzenko, A.; Ishai, P.B.; Feldman, Y. Dielectric relaxation of water in clay minerals. Clays Clay Miner. 2014, 62, 62–73. [Google Scholar] [CrossRef]
Figure 1. Transverse relaxation time spectra for the water–oil mixtures: (a) A1–A5; (b) C1–C5; (c) D1–D5, (d) E1–E5.
Geosciences 12 00179 g001
Figure 2. Transverse relaxation time spectra for the drill cuttings sampled from the 1010 m depth and saturated with water–oil mixtures: (a) based on oil C; (b) based on oil E.
Geosciences 12 00179 g002
Figure 3. Spectra of the real part of CDP for the drill cuttings from 960 (left) and 970 (right) m depths, saturated with water–oil mixtures: (a) based on oil C; (b) based on oil E.
Geosciences 12 00179 g003
Figure 4. Dependences of the real part of CDP (at 1 MHz) on the water content for the drill cuttings from 960 and 970 m depths, saturated with water–oil mixtures: (a) based on oil C; (b) based on oil E.
Geosciences 12 00179 g004
Table 1. Characteristics of the hydrocarbon fluids used in the study: oils and condensate from the fields of West Siberia.
SampleFieldDensity, g/cm3Dynamic Viscosity, MPa∙sGroup Composition (Mass %)
Content of Saturated and Aromatic HydrocarbonsContent of Resins and Asphaltenes
ASalmanovskoye0.77510.9299.80.2
BSalymskoye0.81533.1197.12.9
CPravdinskoe0.83315.0398.71.3
DPravdinskoe0.86326.5186.913.1
ERusskoye0.936534.5383.716.3
Table 2. Sample compositions for the water–oil mixtures.
Sample NameSample CompositionSample NameSample Composition
WaterDistilled waterD190% oil D + 10% water
A190% oil A + 10% waterD280% oil D + 20% water
A280% oil A + 20% waterD370% oil D + 30% water
A370% oil A + 30% waterD460% oil D + 40% water
A460% oil A + 40% waterD550% oil D + 50% water
A550% oil A + 50% waterE190% oil E + 10% water
B190% oil B + 10% waterE280% oil E + 20% water
B280% oil B + 20% waterE370% oil E + 30% water
B370% oil B + 30% waterE460% oil E + 40% water
B460% oil B + 40% waterE550% oil E + 50% water
B550% oil B + 50% water
C190% oil C + 10% water
C280% oil C + 20% water
C370% oil C + 30% water
C460% oil C + 40% water
C550% oil C + 50% water
Table 3. Lithological description of the drill cuttings.
Sample NumberSampling Depth, mϕ (NMR), %Lithological Description
196013.21argillaceous siltstone with interbedded mudstone, carbonatized, with HC smell
297018.71argillaceous siltstone with interbedded mudstone, carbonatized, with HC smell
3100015.11argillaceous siltstone with interbedded mudstone, carbonatized, with HC smell
4101017.36argillaceous siltstone with interbedded mudstone, carbonatized, with HC smell
5102014.57argillaceous siltstone with interbedded mudstone, carbonatized, with HC smell
6103013.99argillaceous siltstone with interbedded mudstone, carbonatized, with HC smell
7104019.52medium-grained sand admixed with carbonates
Table 4. Water content in the water–oil mixtures: actual and calculated from NMR data.
Sample NumberActual Water Content in the Sample, %Water Content Calculated from NMR Data, %Sample NumberActual Water Content in the Sample, %Water Content Calculated from NMR Data, %
A11017C44027
A22032C55026
A33042D1106
A44044D22019
A55055D33028
B1108D44038
B22016D55050
B33027E11015
B44035E22022
B55037E33036
C1106E44049
C22011E55062
C33024
Table 5. Oil saturation of the drill cuttings (oil C), calculated by mass and NMR data.
Sampling Depth, mOil Saturation from NMR Data, %Oil Saturation Calculated by Mass, %
50/5070/3090/1050/5070/3090/10
96040.564.572.119.340.147.5
97037.051.164.422.340.154.8
100034.945.860.135.845.564.4
101029.153.456.828.046.446.3
102029.247.162.216.949.045.9
103032.755.263.228.947.651.6
10406.930.831.819.246.833.3
Publisher’s Note: MDPI stays neutral with regard to jurisdictional claims in published maps and institutional affiliations.

