Article

A More Comprehensive Way to Analyze Foam Stability for EPB Tunnelling—Introduction of a Mathematical Characterization

Department of Environment, Land and Infrastructure Engineering, Polytechnic University of Turin, 10129 Turin, Italy
*
Author to whom correspondence should be addressed.
Submission received: 10 March 2022 / Revised: 23 April 2022 / Accepted: 26 April 2022 / Published: 28 April 2022

Abstract

:
In the tunnelling industry, a large share of the market is occupied by EPB (Earth Pressure Balance) machines. To operate this kind of machine, a radical change in the rheological behaviour of the excavated soil must be performed, and this is achieved by adding water, foam, and, eventually, polymers. The stability of the foam is assessed through a half-life test. The main limitation of this test is that only one value is used in the characterization of the foam degradation process, which is insufficient to describe the whole evolution of the phenomenon. The results of more than 270 tests were modelled through a five-parameter mathematical formulation that suited the experimental data. The results show that the influence of concentration on the stability of the foam is not always present and that the flow rate used during production bears an influence on the characteristics of the foam.

1. Introduction

The EPB tunnelling process is strictly linked with the quality of the soil conditioning process. Conditioning is a complex task as discussed by Peila et al. [1], Thewes and Budach [2] and Liu et al. [3] and many different parameters are involved both with reference to the soil properties and to the chemistry of the conditioning agents [4]. Foam is the key conditioning agent. Since the bubbles strongly interact with the soil grains and the foam quality influences the conditioning process to a great extent, the assessment of the foam properties presents a key issue in the development of the soil conditioning design.
In this paper a new procedure for the evaluation of foam stability is proposed. The reference test currently available is focused on a single parameter to characterize the stability of foam: its half-life time. Although its simplicity makes this test common and easy to perform, the results are insufficient to completely characterize the behaviour of foam in time and the output may be ambiguous. Maintaining the main structure of the test and its simplicity, a new method for the data analysis is proposed in order to fully describe the degradation process of foam in time.

1.1. Soil Conditioning

The addition of foam to soil radically changes its mechanical behaviour where it becomes modified from solid-like to liquid-like in order to achieve several objectives.
From a geo-mechanical perspective, the conditioning aims to a reduction of both the internal friction angle and cohesion of the soil [5] and to increase the workability of the material as clearly shown in Figure 1.
As well known, foam is the most used conditioning agent, whose bubbles located between soil grains reduce the internal friction of the soil allowing it to gain the aforementioned properties [6,7].
From a tunnel excavation perspective, correct conditioning is necessary to handle the counterpressure in the excavation chamber, waterproof the screw conveyor, reduce wear, avoid segregation in the excavation chamber, prevent clogging on the metallic parts of the TBM and in general to correctly manage the excavation activities [8,9,10,11,12,13,14].
Furthermore, a correct conditioning design has to aim also to reduce the environmental impact of the tunnelling process. Hence, an accurate assessment of the influence of the foaming agent concentration on foam stability, and consequently on the stability of the conditioned soil, is necessary to reduce the environmental risks described by Barra Caracciolo et al. [15] and Firouzei el al. [16].

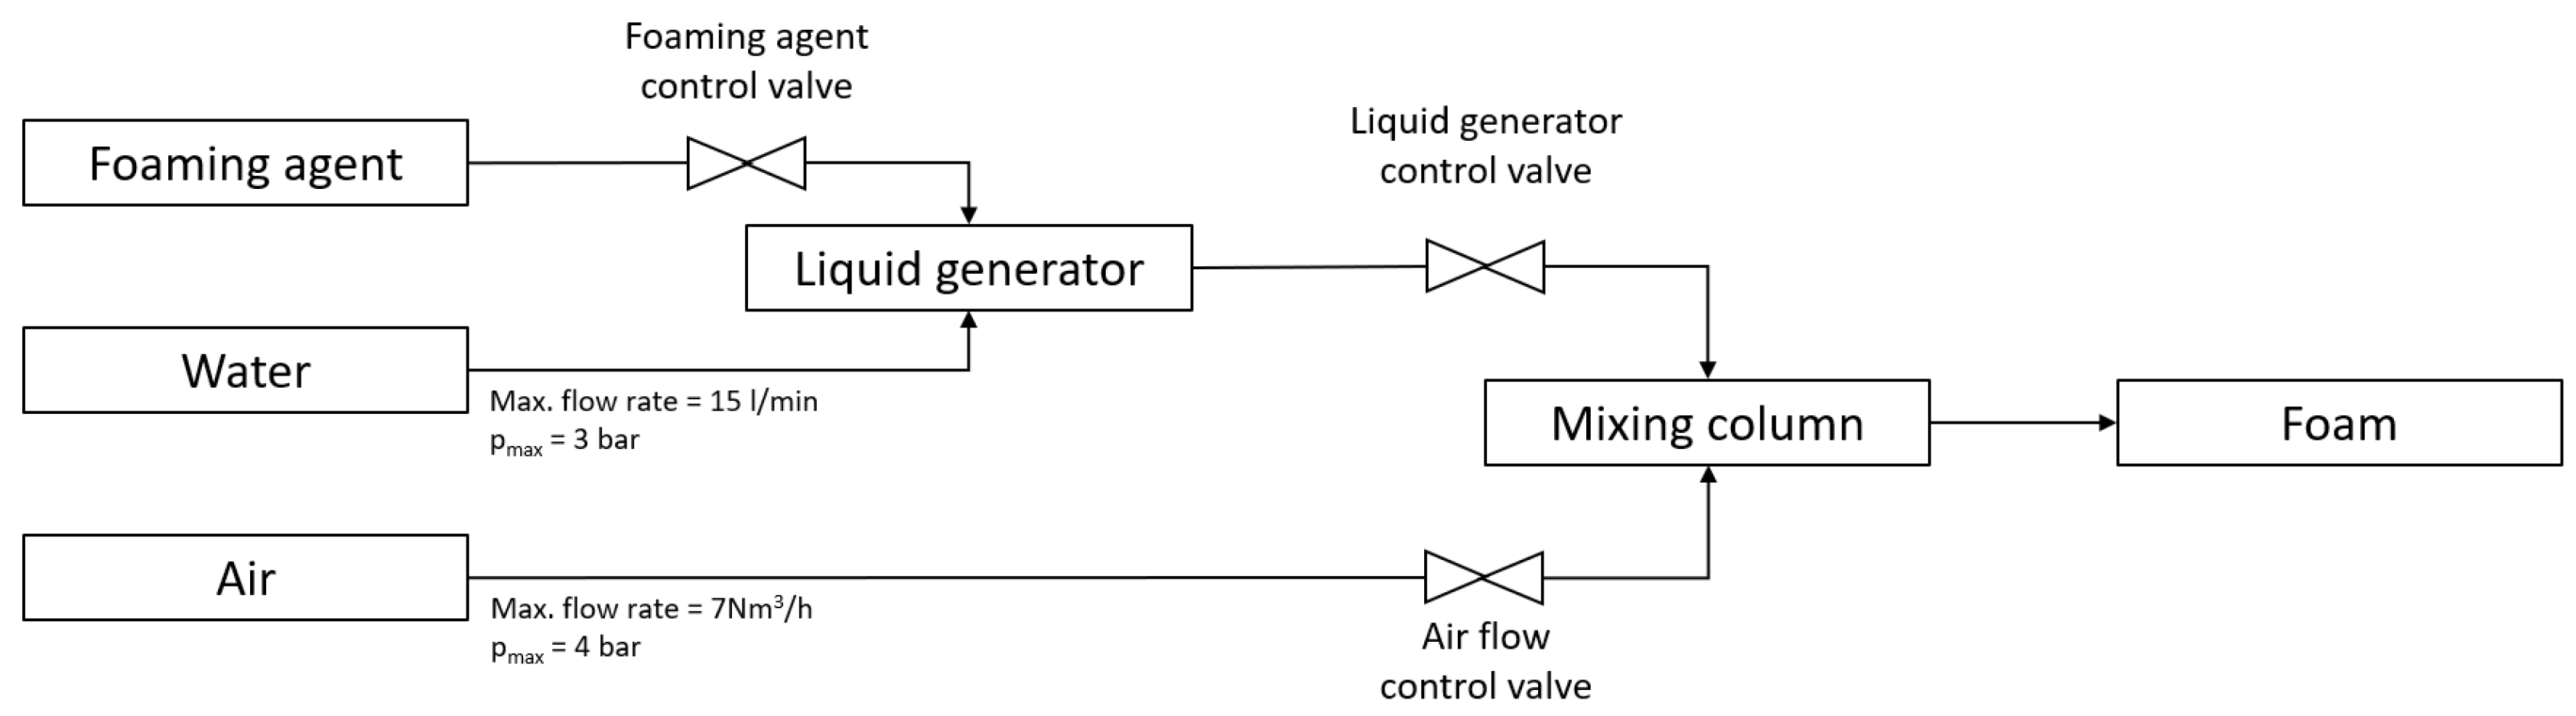
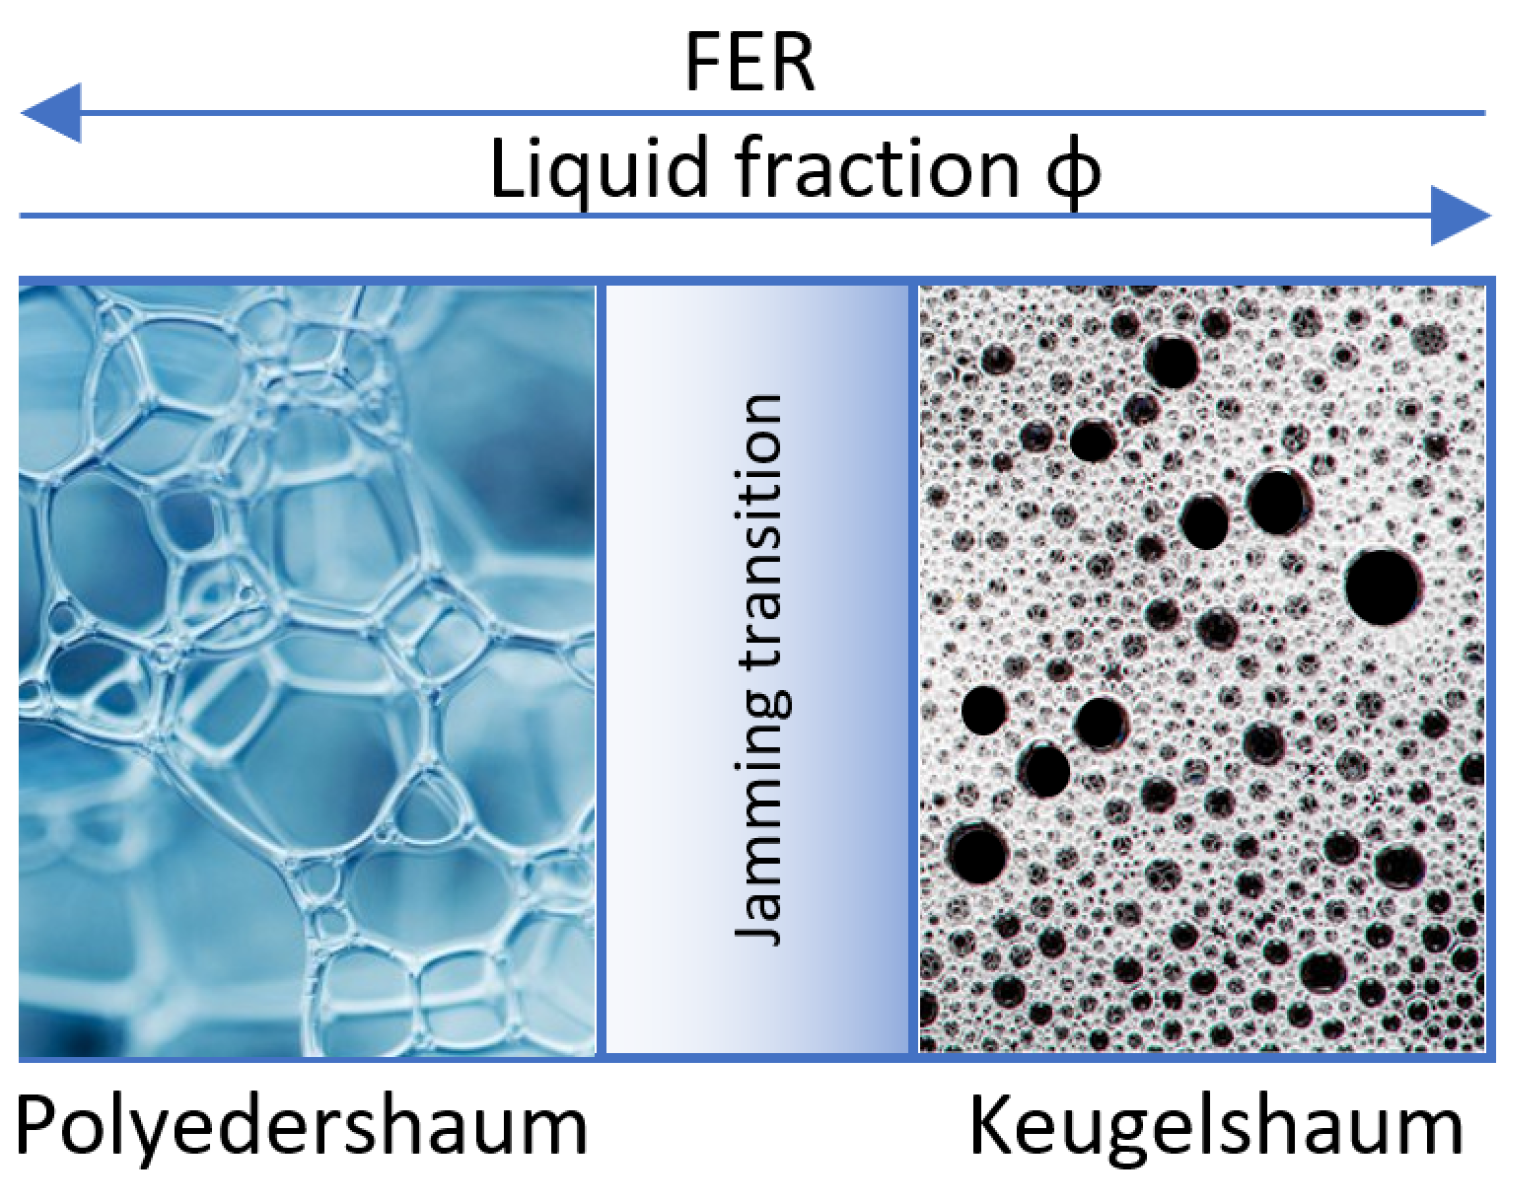
1.2. Foam Generation and Characterization
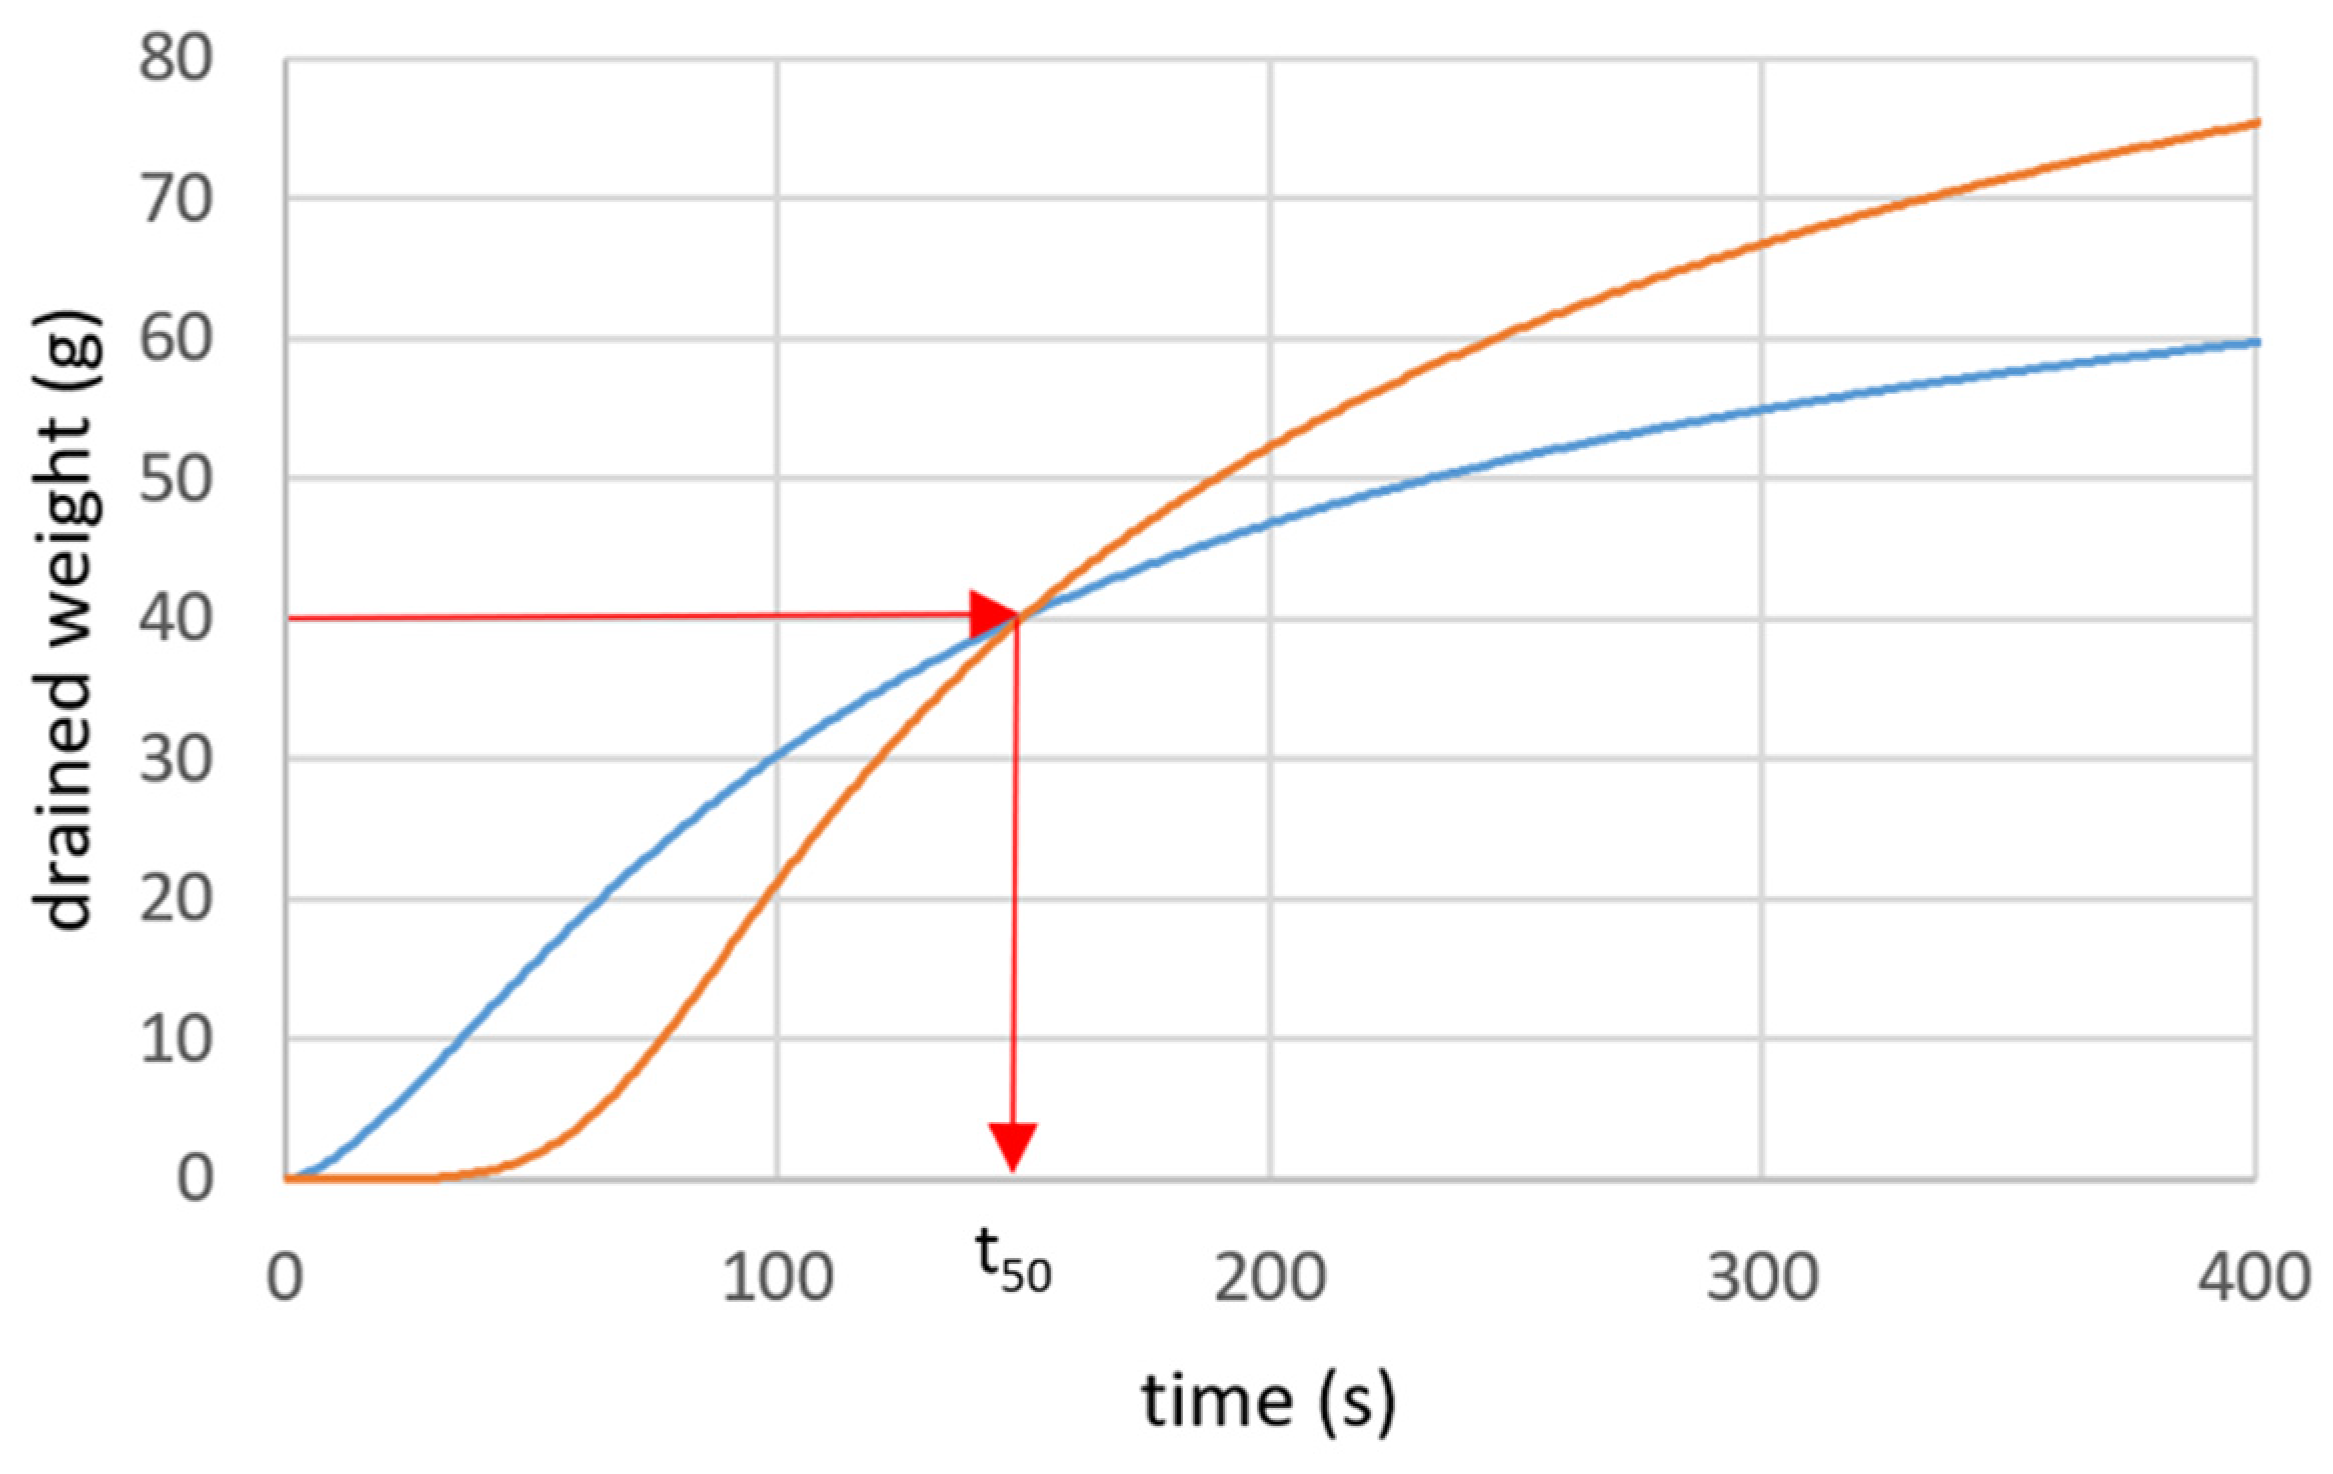
For the present research, the foam was produced with a generator whose scheme is given in Figure 2 and which was also used previously in preliminary research [17,18].
To produce foam, air is insufflated in a solution of water and surfactant (liquid generator) and the streams of the two components are turbulently mixed through a mixing column of internal diameter 80 mm and length 450 mm filled with glass beads of 5 mm diameter.
This generator operates with liquid generator flow rates up to 11.9 L/min and air flow rates up to 7 Nm3/h.
The foam conditioning is usually characterized by three parameters [18,19]: liquid generation concentration (cf), Foam Expansion Ratio (FER) and Foam Injection Ratio (FIR) defined by the following volumetric relationships valid at atmospheric pressure.
c f = v s u r f a c t a n t v l i q u i d   g e n e r a t o r × 100 ,
F E R = v f o a m v l i q u i d   g e n e r a t o r ,
F I R = v f o a m v s o i l × 100 .
The equivalent relationships with dependence from pressure are given in Mori et al. [8] and Wu et al. [20]. The present work has been performed at atmospheric pressure.
For the characterization of the soil conditioning, a key aspect is the stability of the conditioned soil and, as its important constituent element, the stability of the foam itself.
Although the interaction with solid particles strongly influences the stability of a foam [21,22,23], the three main degradation phenomena are present both when the foam is mixed with the soil and when the foam is present alone.
In particular, the three degradation phenomena are the following ones.
The first degradation phenomenon is the drainage of the liquid phase. Being that the liquid phase is the continuous one, a flow of liquid is present that travels from the thin films to the Plateau’s borders due to pressure gradients and through the network of Plateau’s borders due to the gravitational pull.
Particularly, the pressure gradients are present because of the variation of curvature radius in the surface of the bubbles with a low liquid fraction. In fact, as the liquid fraction (i.e., Vliquid/Vfoam = ϕ = 1/FER [24]) decreases, the foam goes from a “keugelshaum” to a “polyedershaum”, (respectively, a foam made of spheres and a foam made of polyhedra [25]) as shown in Figure 3.
As given in Schramm [27], if we consider the Young—Laplace equation given below
P = 2 γ R
where ΔP is the difference between the pressure internal and external to a single bubble, γ is the surface tension and R is the radius of the bubble. Since the pressure PG of the gas is constant and the radius RB in the Plateau’s border is greater than the radius RA in the thin film, as shown in Figure 4, it follows that the pressure PB in the Plateau’s border is lower than the pressure PA in the thin film.
As the liquid flows into the Plateau’s border the influence of the gravitational pull becomes dominant over the one of pressure gradients.
The second degradation phenomenon is coarsening. Again, as effect of the Young–Laplace equation, it is simple to determine that for two bubbles with radii R1 and R2, if R1 > R2 the relationship between their internal pressures is P1 < P2. Thus, driven by this pressure gradient, the gas diffuses from small bubbles to larger ones [28].
The third degradation phenomenon is coalescence. As effect of the increasing diameter of the bubbles, due to the gas diffusion, and of the reduction of thickness of the thin films, due to liquid drainage, adjacent bubbles tend to join as effect of the rupture of the interposed lamella’s rupture [29].
Because of the interaction of these phenomena it is clear that, as described by Moll et al. [30], the stability of a foam depends also on the energy density, i.e., dependent on the energy input for unit of volume of foam. The stability of foam increases with the energy density, due to the formation of a foam with bubble diameters with a smaller mean and narrower distribution with lower pressure gradients and higher tortuosity of drainage paths.

1.3. Half-Life Test

Overall, especially in the tunnelling industry, the stability of foam is measured through the half-life time. This test, applied to tunnelling, is given by EFNARC [31] and consists in measuring the time (t50) needed for a sample of 80 g of foam to drain half of its weight (40 g).
Several authors have previously focused on this kind of test to assess the stability of foams [32,33,34,35].
Some relationships between surfactant concentration, viscosity of the liquid generator and foam stability have been found. Sebastiani et al. [33] states that the half-life of foam increases with the surfactant concentration. This evaluation was performed averaging five tests on a foam with FER 12 considering a range between 0.75% and 2.5%. Moll et al. [30] states that the viscosity of the liquid generator has a strong influence on the stability of the foam but no reference, in positive or in negative, has been made on the possibility that the concentration of the surfactant may influence the viscosity of the liquid generator. Zhang et al. [36] show that adding starch to the liquid generator increases both the viscosity of the liquid generator and the stability of the foam.
A limitation of this test is due to the scarce amount of data collected from each single test and from the absence of a two-way relationship of the results. For example, as shown in Figure 5, the test is unable to detect the difference from different kinds of foam that, despite having a degradation path different from each other, incidentally, drain 40 g of liquid generation in the same amount of time for both samples.
The new proposed approach represents an improvement of the current state of the art because it studies the foam stability by considering and describing the whole degradation process.

2. Materials and Methods

To study the evolution of the degradation of foam in time a dedicated apparatus has been constructed.
In detail, this apparatus is composed of 3 funnels positioned above 3 recipients. Each funnel is equipped with a porous stone that prevents the foam to fall in the recipient. All the funnels and the recipients are connected to load cells with maximum load capacity of 1000 g. All the 6 load cells are linked to an Arduino mega 2560 processor equipped with an LCD screen and a micro SD data logger. A scheme of the apparatus is given in Figure 6.
The apparatus allows operators to perform 3 half-life tests at a time and to sample the drained weight with a frequency of 10 Hz and precision of 0.01 g. After the production of foam, it is collected in a recipient of known volume and, by measuring the net weight, the FER is calculated. Then, 80 g of foam is poured directly in each funnel. The acquisition of data starts at the moment foam has been placed in the funnel and stops when 65 g of liquid has drained through the porous stone. This threshold corresponds to 80% of the total mass and has been arbitrarily set taking in consideration both the extremely long time needed to investigate the drainage of the last 20% of mass and that the extreme dryness of the remaining foam is completely incompatible with the concept of soil conditioning, hence of scarce interest in this study.
For the production of foam, a liquid generator has been used a liquid generator made of a solution of a surfactant agent commonly used in tunnelling.
To study the influence of variation on the flow rate and on the surfactant concentration two different sets of tests were performed. For the first set, the production of foam was performed with water at a temperature of 17.0 ± 2.0 °C, at flow rates of 2.8 L/min and 8.5 L/min. The surfactant concentration cf was set at 2.0%. For the second set, the production of foam was performed with water at a temperature of 17.0 ± 2.0 °C, at a fixed flow rate of 2.8 L/min. The surfactant concentration cf varied between 0.25% and 5.0%. In both sets the FER was set to vary between 5 and 30. The temperature was set at 17.0 ± 2.0 °C since this was the regime temperature of aqueduct water. The flow rates were chosen in such way as to produce a wide range of FER.
For the specific chosen surfactant agent, the viscosities of a range of its aqueous solutions were measured and subsequently found almost constant and independent from the deformation rate in the considered range. Particularly, a quadratic relationship was identified between the concentration of the surfactant and the viscosity of the liquid generator as shown in Figure 7.

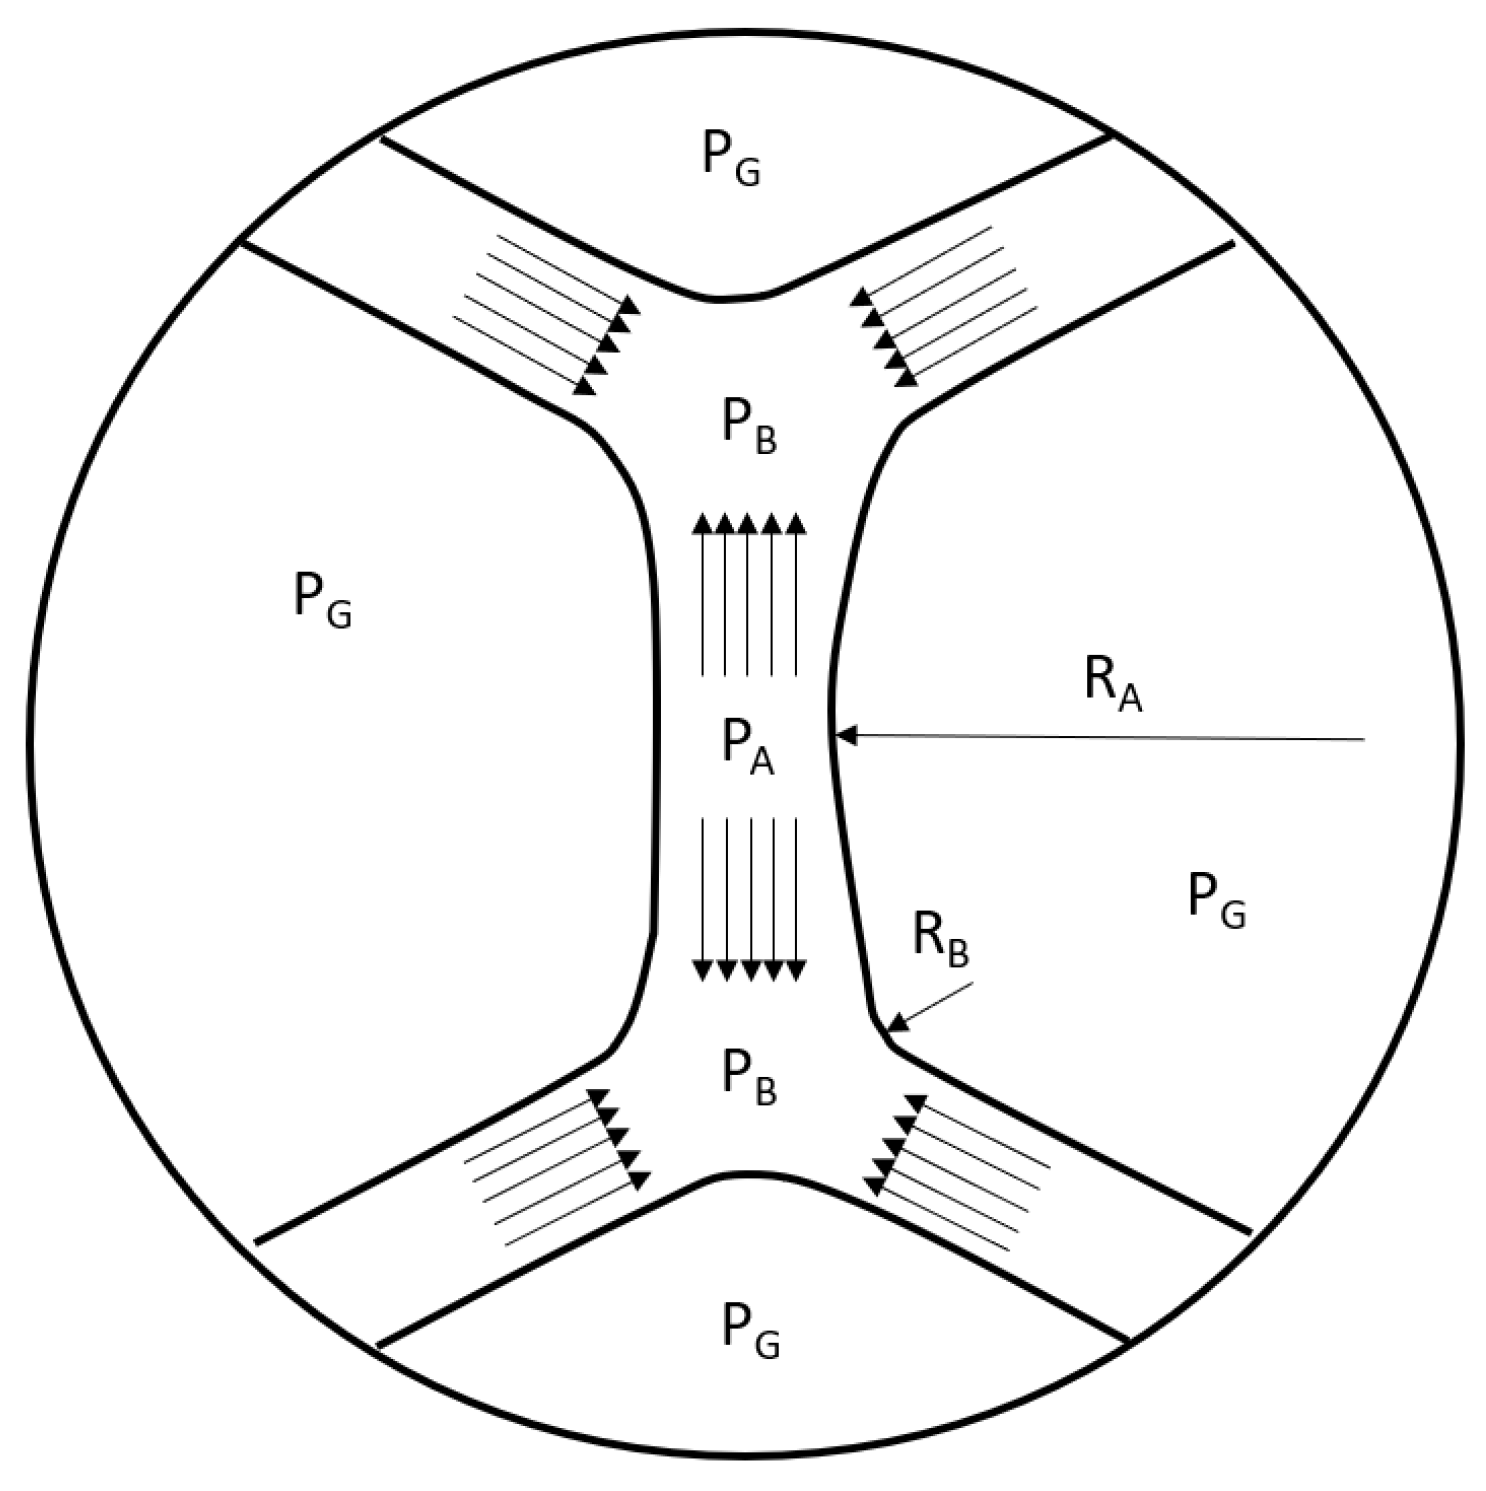
3. Mathematical Formulation

From the obtained results, it is possible to see that the foam decay curve in time develops following the shape shown in Figure 5. Thus, it was chosen to model it with an asymmetric sigmoid, a function with five parameters and the following formulation.
w d = d + a d 1 + t b c m
where wd is the weight of drained liquid, expressed in grams, and t is the time from the start of the test, expressed in seconds.
For the 274 tests performed the 5 parameters were determined through an optimization of least squared error.
To evaluate the goodness of the fit for multi-coefficient regression formulation, the adjusted determination coefficient R2adj was used.
The R2adj was found to range between 0.99999 and 0.9999 for 81% of the tests, between 0.9999 and 0.999 for 17% of the tests and higher than 0.99 for the remaining 2%. Hence the formulation is suitable to accurately describe the test.

4. Influence of Concentration

The obtained results, given in Figure 8, show no influence of surfactant concentration on the stability of foam. In fact, in terms of stability, there is no clear difference between the tests performed with different liquid generator concentrations (ranging from 0.25% to 5%).
This result may seem in contrast with the results of Sebastiani et al. [33] but no information about the viscosity of the used liquid generator has been provided.
For all tests the parameter “a” was found ranging between 0 g and 1.3 g.
To be thorough, in Figure 9 the result of the value of half-life as defined by EFNARC [31] is given and no strong correlation with the surfactant concentration has been found.

Influence of the Flow Rate

Half-life tests were performed for several FER, using both foams produced with both high and low liquid generator flow rates, respectively, 8.5 L/min and 2.8 L/min. The results are given in Figure 10.
It is possible to observe that a marked difference of the stability of the foam is present for low FER and this difference gradually decreases for higher FERs. For FER higher than 25 the two set of tests gave the same output. This result shows that, although the foam generator and the liquid generator are identical, the way in which the foam is produced has an influence on the properties of the foam.
This increase in stability may be linked to a greater energy dissipation in the mixing column of the generator, that leads to a higher energy density in the foam. This last statement, that a higher energy density leads to a greater stability of the foam, is in accordance with Moll et al. [30].

5. Conclusions

A set of more than 270 half-life tests has been performed sampling the evolution of drained liquid until 80% of the weight of the foam drained. The cumulative weight vs. time is very well described by an asymmetrical sigmoid, a well-defined five-parameter mathematical formulation, finding values of the adjusted determination factor (R2adj) always higher than 0.99.
The evaluation of the five parameters instead of the half-life time seems to be promising and able to avoid problems connected to the traditional half-life test such as obtaining the same output for two different observed phenomena.
The results reveal that the influence of concentration may not be as important as previously thought, if not through an eventual increase of viscosity of the liquid generator, and that there may be room to reduce the amount of used surfactant with clear environmental and economic benefits for the jobsites. Nonetheless, this hypothesis has to be further verified with tests performed on foam-soil mixtures.
Furthermore, a strong influence of the flow rate and the dissipated energy involved during the foam generation was observed.

Author Contributions

Conceptualization, A.C.; data curation, A.C.; formal analysis, A.C.; investigation, A.C. and C.T.; funding acquisition, D.P.; supervision, C.T.; writing—original draft, A.C.; writing—review and editing, A.C., C.T., D.M. and D.P. All authors have read and agreed to the published version of the manuscript.

Funding

This research received no external funding.

Conflicts of Interest

The authors declare no conflict of interest.

References

  1. Peila, D.; Oggeri, C.; Borio, L. Using the slump test to assess the behaviour of conditioned soil for EPB tunneling. Environ. Eng. Geosci. 2009, 15, 167–174. [Google Scholar] [CrossRef]
  2. Thewes, M.; Budach, C. Soil conditioning with foam during EPB tunnelling. Geomech. Tunn. 2010, 3, 256–267. [Google Scholar] [CrossRef]
  3. Liu, X.; Shen, S.; Zhou, A.; Xu, Y. Evaluation of foam conditioning effect on groundwater inflow at tunnel cutting face. Int. J. Numer. Anal. Methods Geomech. 2018, 43, 463–481. [Google Scholar] [CrossRef]
  4. Carigi, A.; Todaro, C.; Martinelli, D.; Amoroso, C.; Peila, D. Evaluation of the geo-mechanical properties property recovery in time ofconditioned soil for EPB-TBM tunnelling. Geosciences 2020, 10, 438. [Google Scholar] [CrossRef]
  5. Martinelli, D.; Winderholler, R.; Peila, D. Undreained behaviour of granular soils conditioned for EPB tunnelling—A new experimental procedure tunnelling. Geomechanick und Tunnelbau 2017, 10, 81–89. [Google Scholar] [CrossRef]
  6. Mori, L.; Mooney, M.A.; Cha, M. Characterizing the influence of stress on foam conditioned sand for EPB tunneling. Tunn. Undergr. Space Technol. 2018, 71, 454–465. [Google Scholar] [CrossRef]
  7. Todaro, C. Analysis on the penetration of foams in the excavation with EPB. GEAM—Geoing. Ambient. E Min. 2016, 147, 49–52. [Google Scholar]
  8. Mori, L.; Alavi, E.; Mooney, M.A. Apparent density evaluation methods to assess the effectiveness of soil conditioning. Tunn. Undergr. Space Technol. 2017, 67, 175–186. [Google Scholar] [CrossRef]
  9. Peña, M. Soil conditioning for sands. Tunn. Tunn. Int. 2003, 35, 40–42. [Google Scholar]
  10. Borio, L.; Peila, D. Study of the permeability of foam conditioned soils with laboratory tests. Am. J. Environ. Sci. 2010, 6, 365. [Google Scholar] [CrossRef] [Green Version]
  11. Oñate Salazar, C.G.; Martinelli, D.; Todaro, C.; Luciani, A.; Boscaro, A.; Peila, D. Preliminary study of wear induced by granular soil on metallic parts of EPB tunnelling machines. GEAM—Geoing. Ambient. E Min. 2016, 53, 67–70. [Google Scholar]
  12. Hollmann, F.S.; Thewes, M. Assessment method for clay clogging and disintegration of fines in mechanised tunnelling. Tunn. Undergr. Space Technol. 2013, 37, 96–106. [Google Scholar] [CrossRef]
  13. Carigi, A.; Luciani, A.; Todaro, C.; Martinelli, D.; Peila, D. Influence of conditioning on the behaviour of alluvial soils with cobbles. Tunn. Undergr. Space Technol. 2020, 96, 103225. [Google Scholar] [CrossRef]
  14. Todaro, C.; Carigi, A.; Peila, L.; Martinelli, D.; Peila, D. Soil conditioning tests of clay for EPB tunnelling. Undergr. Space 2021. [Google Scholar] [CrossRef]
  15. Barra Caracciolo, A.; Cardoni, M.; Pescatore, T.; Patrolecco, L. Characteristics and environmental fate of the anionic surfactant sodium lauryl ether sulphate SLES used as the main component in foaming agents for mechanized tunnelling. Environ. Pollut. 2017, 226, 94–103. [Google Scholar] [CrossRef] [PubMed]
  16. Firouzei, Y.; Grenni, P.; Barra Caracciolo, A.; Patrolecco, L.; Todaro, C.; Martinelli, D.; Carigi, A.; Hajipour, G.; Hassanpour, J.; Peila, D. The most common laboratory procedures for the evaluation of EPB TBMs excavated material ecotoxicity in Italy: A review. GEAM—Geoing. Ambient. E Min. 2020, 160, 44–56. [Google Scholar]
  17. Vinai, R.; Peila, D.; Oggeri, C.; Pelizza, S. Laboratory tests for EPB tunnelling soil conditioning. In Proceedings of the 33rd ITA-AITES World Tunnel Congress–Underground Space—The 4th Dimension of Metropolises, Prague, Czech Republic, 5–10 May 2007; Taylor & Francis Group: London, UK, 2007; pp. 273–278. [Google Scholar]
  18. Peila, D.; Martinelli, D.; Todaro, C.; Luciani, A. Soil conditioning in EPB shield tunnelling—An overview of laboratory tests. Geomech. Tunn. 2019, 12, 491–498. [Google Scholar] [CrossRef]
  19. Thewes, M.; Budach, C.; Bezuijen, A. Foam conditioning in EPB tunnelling. In Geotechnical Aspects of Underground Construction in Soft Ground; Taylor & Francis Group: London, UK, 2012; Volume 127, ISBN 978-0-415-68367-8. [Google Scholar]
  20. Wu, Y.; Mooney, M.A.; Cha, M. An experimental examination of foam stability under pressure for EPB TBM tunneling. Tunn. Undergr. Space Technol. 2018, 77, 80–93. [Google Scholar] [CrossRef]
  21. Al Yousef, Z.A.; Almobarky, M.A.; Schechter, D.S. The effect of nanoparticle aggregation on surfactant foam stability. J. Colloid Interface Sci. 2018, 511, 365–373. [Google Scholar] [CrossRef]
  22. Fameau, A.L.; Salonen, A. Effect of particles and aggregated structures on the foam stability and aging. Comptes Rendus Phys. 2014, 15, 748–760. [Google Scholar] [CrossRef]
  23. Horozov, T.S. Foams and foam films stabilised by solid particles. Curr. Opin. Colloid Interface Sci. 2008, 13, 134–140. [Google Scholar] [CrossRef]
  24. Bikerman, J.J. Foams; Springer Science & Business Media: New York, NY, USA, 2013; Volume 10. [Google Scholar]
  25. Butt, H.J.; Graf, K.; Kappl, M. Physics and Chemistry of Interfaces; John Wiley & Sons: New York, NY, USA, 2013. [Google Scholar]
  26. Langevin, D. Aqueous foams and foam films stabilised by surfactants. Gravity-free studies. Comptes Rendus Mech. 2016, 345, 47–55. [Google Scholar] [CrossRef] [Green Version]
  27. Schramm, L.L. Foams: Fundamentals and Applications in the Petroleum Industry; American Chemical Society: Washington, DC, USA, 1994. [Google Scholar]
  28. Stevenson, P. Inter-bubble gas diffusion in liquid foam. Curr. Opin. Colloid Interface Sci. 2010, 15, 374–381. [Google Scholar] [CrossRef]
  29. Bhakta, A.; Ruckenstein, E. Drainage and Coalescence in Standing Foams. J. Colloid Ad Interface Sci. 1997, 191, 184–201. [Google Scholar] [CrossRef] [PubMed]
  30. Moll, P.; Grossmann, L.; Kutzli, I.; Weiss, J. Influence of energy density and viscosity on foam stability—A study with pea protein Pisum sativum L. J. Dispers. Sci. Technol. 2019, 41, 1789–1796. [Google Scholar] [CrossRef]
  31. EFNARC. Specification and Guidelines for the Use of Specialist Products for Mechanized Tunnelling (TBM) in Soft Ground and Hard Rock Recommendation; EFNARC: Farnham, UK, 2005. [Google Scholar]
  32. Galli, M.; Thewes, M. Rheological characterisation of foam-conditioned sands in EPB tunneling. Int. J. Civil Eng. 2019, 17, 145–160. [Google Scholar] [CrossRef]
  33. Sebastiani, D.; Vilardi, D.; Bavasso, I.; Di Palma, L.; Miliziano, S. Classification of foam and foaming products for EPB mechanized tunnelling based on half-life time. Tunn. Undergr. Space Technol. 2019, 92, 103044. [Google Scholar] [CrossRef]
  34. Zhao, S.; Li, S.; Wan, Z.; Wang, X.; Wang, M.; Yuan, C. Effects of anti-clay agents on bubble size distribution and stability of acquous foam under pressure for earth pressure balance shield tunnelling. Colloid Interface Sci. Commun. 2021, 42, 100424. [Google Scholar] [CrossRef]
  35. Zhou, X.; Yang, Y. Effect of foam parameters on cohesionless soil permeability and its application to prevent the water speweing. Appl. Sci. 2020, 10, 1787. [Google Scholar] [CrossRef] [Green Version]
  36. Zhang, Y.; Chang, Z.; Luo, W.; Gu, S.; Li, W.; An, J. Effect of starch particles on foam stability and dilational viscoelasticity of aqueous-foam. Chin. J. Chem. Eng. 2015, 23, 276–280. [Google Scholar] [CrossRef]
Figure 1. Behaviour of the same material. (a) Before the conditioning is added; (b) After the conditioning is added.
Geosciences 12 00191 g001
Figure 2. Foam generation scheme.
Geosciences 12 00191 g002
Figure 3. Scheme of foam aspects for different liquid volume fractions ϕ. Φ = 36% corresponds to a FER = 2.7—from Langevin [26].
Geosciences 12 00191 g003
Figure 4. Pressure differences across curved surfaces in a foam lamella (modified from Schramm, [27]).
Geosciences 12 00191 g004
Figure 5. Two different foam decay processes (one described by the blue line and the other by the orange one) that exhibit the same half-life time.
Geosciences 12 00191 g005
Figure 6. Scheme of the apparatus used for the test.
Geosciences 12 00191 g006
Figure 7. Characterization of the viscosity of the liquid generator. (a) For all the concentrations tested the viscosity has no dependence on the deformation rate (i.e., Newtonian liquid); (b) the viscosity bears a quadratic relationship to the surfactant concentration.
Geosciences 12 00191 g007
Figure 8. Asymmetric sigmoid parameters vs. FER for different liquid generator concentrations (ad).
Geosciences 12 00191 g008
Figure 9. Half-life time vs. FER for different liquid generator concentrations.
Geosciences 12 00191 g009
Figure 10. Drained weight vs. time for different FER and for high flow rate generation (solid lines) and low flow rate generation (dashed lines).
Geosciences 12 00191 g010
Publisher’s Note: MDPI stays neutral with regard to jurisdictional claims in published maps and institutional affiliations.

