Article

Experimental Analysis of the Fire-Induced Effects on the Physical, Mechanical, and Hydraulic Properties of Sloping Pyroclastic Soils

Department of Civil Engineering, University of Salerno, 84084 Fisciano, Italy
*
Author to whom correspondence should be addressed.
Submission received: 19 February 2022 / Revised: 17 April 2022 / Accepted: 3 May 2022 / Published: 6 May 2022
(This article belongs to the Special Issue Climate Change and Geotechnical Engineering)

Abstract

:
The paper investigates the changes in the physical, mechanical, and hydraulic properties of coarse-grained pyroclastic soils, considered under both wildfire-burned and laboratory heating conditions. The soil samples were collected on Mount “Le Porche” in the municipality of Siano (Campania Region, Southern Italy), hit by wildfires on 20 September 2019. The area is prone to fast-moving landslides, as testified by the disastrous events of 5–6 May 1998. The experimental results show that the analyzed surficial samples exhibited (i) grain size distribution variations due to the disaggregation of gravelly and sandy particles (mostly of pumice nature), (ii) chromatic changes ranging from black to reddish, (iii) changes in specific gravity in low-severity fire-burned soil samples different from those exposed to laboratory heating treatments; (iv) progressive reductions of shear strength, associated with a decrease in the cohesive contribution offered by the soil-root systems and, for more severe burns, even in the soil friction angle, and (v) changes in soil-water retention capacity. Although the analyses deserve further deepening, the appropriate knowledge on these issues could provide key inputs for geotechnical analyses dealing with landslide susceptibility on fire-affected slopes in unsaturated conditions.

1. Introduction

During the last decade, the Mediterranean area [1], western US states [2], the Amazon area [3], Australia [4], as well as many other countries have been systematically hit by fires. As a result, significant increases in post-fire soil proneness to erosion, slope instability, and desertification have been reported [5,6,7]. In particular, the scientific literature counts several examples of fast-moving landslides that occurred in burned areas [8,9]. As pointed out by Bordoloi and Ng [10] in a recent review on the effects of vegetation on engineered and natural slopes, despite the increase in wildfire events related to climate changes, still few case studies address the changes in the mechanical soil properties and their implications on post-fire debris flows and erosion. Nowadays, climate change plays a critical role in increasing the frequency and magnitude of wildfires in many countries around the world [11,12]. Several researchers have shown that the main impacts of climate change are associated with warmer environmental conditions and increases in droughts and heatwaves [13,14]. As a result, climate change increases the drying of organic matter and leads to the development and spread of wildfires by creating specific temperature and moisture conditions in the soil and vegetation [15].
The Campania region is known to be prone to wildfires, whose frequency and severity are exacerbated by the longer dry seasons associated with climate change. These are characterized by very low or no precipitation combined with extremely high temperatures that reduce soil moisture in the uppermost soil layers. In addition, the typical Mediterranean climatic seasonality of the Campania region has a negative impact on forest fires. Indeed, the latter typically occur towards the end of the dry season, when there is plenty of fuel and the environment is drier. This is an extremely dangerous situation that can easily get out of control. According to the European Forest Fire Information System (EFFIS) [16], the climate change scenario for the Mediterranean region predicts an increase in the size, frequency, and severity of forest fires.
Owing to the often-controversial scientific literature on the fire effects on soils and the high site-specificity of the hydromechanical soil response, laboratory and in situ tests are crucial in providing quantitative information on post-fire soil behavior. Accordingly, this paper aims to provide a novel contribution to investigating the physical and hydromechanical properties of coarse-grained soils affected by fires in the Campania region (southern Italy). In this area, many slopes covered by pyroclastic soils derived from the explosive activity of the Somma–Vesuvius volcanic complex are highly susceptible to fast-moving landslides [17] and are frequently affected by wildfires, especially at the end of the dry season (i.e., late September-early October). During this period, Esposito et al. [18] have shown that very intense rainfall can trigger flowslides or erosion along burned slopes. However, studies on fire-induced effects on the physical and hydromechanical properties of these soils are lacking; therefore, the present study aims to fill this gap. Significantly, this type of data could enrich the background for studies that, while addressing modeling/forecasting of the hazard of erosion processes and slope instabilities [19], can also account for post-wildfire slope conditions. The paper is structured as follows: Section 2 provides the background of the main existing methodologies to map and classify a fire along with fire-induced changes in soil properties; Section 3.1 describes the study area; Section 3.2 shows the sampling activity and the assessment of the Siano fire burn severity by means of both field surveys and remote sensing techniques; Section 3.3 explains the adopted procedures for the laboratory tests; Section 4 presents the experimental results; Section 5 and Section 6 refer to the discussion of the obtained results and the conclusions, respectively.

2. Background

Literature studies distinguish fire intensity from burn severity. Fire intensity is linked to the rate of energy released during a fire, whereas burn severity refers to the fire effects on the soil physical, chemical, and biological properties, reflecting the range of burning and degree of damage to the forest vegetation, which has an indirect impact on root decline after a fire and controls the vegetation recovery process [20]. Worldwide, burn severity is used to map and classify fire events. Burn severity can be assessed via both in situ surveys, by considering soil and vegetation changes under post-fire conditions, and remote sensing techniques, through appropriate multispectral indices that detect the changes of the ground spectral signature between pre-and post-fire conditions [21,22,23].
Depending on fire intensity, burn severity, and frequency, fires can significantly alter various physical properties of soil in surface horizons (e.g., soil color, grain size, and soil structure), primarily in response to organic matter (OM) loss [24,25,26]. After severe fires, changes in soil properties are more significant within the 0–5 cm layer and less in the 5–10 cm sampling depth [27] because soil temperature below the 5-cm topsoil layer rarely exceeds 100 °C [28]. The literature reports that low burn severity fires do not cause enough soil heating to alter significantly soil physical properties [29].
An important effect of fire is the increase in the percentage of bare soil due to the burning/removal of vegetation cover and OM in the upper soil layer [30]. As a result, color changes caused by exposure of mineral particles to high temperatures and the deposition of post-fire residues (e.g., ash, charcoal) are observed [24,25]. Color changes are highly site-specific and depend on soil type, vegetation, fire type (duration of exposure at a given temperature), and burn severity [25,31]. Soil color is strongly affected by the type and amount of OM [32] and Fe oxides [33]. In general, soil particles become darker with increasing heating temperature, reaching their darkest color at 250–350 °C. At higher temperatures, soils tend to become lighter (i.e., reddish and yellow). Several authors [34,35] have shown that the black color in burned soils is due to charred litter and black charcoal. Terefe et al. [26] found that under laboratory conditions, redness increases with temperature in iron-rich soils, especially in the 300 to 500 °C range, due to the transformation of iron oxides into hematite and maghemite. The color of soil and ash after a fire has been used as an indicator of burn severity [31,36]. For example, the color of ash can range from black (incomplete burn) to white (complete burn), depending on how weak or severe the fire is. Lightly burned areas (short exposure at 100 to 250 °C) are characterized by incompletely burned organic material and blackened soil. Moderate fires (prolonged exposure at 300 °C) are reported to burn plant material (leaving white ash) without altering the underlying soil, and very severe fires (prolonged exposure at >500 °C) leave white ash and redden soil. In addition, the color change may lead to a reduction in the albedo of the topsoil, increasing the evaporation rate [37].
Moderate to severe fires can permanently alter the grain size distribution of soil at the ground surface [38]. Previous studies in the literature have shown that grain size increases, decreases, or does not change depending on the soil type [24,39,40]. Clays have been reported to be the texture class most sensitive to changes caused by high temperatures, as structural hydroxyl ions are irreversibly removed and the crystalline structure is destroyed, beginning at temperatures of ~400 °C [41]. Clay mineral particle fusion can occur at 600–700 °C and complete clay destruction at 700–900 °C [42]. Clay particle fusion could lead to better aggregation of clay particles into stable sand-sized particles, increasing the sand, but at the expense of clay content [41,43]. For example, Jhariya and Singh [44] reported that the sand, silt, and bulk density in the uppermost layer of 0–20 cm of sandy loam increased significantly in areas that had been affected by high burn severity fires. Zihms et al. [39] found that the particles retained on the 1.18-mm sieve increased slightly at 250 °C. The authors suggested that the clay coated the sand grains, allowing them to be retained on the 1.18-mm sieve. However, this coating was destroyed at higher temperatures (i.e., 500 °C). Terefe et al. [26] found a significant increase in the coarse sand content associated with a lower clay content after heating the soil. Therefore, the authors associated the increase in sand content with a decrease in clay content. Ulery and Graham [24] showed that soils with abundant kaolinized feldspars could have an overall decrease in particle size due to the decomposition of the kaolinized sand grains.
The soil OM is considered a strong aggregating agent that holds sand, silt, and clay particles together into aggregates. Subsequently, a loss of OM results in a loss of soil structure and a reduction in macropore space [29]. In severe fires, both the decrease in soil OM and the resulting ash incorporated in soil pores generally produce increased soil bulk density, decreased porosity, and decreased water storage capacity [40].
In the literature, a few studies have directly investigated changes in soil and root strength following a fire. Fires can weaken the soil-root systems due to high temperatures reached in the upper 5–10 cm, where heat transfer from burning fuels to the tissues of the roots, stem, or crown occurs [45]. Heat-related damage to roots occurs because of heat transfer through the soil and subsequent heat conduction into the root interior. It can manifest directly in root death, especially of fine roots, which can ultimately alter the mechanical and hydrological functions of the soil-root systems [46] and increase susceptibility to erosion and shallow landslides [47].
Fire effects on soil hydraulic properties include the potential formation of a hydrophobic surface layer [48], which, along with the removal of protective plant cover, increases surface runoff and erosion, especially during the first post-fire rainfall. Recently, Movasat and Tomac [49] have shown that the shear strength of hydrophobic soils affected by fire decreases as soil hydrophobicity increases. In addition, despite the importance of soil water retention (SWR) to soil water availability and plant growth [50], understanding of the direct effects of fire on SWR remains limited, and existing information is, in many cases, conflicting. SWR is an important determinant of the water movement in the soil. It is a measure of the amount of water that can be stored in the soil and, along with infiltration, determines the fate of precipitation. The conflicting results in the literature on the effects of fires on SWR capacity are mainly due to the fact that fires are known to alter soil properties that affect SWR capacity differently depending on the fire (e.g., burn severity) and the specific conditions at the study site (e.g., soil, climate, and vegetation) [51]. Indeed, SWR properties are primarily influenced by soil texture, structure, organic matter content, and bulk density [52]. These properties vary by fire and site and depend on the degree of heating and fire residues (e.g., ash, charcoal), which can play a critical role in flow and transport processes. The addition of ash increases SWR and nutrient content and decreases hydraulic conductivity [53]. In addition, ash is often considered to cause increased runoff and erosion rates following fires [54,55,56,57]. In particular, ash is thought to wash or infiltrate into the soil, clogging soil pores and thus limiting infiltration rates, which explains the increased SWR [54,58].

3. Materials and Methods
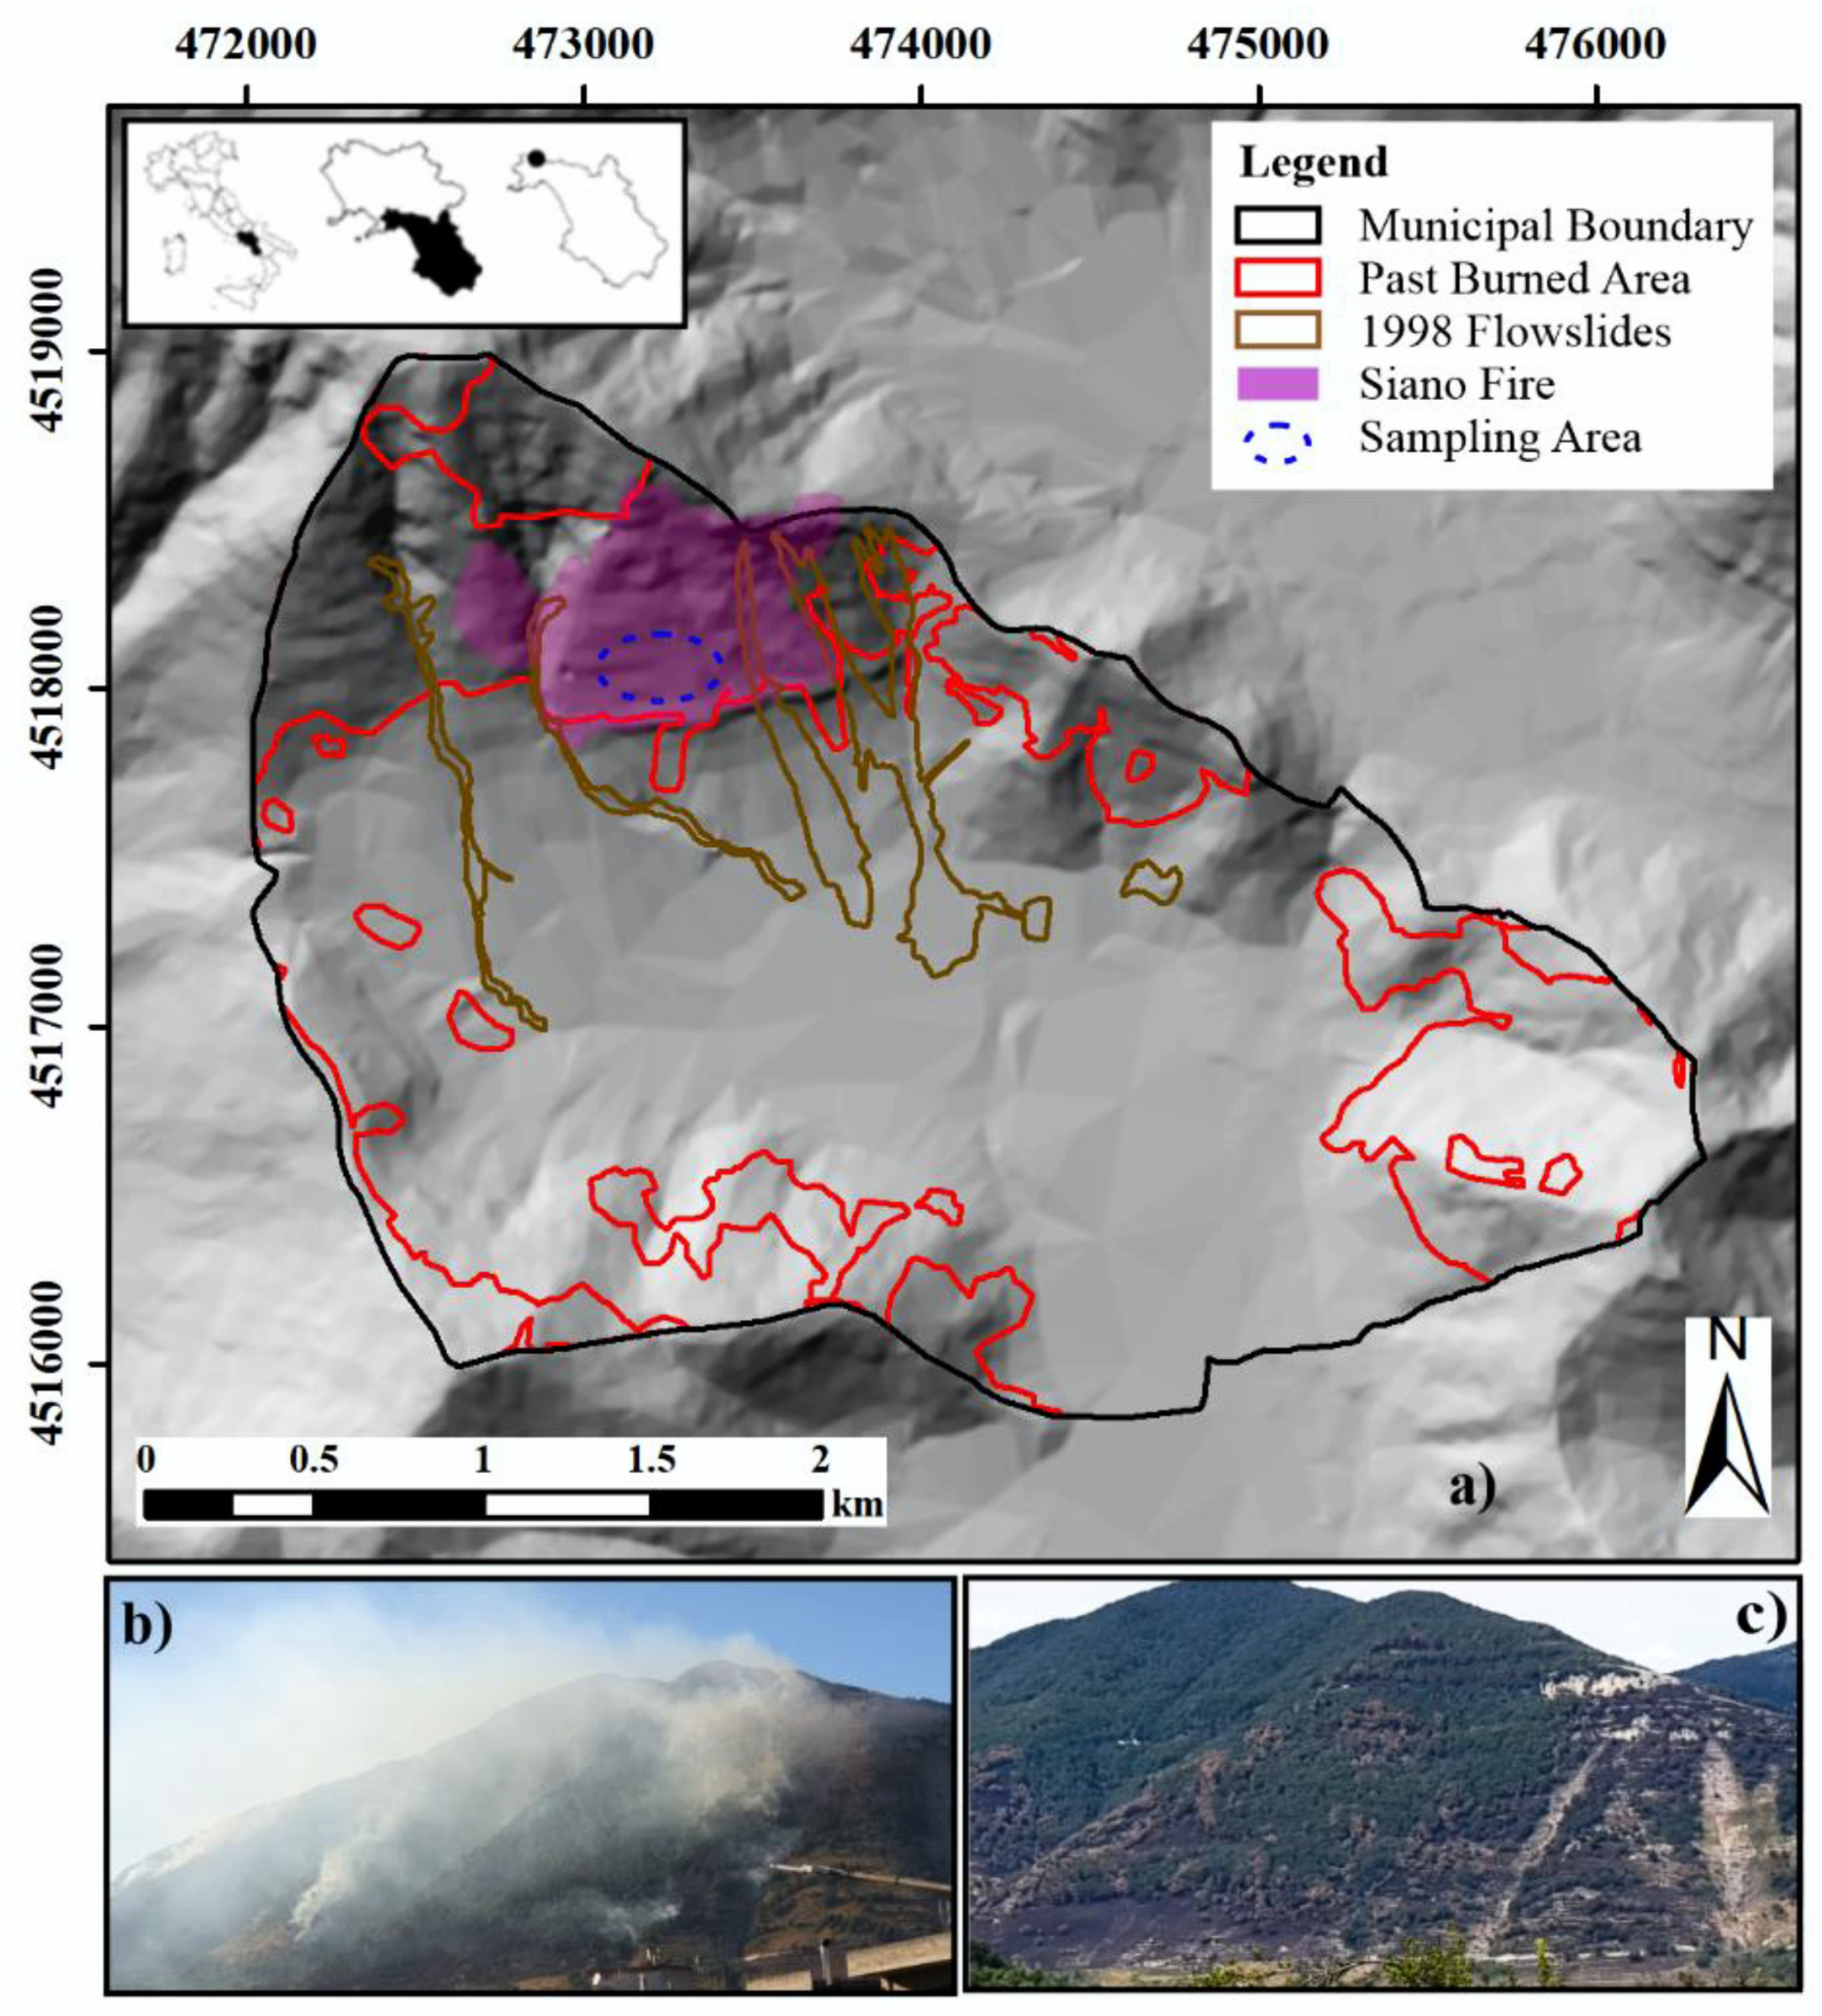
3.1. Study Area

Laboratory tests and field investigations were conducted on the pyroclastic soils covering “Le Porche” relief in the municipality of Siano (Salerno province, southern Italy), which were affected by wildfires on 20 September 2019 (Figure 1).
In the past, the slopes of the municipality of Siano have been affected by both wildfires and fast-moving landslides (Figure 1a). The slope burned in 2019 has an extent of about 54 hectares and is located on the southern slope of a carbonate massif of Mesozoic limestone and dolomite rocks [60] reported as the Sarno Mountain Range. This reaches a peak elevation of 1133 m above sea level and its morphology is characterized by steep slopes with an average gradient of about 35°, dropping to about 10° at the base of the slope. The vertical continuity of the slopes is locally interrupted by vertical carbonate scarps extending laterally up to several hundred meters. The scarps correspond to erosion profiles of thick carbonate layers with heights ranging from 1–2 m to 10–15 m. The lateral continuity is instead interrupted by several stream valleys that extend downslope from the crest of the ridge and have a length of up to 2 km and an average depth of about 30 m. Since the late Quaternary, the massif has been covered by pyroclastic deposits derived from several eruptions of the nearby Somma–Vesuvius volcanic complex [61]. These deposits consist of alternating layers of ash, pumice, and buried soil horizons classified as andosols [62], characterized by different hydraulic and mechanical properties and negligible cohesion [63]. Accordingly, the shear strength of the volcaniclastic cover is mainly controlled by matric suction [64] and by plant roots in the surficial zone [65]. The well-developed vegetation in the area, consisting of oak, chestnut, and pine forests mixed with Mediterranean shrubs, provides strong protection against surface erosion [18]. On the other hand, this does not stabilize the entire volcanic cover, as shown by previous landslides that affected completely vegetated zones. The widespread development of vegetation in this area is favored by a Mediterranean climate with hot, dry summers and moderately cool, rainy winters, with an average annual precipitation in the range of 1000–1200 mm.

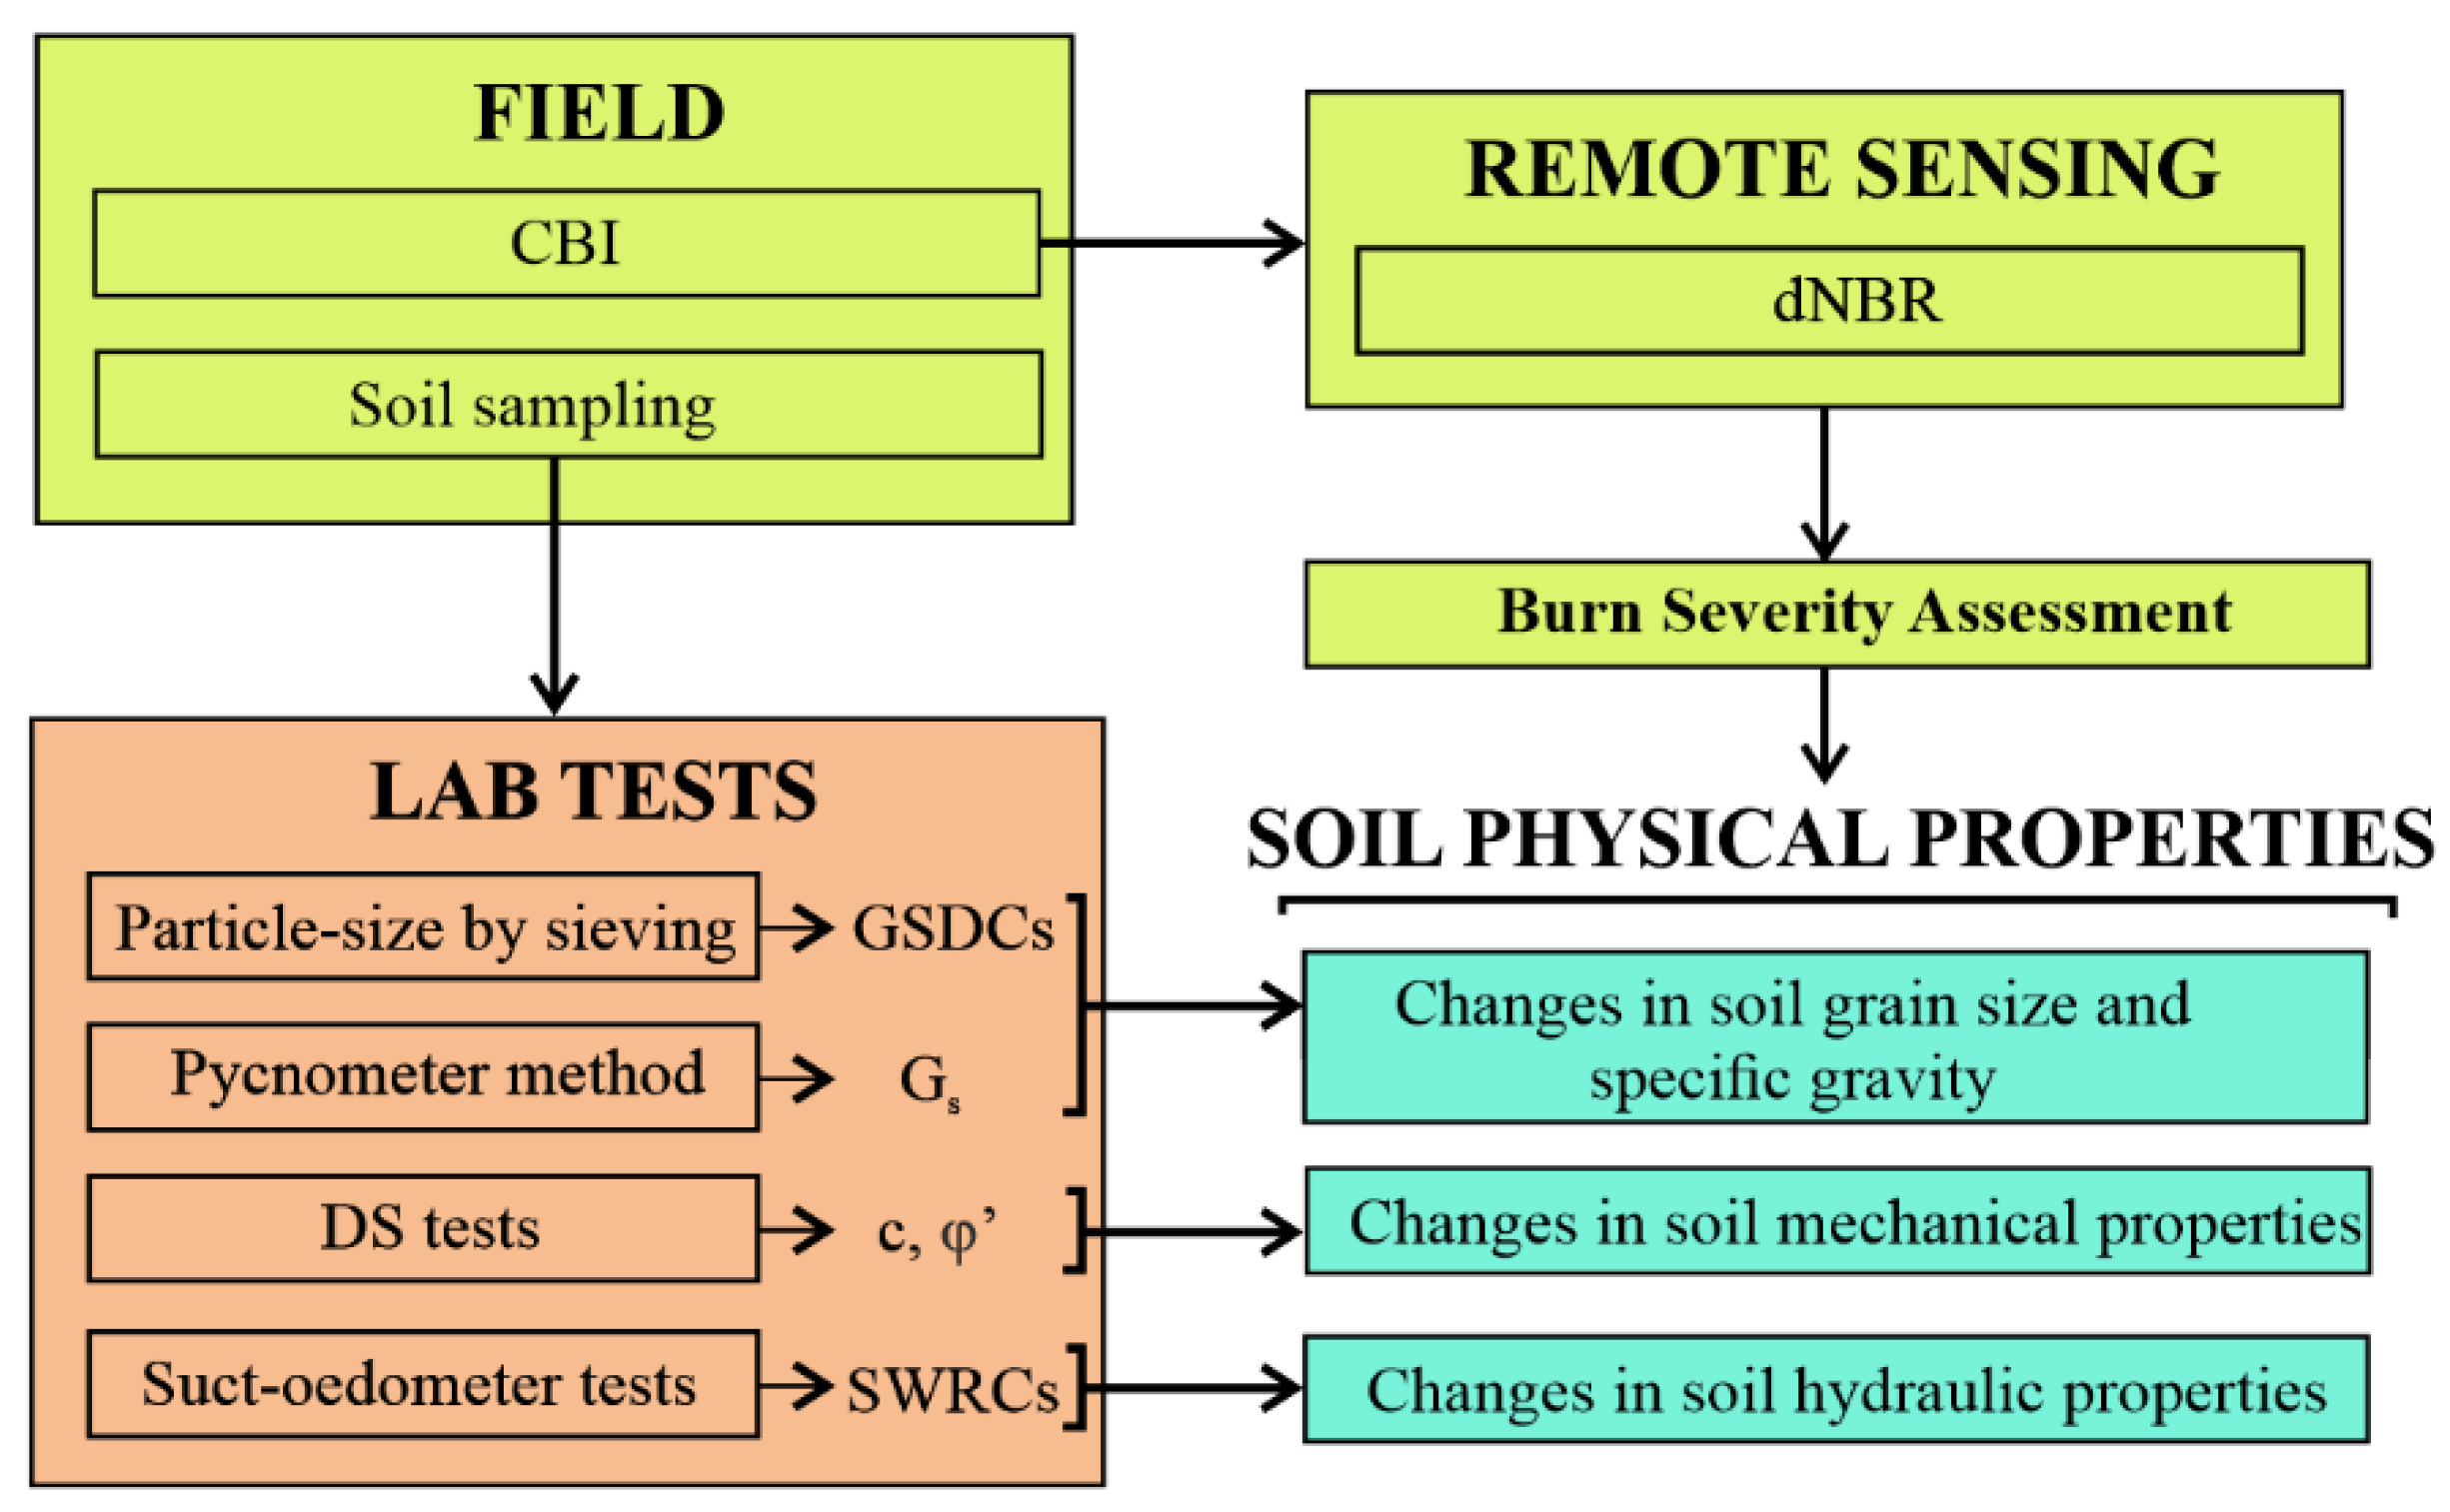
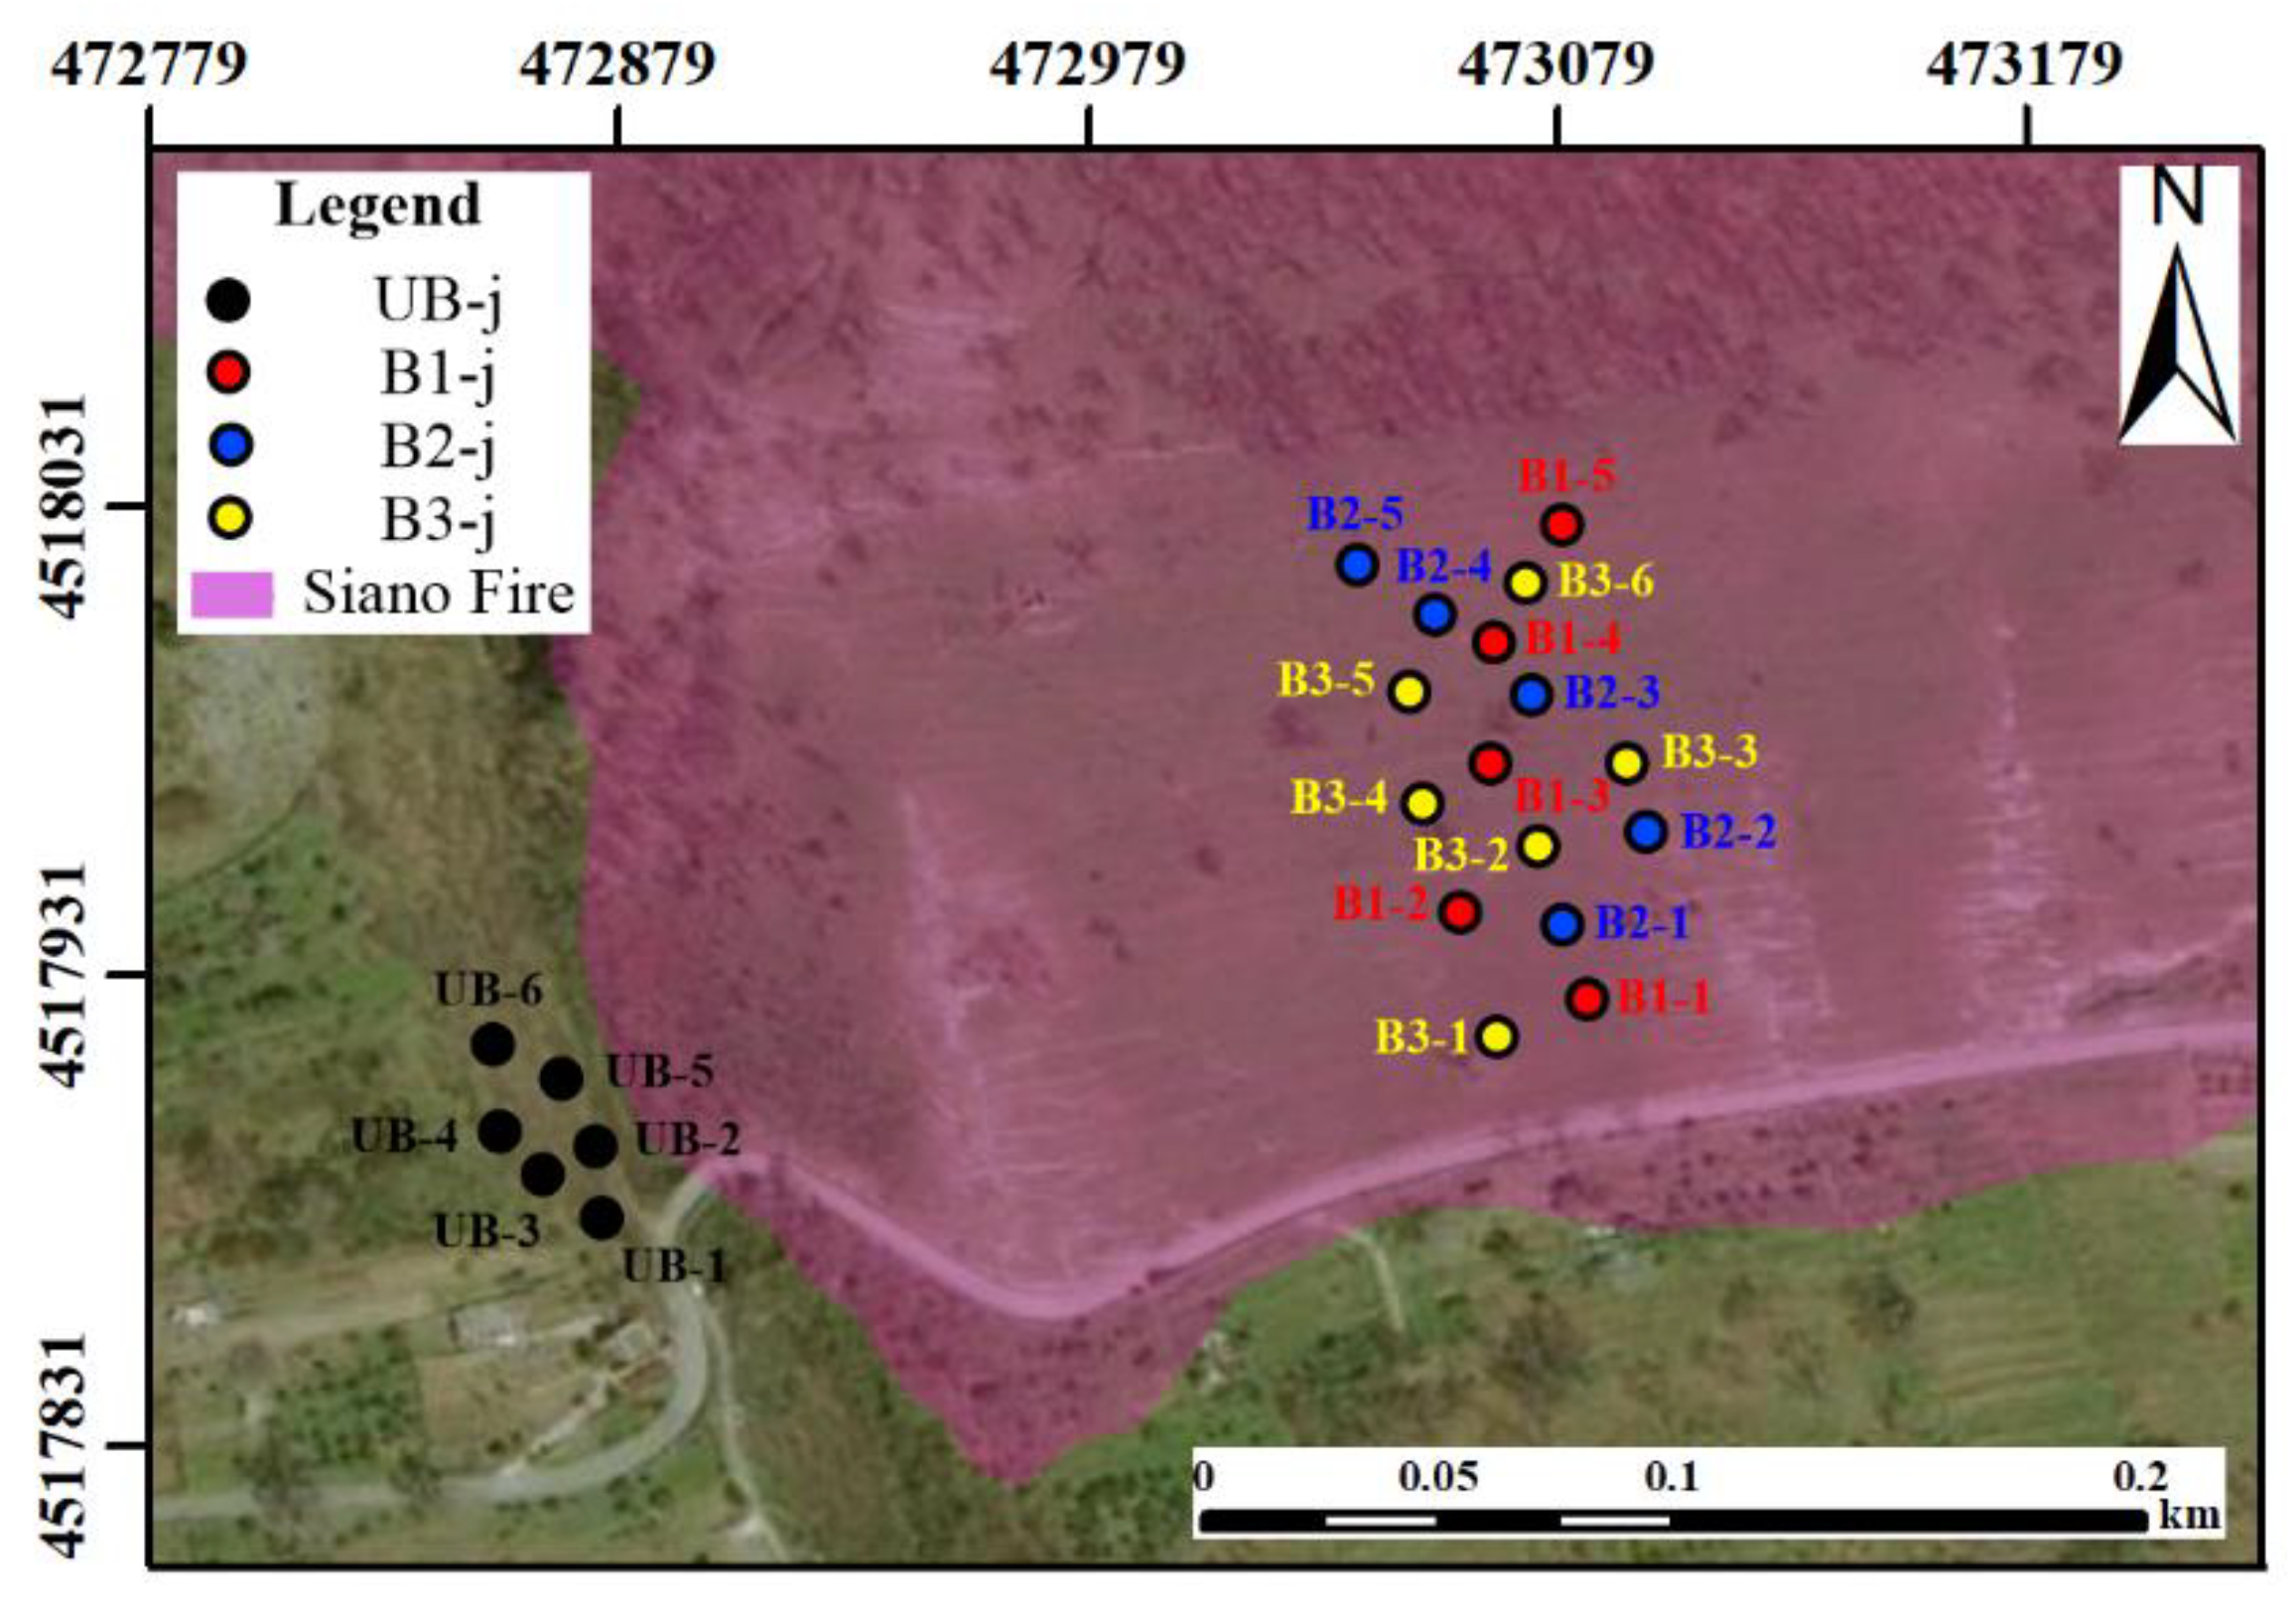
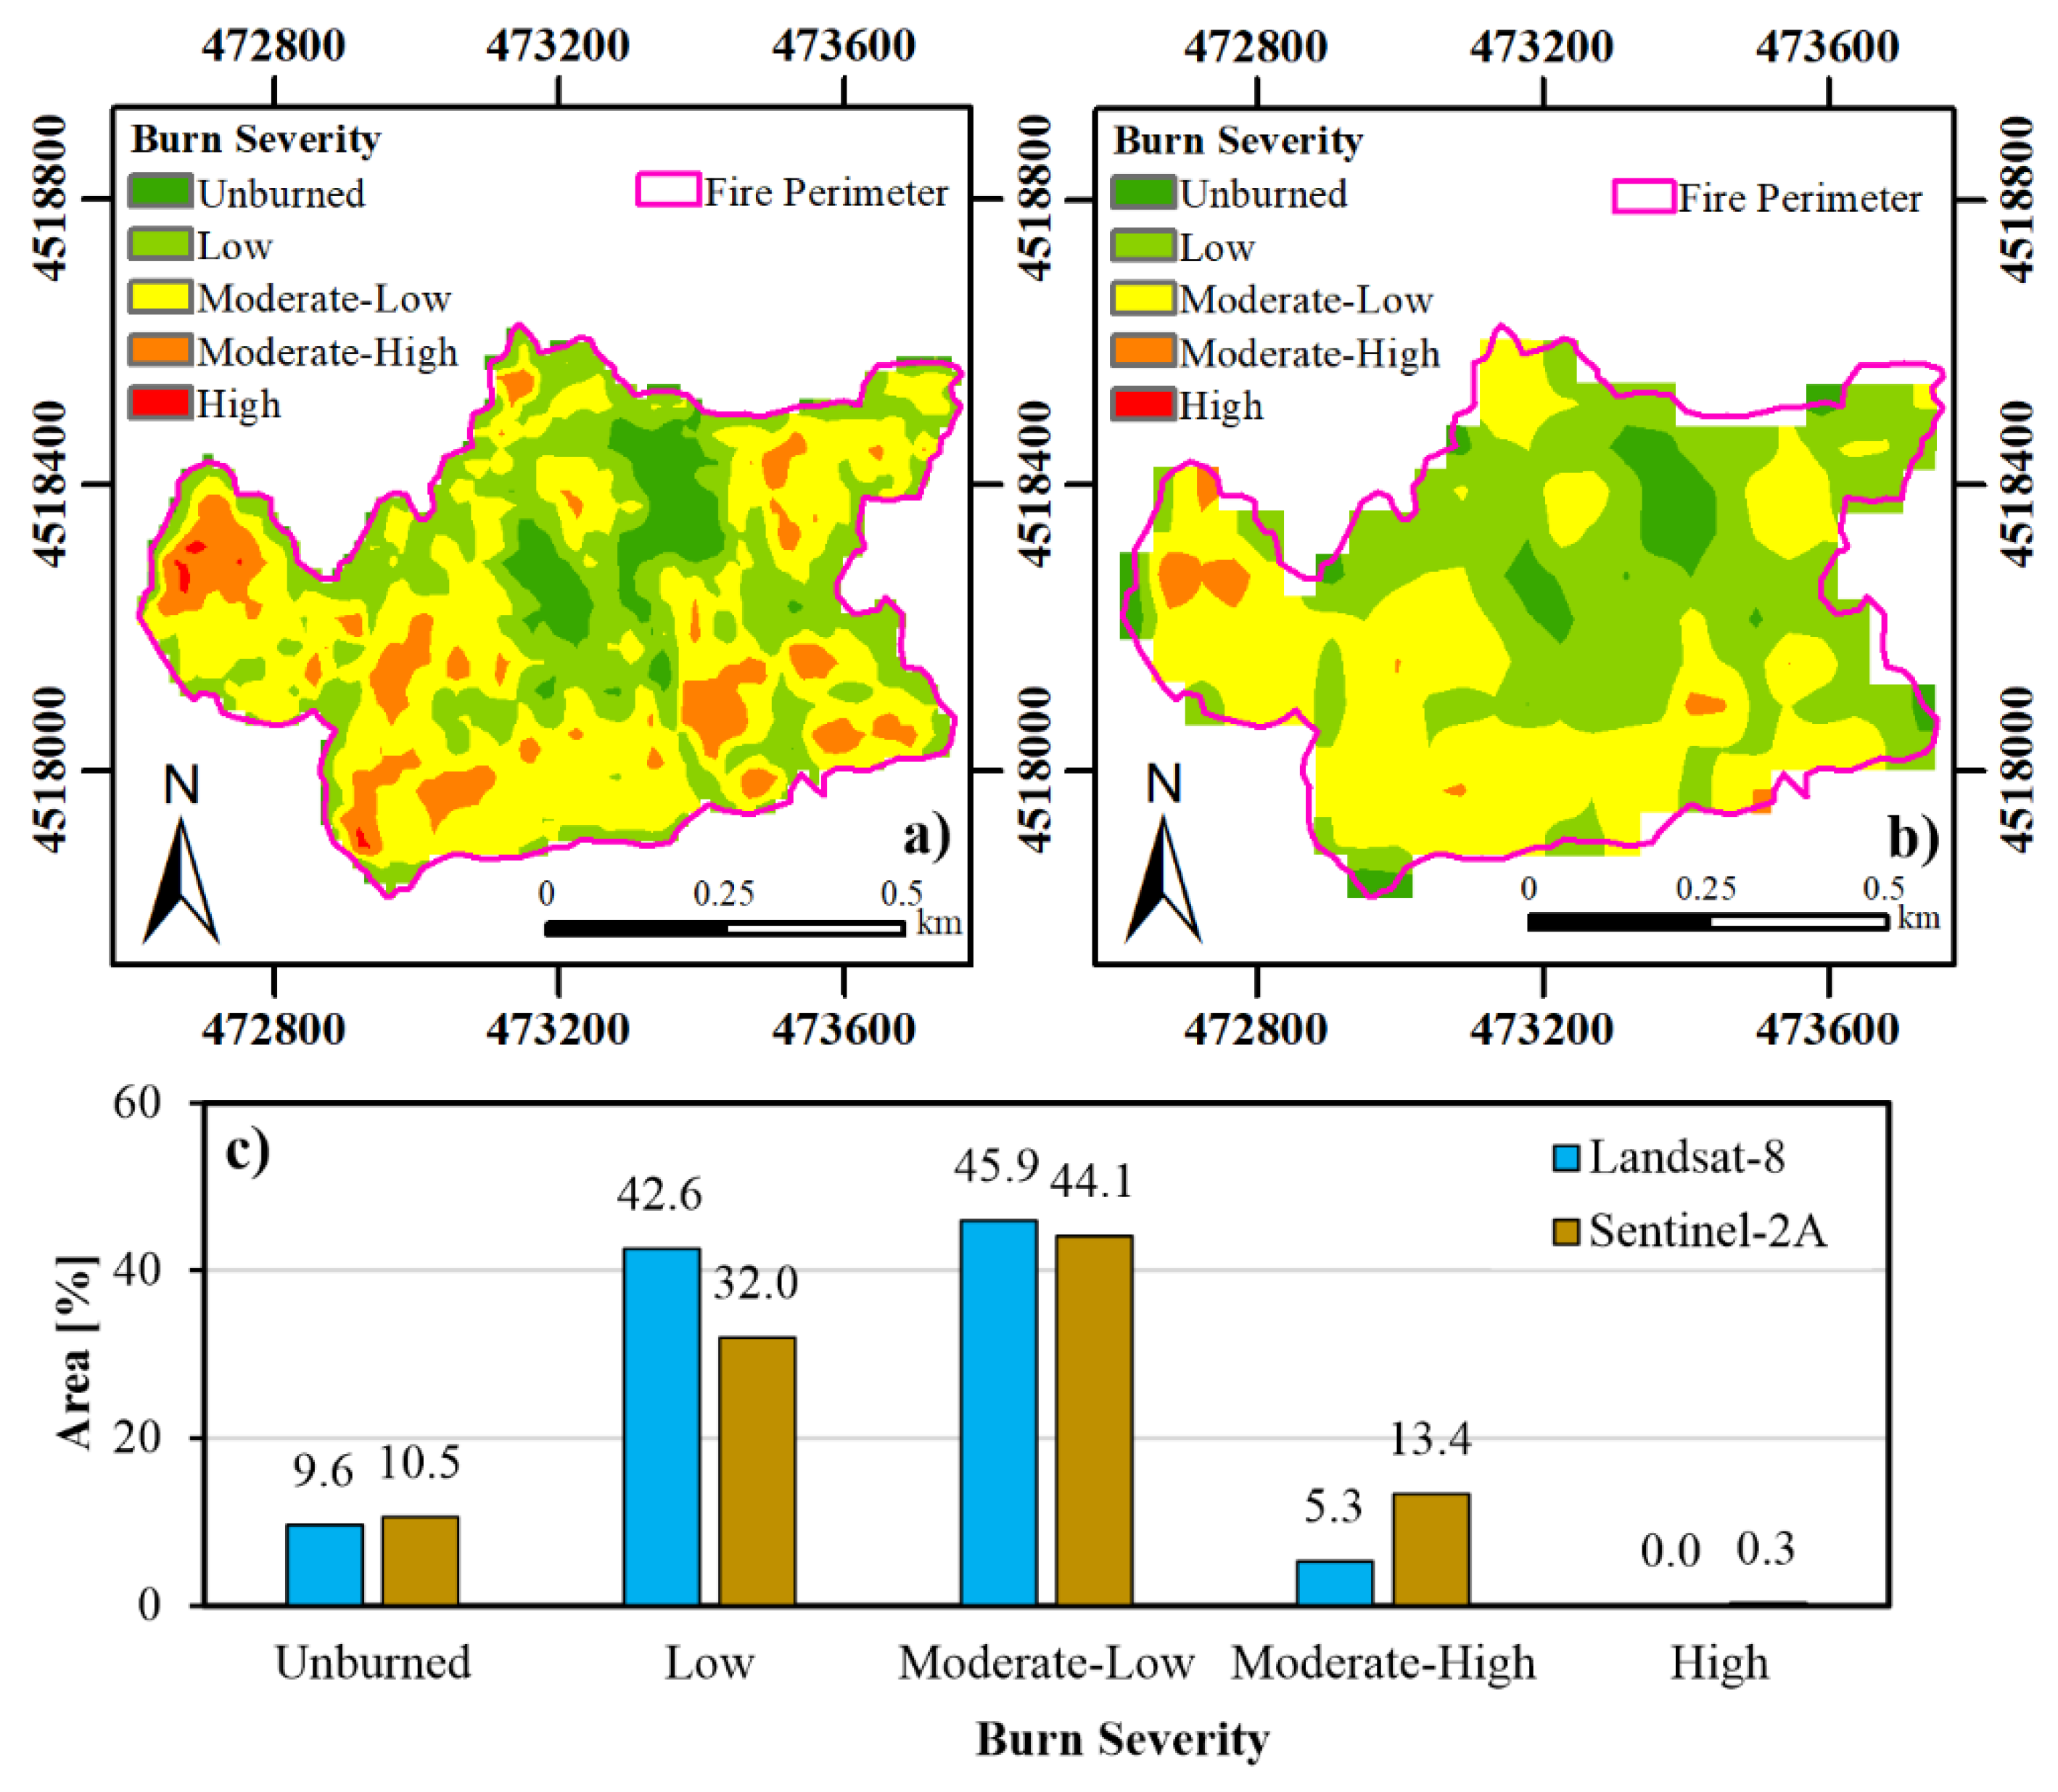
3.2. Sample Collection, Field and Remote Sensing Investigations

Figure 2 shows the procedure used to analyze whether and how the geotechnical properties of the soil change because of fire. It consisted mainly of two steps: (i) assessment of the fire damage by field surveys and remote sensing techniques; and (ii) geotechnical laboratory tests to characterize the undisturbed soil samples.
Soil samples were collected within a 0–5 cm depth, one per each point reported in Figure 3, at the mid-lower part of a 35° sloping area. The sampling depth was chosen to limit the analysis to the surface soil layer affected by the fire. To distinguish the different sample classes, we introduced the abbreviations UB-j and Bi-j, in which UB and B stands for unburned and burned samples, respectively. In addition, i stands for the time of sampling and j identifies the progressive number of samples collected at each i-th date.
The sampling activity focused on both burned (B1-j) samples collected on 30 September 2019 in a 3-ha area affected by the 20 September 2019 fire and unburned (UB-j) samples collected in a nearby area. Additional burned samples were collected on 18 October 2019 (B2-j) and 16 February 2020 (B3-j) to investigate post-fire changes in the soil’s physical and hydromechanical properties (Figure 3).
The burn severity of the Siano fire was estimated using both in situ and remote sensing techniques to support the interpretation of laboratory results.
The composite burn index (CBI) was used for the in situ assessment of the burn severity [23]. This index made it possible to evaluate fire-induced changes in the different layers of the forest ecosystem. The fire effects were assessed according to the CBI guideline by assigning values (i.e., ranging from 0 to 3) to the different biophysical variables of the three layers belonging to the understory (A, substrate; B, grasses, shrubs, and trees less than 1 m tall; C, shrubs and trees from 1 to 5 m tall) and the two layers belonging to the canopy (D, intermediate trees; E, dominant and co-dominant trees). The field-based burn severity classes range from low to high, depending on the magnitude of fire impacts on the affected area. The information collected was recorded in the survey data form provided by Key and Benson [23]. A CBI value of 1.5 was determined, which classified the Siano fire as moderate to low burn severity.
In addition, the burn severity of the Siano fire was evaluated using remote sensing techniques. Two Landsat-8 images (acquired on 16 September 2019 and 18 October 2019) and two Sentinel-2A images (acquired on 15 September 2019 and 10 October 2019) were used to assess the burn severity by adopting the differenced normalized burn ratio (dNBR) method [23]. The near-infrared band and the shortwave infrared band from each of the two preprocessed images were properly resampled. A difference map was then created from the two NBR results. The dNBR range corresponding to each fire severity was calibrated according to the NBR change before and after the wildfire (i.e., unburned and from low to high) according to the classification proposed by the United States Geological Survey (USGS) [23]. Figure 4a,b show the burn severity maps obtained from Sentinel-2A and Landsat-8 satellite data, respectively. Figure 4c shows differences between the burn severity maps developed with Sentinel-2A and Landsat-8 data for each burn severity class due to the different spatial resolution of the sensors. On average, the burn severity of the Siano fire was low/moderate to low.
By combining the results of field surveys and remote sensing techniques, it was determined that the Siano fire had a low/moderate to low burn severity.

3.3. Laboratory Tests

The geotechnical properties of the soil were investigated in the laboratory (Figure 2). In particular, in addition to the undisturbed samples (UB-j, B1-j, B2-j, B3-j), the experimental campaign also focused on reconstituted soil samples prepared from soil treated in a muffle furnace at 300 °C for 60 min and 600 °C for 60 min (MFT300-j and MFT600-j, respectively, in which j identifies the progressive number of tested samples). The different heating treatments in the laboratory were aimed at investigating changes in the physical and hydromechanical properties of the soil even beyond the effect induced by the low/moderate to low burn severity of the Siano fire.
The laboratory testing program included: (i) dry sieve tests (No. 27); (ii) specific gravity (Gs) tests (No. 31); (iii) direct shear (DS) tests (No. 35); (iv) soil-water retention (SWR) tests (No. 4).
Particle-size analyses with dry-sieving were performed to determine the GSDCs following the procedure illustrated in the standard reference ASTM D422-63 [66].
The Gs of each soil sample was computed by following the standard pycnometer procedure ASTM D854-14 [67]. Gs is defined as “the ratio of the mass of a unit volume of soil solids to the mass of the same volume of gas-free distilled water at 20 °C”. This material property is a dimensionless ratio expressed by Equation (1):
G s = M s V s · ρ w = ρ s ρ w
in which ρs [kg/m3] is the density of soil solids, ρw [kg/m3] is water density, Ms [kg] is the mass of the oven-dried soil solids, and vs. [m3] is the volume of the oven-dried soil solids.
Saturated DS tests were performed on undisturbed and reconstituted soil specimens measuring 60 mm × 60 mm × 20 mm. The ASTM D3080 [68] standard procedure was followed. Considering the low-stress levels characterizing the in situ conditions of the analyzed topsoil layer, the adopted vertical pressures (σ’vc) were fixed to 9, 15, 20, and 29 kPa. DS tests were conducted in a shear testing device, applying a horizontal displacement velocity of 0.0124 mm/min of the upper shear box, derived from information on the consolidation time of the tested specimens.
Soil water retention curves (SWRCs) on undisturbed and reconstituted cylindrical specimens (2461 mm2 × 20 mm) were also derived using a suction-controlled oedometer, marketed by Megaris (Caserta, Italy) and described by Aversa and Nicotera [69]. This apparatus can control the stress state variables identified by the net vertical stress (σv − ua) and the matric suction ψ = (ua − uw), where σv is the total stress, ua the pore–air pressure, and uw the pore–water pressure [70]. Matric suction can be explained as pore–water pressure with a negative value with respect to the pore–air pressure. The changes in the water content within soil pores result in changes in matric suction. Hence, the water flow within the unsaturated soil is affected by the less water-filled spaces among solid particles. As a result, the permeability of the unsaturated soil varies with the changes in matric suction [70]. The variation range of the applicable matric suction depends on the air-entry value of the adopted porous plate. In this work, a 100 kPa porous plate was used.
To obtain the SWRCs, the net vertical stress (σv − ua) was fixed and the matric suction varied by controlling uw and ua. The axis translation technique was adopted [71] to reconstruct the drying path of the SWRCs. Particularly, the pore–air pressure was kept at a constant value of 145 kPa and the pore-water pressure was varied from 145 kPa to 50 kPa, following nine steps of matric suction values. Each suction value was maintained until hydraulic equalization was reached. During this latter phase, the volume of porosity water exchanged by the specimen with the water content measurement system was monitored over time. Before running each test, some preliminary steps included (i) the high air-entry value porous plate saturation; (ii) the specimen assembly and the contact phase between the load cell and the specimen; (iii) the measurement of the initial matric suction value of the specimen, and (iv) the saturation of the soil specimen. Moreover, permeability tests were carried out to calculate the permeability coefficient of the porous plate.
Two SWR models (i.e., [72,73]) were used to obtain the SWRCs from the experimental data, along with the corresponding hydraulic parameters. Van Genuchten’s model [72] assumes a unimodal pore-size distribution and adequately fits the experimental SWRC data for soils characterized by a homogeneous pore structure. However, this model cannot describe SWRCs accurately for soils with a heterogeneous pore-size distribution. In such a case, Durner’s model [73] can be adopted. The SWR models may be expressed using the S variable that is Equation (2):
S = θ θ r θ s θ r
where S is the equivalent saturation degree; θ is the volumetric water content (i.e., the fraction of the total volume of soil occupied by the water contained in the soil); θs is the saturated volumetric water content, and θr is the residual volumetric water content.
The van Genuchten’s model (VG) [72] is described as Equation (3):
S = 1 1 + α ψ n m
The parameter α may be correlated to the inverse of the air-entry value. In contrast, the n parameter gives information about the soil pore-size distribution, and the m parameter refers to the asymmetry of the model.
Durner’s multimodal retention function (DB) [73] is designed for soils with more than one order of pores; Equation (4):
S = i = 1 k w i 1 1 + α i ψ n i m i
where k is the number of subsystems that form the total pore-size distribution, and wi represents weighting factors for the sub curves (0 < wi < 1, Σwi = 1). As for the unimodal curve, the parameters of the sub curves (αi, ni, mi) are subjected to the conditions αi > 0, mi > 0, ni > 1. αi is a scaling factor determining the pore size maximum, and mi and ni are dimensionless curve shape parameters.

4. Results

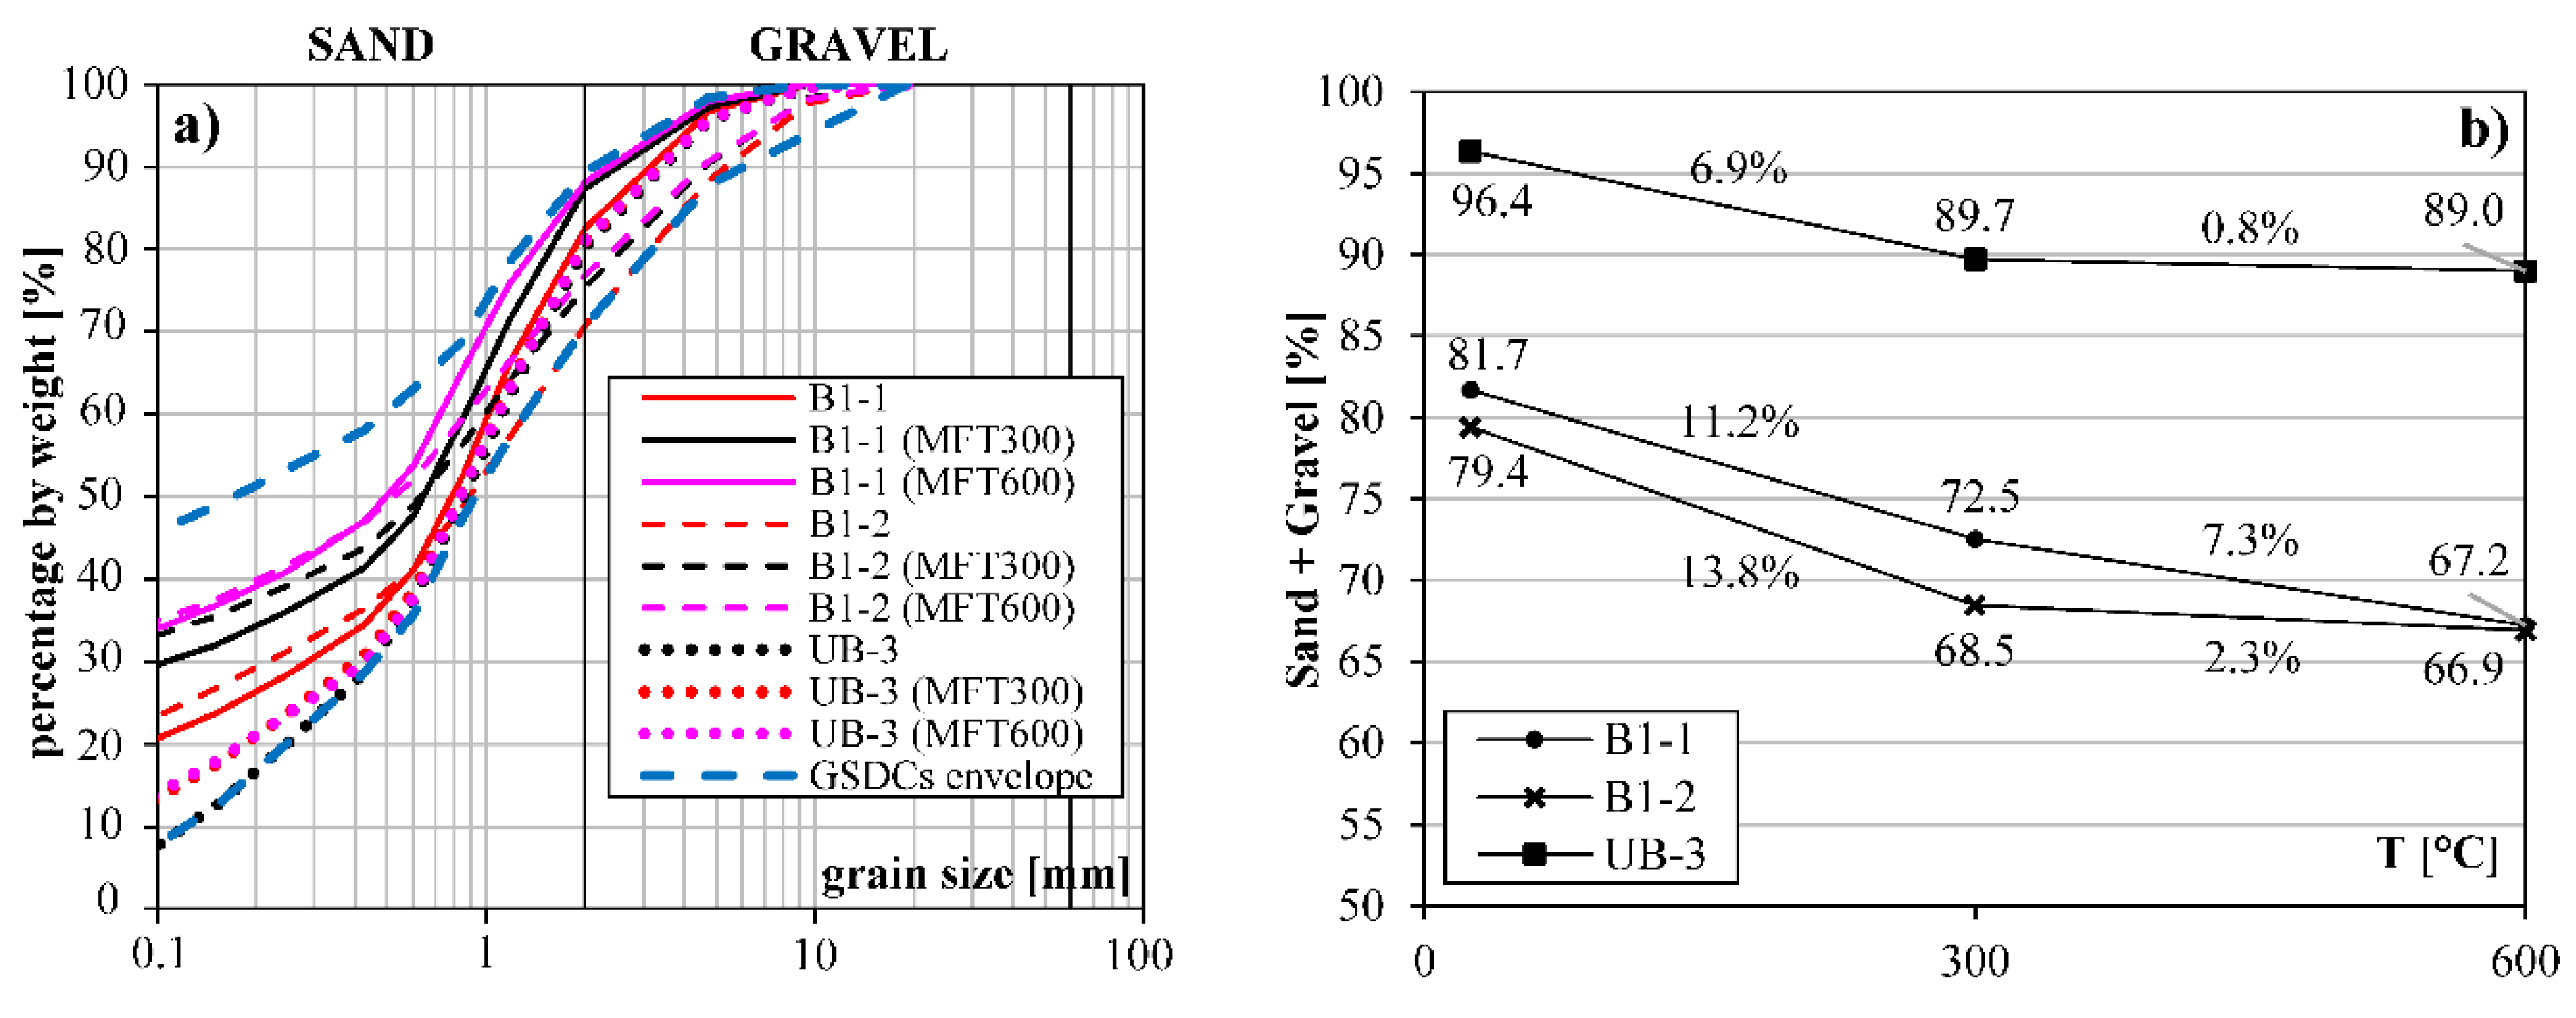
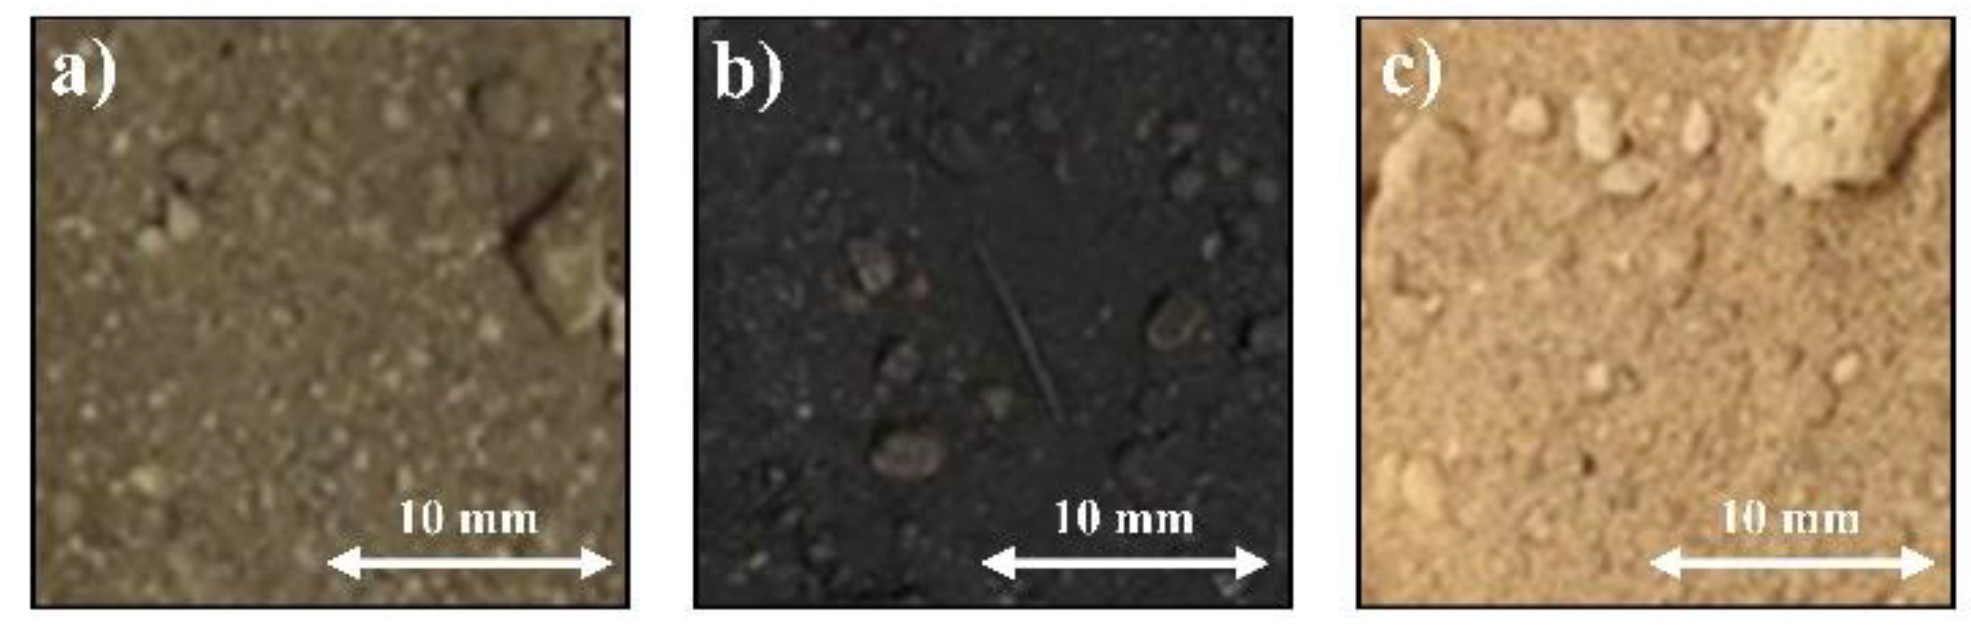
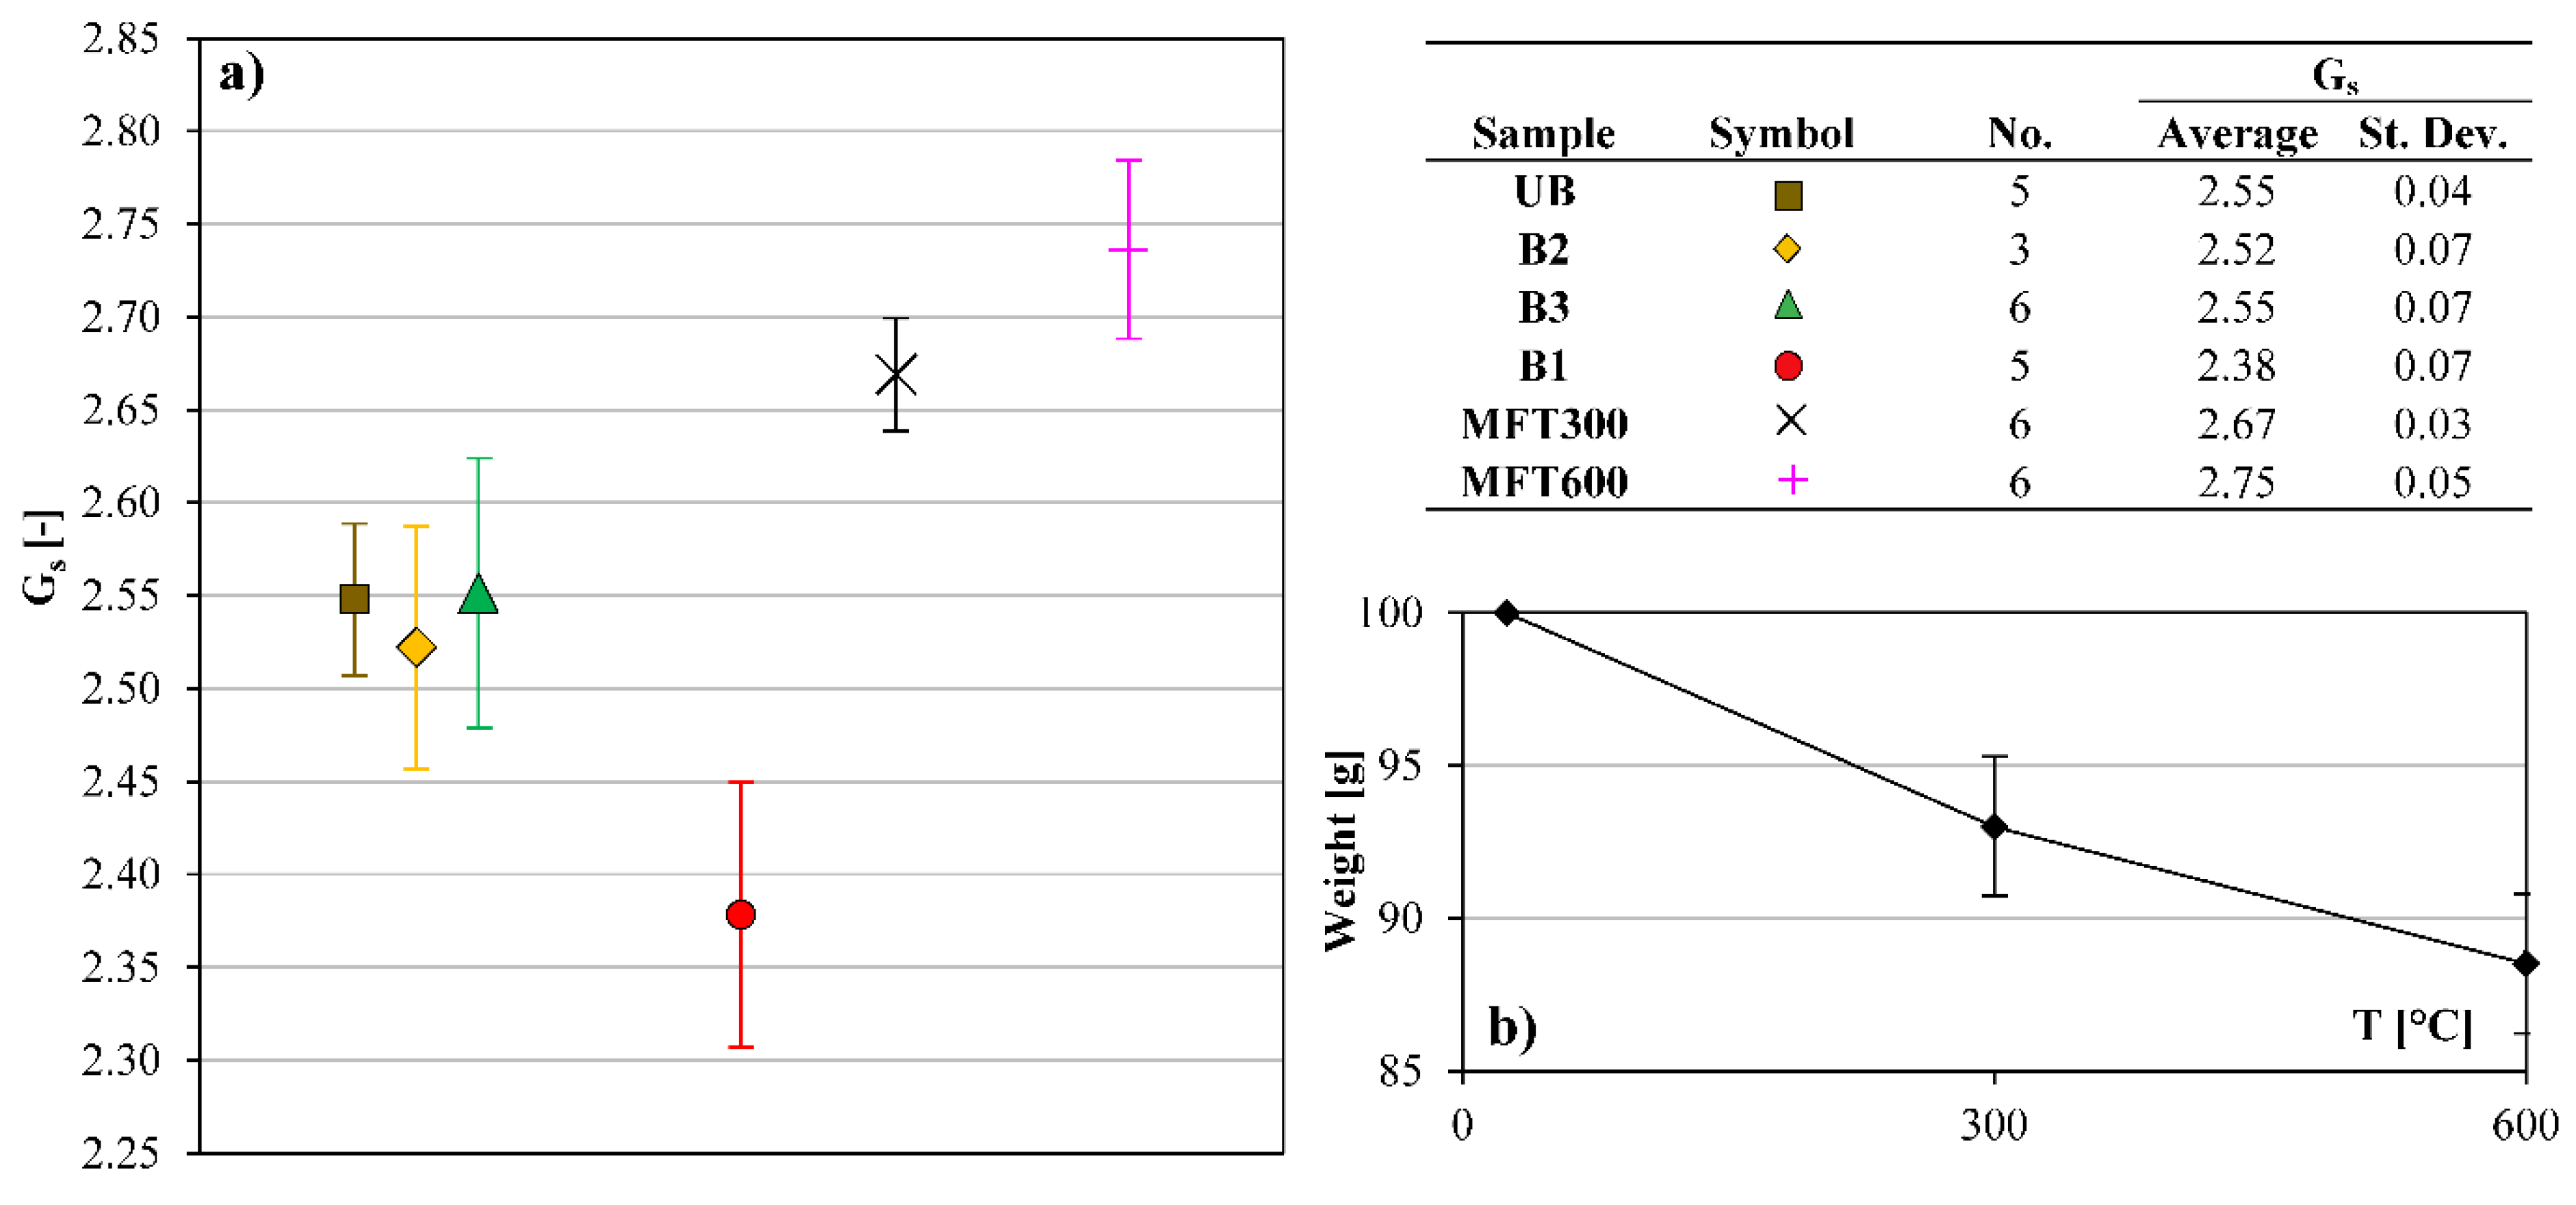
4.1. Changes in Soil GSDCs, Color, Gs

Overall, the GSDCs of the thermally untreated soil samples (UB-j, B1-j, B2-j, B3-j) ranged from poorly graded sand (SP, gravel = 29%, sand = 67%, silt = 4%) to silt in sand (SM, gravel = 11%, sand = 45%, silt = 44%) according to the Unified Soil Classification System (USCS) (see the blue dashed lines in Figure 5a). Bilotta et al. [63] pointed out that the stratigraphic conditions of the Pizzo d’Alvano slopes are characterized almost everywhere by alternating layers of pumice soils, mainly observed as gravel components.
For the MFT soil samples, an increase in fine-grain content with temperature was observed in either unburned (UB-3) or burned (B1-2 and B1-1) conditions (Figure 5a,b). In particular, the silt content increased after the MFTs, whereas the gravel and sand content decreased. Moreover, Figure 5b shows that the decrease in sand and gravel fractions is lower for the MFT600-j samples, which underlines that the primary grain size variation is found for the MFT300-j samples.
In addition, changes in soil color were noted during the MFTs in the laboratory (Figure 6a–c). In particular, the MFT300-j soil samples exhibited a much darker color (Figure 6b) than the unburned ones (Figure 6a), tending towards black. The MFT600-j showed further variation in hues, moving from black to color between yellow and red (Figure 6c). It was also possible to notice how the heating duration affected the soil color by observing the soil samples in the muffle furnace over time. Only after heating at 600 °C for 30 min did the natural color of the soil begin to change, approaching gray and red. However, this occurred only in the uppermost layer, where the roots were completely burned to white, while the sample a few centimeters below retained its natural color. We attributed this experimental evidence to the poor thermal conductivity of the soil.
The results also showed that Gs decreased for the B1-j samples compared to the UB-j, B2-j, and B3-j samples (Figure 7a). The B2-j and B3-j samples were characterized by Gs values comparable to those of the UB-j. The heating treatments in the laboratory resulted in an increasing Gs trend with temperature. Compared to the UB-j samples, we found a percentage increase in Gs of 4.7% and 7.5% for the MFT300-j and MFT600-j samples, respectively. In addition, a higher scatter of Gs data was observed for the B1-j, B2-j, B3-j compared to the UB-j or MFT300-j and MFT600-j samples. In particular, the MFT-j samples showed that the amount of burned OM increases with increasing temperature at constant duration, and the Gs values also increase.
Figure 7b shows that the average weight decreases, passing from the step “initial condition−300 °C” (To-300) to the step “300–600 °C” (300–600). This result indicates that a large part of OM is burned as soon as the first step (To-300) has been passed. On the other hand, the remaining part needs higher temperatures (or longer duration at the same temperature) to be burned.

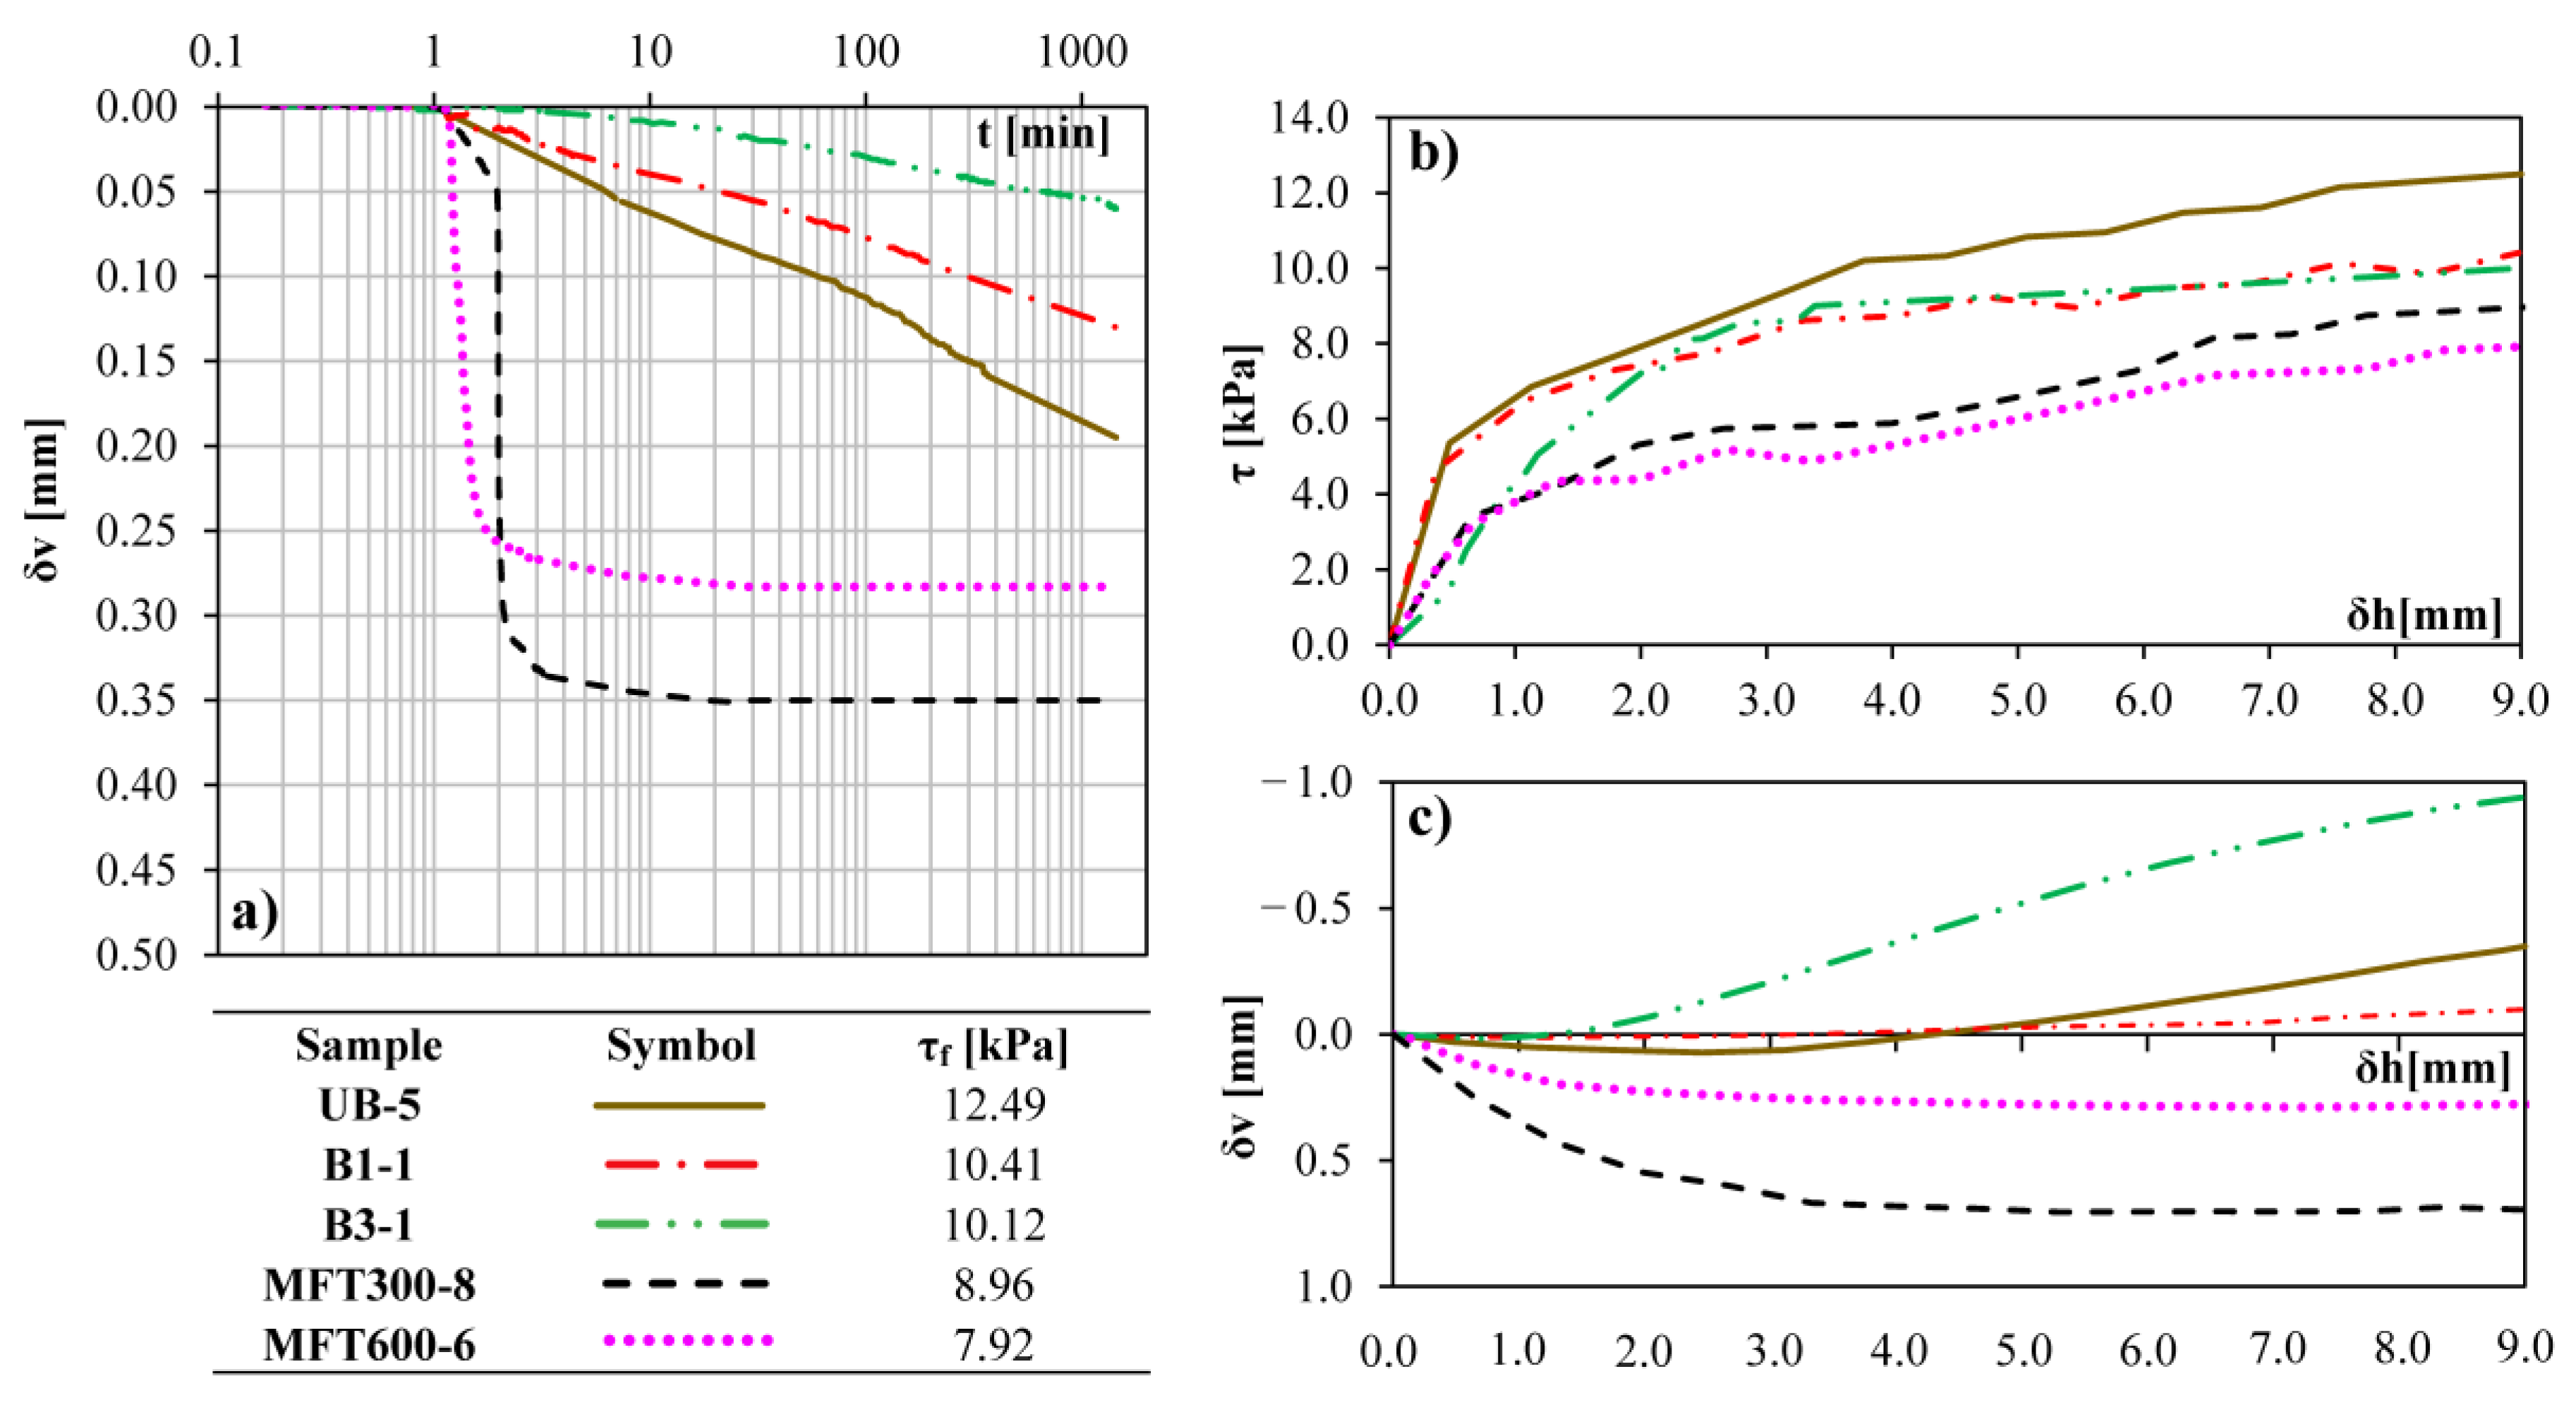
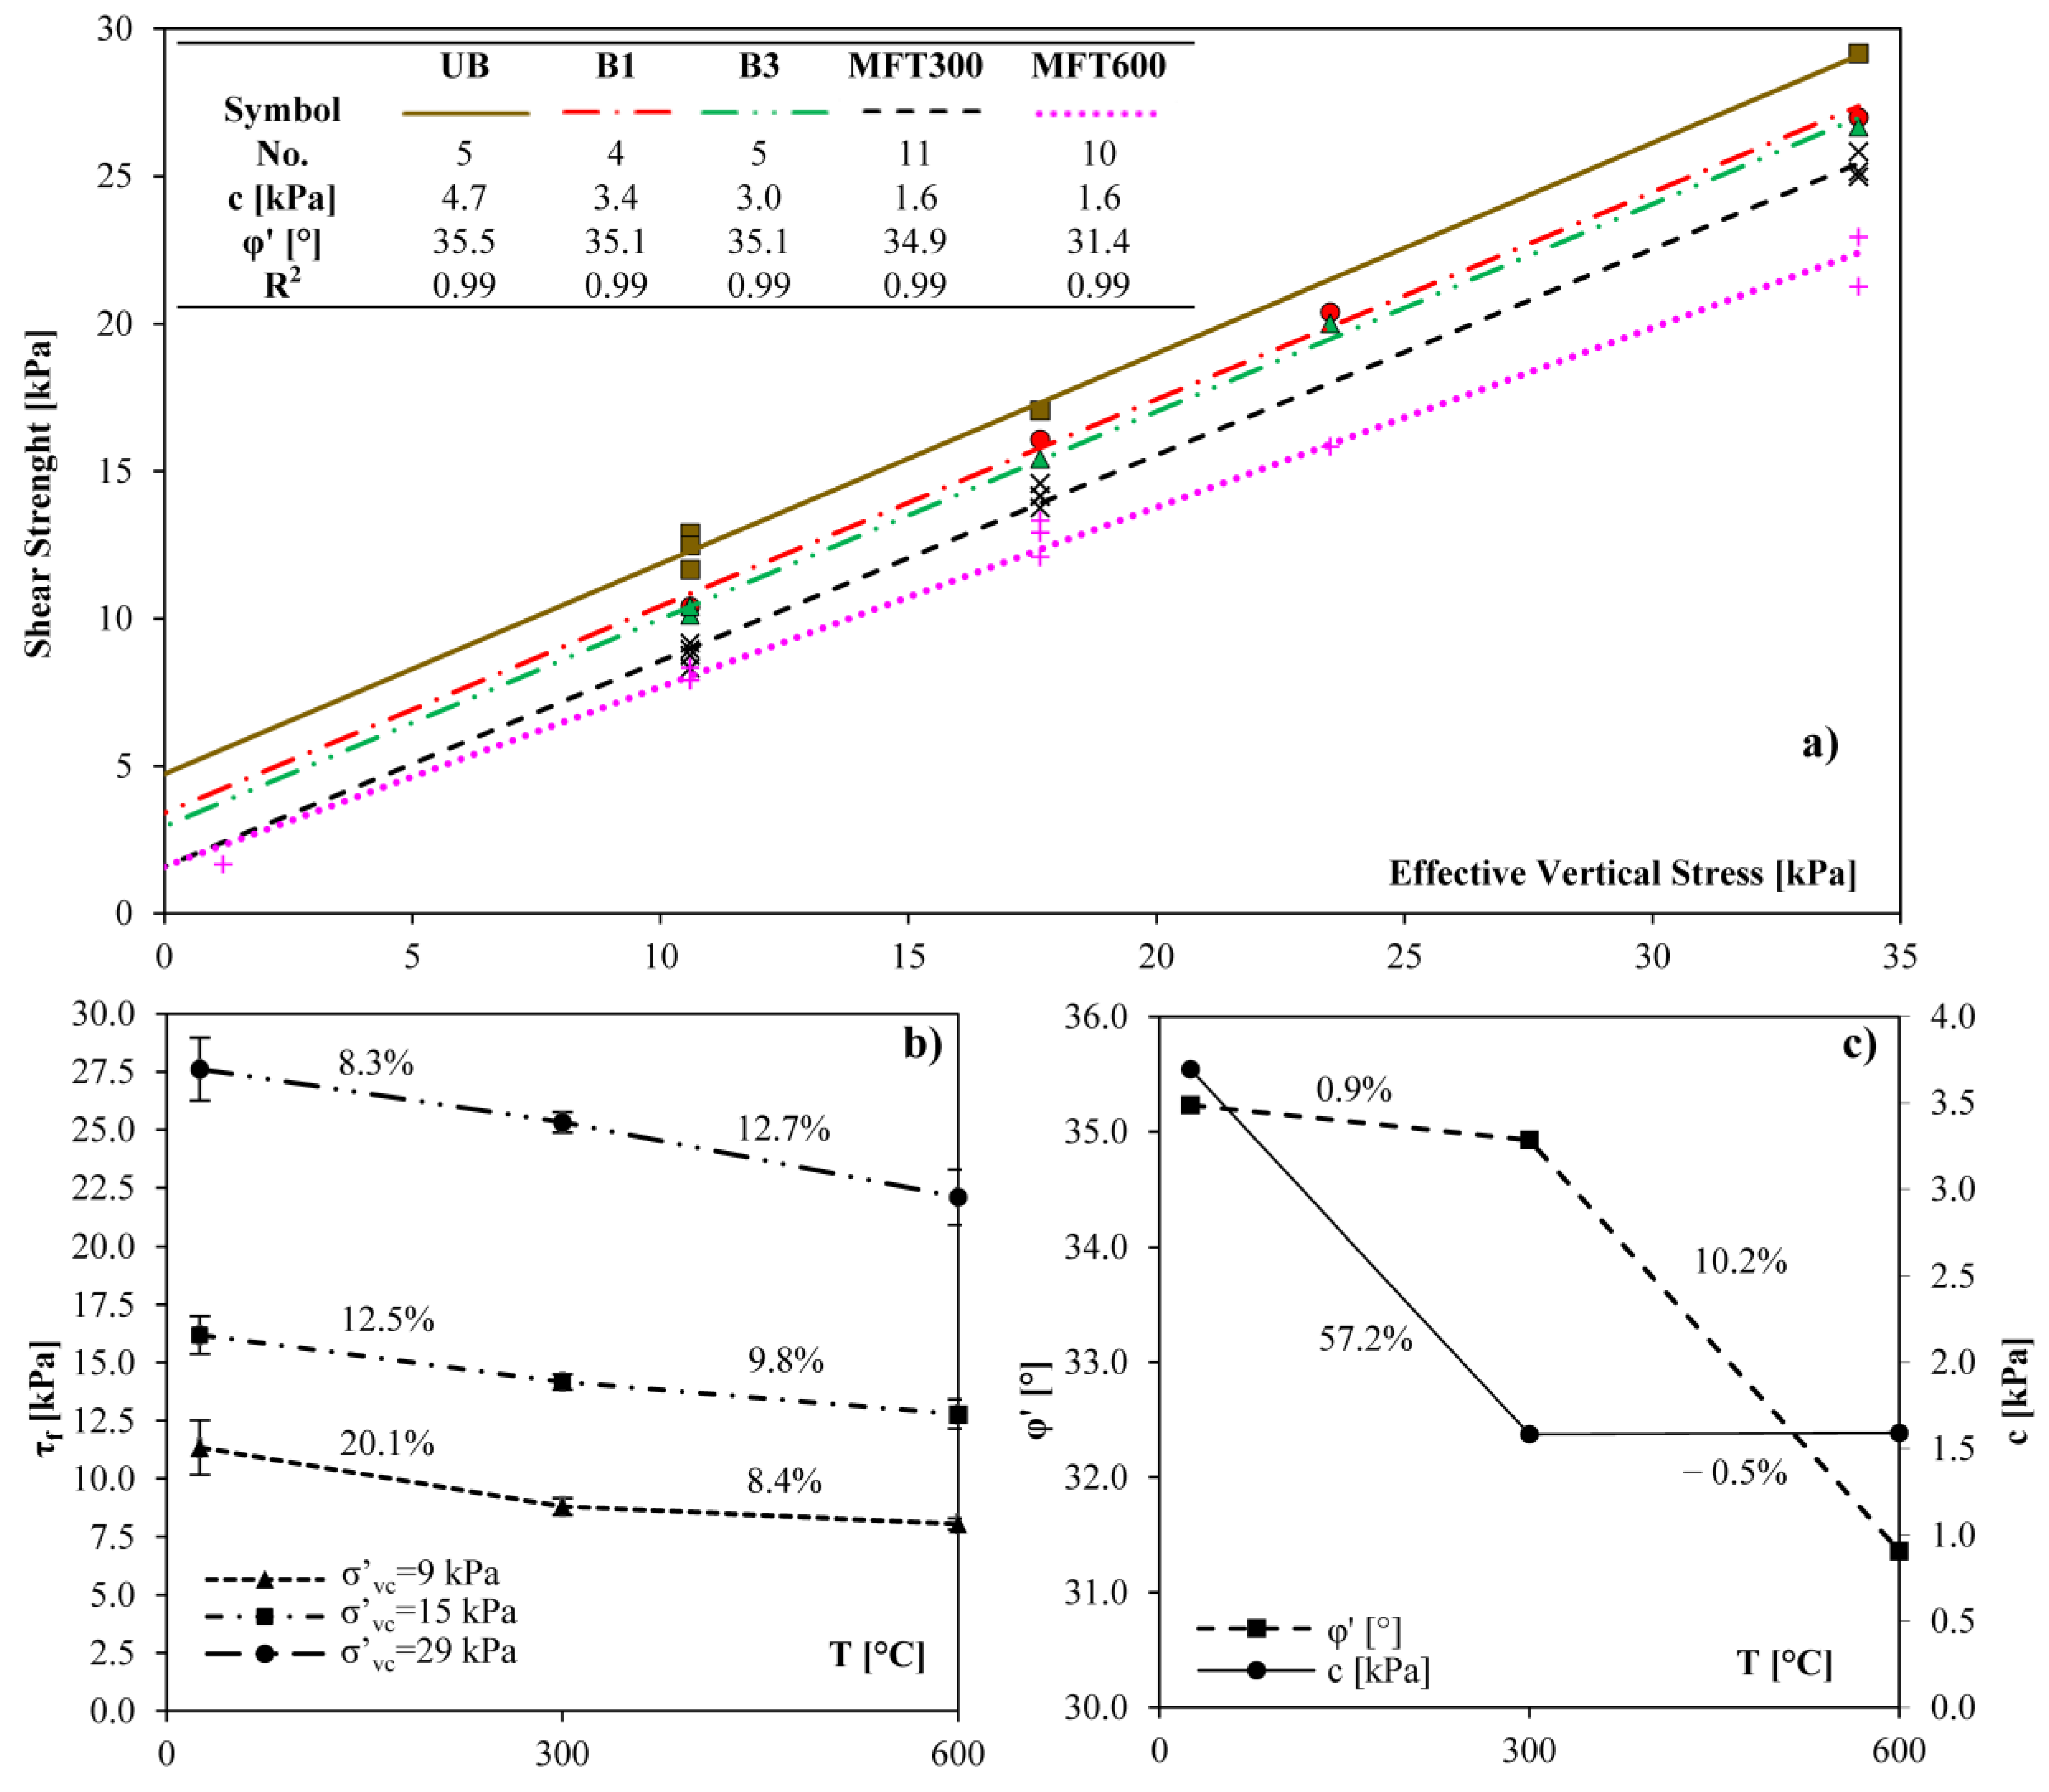
4.2. Changes in Soil Mechanical Properties–c, φ’

Saturated DS tests were performed on both undisturbed and reconstituted soil samples (Table 1). The results for the vertical pressure closest to the field conditions (σ’vc = 9 kPa) are shown in Figure 8a–c (labeled with apex a in Table 1). In the consolidation phase (Figure 8a), the MFT300-8 and MFT600-6 samples exhibited higher settlement values and consolidated in a relatively short time interval (approximately a few minutes) compared to the UB-5, B1-1, and B3-1 samples, indicating a primary consolidation behavior. In contrast, the UB-5, B1-1, and B3-1 samples also exhibited a secondary consolidation (creep), which involved a gradual change in soil volume in response to loading, which may be attributed to the presence of organic material. Regarding the shear phase, Figure 8b shows that the MFT300-8 and MFT600-6 samples had lower shear stress values than the UB-5, B1-1, and B3-1 samples. On the other hand, from a volumetric point of view (Figure 8c), we observed a different dilatancy/contracting behavior among the soil classes. In particular, the UB-5 and B3-1 samples initially showed contracting behavior followed by dilatancy; the B1-1 samples showed similar behavior but exhibited less pronounced dilatancy; the MFT300-8 and MFT600-6 samples were characterized by contracting behavior only.
From the plot shown in Figure 9a, among the thermal-untreated samples (UB-j, B1-j, B3-j), the UB-j samples were characterized by the highest total cohesion (c = 4.7 kPa). In contrast, the friction angle did not noticeably change (ranging between 35.0° and 35.5°) (Figure 9a). The effect of the Siano fire consisted mainly of a decrease in the cohesive contribution compared to the unburned control samples (UB-j). Specifically, there was a slight decrease from c = 4.7 kPa to c = 3.4 kPa, whereas the friction angle was almost unchanged (35.5° for UB-j to 35.1° for B1-j). The samples collected 5 months after the fire event (B3) were characterized by cohesion and friction angle values of 3.3 kPa and 34.7°, respectively, thus not achieving the cohesion value of the UB-j samples and keeping the friction angle value almost unchanged.
By observing Figure 9b, the shear strength (i.e., the average value of all the samples in Table 1 distinguished by their effective vertical pressure) decreased as a result of the laboratory heating treatments, regardless of the applied vertical pressure. In particular, the comparison between the shear strength parameters of the thermal–untreated (UB-j, B1-j, B3-j referred to the T0 value) and treated in the muffle furnace (MFT300-j, MFT600-j) samples (Figure 9c) reveals that soil cohesion and friction angle exhibited different behaviors for the two performed laboratory heating treatments. Particularly, with reference to the thermal–untreated soils, the MFT300-j samples exhibited a more significant variation in the cohesion than in the friction angle, whereas the MFT600-j samples were characterized by the opposite behavior, showing more significant variation in the friction angle than in the cohesion.

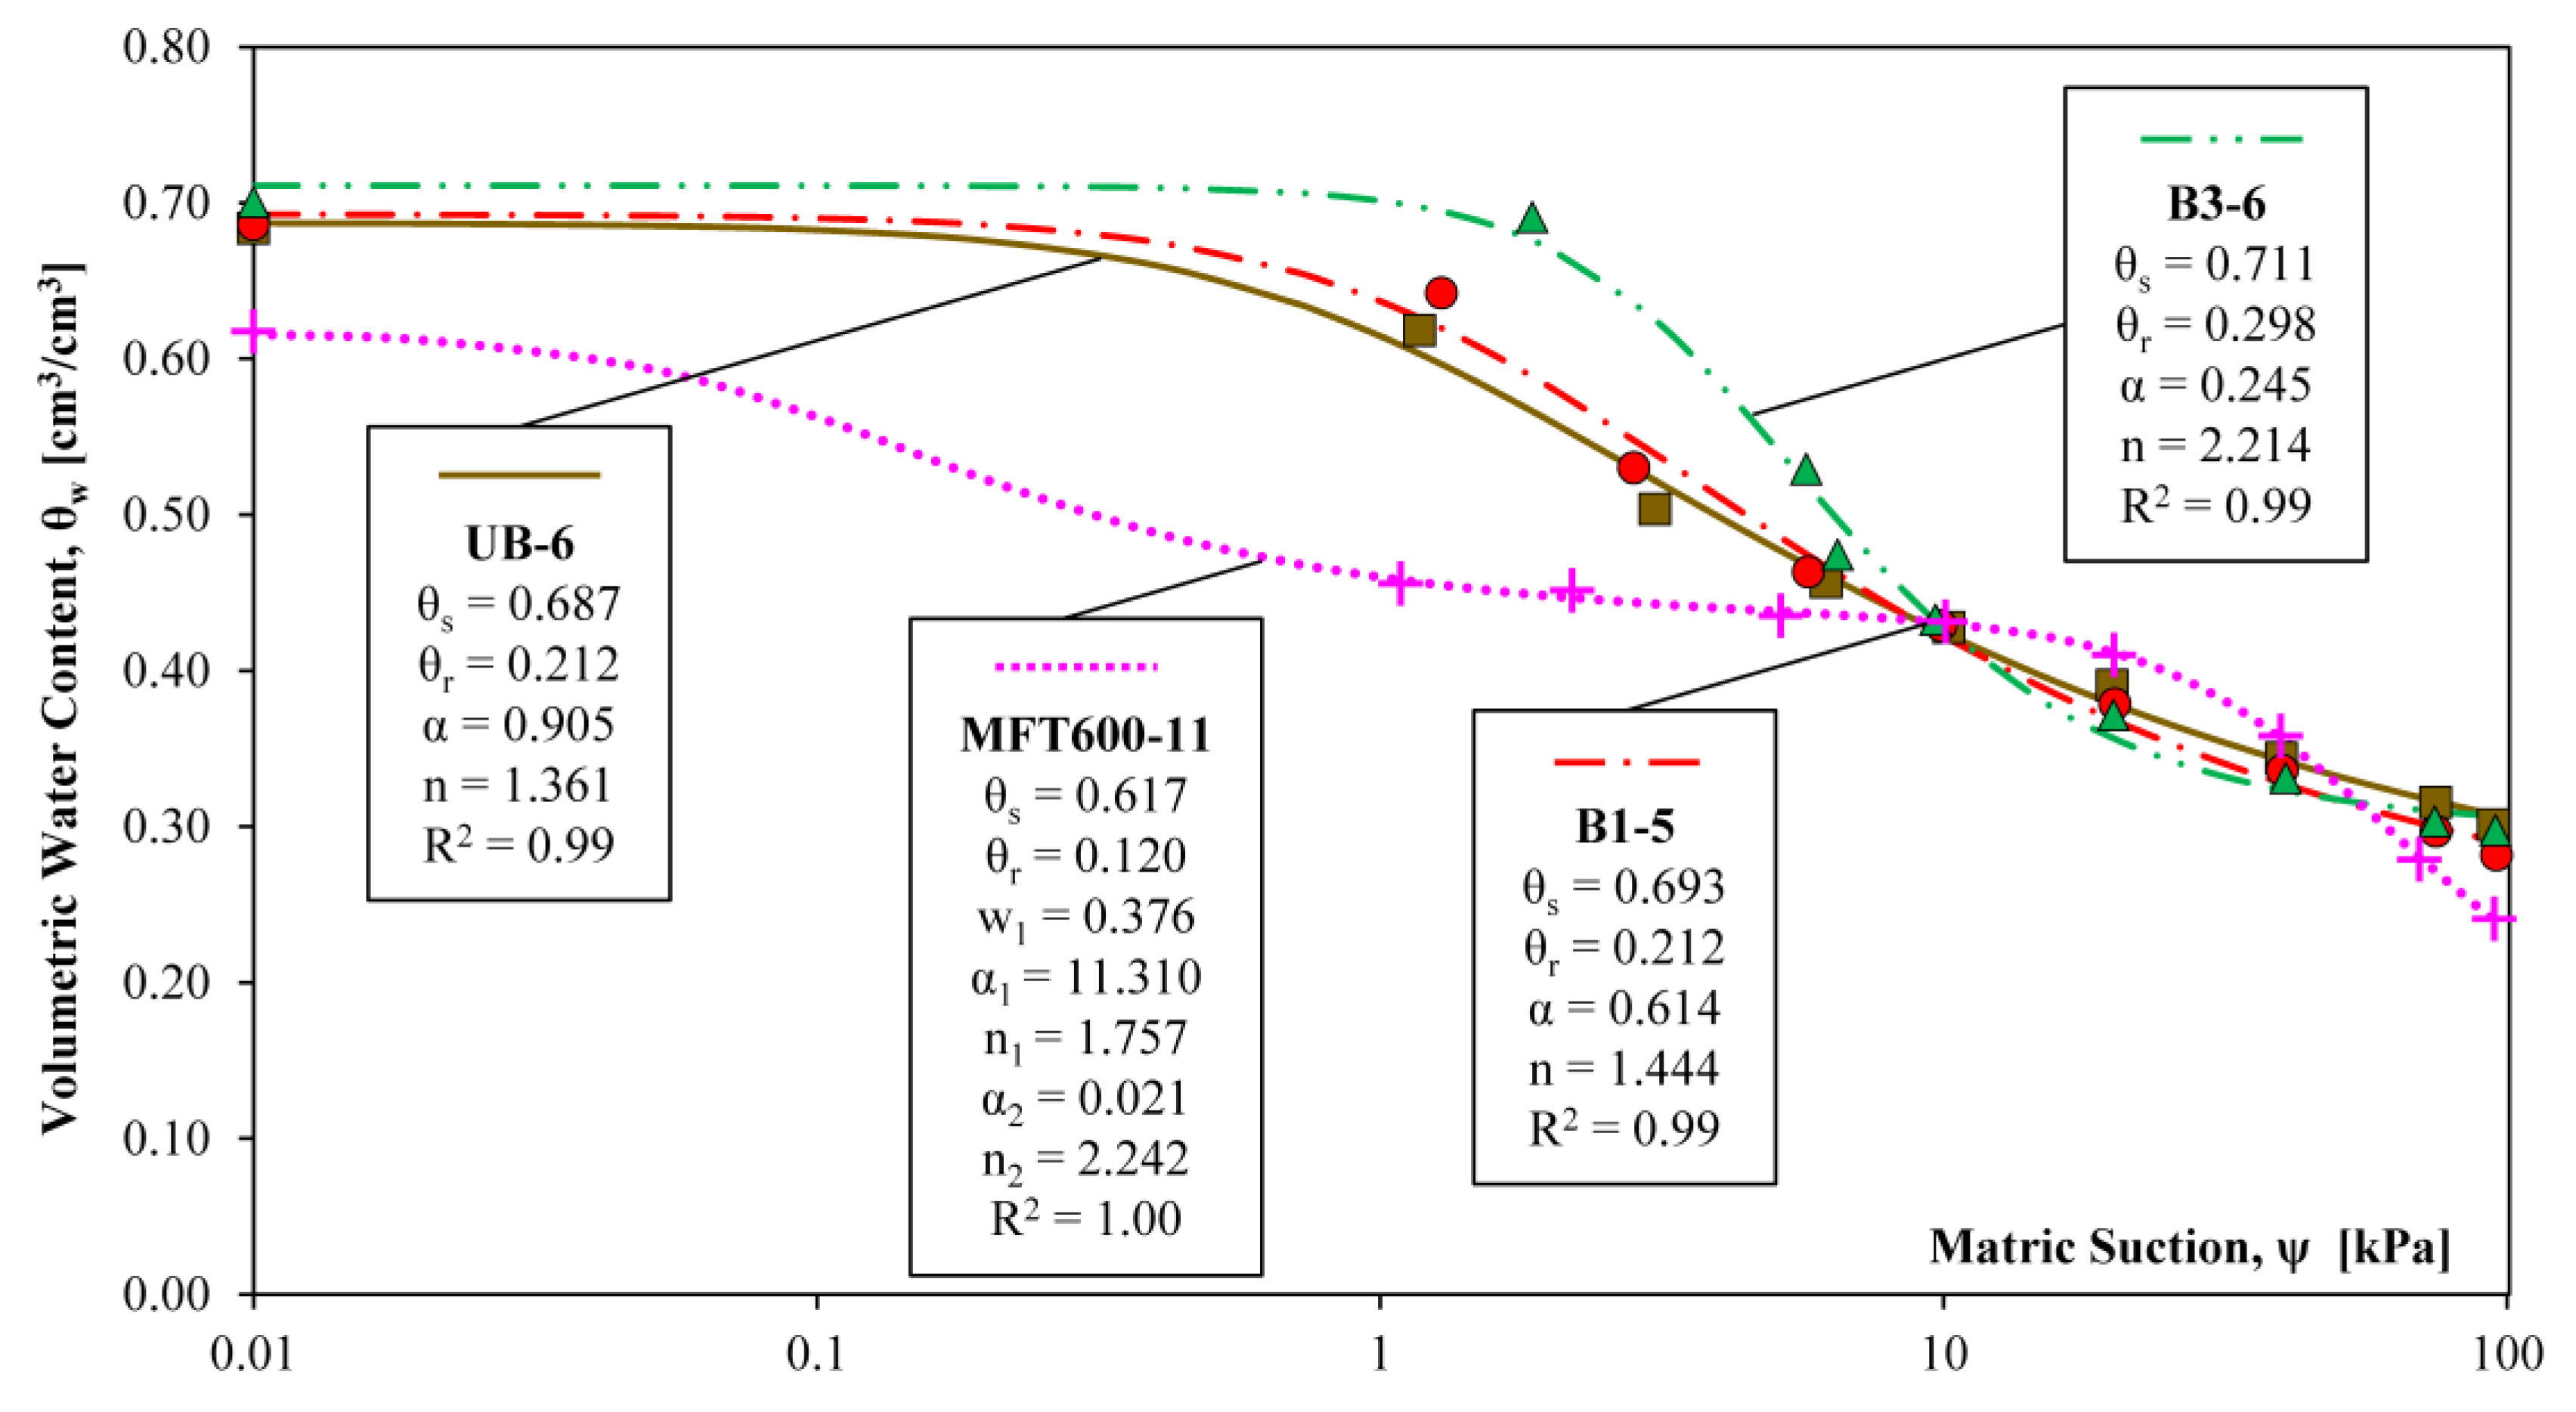
4.3. Changes in Soil Hydraulic Properties–SWRCs

The SWRCs were derived for both undisturbed and reconstituted soil samples. The specimens were previously saturated and then subjected to increasing matric suction values, up to a maximum of 95 kPa, thus allowing the reconstruction of the main drying path of the SWRC. The main properties of the soil samples tested in the suction-controlled oedometer and the results obtained are shown in Table 2 and Table 3, respectively.
The experimental data obtained from the suction-controlled oedometer tests were implemented in both van Genuchten’s and Durner’s models [72,73]. In particular, the thermal–untreated samples showed regular trends, exhibiting unimodal SWRCs behaviors, whereas a bimodal behavior characterized the MFT600-11 sample (Figure 10). Compared to the thermal–untreated samples, for low matric suction levels (up to 6–10 kPa), the MFT600-11 was characterized by lower volumetric water contents, whereas it showed slightly higher values in the range of 10–55 kPa and then for higher matric suction values (up to 100 kPa) it exhibited no significant differences.
Moreover, the MFT600-11 showed a rapid desaturation for matric suction values between 0 and 1 kPa, followed by a transitional phase where the degree of saturation was kept almost constant up to 10 kPa. Then, an increase in the desaturation gradient was recorded for matric suction values higher than 20 kPa.
The SWRC relative to the B1-5 sample slightly differs from that of the UB-6. Compared to the UB-6 and B1-5 samples, the B3-6 showed higher volumetric water contents up to matric suction of 10 kPa, whereas no significant differences were found at higher matric suction values. Notably, for the thermal-untreated samples, we noticed an increase in the slope of the volumetric water content function for matric suction values higher than 2 kPa. This decrease in volumetric water content markedly appeared for the B3-6 rather than the UB-6 and B1-5 samples.

5. Discussion

The performed laboratory tests provided insight into the post-fire physical and hydromechanical properties of the pyroclastic soils that cover the reliefs of Mount “Le Porche” (Siano mountains, southern Italy), affected by a low/moderate to low burn severity fire on 20 September 2019. GSDCs, Gs, shear strengths, and SWRCs were analyzed for three soil sample classes: unburned, wildfire-burned, and those subjected to different laboratory heating treatments.
As for the physical properties, changes in soil GSDCs, color, and Gs were observed. Regarding the grain size distribution of the tested soil samples, an increase in the fine-grain content with temperature was noticed after laboratory heating treatments, which is in agreement with the results of Stoof [40], who showed that heating soils at temperatures below 200 °C has little effect on soil texture, whereas burning and heating at temperatures above 300 °C increases the clay and silt content and decreases the sand content. In particular, our results revealed increases in silt content due to the muffle furnace treatments, whereas gravel and sand content decreased. In addition, we found that the decrease of sand and gravel fractions was lower after MFT600, which indicates that the main grain size change is observed for the MFT300-j samples. The results can be attributed to a cracking effect of the sand and gravel particles due to heat exposure in the muffle furnace. An observed peculiarity concerned the presence of pumice material in the samples that did not tend to crack into finer particles under normal conditions (unburned) but showed a low resistance after heating to 300 °C and then to 600 °C for 60 min so that even low stress was sufficient to crumble the coarser pumice particles. In contrast, Esposito et al. [18] reported that the texture classes of the pyroclastic soils of the Pizzo d’Alvano massif were not significantly affected by a fire in 2012. However, it is worth noting that in the tests presented here, we did not find the aggregation phenomenon of finer particles into sand-sized particles mentioned in previous studies (e.g., [26,39]), probably due to the predominantly sandy composition of the analyzed soil. We noted that after exposure to 300 °C for 60 min (MFT300), the soil samples exhibited a much darker color than in the unburned condition, tending toward black and leaving black traces when touched. We attribute this color change to incomplete combustion of soil OM (e.g., coal), as found by several authors [24,25]. Moreover, after burning the same soil samples in the muffle furnace at 600 °C for 60 min (MFT600), a further color change from black to color between yellow and red was observed. The latter color change could be related to the dehydration of goethite into hematite or maghemite, as confirmed by Zihms et al. [39], who focused on the color changes of silica sand during laboratory heating experiments. Moreover, it is worth comparing the soil color changes resulting from the laboratory heating with those observed in the Siano burned area. In particular, the same color changes were not observed as in the samples obtained from MFTs at 300 and 600 °C for 60 min. This indicates that the Siano fire resulted in less severe heating conditions than those simulated in the laboratory treatments. We suggest that the color change observed in the field is due to the moderate to low burn severity of the Siano Fire.
Compared to the Gs of the unburned control site (UB-j), the burned samples (B1-j) showed a significant decrease; the samples collected at different dates after the fire (B2-j and B3-j) showed a progressive recovery, and an increasing trend was observed in the samples subjected to the laboratory heating treatments (MFT300-j, MFT600-j). We relate the decrease in Gs for the B1-j samples to the partial burning of litter and understory OM (resulting in charcoal and ash) and its deposition in the upper soil layer. Our results are consistent with previous research showing that ash and charcoal have lower Gs than mineral soil particles (e.g., [74]). Samples collected from the burned area approximately one month (B2-j) and five months (B3-j) after the fire exhibited Gs values not significantly different from those of the unburned control samples (UB-j), indicating a recovery of Gs. We hypothesize that this is a result of post-fire runoff and erosion processes triggered by rain and wind that led to the partial removal of fire residues from the surface soil horizon. On the other hand, the MFTs resulted in a significant increase in soil Gs as a function of temperature. Specifically, as the temperature increased the amount of volatilized OM (light and bulky) increased, and soil Gs values also increased. This is consistent with previous studies on the topic [40,44,75].
Regarding changes in the mechanical properties of the tested soils, reductions in the cohesive contributions of burned (B1-j), revegetated (B3-j), and muffle furnace treated (MFT300-j, MFT600-j) samples were observed compared to unburned (UB-j) control samples. In addition, the MFT600-j samples showed a decrease in soil friction angle compared to the other soil sample classes. The investigated soils are loose and of pyroclastic origin; only their root systems provide a cohesive contribution under saturated conditions. Wu [76], Waldron [77], and Wu et al. [78] proposed and developed a model for the analysis of shear strength of rooted soils. This model is based on the tensile strength of roots and the percentage of rooted area defined as the sum of the cross-sectional area of each root passing a horizontal plane at a given depth (i.e., RAR, root area ratio). The additional force is due to an increase in cohesion and is proportional to the number of roots and their diameter. Depending on the degree of burning and heating, we found that the additional root cohesion was reduced for the fire-affected (B1-j, B3-j) and MFT-j samples due to the fire-induced weakening and burning of the root systems. This is confirmed by the fact that the MFT-j samples exhibited higher settlement values in the consolidation phase and a contracting behavior in the shear phase as the structural contribution of the roots was removed. In particular, the reduction in cohesion was due to the fire-induced combustion of the roots in the burned samples (B1-j). This is also confirmed by several researchers who found that roots can lose strength after a fire, decreasing their contribution to cohesion and making slopes more prone to failure [46,79,80]. Moreover, the value of cohesion still slightly decreased in the long term (5 months after the fire in this work) for the B3-j samples, highlighting that the roots may lose only part of their strength contribution shortly after the fire. From the in situ surveys, we found that the B3-j samples were rooted and still contained fire residues, albeit in smaller amounts than the B1-j samples. We can argue that 5 months after the fire, root regeneration occurred. However, the roots did not reach values of cohesion typical of the unburned site. Our results are consistent with those of Lei et al. [46], who found that the decline in soil cohesion after a fire depends on the time and the fire burn severity. The authors observed a deterioration of hydromechanical properties of soil-root systems after a wildfire in a subalpine coniferous forest area (2 months, 1 year, and 2 years after wildfire). They showed decreasing root tensile strength associated with root death and subsequent reduction in soil cohesion, which is critical for understanding the initiation mechanism of post-fire debris flows and shallow landslides. Comparing the shear strength parameters (i.e., the average values of all samples listed in Table 1) of the thermally untreated soils (UB-j, B1-j, B3-j) with the soils treated in a muffle furnace (MFT300-j, MFT600-j) (Figure 9c), the soil cohesion and soil friction angle showed different behaviors for the two performed heating treatments. In particular, the MFT300-j showed no significant change in friction angle, whereas a decrease in cohesion was observed. In contrast, the MFT600-j showed a more significant change in the friction angle than in cohesion. We hypothesize that most of the roots that made a structural contribution to the soil were already burned after MFT300-j. In contrast, higher temperatures are required to appreciate changes in soil friction angle. The decrease in soil friction angle for the MFT600-j samples may be due to several factors. First, when burning at 600 °C, the grain size distribution curves changed, exhibiting higher silt contents. According to Lim et al. [81], the change in grain shape and roughness of the soil particles might have been reflected in a change in their interconnection and consequently in the friction angle.
With reference to the SWRC of the UB-6 sample, the results of the suction-controlled oedometer tests showed for low matric suction levels i) a decrease in SWR capacity for the MFT600-11 sample; ii) no significant differences for the B1-5 sample; iii) an increase in SWR capacity for the B3-6 sample. The largest differences between the SWRCs of the MFT600-11 and those of the thermally untreated soil samples were found at the lowest suction levels (0 to 7 kPa). This is consistent with Stoof [40], who found the most significant effects of combustion and heating at low suction levels between 0 and 10 kPa. When considering the SWRC of the MFT600-11 sample, a lower available SWR capacity was observed at low matric suction levels compared to the thermal-untreated soil samples. Indeed, the MFT600-11 sample exhibited a loss of weight due primarily to the burning of OM and roots, resulting in increased soil compaction. Organic matter increases the ability of soil to hold water [82]. Compaction increases bulk density and decreases total pore volume, which in turn decreases available water holding capacity [83]. The opposite was observed for the thermal-untreated soil samples, which were characterized by lower Gs, higher porosity, higher OM and root content, and consequently higher available water capacity compared to the MFT600-11 sample. Our results on the B1-5 and B3-6 samples can be explained by the presence of fire residues formed during the fire (and then distributed due to rainfall and wind). The B3-6 sample exhibited higher water retention capacity than B1-5, which is likely due to both the infiltration effect of fire residues by rain and wind [40] and the regeneration of roots. Finally, we found that the SWRC of MFT600-11 is significantly different from those of the thermally untreated soils, as it exhibited a bimodal trend. Several literature studies [84,85,86] reported that the bimodal behavior of SWRC is due to the presence of a bimodal pore size distribution (PSD). This configuration is typical of micro-pore and macro-pore systems consisting of intra-aggregates (within particle aggregates) and inter-aggregate pores (between particle aggregates). Ferlisi and Foresta [87] investigated the role of two porosity systems of natural pyroclastic soils on the trend of SWRCs (e.g., macro-and micro-porosity). For the tested soil, the authors found the SWRCs with a bimodal trend, which emphasizes that the microporosity of pyroclastic soil is related to the existence of particle aggregates rather than the pores on the boundary and within the single particles.

6. Conclusions

Wildfires can increase runoff and lead to flooding and erosion due to the loss of vegetation cover and alteration of soil geotechnical properties [88]. The importance of vegetation cover in controlling water erosion and reducing the risk of mudslides and flash floods following fires is well recognized [9]. In the short term, vegetation removal by fires increases the raindrop impact on bare ground and reduces the storage of precipitation in tree canopies, increasing the amount of effective rainfall. Burned watersheds are, therefore, at increased hydrologic risk and respond more quickly to rainfall than unburned areas [8,40]. In addition, burned plant roots lead to a decrease in soil cohesion. As a result, soil failure can easily occur. Furthermore, our findings indicate that the MFT600 soil is characterized by a lower SWR capacity than the other tested samples, leading to a possible increase in overland runoff. Indeed, SWR capacity determines the rate of water flow through the soil and affects the soil vulnerability to saturated overland flow. Therefore, it is an important parameter in process-based hydrologic and erosion models [89]. Precipitation can be used more optimally by soils with high retention because more water can be stored until it is either used by plants, evaporated, percolated into deeper layers, or lost by saturated overland flow. It should be noted, however, that at low matric suction levels, the effect of fire residues on SWR is like that of the soil-root systems (i.e., increasing volumetric water content). During the field investigations, we found live roots only in the UB-j and B3-j samples, whereas the B1-j samples were mainly characterized by partially burned fire residues (e.g., ash, charcoal) and burned roots. Although the B1-j samples exhibited similar water retention as the UB-j samples, the presence of burned roots and ash suggests that overland flow is more likely to be generated for the B1-j samples. Indeed, studies in the literature reported that fire residues lead to the clogging of soil pores [40,54]. The B3-j samples, on the other hand, were characterized by roots (whose cohesive contribution was not recovered), OM, and fire residues that have been infiltrated by erosive processes.
Overall, the results of the laboratory tests seem to confirm the moderate to low burn severity of the 20 September 2019 wildfire in the Siano area, as indicated by both the field surveys and the analysis of the remote sensing data. The moderate to low burn severity of the Siano fire is most evident in the reduced shear strength of the burned (B1-j) samples, which did not reach the values of the MFT300-j and MFT600-j samples. These shreds of evidence suggest that the fire did not result in immediate and complete combustion of the subsurface soil-root systems. Further aspects to be analyzed include the effects of fire on the aboveground soil-root systems and the time required for burned soils to revegetate and then restore their natural contribution to slope stability after wildfires.
Bearing in mind the increasing wildfire occurrence associated with climate change, further geotechnical research should be devoted to filling the gap of (often controversial) information on the effects of fire on the hydromechanical properties of pyroclastic soils. However, the results presented for the study area, although in need of additional deepening, may provide a starting point for stability analyses that pursue a cascading assessment of multiple hazards (wildfire and erosion/landslides) on several natural slopes in similar geoenvironmental contexts of the Campania region.

Author Contributions

Conceptualization, D.P., L.I. and V.F.; investigation, L.I.; methodology, D.P., L.I. and V.F.; supervision, D.P. and V.F.; writing—original draft, L.I.; writing—review and editing, D.P. and V.F. All authors have read and agreed to the published version of the manuscript.

Funding

This research received no external funding.

Data Availability Statement

The data presented in this study are available on request from the corresponding author.

Acknowledgments

The authors wish to thank Albino Di Filippo for his contribution to laboratory tests.

Conflicts of Interest

The authors declare no conflict of interest.

References

  1. Spano, D.; Camia, A.; Bacciu, V.; Masala, F.; Duguy, B.; Trigo, R.; Sousa, P.; Venäläinen, A.; Mouillot, F.; Curt, T.; et al. Recent trends in forest fires in Mediterranean areas and associated changes in fire regimes. In Forest Fires Under Climate, Social and Economic Changes in Europe, the Mediterranean and Other Fire-Affected Areas of the World: FUME: Lesson Learned and Outlook; Moreno, J.M., Arianoutsou, M., González-Cabán, A., Mouillot, F., Oechel, W.C., Spano, D., Thonicke, K., Vallejo, V.R., Vélez, R., Eds.; Calyptra Pty: Adelaïde, Australia, 2014; pp. 6–7. [Google Scholar]
  2. Williams, A.P.; Abatzoglou, J.T.; Gershunov, A.; Guzman-Morales, J.; Bishop, D.A.; Balch, J.K.; Lettenmaier, D.P. Observed Impacts of Anthropogenic Climate Change on Wildfire in California. Earth’s Future 2019, 7, 892–910. [Google Scholar] [CrossRef] [Green Version]
  3. Fonseca, M.G.; Alves, L.M.; Aguiar, A.P.D.; Arai, E.; Anderson, L.O.; Rosan, T.M.; Shimabukuro, Y.E.; De Aragão, L.E.O.E.C. Effects of climate and land-use change scenarios on fire probability during the 21st century in the Brazilian Amazon. Glob. Chang. Biol. 2019, 25, 2931–2946. [Google Scholar] [CrossRef] [PubMed]
  4. Nolan, R.H.; Boer, M.M.; Collins, L.; Resco de Dios, V.; Clarke, H.; Jenkins, M.; Kenny, B.; Bradstock, R.A. Causes and consequences of eastern Australia’s 2019–20 season of mega-fires. Glob. Chang. Biol. 2020, 26, 1039–1041. [Google Scholar] [CrossRef] [PubMed] [Green Version]
  5. Doerr, S.H.; Shakesby, R.A.; Walsh, R.P.D. Soil water repellency: Its causes, characteristics and hydro-geomorphological significance. Earth-Sci. Rev. 2000, 51, 33–65. [Google Scholar] [CrossRef]
  6. Robichaud, P.R.; Beyers, J.L.; Neary, D.G. Evaluating the Effectiveness of Postfire Rehabilitation Treatments; Gen. Tech. Rep. RMRS-GTR-63; U.S. Department of Agriculture, Forest Service, Rocky Mountain Research Station: Fort Collins, CO, USA, 2000; 85p. [Google Scholar]
  7. Neary, D.G. Post-wildland fire desertification: Can rehabilitation treatments make a difference? Fire Ecol. 2009, 5, 129–144. [Google Scholar] [CrossRef]
  8. Cannon, S.H.; Kirkham, R.M.; Parise, M. Wildfire-related debris-flow initiation processes, Storm King Mountain, Colorado. Geomorphology 2001, 39, 171–188. [Google Scholar] [CrossRef]
  9. Rengers, F.K.; McGuire, L.A.; Oakley, N.S.; Kean, J.W.; Staley, D.M.; Tang, H. Landslides after wildfire: Initiation, magnitude, and mobility. Landslides 2020, 17, 2631–2641. [Google Scholar] [CrossRef]
  10. Bordoloi, S.; Ng, C.W.W. The effects of vegetation traits and their stability functions in bio-engineered slopes: A perspective review. Eng. Geol. 2020, 275, 105742. [Google Scholar] [CrossRef]
  11. Flannigan, M.D.; Krawchuk, M.A.; De Groot, W.J.; Wotton, B.M.; Gowman, L.M. Implications of changing climate for global Wildland fire. Int. J. Wildland Fire 2009, 18, 483–507. [Google Scholar] [CrossRef]
  12. Turco, M.; Llasat, M.-C.; Von Hardenberg, J.; Provenzale, A. Climate change impacts on wildfires in a Mediterranean environment. Clim. Chang. 2014, 125, 369–380. [Google Scholar] [CrossRef]
  13. Mukherjee, S.; Aadhar, S.; Stone, D.; Mishra, V. Increase in extreme precipitation events under anthropogenic warming in India. Weather. Clim. Extrem. 2018, 20, 45–53. [Google Scholar] [CrossRef]
  14. Haile, G.G.; Tang, Q.; Hosseini-Moghari, S.; Liu, X.; Gebremicael, T.G.; Leng, G.; Kebede, A.; Xu, X.; Yun, X. Projected impacts of climate change on drought patterns over East Africa. Earth’s Future 2020, 8, e2020EF001502. [Google Scholar] [CrossRef]
  15. Halofsky, J.E.; Peterson, D.L.; Harvey, B.J. Changing wildfire, changing forests: The effects of climate change on fire regimes and vegetation in the Pacific Northwest, USA. Fire Ecol. 2020, 16, 4. [Google Scholar] [CrossRef] [Green Version]
  16. San-Miguel-Ayanz, J.; Durrant, T.; Boca, R.; Libertà, G.; Branco, A.; de Rigo, D.; Ferrari, D.; Maianti, P.; Artes, T.; Costa, H.; et al. Forest Fires in Europe, Middle East and North Africa 2018; Publications Office of the European Union: Luxembourg, 2019. [Google Scholar] [CrossRef]
  17. Cascini, L.; Cuomo, S.; Guida, D. Typical source areas of May 1998 flow-like mass movements in the Campania region, Southern Italy. Eng. Geol. 2008, 96, 107–125. [Google Scholar] [CrossRef]
  18. Esposito, G.; Matano, F.; Molisso, F.; Ruoppolo, G.; Di Benedetto, A.; Sacchi, M. Post-fire erosion response in a watershed mantled by volcaniclastic deposits, Sarno Mountains, Southern Italy. Catena 2017, 152, 227–241. [Google Scholar] [CrossRef] [Green Version]
  19. Cuomo, S.; Masi, E.B.; Tofani, V.; Moscariello, M.; Rossi, G.; Matano, F. Multiseasonal probabilistic slope stability analysis of a large area of unsaturated pyroclastic soils. Landslides 2021, 18, 1259–1274. [Google Scholar] [CrossRef]
  20. Keeley, J.E. Fire intensity, fire severity and burn severity: A brief review and suggested usage. Int. J. Wildland Fire 2009, 18, 116–126. [Google Scholar] [CrossRef]
  21. Sobrino, J.; Llorens, R.; Fernández, C.; Fernández-Alonso, J.M.; Vega, J.A. Relationship between Soil Burn Severity in Forest Fires Measured In Situ and through Spectral Indices of Remote Detection. Forests 2019, 10, 457. [Google Scholar] [CrossRef] [Green Version]
  22. Marcos, E.; Fernández-García, V.; Fernández-Manso, A.; Quintano, C.; Valbuena, L.; Tárrega, R.; Luis-Calabuig, E.; Calvo, L. Evaluation of Composite Burn Index and Land Surface Temperature for assessing soil burn severity in mediterranean fire-prone pine ecosystems. Forests 2018, 9, 494. [Google Scholar] [CrossRef] [Green Version]
  23. Key, C.H.; Benson, N.C. Landscape Assessment: Sampling and Analysis Methods: Firemon: Fire Effects Monitoring and Inventory System; General Technical Report RMRS-GTR-164-CD; USDA Forest Service, Rocky Mountain Research Station: Fort Collins, CO, USA, 2006. [Google Scholar]
  24. Ulery, A.L.; Graham, R.C. Forest Fire Effects on Soil Color and Texture. Soil Sci. Soc. Am. J. 1993, 57, 135–140. [Google Scholar] [CrossRef]
  25. Ketterings, Q.M.; Bigham, J.M. Soil Color as an Indicator of Slash-and-Burn Fire Severity and Soil Fertility in Sumatra, Indonesia. Soil Sci. Soc. Am. J. 2000, 64, 1826–1833. [Google Scholar] [CrossRef]
  26. Terefe, T.; Mariscal-Sancho, I.; Peregrina, F.; Espejo, R. Influence of heating on various properties of six Mediterranean soils. A laboratory study. Geoderma 2008, 143, 273–280. [Google Scholar] [CrossRef]
  27. Litton, C.M.; Santelices, R. Effect of wildfire on soil physical and chemical properties in a Nothofagus glauca forest, Chile. Rev. Chil. Hist. Natl. 2003, 76, 529–542. [Google Scholar] [CrossRef]
  28. Úbeda, X.; Outeiro, L.R. Physical and chemical effects of fire on soil. In Fire Effects on Soils and Restoration Strategies, 1st ed.; Cerdà, A., Robichaud, P.R., Eds.; CRC Press: Boca Raton, FL, USA, 2009; Volume 4, pp. 197–223. [Google Scholar]
  29. Hrelja, I.; Šestak, I.; Bogunović, I. Wildfire impacts on soil physical and chemical properties-A short review of recent studies. Agric. Conspec. Sci. 2020, 85, 293–301. [Google Scholar]
  30. Fernández-Raga, M.; Gutiérrez, E.G.; Keesstra, S.D.; Tárrega, R.; Nunes, J.P.; Marcos, E.; Rodrigo-Comino, J. Determining the potential impacts of fire and different land uses on splash erosion in the margins of drylands. J. Arid. Environ. 2021, 186, 104419. [Google Scholar] [CrossRef]
  31. Šestak, I.; Pereira, P.; Telak, L.; Perčin, A.; Hrelja, I.; Bogunović, I. Soil Chemical Properties and Fire Severity Assessment Using VNIR Proximal Spectroscopy in Fire-Affected Abandoned Orchard of Mediterranean Croatia. Agronomy 2022, 12, 129. [Google Scholar] [CrossRef]
  32. Schulze, D.G.; Nagel, J.L.; van Scoyoc, G.E.; Henderson, T.L.; Baumgardner, M.F.; Stott, D.E. Significance of organic matter in determining soil colors. In Soil Color; Bigham, J.M., Ciolkosz, E.J., Eds.; Soil Science Society of America, Special Publications: Madison, WI, USA, 1990; pp. 71–90. [Google Scholar] [CrossRef]
  33. Schwertmann, U. Relations between iron oxides, soil color, and soil formation. In Soil Color; Bigham, J.M., Ciolkosz, E.J., Eds.; Soil Science Society of America, Special Publications: Madison, WI, USA, 1990; pp. 51–69. [Google Scholar] [CrossRef]
  34. Eckmeier, E.; Mavris, C.; Krebs, R.; Pichler, B.; Egli, M. Black carbon contributes to organic matter in young soils in the Morteratsch proglacial area (Switzerland). Biogeosciences 2013, 10, 1265–1274. [Google Scholar] [CrossRef] [Green Version]
  35. Pereira, P.; Úbeda, X.; Martin, D.; Oliva, M.; Novara, A. Short-term spatio-temporal spring grassland fire effects on soil colour, organic matter and water repellency in Lithuania. Solid Earth Discuss. 2013, 5, 2119–2154. [Google Scholar] [CrossRef]
  36. Certini, G. Effects of fire on properties of forest soils: A review. Oecologia 2005, 143, 1–10. [Google Scholar] [CrossRef]
  37. Saha, M.V.; D’Odorico, P.; Scanlon, T.M. Albedo changes after fire as an explanation of fire-induced rainfall suppression. Geophys. Res. Lett. 2017, 44, 3916–3923. [Google Scholar] [CrossRef] [Green Version]
  38. Heydari, M.; Rostamy, A.; Najafi, F.; Dey, D.C. Effect of fire severity on physical and biochemical soil properties in Zagros oak (Quercus brantii Lindl.) forests in Iran. J. For. Res. 2017, 28, 95–104. [Google Scholar] [CrossRef]
  39. Zihms, S.G.; Switzer, C.; Karstunen, M.; Tarantino, A. Understanding the effects of high temperature processes on the engineering properties of soils. In Proceedings of the 18th International Conference on Soil Mechanics and Geotechnical Engineering, Paris, France, 2–6 September 2013; Volume 4, pp. 3427–3430. [Google Scholar]
  40. Stoof, C. Fire Effects on Soil and Hydrology. Ph.D. Thesis, Wageningen University, Wageningen, The Netherlands, 2015. [Google Scholar]
  41. DeBano, L.F.; Neary, D.G.; Ffolliott, P.F. Soil physical properties. In Wildland Fire in Ecosystems: Effects of Fire on Soil and Water; General Technical Report RMRS-GTR-42; Neary, D.G., Ryan, K.C., De Bano, L.F., Eds.; Department of Agriculture, Forest Service, Rocky Mountain Research Station: Ogden, UT, USA, 2005; Volume 4, pp. 29–52. [Google Scholar]
  42. Jiménez-Pinilla, P.; Mataix-Solera, J.; Arcenegui, V.; Delgado, R.; Martín-García, J.M.; Lozano, E.; Martínez-Zavala, L.; Jordán, A. Advances in the knowledge of how heating can affect aggregate stability in Mediterranean soils: A XDR and SEM-EDX approach. Catena 2016, 147, 315–324. [Google Scholar] [CrossRef]
  43. Thomaz, E.L. High fire temperature changes soil aggregate stability in slash-and-burn agricultural systems. Sci. Agric. 2017, 74, 157–162. [Google Scholar] [CrossRef] [Green Version]
  44. Jhariya, M.K.; Singh, L. Effect of fire severity on soil properties in a seasonally dry forest ecosystem of Central India. Int. J. Environ. Sci. Technol. 2021, 18, 3967–3978. [Google Scholar] [CrossRef]
  45. Michaletz, S.T.; Johnson, E.A. How forest fires kill trees: A review of the fundamental biophysical processes. Scand. J. For. Res. 2007, 22, 500–515. [Google Scholar] [CrossRef]
  46. Lei, M.; Cui, Y.; Ni, J.; Zhang, G.; Li, Y.; Wang, H.; Liu, D.; Yi, S.; Jin, W.; Zhou, L. Temporal evolution of the hydromechanical properties of soil-root systems in a forest fire in China. Sci. Total Environ. 2021, 809, 151165. [Google Scholar] [CrossRef]
  47. Vergani, C.; Werlen, M.; Conedera, M.; Cohen, D.; Schwarz, M. Investigation of root reinforcement decay after a forest fire in a Scots pine (Pinus sylvestris) protection forest. For. Ecol. Manag. 2017, 400, 339–352. [Google Scholar] [CrossRef]
  48. Debano, L.F. The role of fire and soil heating on water repellency in wildland environments: A review. J. Hydrol. 2000, 231, 195–206. [Google Scholar] [CrossRef]
  49. Movasat, M.; Tomac, I. Assessment of Physical Properties of Water-Repellent Soils. J. Geotech. Geoenviron. Eng. 2021, 147, 06021010. [Google Scholar] [CrossRef]
  50. Rasyid, B.; Oda, M.; Omae, H. Soil water retention and plant growth response on the soil affected by continuous organic matter and plastic mulch application. In IOP Conference Series: Earth and Environmental Science; IOP Publishing: Bristol, UK, 2018; Volume 157, p. 012008. [Google Scholar] [CrossRef]
  51. Silva, J.S.; Rego, F.C.; Mazzoleni, S. Soil water dynamics after fire in a Portuguese shrubland. Int. J. Wildland Fire 2006, 15, 99–111. [Google Scholar] [CrossRef]
  52. Panagea, I.S.; Berti, A.; Čermak, P.; Diels, J.; Elsen, A.; Kusá, H.; Piccoli, I.; Poesen, J.; Stoate, C.; Tits, M.; et al. Soil Water Retention as Affected by Management Induced Changes of Soil Organic Carbon: Analysis of Long-Term Experiments in Europe. Land 2021, 10, 1362. [Google Scholar] [CrossRef]
  53. Khanna, P.K.; Raison, R.J.; Falkiner, R.A. Chemical properties of ash derived from Eucalyptus litter and its effects on forest soils. For. Ecol. Manag. 1994, 66, 107–125. [Google Scholar] [CrossRef]
  54. Woods, S.W.; Balfour, V.N. The effect of ash on runoff and erosion after a severe forest wildfire, Montana, USA. Int. J. Wildland Fire 2008, 17, 535–548. [Google Scholar] [CrossRef]
  55. Cerdà, A.; Doerr, S.H. The effect of ash and needle cover on surface runoff and erosion in the immediate post-fire period. Catena 2008, 74, 256–263. [Google Scholar] [CrossRef]
  56. Silva, V.; Abrantes, N.; Costa, R.; Keizer, J.J.; Gonçalves, F.; Pereira, J.L. Effects of ash-loaded post-fire runoff on the freshwater clam Corbicula fluminea. Ecol. Eng. 2016, 90, 180–189. [Google Scholar] [CrossRef]
  57. Stoof, C.R.; Gevaert, A.I.; Baver, C.; Hassanpour, B.; Morales, V.L.; Zhang, W.; Martin, D.; Giri, S.K.; Steenhuis, T.S. Can pore-clogging by ash explain post-fire runoff? Int. J. Wildland Fire 2016, 25, 294–305. [Google Scholar] [CrossRef]
  58. Mallik, A.U.; Gimingham, C.H.; Rahman, A.A. Ecological Effects of Heather Burning: I. Water Infiltration, Moisture Retention and Porosity of Surface Soil. J. Ecol. 1984, 72, 767–776. [Google Scholar] [CrossRef]
  59. ISPRA. IFFI Database. 2014. Available online: https://www.isprambiente.gov.it/it/progetti/cartella-progetti-in-corso/suolo-e-territorio-1/iffi-inventario-dei-fenomeni-franosi-in-italia. (accessed on 7 January 2021).
  60. Di Nocera, S.; Matano, F.; Pescatore, T.; Pinto, F.; Torre, M.L. Geological characteristics of the external sector of the Campania-Lucania Apennines in the CARG maps [Caratteri geologici del settore esterno dell’Appennino campano-lucano nei Fogli CARG]. Rend. Online Soc. Geol. Ital. 2011, 12, 39–43. [Google Scholar]
  61. Rolandi, G.; Petrosino, P.; Mc Geehin, J. The interplinian activity at Somma–Vesuvius in the last 3500 years. J. Volcanol. Geotherm. Res. 1998, 82, 19–52, ISSN 0377-0273. [Google Scholar] [CrossRef]
  62. WRB. World Reference Base for Soil Resources 2006 Reports; FAO Press: Rome, Italy, 2006. [Google Scholar]
  63. Bilotta, E.; Cascini, L.; Foresta, V.; Sorbino, G. Geotechnical characterisation of pyroclastic soils involved in huge flowslides. Geotech. Geol. Eng. 2005, 23, 365–402. [Google Scholar] [CrossRef]
  64. Picarelli, L.; Olivares, L.; Damiano, E.; Darban, R.; Santo, A. The effects of extreme precipitations on landslide hazard in the pyroclastic deposits of Campania Region: A review. Landslides 2020, 17, 2343–2358. [Google Scholar] [CrossRef]
  65. Foresta, V.; Capobianco, V.; Cascini, L. The influence of grass roots on the shear strength of pyroclastic soils. Can. Geotech. J. 2019, 57, 1320–1334. [Google Scholar] [CrossRef] [Green Version]
  66. ASTM D422-63(2007)e2; Standard Test Method for Particle-Size Analysis of Soils (Withdrawn 2016). ASTM International: West Conshohocken, PA, USA, 2007.
  67. ASTM D854-14; Standard Test Methods for Specific Gravity of Soil Solids by Water Pycnometer. ASTM International: West Conshohocken, PA, USA, 2014.
  68. ASTM D3080/D3080M-11; Standard Test Method for Direct Shear Test of Soils Under Consolidated Drained Conditions (Withdrawn 2020). ASTM International: West Conshohocken, PA, USA, 2011.
  69. Aversa, S.; Nicotera, M.V. A triaxial and oedometer apparatus for testing unsaturated soils. Geotech. Test. J. 2002, 25, 3–15. [Google Scholar] [CrossRef]
  70. Fredlund, D.J.; Rahardjo, H. Soil Mechanics for Unsaturated Soils, 1st ed.; John Wiley & Sons Inc.: New York, NY, USA, 1993. [Google Scholar]
  71. Hilf, J.W. An Investigation of Pore Water Pressure in Compacted Cohesive Soils; US Bureau of Reclamation: Denver, CO, USA, 1956; p. 654. [Google Scholar]
  72. van Genuchten, M.T. A Closed-form Equation for Predicting the Hydraulic Conductivity of Unsaturated Soils. Soil Sci. Soc. Am. J. 1980, 44, 892–898. [Google Scholar] [CrossRef] [Green Version]
  73. Durner, W. Hydraulic conductivity estimation for soils with heterogeneous pore structure. Water Resour. Res. 1994, 30, 211–223. [Google Scholar] [CrossRef]
  74. Abdullahi, M. Characteristics of wood ash/OPC concrete. Leonardo Electron. J. Pract. Technol. 2006, 8, 9–16. [Google Scholar]
  75. Fonseca, F.; Leite, M.; Figueiredo, T. Soil properties in burned and unburned Mediterranean shrublands of Montesinho Natural Park, Northeast Portugal. In Proceedings of the 3rd International Meeting of Fire Effects on Soil Properties, Guimarães, Portugal, 15–19 March 2011; pp. 144–147, ISBN 978-989-97214-0-1. [Google Scholar]
  76. Wu, T.H. Investigation on Landslides on Prince of Wales Island Alaska Geotech; Rpt No. 5 Dpt Civ Eng; The Ohio State University: Columbus, OH, USA, 1976. [Google Scholar]
  77. Waldron, L.J. The shear stress resistance of root permeated homogeneous and stratified soil. Soil Sci. Soc. Am. J. 1977, 41, 843–849. [Google Scholar] [CrossRef]
  78. Wu, T.H.; Mckinnel, W.P.; Swanton, D.N. Strength of tree roots and landslides on Prince of Wales Island, Alaska. Can. Geotech. J. 1979, 16, 19–33. [Google Scholar] [CrossRef]
  79. De Graff, J.V. A rationale for effective post-fire debris flow mitigation within forested terrain. Geoenvironmental Disasters 2018, 5, 7. [Google Scholar] [CrossRef]
  80. Gehring, E.; Conedera, M.; Maringer, J.; Giadrossich, F.; Guastini, E.; Schwarz, M. Shallow landslide disposition in burnt European beech (Fagus sylvatica L.) forests. Sci. Rep. 2019, 9, 8638. [Google Scholar] [CrossRef]
  81. Lim, M.S.; Wijeyesekera, D.C.; Zainorabidin, A.; Bakar, I. The Effects of Particle Morphology (Shape and Sizes) Characteristics on its Engineering Behaviour and Sustainable Engineering Performance of Sand. Int. J. Integr. Eng. 2012, 4, 27–37. [Google Scholar]
  82. Yang, F.; Zhang, G.L.; Yang, J.L.; Li, D.C.; Zhao, Y.G.; Liu, F.; Yang, R.M.; Yang, F. Organic matter controls of soil water retention in an alpine grassland and its significance for hydrological processes. J. Hydrol. 2014, 519, 3086–3093. [Google Scholar] [CrossRef]
  83. Smith, C.W.; Johnston, M.A.; Lorentz, S.A. The effect of soil compaction on the water retention characteristics of soils in forest plantations. South Afr. J. Plant Soil 2001, 18, 87–97. [Google Scholar] [CrossRef]
  84. Zhang, L.M.; Li, X. Microporosity Structure of Coarse Granular Soils. J. Geotech. Geoenvironmental Eng. 2010, 136, 1425–1436. [Google Scholar] [CrossRef]
  85. Burger, C.A.; Shackelford, C.D. Evaluating dual porosity of pelletized diatomaceous earth using bimodal soil-water characteristic curve functions. Can. Geotech. J. 2001, 38, 53–66. [Google Scholar] [CrossRef]
  86. Tarantino, A. Unsaturated soils: Compacted versus reconstituted states. In Proceedings of the 5th International Conference on Unsaturated Soil, Barcelona, Spain, 6–8 September 2010; Volume 1, pp. 113–136. [Google Scholar]
  87. Ferlisi, S.; Foresta, V. Influence of net stress on the soil-water retention curves of a natural pyroclastic soil. Geotech. Lett. 2017, 7, 339–346. [Google Scholar] [CrossRef]
  88. Shakesby, R.A.; Doerr, S.H. Wildfire as a hydrological and geomorphological agent. Earth-Sci. Rev. 2006, 74, 269–307. [Google Scholar] [CrossRef]
  89. Wesseling, J.G.; Stoof, C.R.; Ritsema, C.J.; Oostindie, K.; Dekker, L.W. The effect of soil texture and organic amendment on the hydrological behaviour of coarsetextured soils. Soil Use Manag. 2009, 25, 274–283. [Google Scholar] [CrossRef]
Figure 1. (a) Map of the test area (municipality of Siano, province of Salerno, southern Italy) showing (i) location of the study area (from left to right: Italy, Campania region, municipality of Siano), (ii) areas burned in the past (developed by Corpo Forestale dello Stato, CFS, 2000–2014), (iii) landslide areas (IFFI database, Italian Landslide Inventory, ISPRA, 2014) [59], (iv) the 2019 Siano fire area, (v) the sampling area. Photos of Mount “Le Porche” taken (b) during the fire on 20 September 2019 and (c) on 21 September 2019 when the fire was extinguished.
Geosciences 12 00198 g001
Figure 2. Workflow used to analyze the fire effects on the topsoil physical properties (CBI, composite burn index [20]; dNBR, delta normalized burn ratio (given by the difference between the pre-and post-fire normalized burn ratio); DS, direct shear; Suct, suction; GSDCs, grain size distribution curves; Gs, specific gravity; c, soil cohesion; φ’, soil friction angle; SWRCs, soil–water retention curves).
Geosciences 12 00198 g002
Figure 3. Sampling locations (UB-j, unburned samples; B1-j, burned samples collected on 30 September 2019; B2-j, burned samples collected on 18 October 2019; B3-j, burned samples collected on 16 February 2020).
Geosciences 12 00198 g003
Figure 4. Comparison between mapping and classification of the Siano fire using (a) Sentinel-2A, (b) Landsat-8 satellite data; (c) Percentage of the area affected by fire for each burn severity class.
Geosciences 12 00198 g004
Figure 5. (a) The GSDCs of B1-1, B1-2, and UB-3 samples after different muffle furnace treatments (MFTs); the blue dashed lines represent the envelope of all the thermal-untreated soil samples (No. 21); (b) sand and gravel percentages of the tested soil samples at different temperature stages.
Geosciences 12 00198 g005
Figure 6. The typical color of (a) UB-j; (b) MFT300-j; (c) MFT600-j soil samples.
Geosciences 12 00198 g006
Figure 7. (a) Gs of the tested soil samples; (b) soil weight vs. temperature (with standard deviation indication). “No.” is the number of tests performed.
Geosciences 12 00198 g007
Figure 8. Results of DS tests (σ’vc = 9 kPa) in terms of (a) vertical displacement-time (δv-t); (b) shear stress-horizontal displacement (τ-δh); (c) vertical displacement-horizontal displacement (δv-δh).
Geosciences 12 00198 g008
Figure 9. (a) Saturated shear strength envelopes; (b) average value of shear stress vs. temperature, with the indication of the relative percentage variations after MFT300 and MFT600 (Δ300 °C); (c) average values of effective friction angle (φ’) and total cohesion (c) vs. temperature (T) computed on thermal–untreated soils (UB-j, B1-j, B3-j referred to the T0, which indicates room temperature) and soils treated in the muffle furnace (MFT300-j, MFT600-j referred to the T = 300 °C and T = 600 °C).
Geosciences 12 00198 g009
Figure 10. Soil–water retention data of the investigated soil samples fitted by way of van Genuchten’s and Durner’s parametric functions for UB-6, B1-5, B3-6, and MFT600-11, respectively.
Geosciences 12 00198 g010
Table 1. Main physical properties and final stress conditions for the DS tested samples.
Sample 1Gs 2ni 3nc 4nf 5σ’vf 6τf 7
[-][-][-][-][kPa][kPa]
UB-12.480.690.690.7010.612.9
UB-2 2.530.590.580.5934.129.2
UB-3 2.600.660.660.6617.617.1
UB-4 2.570.620.620.6710.611.7
UB-5 a2.560.710.710.7210.612.5
B1-1 a2.410.660.660.6610.610.4
B1-2 2.450.640.630.6317.616.1
B1-3 2.300.670.660.6723.520.4
B1-4 2.420.670.660.6634.127.0
B3-1 a2.610.680.680.7010.610.1
B3-2 2.530.640.620.6323.520.0
B3-3 2.610.640.640.6317.615.4
B3-4 2.410.640.630.6234.126.7
B3-5 2.730.530.530.5210.610.4
MFT300-1 2.640.670.630.6710.68.3
MFT300-2 2.640.610.520.5217.614.2
MFT300-3 2.640.660.600.5834.125.1
MFT300-4 2.730.540.520.5110.68.7
MFT300-5 2.730.540.540.5317.614.2
MFT300-6 2.730.540.540.5234.125.8
MFT300-7 2.790.500.440.4610.69.2
MFT300-8 a2.790.500.490.4810.69.0
MFT300-9 2.790.500.500.4717.614.6
MFT300-10 2.660.530.530.5317.613.8
MFT300-11 2.660.530.530.5234.125.0
MFT600-1 2.720.530.530.521.21.7
MFT600-2 2.720.530.490.4910.68.3
MFT600-3 2.720.530.490.4817.612.1
MFT600-4 2.720.53--23.515.8
MFT600-5 2.720.530.480.4734.122.9
MFT600-6 a2.800.530.520.5210.67.9
MFT600-7 2.800.530.510.5117.612.9
MFT600-8 2.680.520.510.5110.67.9
MFT600-9 2.680.520.500.5117.613.3
MFT600-10 2.680.520.520.5134.121.3
1 soil sample; 2 specific gravity; 3 value of porosity before the consolidation stage; 4 value of porosity at the end of the consolidation stage; 5 value of porosity at the end of the shear stage; 6 vertical stress at failure; 7 shear stress at failure; a test performed with σ’vc = 9 kPa and represented in Figure 8.
Table 2. The main properties of the soil specimens tested in the suction-controlled oedometer.
SampleD 1H0 2H1 3V1 4Gs 5n0 6S7r,0S8r,1n9fS10r,f
[cm][cm][cm][cm3][-][-][-][-][-][-]
UB-65.602.002.0049.262.500.690.401.000.690.26
B1-52.0049.262.380.690.610.680.32
B3-62.0049.262.540.700.290.700.31
MFT600-111.6039.412.790.690.360.620.39
1 specimen diameter; 2 pre-saturation specimen height; 3 post-saturation specimen height; 4 specimen volume after saturation; 5 specimen specific gravity; 6 porosity value before saturation; 7 degree of saturation before saturation; 8 degree of saturation after saturation; 9 porosity value at the end of the test; 10 degree of saturation at the end of the test.
Table 3. Results of the suction-controlled oedometer tests.
ψ1∆V2wV3wH4V5θ6wn7S8r
[kPa][cm3][cm3][cm3][cm3][cm3/cm3][-][-]
UB-6
00.0033.672.0049.260.680.691.00
1−3.2130.452.0049.270.620.690.89
3−5.6424.812.0049.270.500.690.73
6−2.3522.462.0049.160.460.690.66
10−1.4321.032.0049.170.430.690.62
20−1.8219.202.0049.170.390.690.56
40−2.3216.891.9949.100.340.690.50
75−1.4215.471.9949.050.320.690.46
95−0.7114.761.9949.030.300.690.44
B1-5
00.0034.872.0049.260.690.691.00
1−3.2431.632.0049.270.640.690.94
3−5.5426.092.0049.220.530.690.77
6−3.3322.762.0049.140.460.690.68
10−1.7621.001.9948.980.430.680.63
20−2.4618.541.9948.980.380.680.55
40−2.0716.471.9949.030.340.680.49
75−1.9214.551.9949.020.300.680.43
95−0.7513.811.9949.020.280.680.41
B3-6
00.0038.412.0049.260.700.701.00
2−4.4533.962.0049.160.690.700.99
6−8.1425.811.9848.770.530.700.76
7−2.6623.151.9848.790.470.700.68
10−2.0521.101.9848.760.430.700.62
20−3.0218.081.9848.690.370.700.53
40−1.9916.101.9748.620.330.700.48
75−1.3614.741.9748.610.300.700.44
95−0.2614.481.9848.670.300.700.43
MFT600-11
00.0032.351.6039.410.620.621.00
1−14.3917.961.6039.400.460.620.74
2−0.1717.791.6039.400.450.620.73
5−0.6417.161.6039.410.440.620.71
10−0.1517.011.6039.430.430.620.70
20−0.8616.151.6039.390.410.620.66
40−2.0414.111.6039.390.360.620.58
70−3.1210.991.6039.390.280.620.45
95−1.509.491.6039.400.240.620.39
1 matric suction; 2 water volume variation; 3 water volume; 4 height after saturation; 5 total volume; 6 volumetric water content, which is calculated as the ratio between the specimen water volume (Vw) and its total volume (V); 7 specimen porosity value; 8 degree of saturation.
Publisher’s Note: MDPI stays neutral with regard to jurisdictional claims in published maps and institutional affiliations.

