Estimation of Soil Erosion in Nepal Using a RUSLE Modeling and Geospatial Tool


Central Department of Environmental Science, Tribhuvan University, Kirtipur 44618, Nepal
*
Author to whom correspondence should be addressed.
Geosciences 2019, 9(4), 147; https://0-doi-org.brum.beds.ac.uk/10.3390/geosciences9040147
Submission received: 29 January 2019
/
Revised: 21 March 2019
/
Accepted: 26 March 2019
/
Published: 29 March 2019
(This article belongs to the Special Issue Soil Hydrology and Erosion)
Abstract
:Soil erosion is a major issue, causing the loss of topsoil and fertility in agricultural land in mountainous terrain. Estimation of soil erosion in Nepal is essential because of its agriculture-dependent economy (contributing 36% to national GDP) and for preparing erosion control plans. The present study, for the first time, attempts to estimate the soil loss of Nepal through the application of the Revised Universal Soil Loss Equation (RUSLE) model. In addition, it analyzes the effect of Land Use and Land Cover (LULC) and slope ( exposition on soil erosion. Nation-wide mean annual soil loss of Nepal is estimated at 25 t ha−1 yr−1 with a total of 369 million tonnes (mT) of potential soil loss. Soil erosion based on the physiographic region of the country shows that the Middle Mountains, High Mountains, High Himal, Chure, and Terai have mean erosion rates of 38.0, 32.0, 28.0, 7.0, and 0.1 t ha−1 yr−1. The soil erosion rate by basins showed that the annual erosions of the Karnali, Gandaki, Koshi, and Mahakali River basins are 135, 96, 79, and 15 mT, respectively. The mean soil erosion rate was significantly high (34 t ha−1 yr−1) for steep slopes (β > 26.8%) and the low (3 t ha−1 yr−1) for gentle slopes (β < 5%). Based on LULC, the mean erosion rate for barren land was the highest (40 t ha−1 yr−1), followed by agricultural land (29 t ha−1 yr−1), shrubland (25 t ha−1 yr−1), grassland (23 t ha−1 yr−1), and forests (22 t ha−1 yr−1). The entire area had been categorized into 6 erosion classes based on the erosion severity, and 11% of the area was found to be under a very severe erosion risk (> 80 t ha−1 yr−1) that urgently required reducing the risk of erosion.
1. Introduction
Soil loss due to erosion is a global problem, especially affecting natural resources and agricultural production [1,2,3,4,5]. The mean rates of soil erosion throughout the world are estimated to be between 12 and 15 t ha−1 yr−1 [6], meaning that every year the land surface losses are about 0.90–0.95 mm of soil [7]. In the upland area, soil erosion is one of the most serious hazards [8,9]. Water erosion is by far the most serious cause of land degradation, with a global estimate of about 11 million km2 [10]. The loss of fertile soil in arable lands and the degradation in the quality of the soil resources are the main on-site consequences of soil erosion [11]. Siltation of water bodies is an important off-site impact of soil erosion [12]. One of the major factors causing destruction and sustainability of agriculture in the upland is soil erosion [13]. Soil erosion by rainfall and surface water flow is generally affected by five factors: Rainfall erosivity, soil erodibility, topography, surface coverage, and support practices [14]. In humid regions, soil erosion is of little concern in well-established forests and paddy fields, however bare lands such as logging forests, construction areas, and upland crop fields on slopes are exposed to a high risk of soil erosion. Studies have reported that soil erosion can be affected by the impact of climate change [15]. Climate change affects the rate of soil erosion directly through the change in precipitation and temperature pattern and eventually altering the runoff, biomass production, infiltration rate, soil moisture, and land use [15,16,17].
Soil erosion has a manifold effect on the environment and the economy [18]. Soil erosion removes fertile topsoil and transports it into the water bodies, reducing the already limited cultivable land and eventually causing the loss of food production. The transported sediments in water bodies will degrade water quality and cause eutrophication of freshwater bodies [3]. Accelerated soil erosion on one hand causes flood, drought and famine [19]. On the other hand, a large amount of sediment discharged into the river affects reservoir and dams, increases their costs of maintenance and in long run makes them unusable [20]. Understanding the status of soil erosion will help with the control of soil erosion and ecological restoration. Although various researchers have undertaken studies related to erosion issues [21,22,23], some attention with regards to erosion modeling is essential considering the inaccessibility of the mountainous areas.
Several models exist to predict the extent of water-induced erosion [24]. The models range from empirical (USLE/RUSLE,) to physical or process-based (MMF [25], EUROSEM [26], GUEST [27,28]; LISEM [29]; WEPP [30]) and varies considerably in ramification and data input. The Universal Soil Loss Equation (USLE) has been useful in predicting the mean rate of soil loss due to water erosion from agricultural lands [31]. In the early 1990s, the basic USLE was updated and computerized to create an erosion prediction tool called the Revised Universal Soil Loss Equation (RUSLE) [14]. The RUSLE represents how climate, soil, topography, and land use affect rill and interrill soil erosion caused by raindrop impacts. It has been extensively used to estimate soil erosion loss, to assess soil erosion risk, and to guide development and conservation plans in order to control erosion under different land-cover conditions, such as croplands, rangelands, and disturbed forest lands [32]. Most of the erosion models are based on the USLE (e.g., AGNPS [33], ANSWERS [34], and SWAT [35]), on the partition of the watershed in planes and channel elements (i.e., KINEROS [36], and EUROSEM [37]) or they are not intended for basin-scale use (i.e., CREAMS [38]). The MMF is considered to be a process-based model, but runs at an annual time step, like (R)USLE. It simulates three soil erosion processes, i.e., detachment by raindrop impact, detachment by runoff and immediate deposition. The WEPP model [39] is intended to replace the USLE family models and expand the capabilities for erosion prediction in a variety of landscapes and settings. EUROSEM [26] and GUEST [27,28] models have been developed to describe and quantify soil erosion processes and are particularly suitable for adaptation across a range of scales in the landscape. These models deal with the interception of rainfall by the plant cover; the volume and kinetic energy of the rainfall reaching the ground surface as direct throughfall and leaf drainage; the volume of streamflow; the volume of surface depression storage; the detachment of soil particles by raindrop impact and by runoff; sediment deposition and the transport capacity of the runoff. The LISEM model [29] is a physically based hydrological and soil erosion model that is completely incorporated in a raster GIS. It can simulate splash erosion and rill and inter-rill erosion. There are also other integrated models such as MODSIM, WRAP, Hydro-BEAM, SWAT and RiverWare that integrate soil erosion process occurring within a watershed [40]. The use of remote sensing and GIS techniques makes soil erosion estimation and its spatial distribution feasible with reasonable costs and better accuracy in larger areas [32,41]. A combination of remote sensing, GIS and RUSLE provides the potential to estimate soil erosion loss on a cell-by-cell basis [32].
Resource degradation in the Himalayan region is mainly caused by landslides, mudslides, the collapse of man-made terraces, soil loss from steep slopes, and the decline of forest/pasture areas [42]. About 45.5% of the land in Nepal suffers from water erosion, mostly through sheet and rill erosion [43]. Various studies conducted in Nepal show that the soil loss through surface erosion from agricultural land in the hills varies from less than 2 t ha−1 yr−1 to as high as 105 t ha−1 yr−1 [44]. Soil erosion using field plots in Likhu Khola River Watershed in 1992 and 1993 registered the following soil loss rates: 0.05 t ha−1 yr−1 under grassland and slightly degraded secondary forest, 11 t ha−1 yr−1 under no cultivation, and 2.7–8.2 t ha−1 yr−1 under rain-fed cultivation [45]. Other studies in the Middle Mountain region show that the soil loss rates under conventional tillage as the following: 14.39 t ha−1 yr−1 (Kavre Watershed; [46]), 3.01 t ha−1 yr−1 (Kulekhani Watershed; [47]), 36.67 t ha−1 yr−1 (Eastern Nepal; [48]), 25–40 t ha−1 yr−1 (open degraded forest) and 3–25 t ha−1 yr−1 (sloping terraces; Jhiku Khola Watershed; [43]). The most commonly used tolerable rate of soil erosion is 1 ta ha−1 yr−1 [49]. The mean annual erosion rate higher than this value can be considered as irreversible over 50–100 years [50].
This study uses the RUSLE model and a GIS to quantify and understand the spatial distribution of soil erosion in Nepal, however the model is applicable only in the prediction of sheet erosion and rill erosion. The model does not give an estimate of the rate of gully erosion. This is a first attempt in estimating the soil erosion using the RUSLE model through a GIS application for the entire country. For the first time, the study is producing an important result on the erosion and soil loss data by physiographic region and river basin. The study provides a baseline for the entirety of Nepal and contributes toward filling a data gap in a data lacking country.
2. Materials and Methods
2.1. Study Area
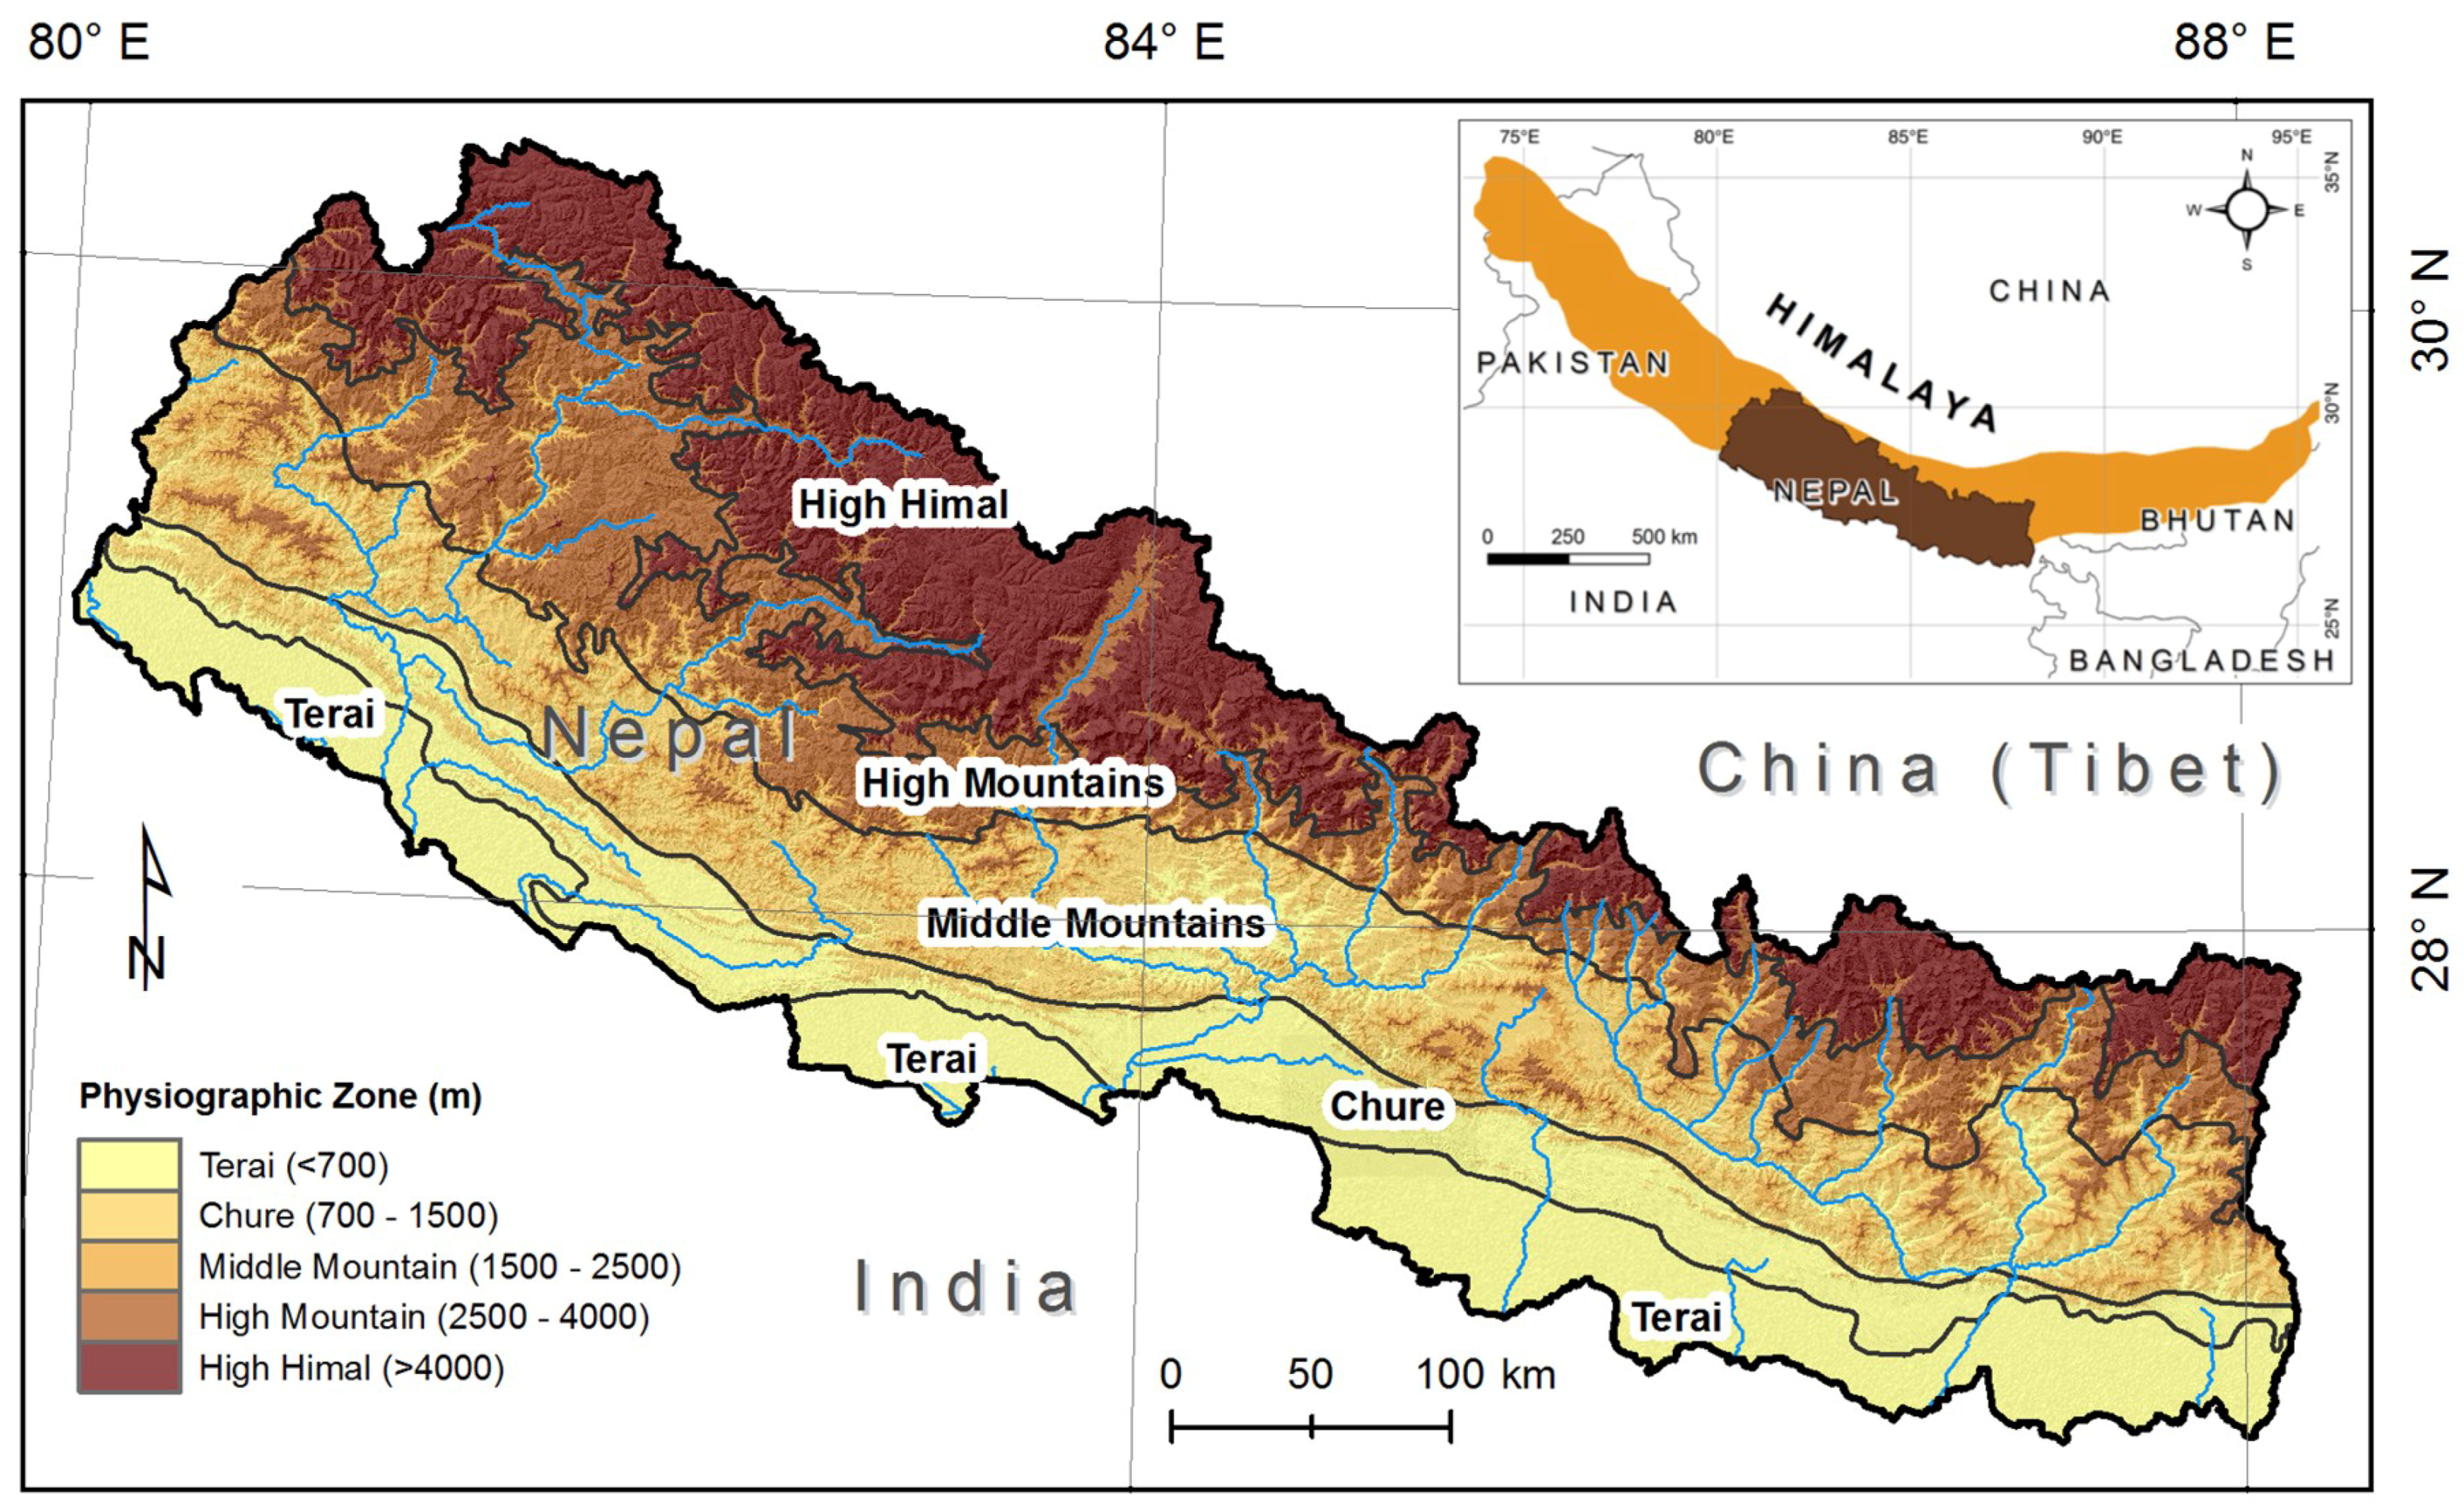
Nestled in central part of the Himalaya, Nepal extends from 26°22’ to 30°27’ N in latitude and 80°04’ to 88°12’ E in longitude (Figure 1). The country is approximately 885 km from east to west, and the north-south width varies from 130 to 260 km. Within this range, the altitudinal variation is from approximately 60 m above mean sea level in the southern plain (called Terai) to Mount Everest (8848 m) in the northeast. Out of 147,181 km2, the total area of the country, about 86% comprises of hilly and mountainous regions, with the remaining 14% as flatland. The country is drained by large rivers such as the Koshi, Gandaki, Karnali, and Mahakali, which originate in the southern Tibetan plateau and cut across the high Himalaya, making the deepest gorges in the world.
Rapid changes in altitude and aspect, along the latitude, have created a wide range of climatic conditions in Nepal [51]. As a consequence, within a span of less than 200 km Nepal encounters almost all types of climates, from subtropical to alpine/arctic. The temperature in Nepal varies mainly with topographic variations along south-north direction. Eighty percent of the precipitation in Nepal comes in the form of summer monsoon rain and winter rains are more common in the western hills [52]. As the occurrence of monsoon rains being dominant in the temporal distribution of precipitation, the season can be defined as monsoon (June to September), post-monsoon (October to November), winter (December to February), and pre-monsoon (March to May). The climate of Nepal is mainly characterized by altitude, topography, and seasonal atmospheric circulations [51].
2.2. Data Collection
The study used various spatial datasets acquired from different sources. The datasets and their respective sources are shown in Table 1.
2.3. Methods
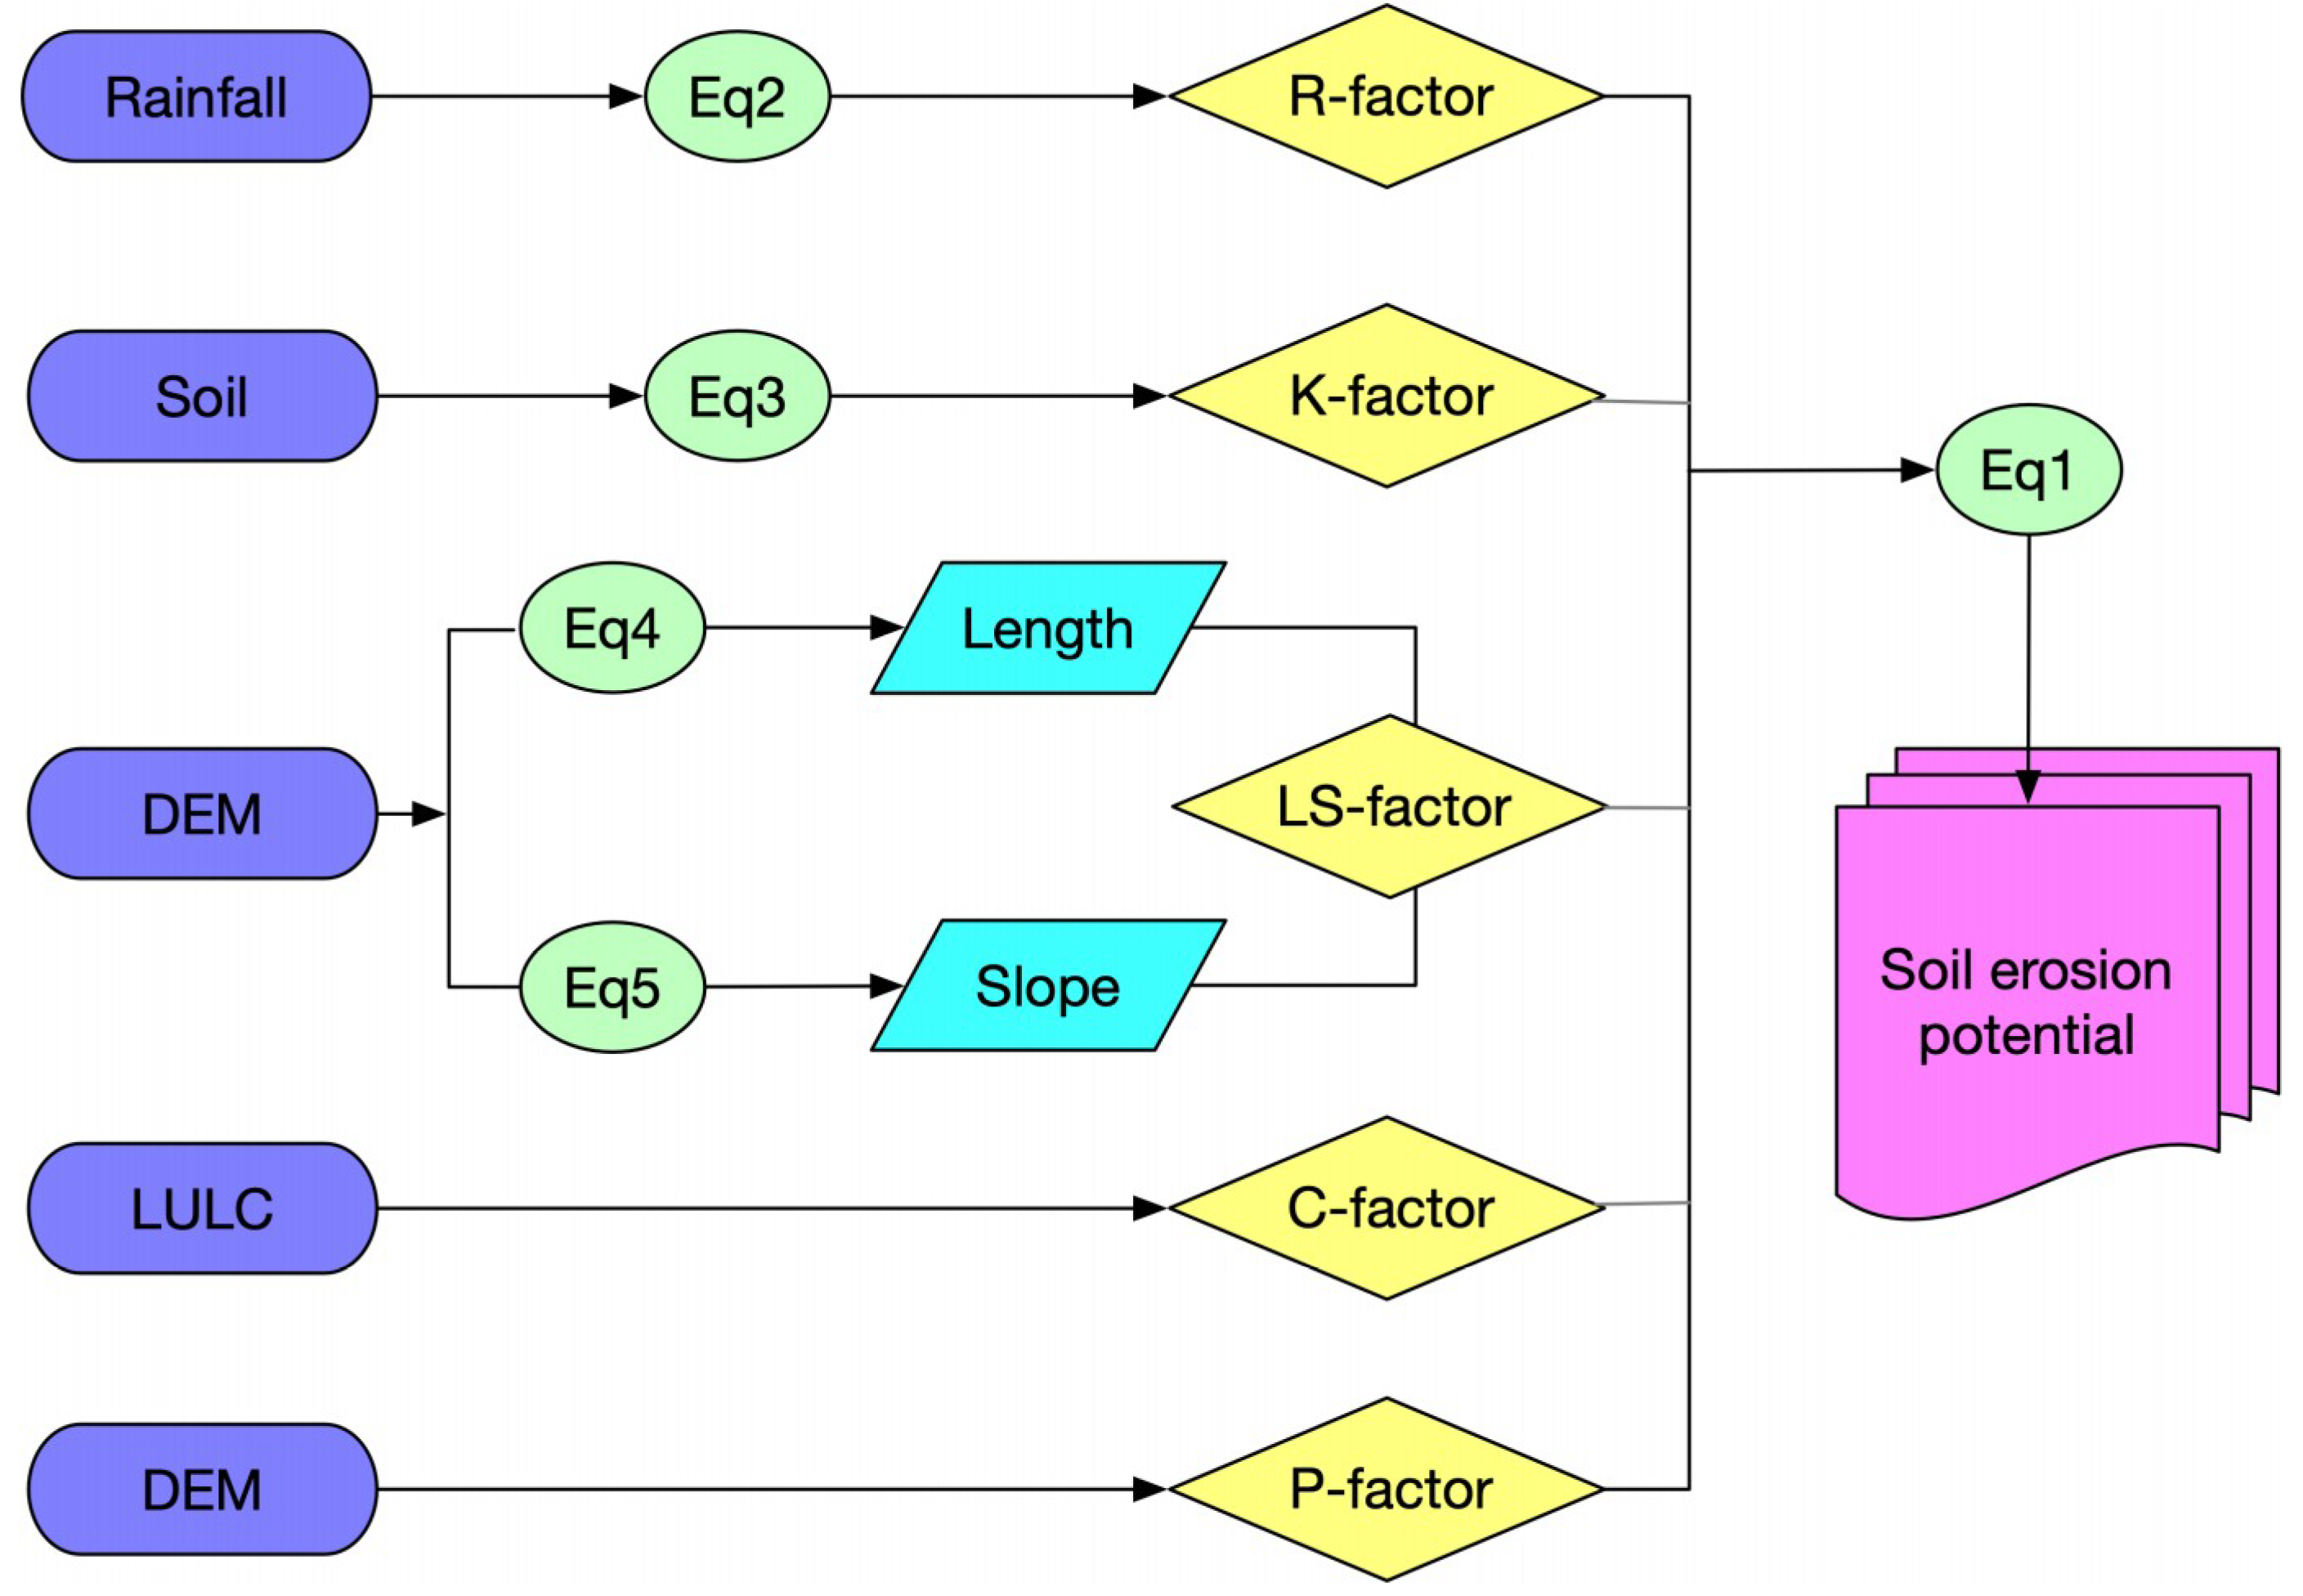
The RUSLE model was used in the GIS platform in this study ([14,53] Figure 2). The RUSLE was designed to compute the mean annual soil loss for ground slopes where flow convergence/divergence can be neglected, i.e., planar slopes, common in agricultural lands. The RUSLE is expressed by an equation,
where, A = soil loss (t ha−1 yr−1), R = rainfall erosivity factor (MJ mm ha−1 h−1, yr−1), K = soil erodibility factor (t h MJ−1 mm−1), LS = slope-length and slope steepness factor (dimensionless), C = land management factor (dimensionless), and P = conservation practice factor (dimensionless).
2.3.1. RUSLE Parameters Computation
(a) Rainfall Erosivity Factor (R)
The rainfall erosivity factor (R) describes the erosivity of rainfall at a particular location based on the rainfall amount and intensity, and reflects the effect of rainfall intensity on soil erosion. The rainfall erosivity used in the RUSLE must quantify an effect of raindrop impact and explain the amount and rate of runoff associate with rainfall [31] and its unit is expressed in MJ mm ha−1 h−1 yr−1. In this study, the rainfall map produced by the International Center for Integrated Mountain Development (ICIMOD) was used to generate a rainfall erosivity factor. The rainfall map represents mean annual precipitation over the country, produced from the ground meteorological stations. The equation integrated to generate the R-factor is given by reference [54].
where, R = Rainfall Erosivity Factor, P = Mean Annual Rainfall in mm
(b) Soil Erodibility Factor (K)
The soil erodibility factor (K) is a quantitative description of the inherent erodibility of a particular soil type; it is a measure of the susceptibility of soil particles to detachment and transport by rainfall and runoff. The main soil properties influencing the K factor are soil texture, organic matter, soil structure and permeability of the soil profile. For a particular soil, the soil erodibility factor is the rate of erosion per unit erosion index from a standard unit plot of 22.13 m long slope length with 9% of slope gradient [55]. It reflects the rate of soil loss per rainfall erosivity (R) index.
In the absence of soil structure and soil permeability value, as needed in original equation [31], the equation provided by reference [56] was used to estimate the soil erodibility of soil.
where,
where, SAN, SIL and CLA are % sand, silt and clay, respectively; C is the organic carbon content; and SN1 is sand content subtracted from 1 and divided by 100.
- = it gives a low soil erodibility factor for soil with coarse sand and a high value for soil with little sand content.
- Fsi-cl = it gives a low soil erodibility factor with high clay to silt ration
- Forgc = it is the factor that reduces soil erodibility for soil with high organic content.
- Fhisand= it is the factor that reduces soil erodibility for soil with extremely high sand content.
(c) Topographic Factor (LS)
The topographic factor or Slope Length and Steepness Factors (LS) was created from two sub-factors: a slope gradient factor (S) and a slope-length factor (L); both of which are determined from the Digital Elevation Model (DEM). Slope-length and gradient is the important parameter in the soil erosion modeling [25], in calculating the transport capacity of overland flow (Surface runoff).
The L represents the effect of slope length on erosion. The soil loss per unit area increases as the slope length increases [55]. The S represents the effect of slope steepness on erosion. Soil loss increases more rapidly with slope steepness than it does with slope length. The relationship of soil loss to terrain gradient is influenced by the vegetation coverage and the soil particle size. The LS factor represents erodibility due to combinations of slope length and steepness relative to a standard unit plot. It expresses the effect of topography, specifically hill slope length and steepness, on soil erosion. An increase in hill slope length and steepness results in an increase in the LS factor.
The input requirement for the creation of the topographic grid is a filled DEM. Filling a DEM can be described as identifying any sinks or cells that have a lower elevation value than the surrounding cells and giving them a higher elevation value. When the sinks are filled, the area is given a mean value, which is calculated using the value of the neighboring cells [57]. The slopes gradient and slope length factors were calculated from the DEM and combined to result in the topographical factor grid using the following relation [58].
where, = slope length factor, λ = slope length (m), m = slope-length exponent
where, F = Ratio of rill erosion to interrill erosion, β = slope angle (°)
In ArcGIS, L was calculated as,
For slope gradient factor,
S = Con((Tan(slope ∗ 0.01745) < 0.09),(10.8 ∗ Sin(slope ∗ 0.01745) + 0.03),(16.8 ∗ Sin(slope ∗ 0.01745) − 0.5)),
Final, LS = L ∗ S,
(d) Cover Management Factor (C)
The cover-management factor (C) is used to reflect the effect of cropping and other management practices on erosion rates. Vegetation cover is the second most important factor next to topography that controls soil erosion risk. The land cover intercepts rainfall, increases infiltration, and reduces rainfall energy. In areas where land uses other than cropping dominate, as in the Himalaya, the C factor is normally assigned based on a simple assessment of vegetation cover, rather than close analysis of agricultural cropping patterns. In this study, Land Use/Land Cover (LULC) produced by the ICIMOD was used for preparing a C-factor map. First, the raster map was converted to polygon and the attributes with same landuse type were merged in ArcGIS. From this, eight types of landuse were obtained (Table 2). For each landuse type, C values were assigned through reference [59]. The C factor ranges from 0 to approximately 1, where higher values indicate no cover effect and soil loss comparable to that from a tilled bare fallow, while lower C means a very strong cover effect resulting in no erosion [60].
(e) Support Practice Factor (P)
Support practice factor indicates the rate of soil loss according to the various cultivated lands. There are contours, cropping, and terrace as its methods and it is important factor that can control the erosion [61]. The P values range from 0 to 1, where the value 0 represents a very good anthropic erosion resistance facility and the value 1 indicates a non-anthropic resistance erosion facility (Table 3). In Nepal, farming practices in sloppy agriculture land occur through the construction of terraces that closely resembles the contour farmland, which is a mean of conservation farming. Thus, we consider the contour farmland as an agricultural support practice.
2.3.2. Potential Erosion Map
The input data were processed in ArcGIS and five factor maps: R, K, LS, C and P, were produced (Figure 3). These raster maps were integrated within the ArcGIS environment using the RUSLE relation to generate composite maps of the estimated erosion loss within the study area. Using a zonal statistics tool, we computed an area-weighted mean of the potential erosion rates for the physiographic regions and the basins of Nepal. Similarly, the erosion rates for slopes and LULC were generated to explore the relationship between slope and LULC on erosion. First, the slope map of Nepal was generated from DEM in ArcGIS and then reclassified into 5 classes [61]. The erosion values for each class were thus obtained using zonal statistics. The results are presented in the form of maps, tables and graphs.
3. Results
3.1. Factor Maps
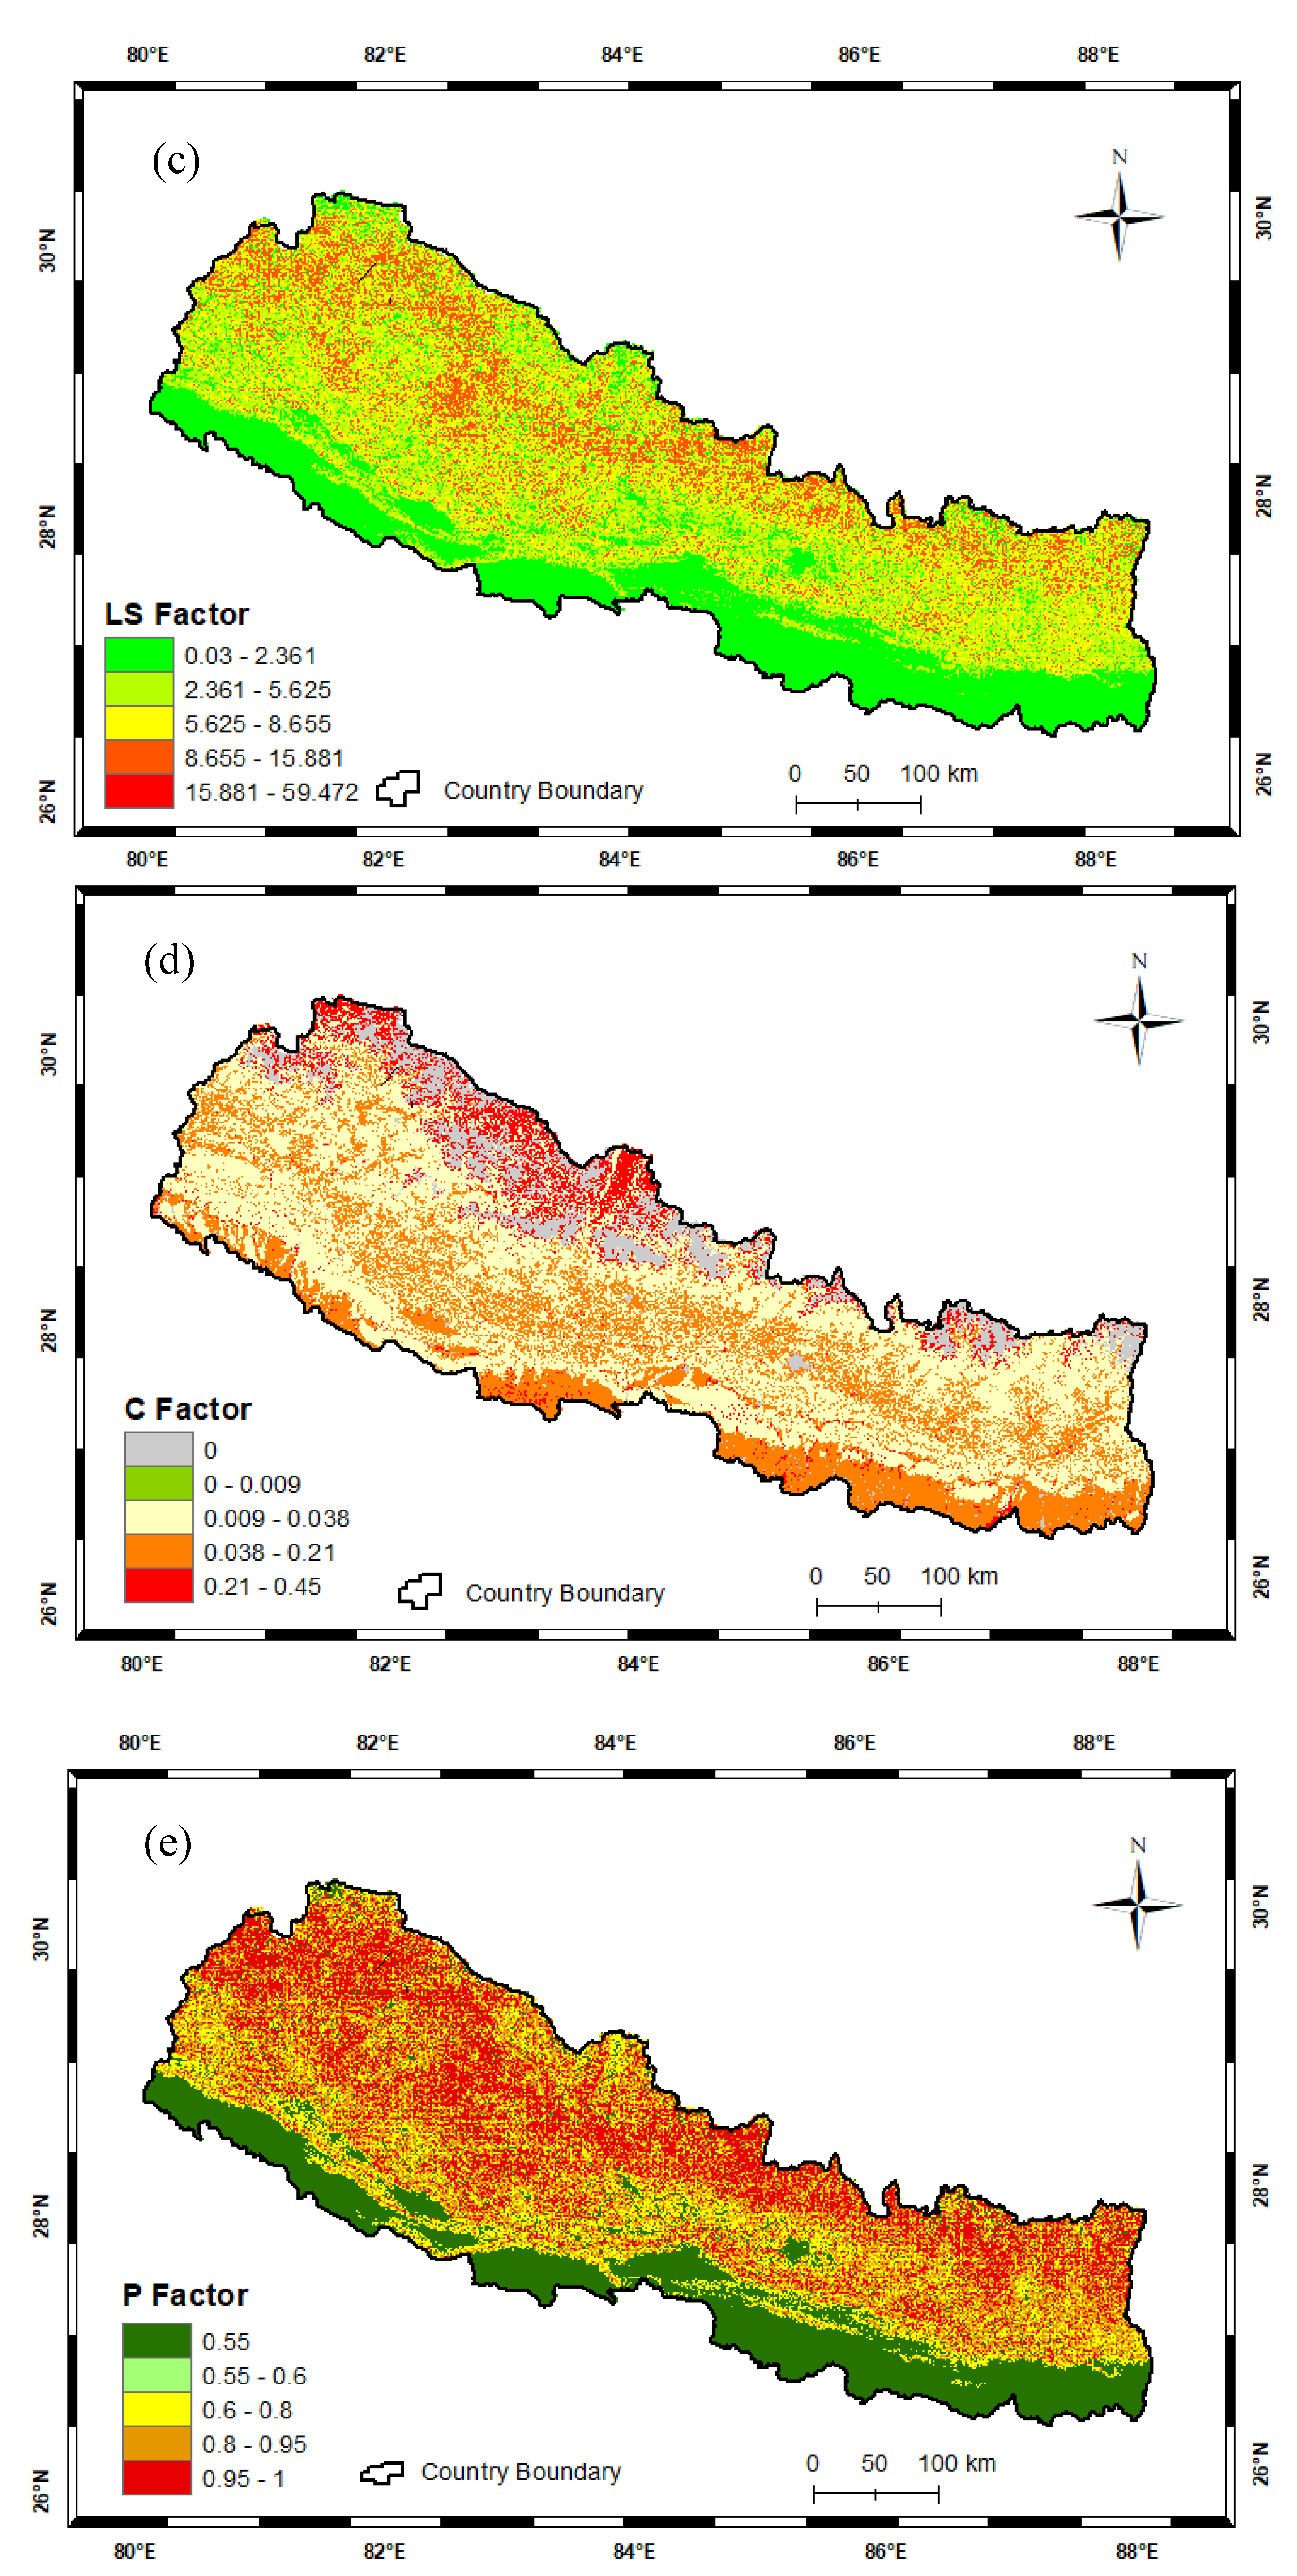
The results showed that the Rainfall Erosivity Factor (R) value ranges between 157 and 1981 MJ mm ha−1 h−1 yr−1 with the highest values being in the eastern part of the country and the lower values in the North-western part of the country (Figure 3a). Soil Erodibility Factor (K) value ranged from 0.014 to 0.023 (Figure 3b). The topographic Factor (LS) value for the entire area ranged from 2.5 to 59.5 (Figure 3c). The value of the Cover Management Factor (C) ranged between 0 and 0.45. The value indicates the percentage erosive capacity in comparison with bare fallow area. The highest value of 0.45 indicates that 45% of erosion occurs in the area in comparison with the bare fallow land (Figure 3d). The Support Practice Factor (P) value ranged from 0.55 to 1 where a higher value indicates there is no any support practice such that erosion is at its maximum due to the absence of any practice (Figure 3e).
3.2. Potential Soil Erosion Rates of Nepal
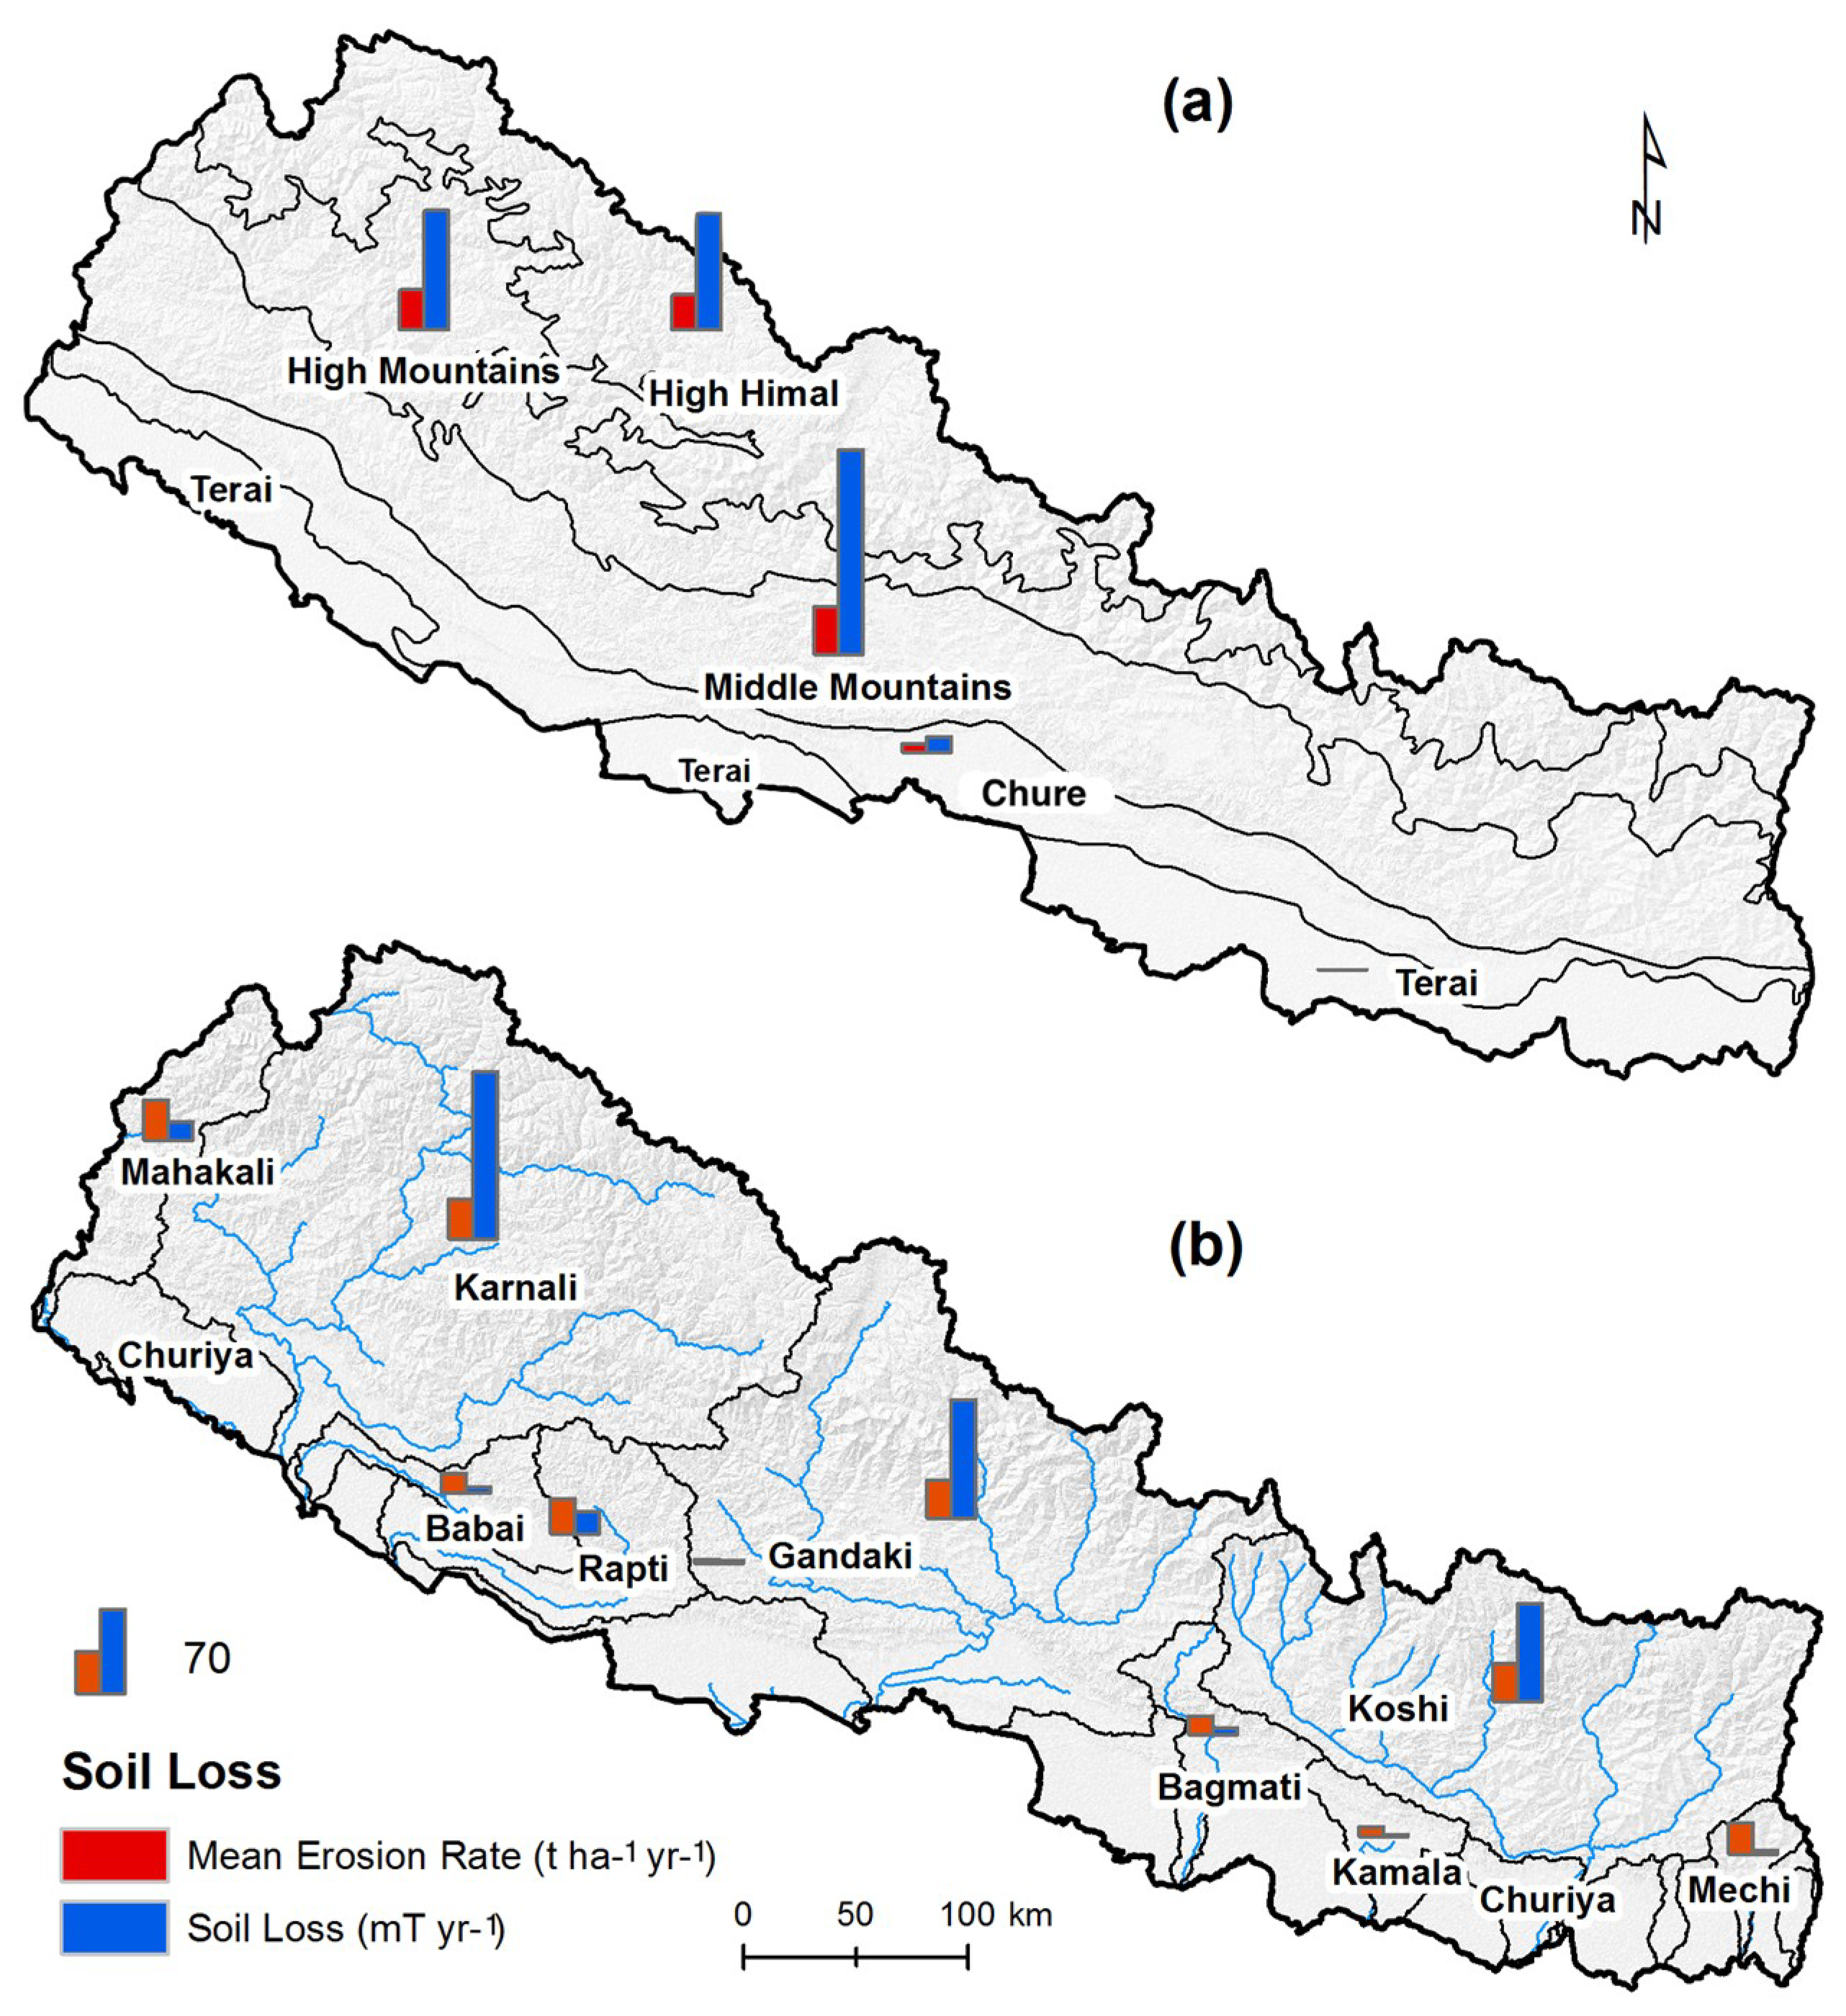
3.3. Soil Erosion by Physiographic Region
Nepal is divided into five regions on the basis of physiography, i.e., Terai, Chure, the Middle Mountains, the High Mountains and High Himal. The potential soil erosion rates for each region have been disaggregated by physiographic region and basin. Similarly, the highest rate of soil erosion is at the Middle Mountains with mean rate of 38.39 t ha−1 yr−1 followed by the High Mountains and High Himal. Terai has the lowest erosion rate (Figure 5a; Table 5).
3.4. Soil Erosion by the Major River Basins
Four major river basins (Koshi, Gandaki, Karnali, and Mahakali) drain across Nepal from North to South, originating from High Himalaya and draining out to the Ganges. Other basins originate in the Mahabharat and Chure mountain ranges. The erosion rates were disaggregated by the basins (Figure 5b; Table 6). The Mahakali River basin has the highest mean erosion rate followed by the Karnali, Koshi, and Gandaki River basins while the highest total soil erosion is observed in the Karnali River basin because of its large basin areas.
3.5. Classification by Severity and Conservation Priority
The soil erosion rate of Nepal classified into 6 erosion classes, indicating the conservation priority regions (Table 7) based on the erosion severity as classified by reference [62]. The areas with very severe erosion values have been recognized as 1st priority and so on. From the study, 11% of the areas need conservation strategies as they have very severe erosion rates.
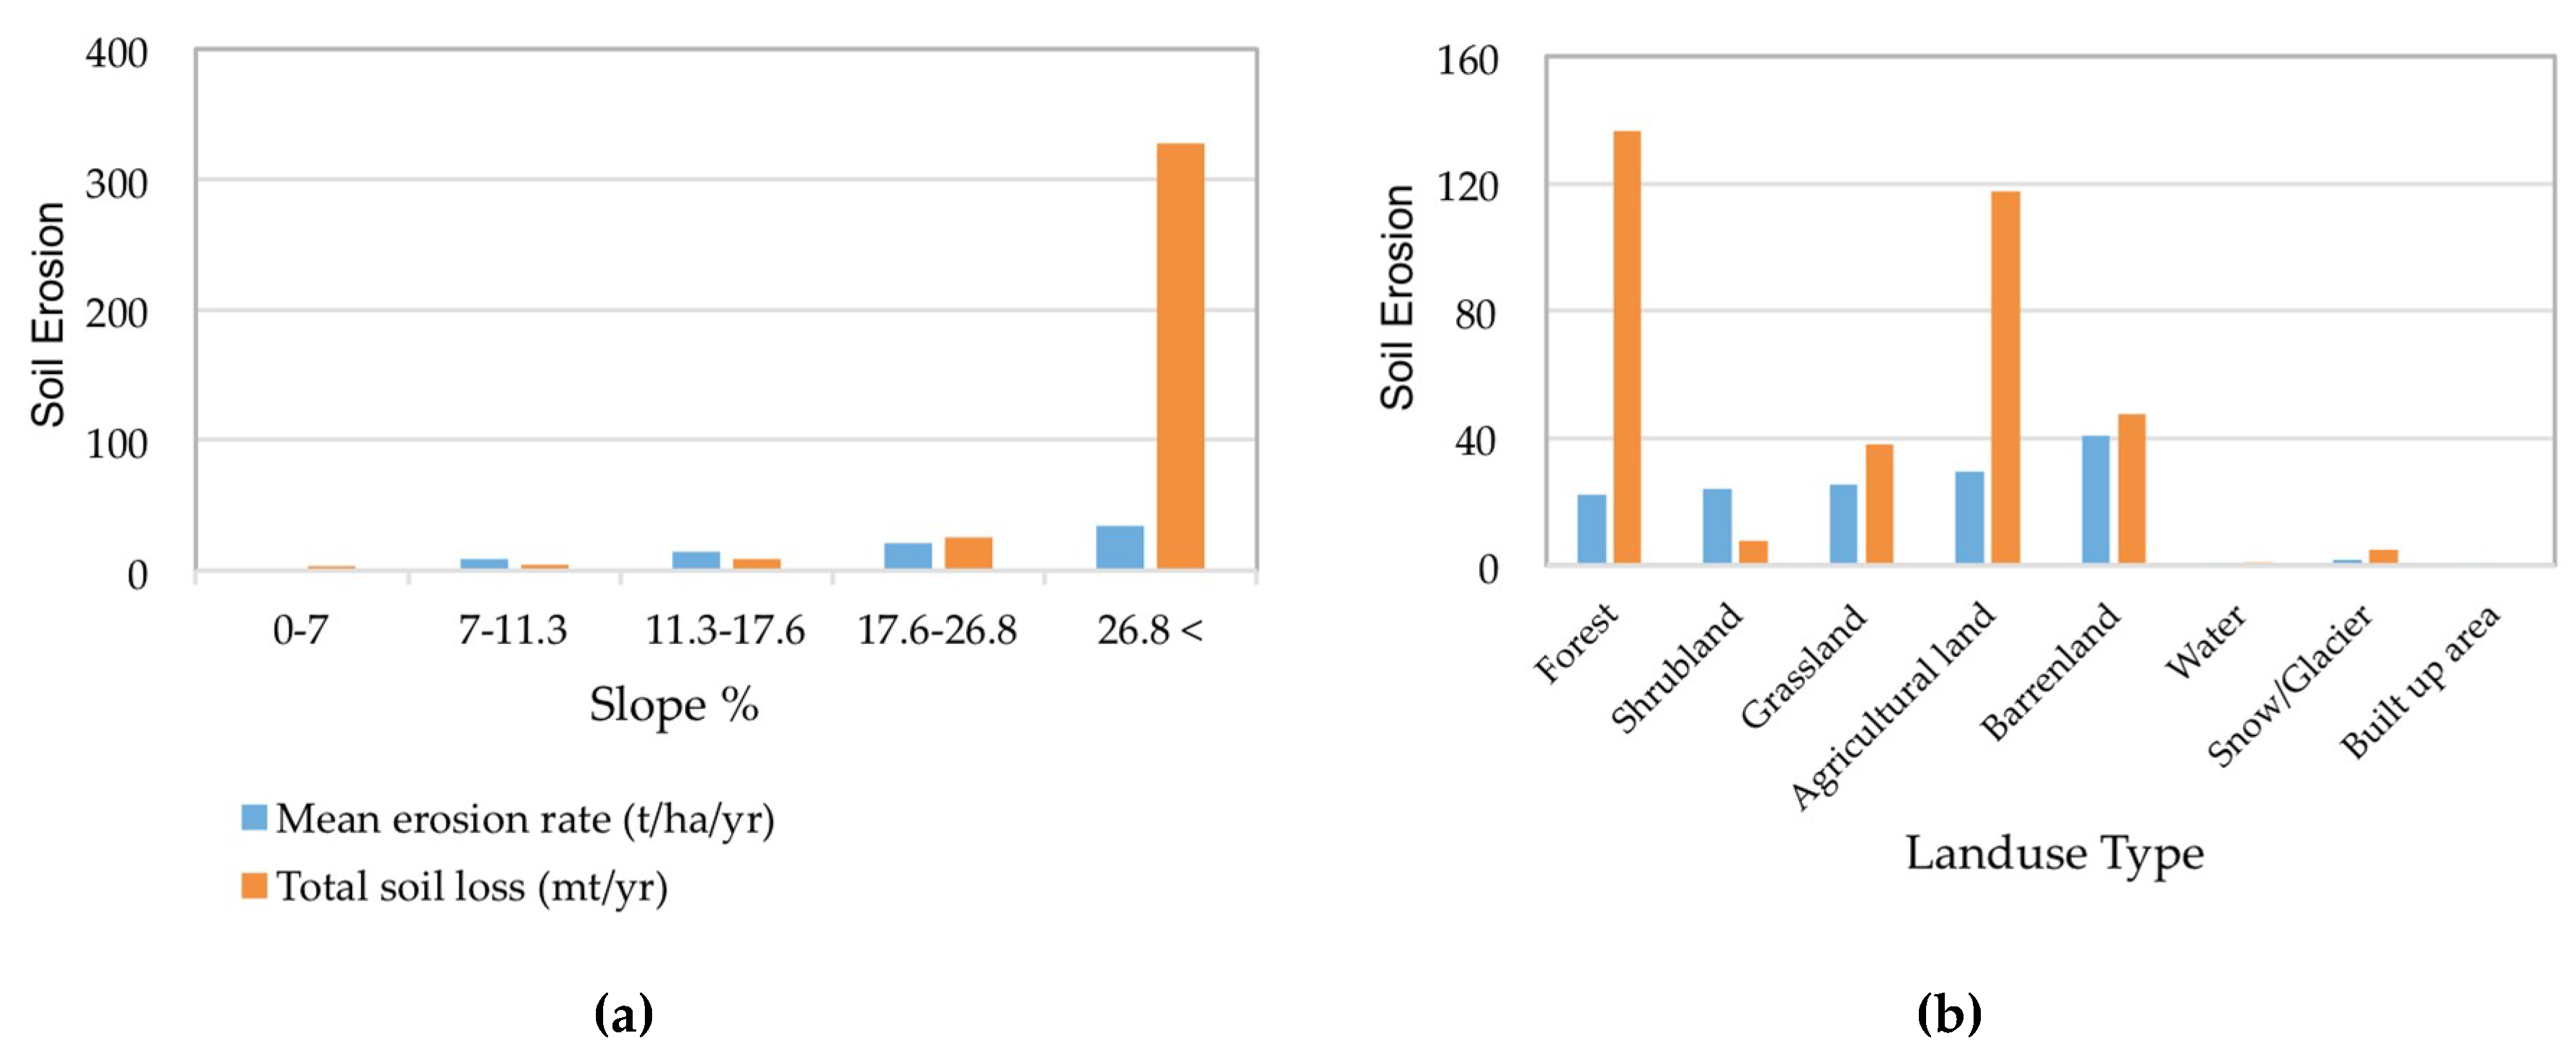
3.6. Soil Erosion by Slope
The soil erosion rates were about 34 t ha−1 yr−1 for steep slopes (β > 26.8%) and about 3 t ha−1 yr−1 for gentle slopes (β < 5%). A total of 328 mT yr−1 soil loss is estimated from the areas having slopes greater than 26.8% (Figure 6a).
3.7. Soil Erosion by Land Use and Land Cover
Soil erosion rate has been studied for eight types of land cover. The mean erosion rate for barren land was the highest followed by agriculture, shrubland, grassland and forests (Figure 6b).
4. Discussion
This study used a modeling approach–the RUSLE based method–to develop a detailed spatial assessment of the distribution of erosion risk across the entire country using remotely-sensed data and automated analysis of land cover and slope gradient. Though studies have been performed at watershed and regional scales in the past, this is the first time that such an approach has been used to assess erosion risk across an entire central Himalayan region, and the methodology still has certain limitations, but it provides a useful means of identifying priority areas to consider for interventions to reduce soil erosion. This method was adopted and used by similar other studies having similar geographic characteristics (e.g., references [63,64]). The R-factor, LS-factor, and all other factors should carefully be considered while assessing the uncertainties of the erosion model. We used an annual precipitation map to determine the R-factor through a regression equation due to lack of high temporal resolution data at such large spatial scales. The LS-factor may also include uncertainties in such high slopes. The maximum slope in the study area is also higher than 26°, which is thought to be the maximum slope in the original RUSLE formulations [65].
Results shows that Nepal is vulnerable to soil erosion hazards (25 t ha−1 yr−1) due to five major factors, a high annual precipitation, the soil characteristics, mainly texture and steep slopes, land covers and soil conservation practices along the slopes. The total soil erosion of the entirety of Nepal has been estimated to be 369 mT yr−1 varying from as low as 0 to 273 t ha−1 yr−1. This rate is higher than in most other parts of the world. The soil erosion rates in India ranges from 0.5–185 t ha−1 yr−1 [11]. The rate has been estimated to be 1–70 t ha−1 yr−1 for Ethiopia, 0.1–200 for the United Kingdom, 0.7–17.9 t ha−1 yr−1 for Europe [66], and 10.8–146 t ha−1 yr−1 for Africa [67]. However, the erosion rate in China and other mountainous regions is higher than in Nepal. The erosion rate in China is estimated to be 0.1–360 t ha−1 yr−1 [11]. The range of erosion rate in Nepal as suggested by this study is almost equal to that of Australia (0–276 t ha−1 yr−1) as estimated by reference [68]. The higher erosion rates in China and Australia indicate the vulnerability to erosion of the semi-arid and semi-humid areas of the world. The soil erosion rates in mountainous region, like Andes, are observed to be much higher than in the Nepalese Himalaya. The soil erosion rate in Columbian Andes ranges from 514.0–873.3 t ha−1 yr−1 in bare soil [69].
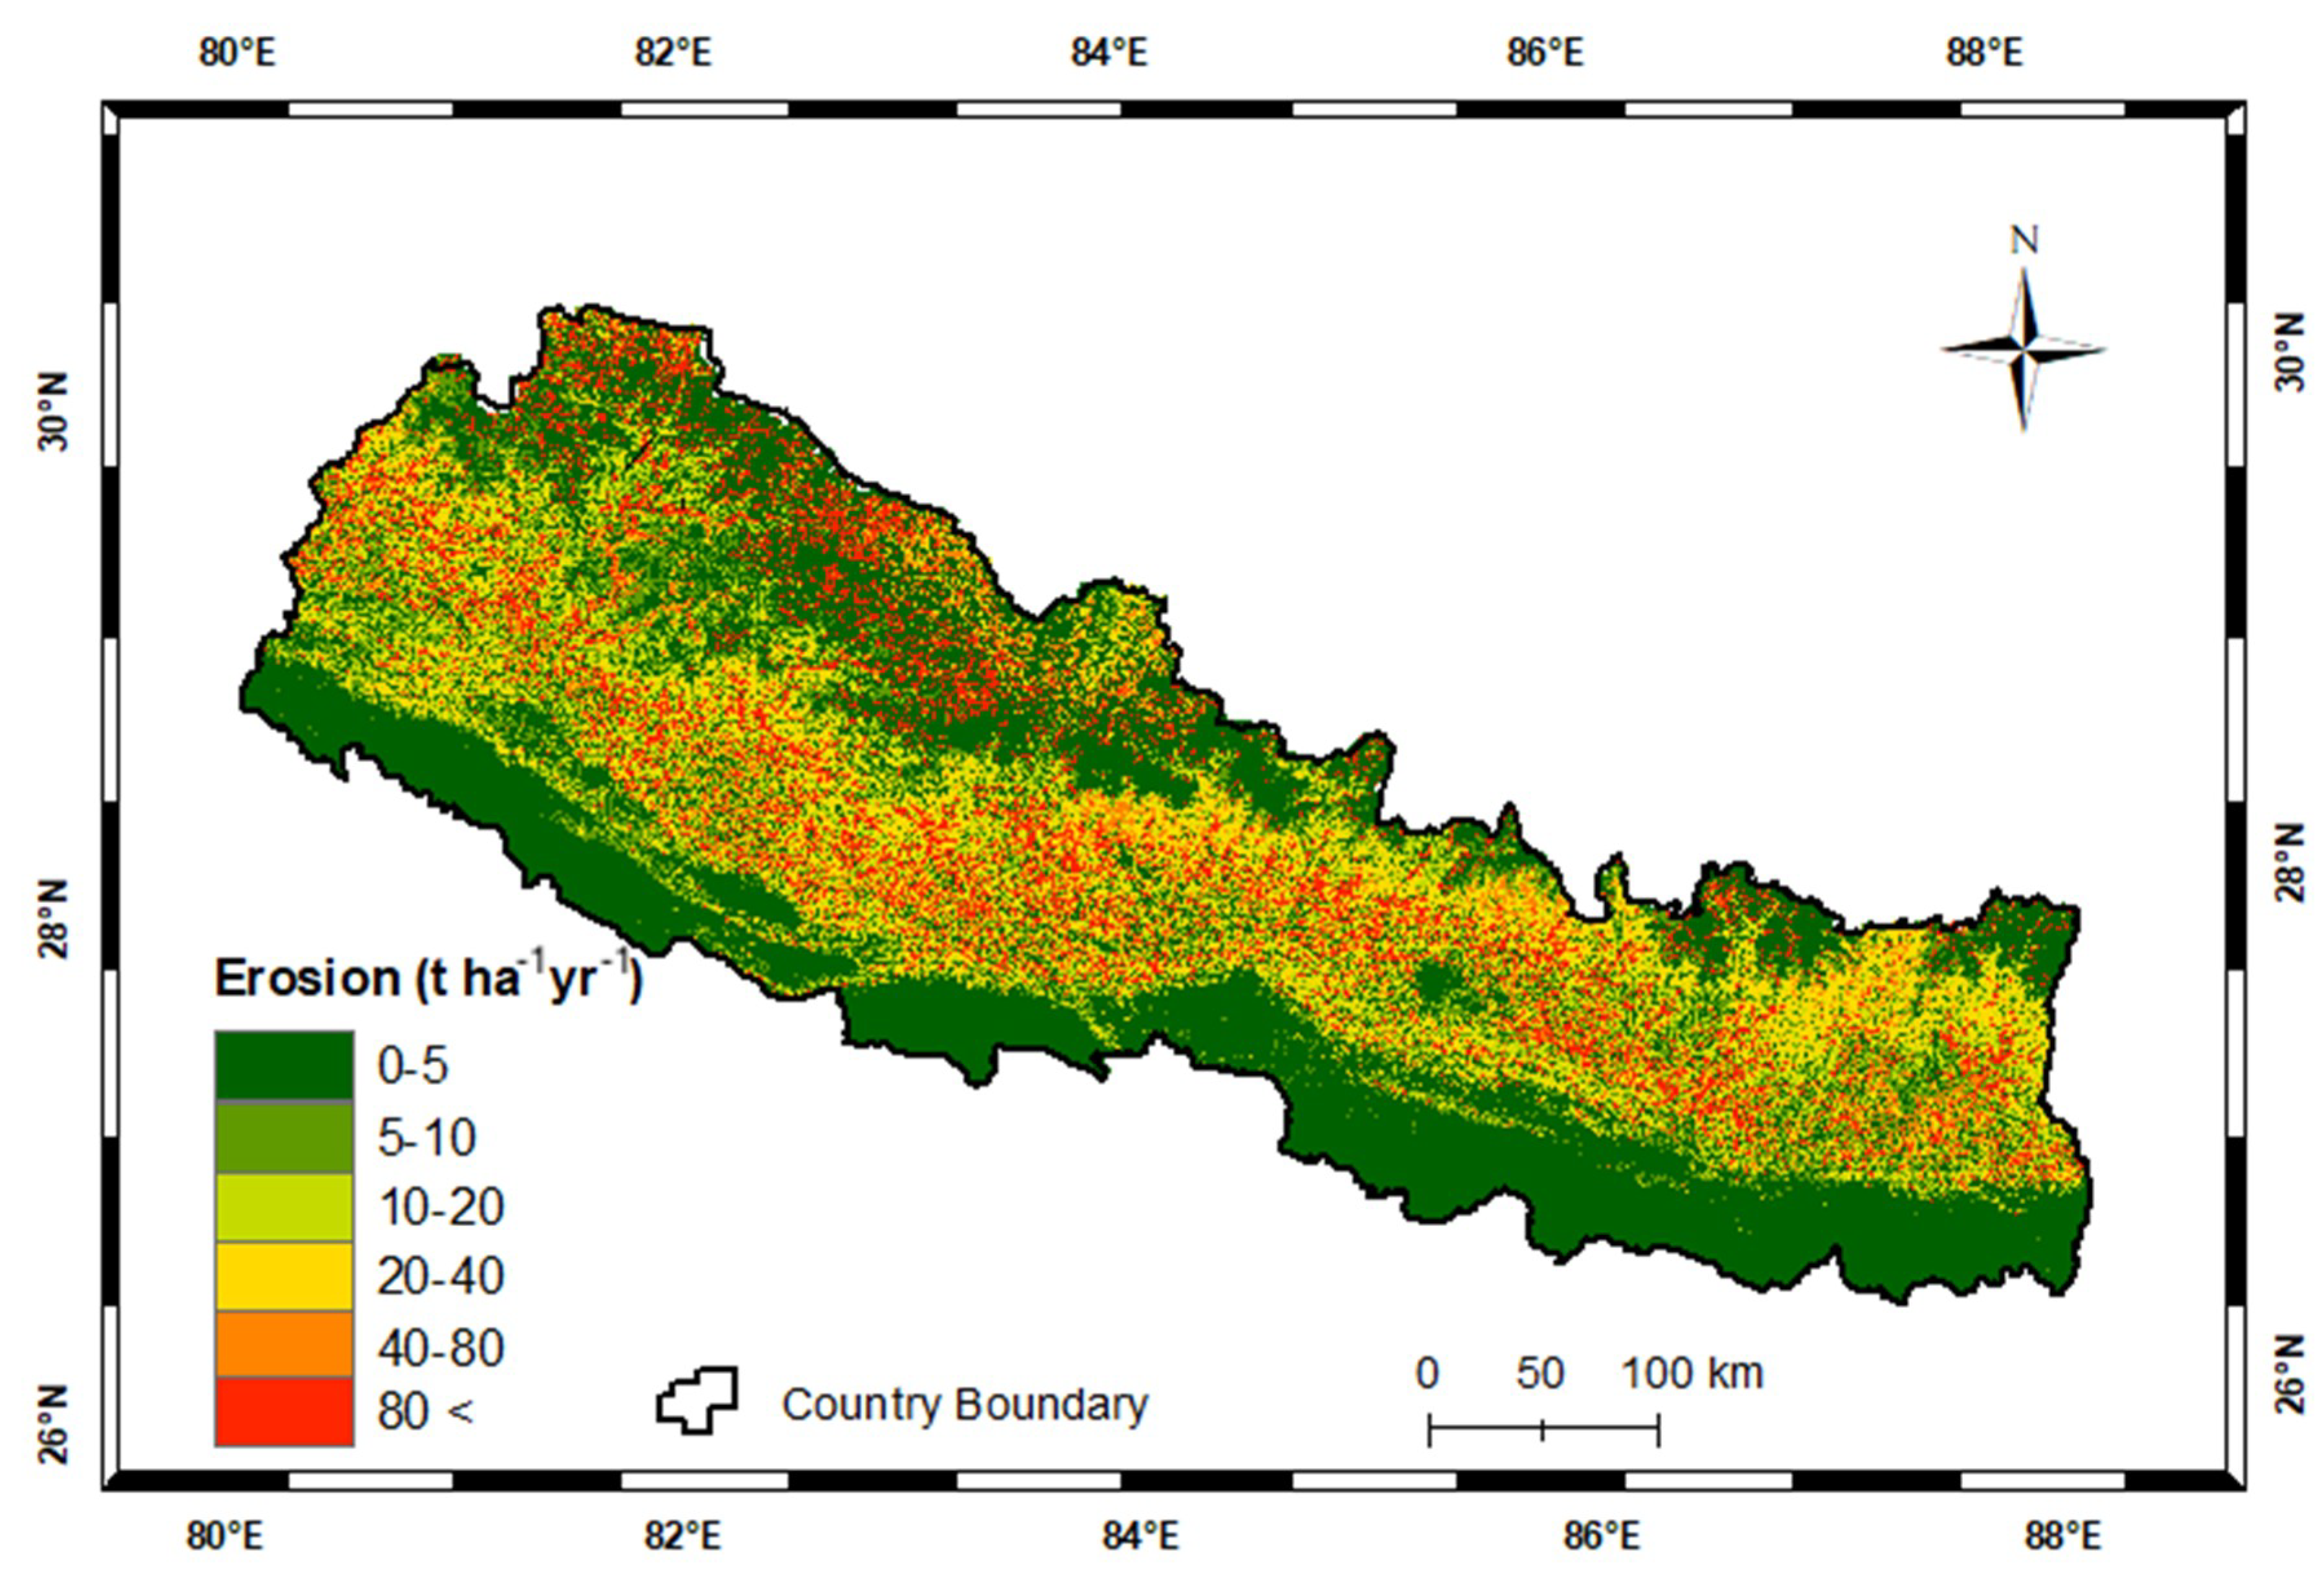
The soil erosion increases with an increase in slope, which is also reported by reference [70] in 5 different slopes, showing that the cumulative soil loss after rainfall increases with the slope gradient for rainfall intensities and is more pronounced for the higher slopes. The soil erosion value which is higher towards the eastern hills, middle mountains and high mountains, and being lower in the Terai (Figure 4) can be explained in relation to the slope and 80% of the annual precipitation being under the influence of the summer monsoon. Similarly, the rainfall erosivity value in trans-Himalaya is seen to be lower in comparison with other regions (Figure 3a), which can be accounted to the lower mean annual precipitation in the region as rainfall erosivity is directly related with the amount of energy produced by rainfall. The largest share of the land area is the hills and mountains, nearly 80% comprising the youngest geological formations, the Himalaya, the foothills and Chure, and the sloping nature, where the soil erosion is likely to be greater in comparison with the plain lands, such as Terai.
As mentioned in reference [14], the C factor varies from region to region and is strongly influenced by other conditions or subfactors, which are prior, land use, canopy cover, surface cover, surface roughness and soil moisture. In this study, the C factor has been assigned according to the LULC of the area that ranges from 0 to 1. As land cover is added to soil, the C-factor value approaches to ‘0’. Zero indicates that there is no erosion compared to the bare fallow area. As the value approaches 1, the erosion also increases.
The estimated mean soil erosion rates for barren land, agricultural land, grassland, shrubland and forest are 40.6, 29.3, 25.3, 23.8, and 22.2 t ha−1 yr−1, respectively. Land-use types with crop cultivation are much more exposed to soil loss than land-use types under semi or natural vegetation such as grassland, rangeland, shrub land, and forest [67]. The erosion rate in undisturbed forestland is usually very low. Studies indicated that the reduction of overstorey canopy [71]; removal or alteration of vegetation, destruction of forest [72], mining [73], human-caused fires [74], and soil compaction from domestic animals grazing [75,76] significantly increase soil erosion risk [31,67] which supports our finding that the forests and grasslands have low erosion rates in comparison with other land use.
The estimated erosion values by physiographic region (Table 4) i.e., mean annual erosion of 356 mt and hills, middle mountains and high mountain (slope rise 17.6% and above) with annual mean soil loss of 352 mT, have the highest potential erosion rate, which is similar to the study of reference [59] in southern Spain, which shows that soil loss is high in high altitudes with scattered vegetation. Gentle slopes (slopes < 5%) have the least mean erosion rate while the highest mean erosion rate is estimated for steep slopes (>26.8%) (Table 7). The severe erosion rate occurs especially on marginal and steep lands, which have been converted from forests to agriculture to replace the already eroded and unproductive croplands [3,77].
Results provided by running a soil erosion assessment model [25] in a GIS environment at Likhu Khola Valley through field plots show that annual soil loss rates are the highest (up to 56 t ha−1 yr−1) in the areas with rain-fed cultivation, which is directly related to the sloping nature of the terraces [45], which is similar to the finding of this research that soil loss from the cultivation land is highest compared to other landuse in terms of area. Higher erosion on longer slopes may be due to increased runoff velocity on longer slope lengths [78], and therefore increases rill erosion. Laflen and Saveson [79] observed a linear increase in soil erosion with an increase in slope length. Mutchler & Greer [80] reported that the magnitude of the slope length exponent depends on slope gradient. In Nigeria, [81] observed that on bare uncultivated slopes, soil erosion increased with an increase in slope length. In the highlands of Guatemala, the soil loss ranged from 50.5 t ha−1 on 2.4 m plots to 144 t ha−1 on 14.7 m plots [82].
The mean annual erosion rate of the Karnali River basin was the highest with 135 mT loss, which is followed by the Gandaki, Koshi, and Mahakali River basins which are estimated as 96 mT yr−1, 79 mT yr−1, and 15 mT yr−1, respectively (Figure 5; Table 5). These results are congruent with the erosion estimates for other areas. For instance, the estimated soil erosion rate of the Karnali River basin is 32 t ha−1 yr−1 which is comparable with the erosion rate, 38 t ha−1 yr−1 in the Karnali River basin by [83] using TRMM data to produce rainfall erosivity factor. In a study by reference [84], the total annual soil loss for the entire Koshi River basin was estimated to be 40 mT. The differences in the results may be due to the differences in the data acquisition and data processes. The K factor for the Koshi basin was assigned from literatures, the C factor was derived from Normalized Difference Vegetation Index and LULC was used to classify the P factor in the study of erosion by reference [84], whereas in this study, DSMW was used to make the K factor map, the LULC was used to produce the C factor map referring the values from published literatures, and slope map was used to produce the P factor map. When compared with the mean erosion rate by LULC, the outcomes are in line with reference [84]. The highest mean erosion rate was from barren lands followed by agricultural lands and forests and found to be 22, 4.5, and 0.5 t ha−1 yr−1 whereas, from this study, the highest mean erosion rate was found for barren land followed by agricultural lands with the least being for forests.
It is suggested that losses of up to 25 t ha−1 yr−1 may be tolerable in young mountain environments [85]. The study estimates the mean annual erosion of 25 t ha−1 yr−1, varying from 0 to 273 t ha−1 yr−1. These values suggest that the soil loss is above the tolerable limits for the topography and attention is needed to reduce the soil loss in vulnerable areas. The erosion not only affects the land, but also results in many negative impacts from sedimentation downstream. Thus, it is important to design and implement erosion control practices. To maximize the effectiveness, the control measures must be targeted at the most vulnerable areas where the impact is likely to be the greatest.
Support practices are extremely important in reducing soil erosion in sloping and high erosive areas. Cover and crop management factor (C factor), can also reduce soil erosion by water in arable lands, hence preventing the loss of nutrients and preserving soil organic carbon. The increase of grass margins, the maintenance of stone-walls, and the application of contour farming can further reduce soil loss rates in arable lands [59].
It is useful to assess the accuracy of the soil erosion estimation from the models using the field-based measurements over a set of sites. The results were compared with the estimated erosion levels at watershed scale and for different land cover classes derived from published field data and with other model-based results, mostly pertaining to mid and high hill areas in Nepal with similar characteristics. The RUSLE derived mean erosion rates for different types of land cover were within the range given by other authors [44,45,46,47,48,71,72,73,74,75,76] and the RUSLE models were relatively successful in predicting the relative pattern of soil loss. However, the mid-hills of Nepal are extremely heterogeneous in terms of rainfall distribution, topography, soil, and cultural practices and this leads to a high variation in erosion levels. One-to-one comparison of the estimates over a set of sites is essential for proper validation and refinement of the model. In the future, such studies could be undertaken in the course of investigations of areas suggested for conservation activities, and an iterative process could be used to refine the model and improve recommendations.
5. Conclusions
Soil erosion is a global issue with its major impact being on agricultural lands. The importance of the study is to produce the spatial distribution of soil erosion of Nepal, which can be used the conservation and management planning processes, at the policy level, by land use planners and policy-makers. The output is based on the model RUSLE processed in ArcGIS. The five factors that influence the soil erosion by water include rainfall erosivity, soil erodibility, topography, cover and support practices. The mean potential soil erosion rate for Nepal is estimated to be 25 t ha−1 yr−1, with an annual loss of 369 mT. It has been found that the erosion rate of Nepal varies from as low as 0 t to 273 t ha−1 yr−1. By physiographic region, it has been found that the Middle Mountains have the maximum mean annual erosion with 38.39 t ha−1 yr−1 followed by the high mountains (32.46 t ha−1 yr−1) with Terai having the lowest erosion potential (0.06 t ha−1 yr−1). In terms of basins, the Karnali River basin had the highest mean annual erosion (165 mT) followed by the Gandaki (96 mT), Koshi (78 mT), and Mahakali River basins (15 mT; Figure 5; Table 5). The entire area is classified into 6 erosion risk classes, and priority level with priority 1 to the most severe erosion. By severity, 44% of the area was found to be the least erosion rate ranging from 0 to 5 t ha−1 yr−1. This study shows that 56% of the area needs conservation attention to reduce the risk of soil erosion. The mean erosion rate was high in barren lands, followed by agricultural lands, shrubs, grasslands and forests. The highest erosion rates were observed in steep slopes >26.8%. In a country, like Nepal, which lacks continuous and long-term monitoring of erosion hazards, RUSLE erosion modeling to develop a detailed spatial assessment of erosion hazards using remotely-sensed data and automated analysis of land cover and slope gradient could be a good option.
Author Contributions
P.K. and S.T. conceptualized and designed the research; P.K. and S.J. collected and processed the data; P.K., S.T., and S.J. analyzed the data; P.K., S.T., and R.C. contributed to data interpretation, discussion, and revision of the manuscript. All authors have read, revised and approved the manuscript.
Funding
This research received no external funding.
Conflicts of Interest
The authors declare no conflict of interest.
References
- Littleboy, M.; Silburn, D.M.; Freebairn, D.M.; Woodruff, D.R.; Hammer, G.L. Impact of soil erosion on production in cropping systems. I. Development and validation of a computer simulation model. Aust. J. Soil Res. 1992, 30, 757–774. [Google Scholar] [CrossRef]
- Bakker, M.M.; Govers, G.; Kosmas, C.; Vanacker, K.; Oost, K.V.; Rounsevell, M. Soil erosion as driver of land use change. J. Agric. Ecosyst. Environ. 2005, 105, 467–481. [Google Scholar] [CrossRef]
- Pimentel, D. Soil erosion: A food and environmental threat. Environ. Dev. Sustain. 2006, 8, 119–137. [Google Scholar] [CrossRef]
- Parveen, R.; Kumar, U. Integrated approach of universal soil loss equation (USLE) and geographical information system (GIS) for soil loss risk assessment in upper south Koel Basin, Jharkhand. J. Geogr. Inf. Syst. 2012, 4, 588–596. [Google Scholar] [CrossRef]
- Ighodaro, I.D.; Lategan, F.S.; Yusuf, S.F.G. The impact of soil erosion on agricultural potential and performance of Sheshegu community farmers in the Eastern Cape of South Africa. J. Agric. Sci. 2013, 5, 140–147. [Google Scholar] [CrossRef]
- Biggelaar, C.; Lal, R.; Eswaran, H.; Breneman, V.E.; Reich, P.F. Crop Losses to Soil Erosion at Regional and Global Scales: Evidence from Plot-Level and GIS Data. In Land Quality, Agricultural Productivity, and Food Security; Wiebe, K., Ed.; Edward Elgar: Cheltenham, UK, 2003; pp. 262–279. [Google Scholar]
- FAO; ITPS. Status of the World’s Soil Resources (SWSR)–Main Report; Food and Agriculture Organization of the United Nations and Intergovernmental Technical Panel on Soils: Rome, Italy, 2015. [Google Scholar]
- Ristić, R.; Kostadinov, S.; Radić, B.; Trivan, G.; Nikić, Z. Torrential Floods in Serbia–Man Made and Natural Hazards. In Proceedings of the 12th Congress INTERPRAEVENT 2012, Grenoble, France, 23–26 April 2012; pp. 771–779. [Google Scholar]
- Ashiagbor, G.; Forkuo, E.; Laari, P.; Aabeyir, R. Modeling soil erosion using RUSLE and GIS tools. Int. J. Remote Sens. Geosci. 2013, 2, 7–17. [Google Scholar]
- Oldeman, L.R. The global extent of land degradation. In Land Resilience and Sustainable Land Use; Greenland, D.J., Szabolcs, I., Eds.; CABI: Wallingford, UK, 1994. [Google Scholar]
- Morgan, R.P.C. Soil Erosion and Conservation, 3rd ed.; Blackwell Publishing: Cornwall, UK, 2005. [Google Scholar]
- Navas, A.; Valero-Garcés, B.L.; Machín, J. An approach to integrated assessment of reservoir siltation: The Joaquín Costa reservoir as case study. Hydrol. Earth Syst. Sci. 2004, 8, 1193–1199. [Google Scholar] [CrossRef]
- Blaikie, P.; Brookfield, H. Land Degradation and Society; Routledge: London, UK, 1987. [Google Scholar]
- Renard, K.G.; Foster, G.; Weesies, G.; McCool, D.; Yoder, D. Predicting Soil Erosion by Water: A Guide to Conservation Planning with the Revised Universal Soil Loss Equation (Rusle); United States Department of Agriculture: Washington, DC, USA, 1997; Volume 703.
- Li, Z.; Fang, H. Impacts of climate change on water erosion: A review. Earth Sci. Rev. 2016, 163, 94–117. [Google Scholar] [CrossRef]
- Serpa, D.; Nunes, J.P.; Santos, J.; Sampaio, E.; Jacinto, R.; Veiga, S.; Lima, J.C.; Moreira, M.; Corte-Real, J.; Keizer, J.J.; et al. Impacts of climate and land use changes on the hydrological and erosion processes of two contrasting Mediterranean catchments. Sci. Total Environ. 2015, 538, 64–77. [Google Scholar] [CrossRef] [Green Version]
- Nearing, M.A.; Pruski, F.F.; O’neal, M.R. Expected climate change impacts on soil erosion rates: A review. J. Soil Water Conserv. 2004, 59, 43–50. [Google Scholar]
- Vanacker, V.; Govers, G.; Barros, S.; Poesen, J.; Deckers, J. The effect of short term socio-economic and demographic change on land use dynamics and its corresponding geomorphic response with relation to water erosion in a tropical mountainous catchment, Ecuador. Landsc. Ecol. 2003, 18, 1–15. [Google Scholar] [CrossRef]
- Zhao, G.; Mu, X.; Wen, Z.; Wang, F.; Gao, P. Soil erosion, conservation, and eco-environment changes in the Loess Plateau of China. Land Degrad. Dev. 2013, 24, 499–510. [Google Scholar] [CrossRef]
- Samaras, A.G.; Koutitas, C.G. The impact of watershed management on coastal morphology: A case study using an integrated approach and numerical modeling. Geomorphology 2014, 211, 52–63. [Google Scholar] [CrossRef]
- Tamrakar, R. A Comparative Study of Land Use Change in the Shivapuri Integrated Watershed Development Area between 1981–1993; Department of Soil Conservation and Watershed Management, Ministry of Forest and Soil Conservation: Kathmandu, Nepal, 1993.
- Likhu Khola Project. Landuse, Soil Conservation and Water Resource Management in the Nepalese Middle Hills; Institute of Hydrology: Nepal Agriculture Research Council and Royal Geographic Society: Kathmandu, Nepal, 1995. [Google Scholar]
- Shah, P.B.; Schreier, H.; Brown, S.J.; Riley, K.W. Soil Fertility and Erosion Issues in the Middle Mountains of Nepal: Workshop Proceedings, Jhikhu Khola Watershed; Topographical Survey Branch: Kathmandu, Nepal, 1991. [Google Scholar]
- Brady, C.N.; Weil, R.R. The Nature and Properties of Soils, 14th ed.; Prentice Hall: Upper Saddle River, NJ, USA, 2008. [Google Scholar]
- Morgan, R.P.C.; Morgan, D.D.V.; Finney, H.J. A predictive model for the assessment of soil erosion risk. J. Agric. Eng. Res. 1984, 30, 245–253. [Google Scholar] [CrossRef]
- Morgan, R.P.C.; Quenton, J.N.; Rickson, R.J. EUROSEM: Documentation Manual; Silsoe College: Silsoe, UK, 1992. [Google Scholar]
- Ciesiolka, C.A.; Coughlan, K.J.; Rose, C.W.; Escalante, M.C.; Hashim, G.M.; Paningbatan, E.P.; Sombatpanit, S. Methodology for a multicountry study of soil erosion Manage. Soil Technol. 1995, 8, 179–192. [Google Scholar] [CrossRef]
- Rose, C.W.; Coughlan, K.J.; Ciesiolka, C.A.A.; Fentie, B. Program GUEST. (Grifth University Erosion System Template). In A New Soil Conservation Methodology and Application to Cropping Systems in Tropical Steeplands; ACIAR Technical Report; Coughlan, K.J., Rose, C.W., Eds.; US Department of Agriculture: Washington, DC, USA, 1997. [Google Scholar]
- De Roo, A.; Jetten, V.; Wesseling, C.; Ritsema, C. LISEM: A physically-based hydrologic and soil erosion catchment model. In Modeling Soil Erosion by Water; Boardman, J., FavisMortlock, D., Eds.; Springer: Berlin, Germany, 1998; pp. 429–440. [Google Scholar]
- Laen, J.M.; Lane, L.J.; Foster, G.R. WEPP: A new generation of erosion prediction technology. J. Soil Water Conserv. 1991, 46, 8. [Google Scholar]
- Wischmeier, W.H.; Smith, D.D. Predicting Rainfall Erosion Losses—A Guide to Conservation Planning; U.S. Department of Agriculture, Science and Education Administration: Hyattsville, MD, USA, 1978; p. 62.
- Milward, A.A.; Mersy, J.E. Adapting RULSE to model soil erosion potential in a mountainous tropical watershed. Catena 1999, 38, 109–129. [Google Scholar] [CrossRef]
- Young, R.A.; Onstad, C.A.; Bosch, D.D.; Anderson, W.P. AGNPS: A nonpoint-source pollution model for evaluating agricultural watersheds. J. Soil Water Conserv. 1989, 44, 168–173. [Google Scholar]
- Beasley, D.B.; Huggins, L.F.; Monke, E.J. ANSWERS: A model for watershed planning. Trans. Am. Soc. Agric. Eng. 1980, 23, 938–944. [Google Scholar] [CrossRef]
- Arnold, J.G.; Srinivasan, R.; Muttiah, R.S.; Williams, J.R. Large area hydrologic modeling and assessment part I: Model development. J. Am. Water Resour. Assoc. 1998, 34, 73–89. [Google Scholar] [CrossRef]
- Woolhiser, D.A.; Smith, R.E.; Goodrich, D.C. KINEROS: A Kinematic Runoff and Erosion Model: Documentation and User Manual; USDA Agricultural Research Service ARS–77: Washington, DC, USA, 1990.
- Morgan, R.P.C.; Quinton, J.N.; Smith, R.E.; Govers, G.; Poesen, J.W.A.; Auerswald, K.; Chisci, G.; Torri, D.; Styczen, M.E. The European Soil Erosion Model (EUROSEM): A dynamic approach for predicting sediment transport from fields and small catchments. Earth Surf. Process. Landf. 1998, 23, 527–544. [Google Scholar] [CrossRef]
- Knisel, W.G. CREAMS: A field scale model for chemicals, runoff and erosion from agricultural management systems. In USDA Conservation Research Report 26; United States Department of Agriculture: Washington, DC, USA, 1980. [Google Scholar]
- Flanagan, D.C.; Nearing, M.A. USDA Water Erosion Prediction Project: Hillslope Profile and Watershed Model Documentation. In USDA-ARS National Soil Erosion Laboratory Report No. 10; United States Department of Agriculture: Washington, DC, USA, 1995. [Google Scholar]
- Samaras, A.G.; Koutitas, C.G. An integrated approach to quantify the impact of watershed management on coastal morphology. Ocean Coast. Manag. 2012, 69, 68–77. [Google Scholar] [CrossRef]
- Wang, G.; Gertner, G.; Singh, V.; Shinkareva, S.; Parysow, P.; Anderson, A. Spatial and temporal prediction and uncertainty of soil loss using the revised universal soil loss equation: A case study of the rainfall–runoff erosivity R factor. Ecol. Modeling 2002, 153, 143–155. [Google Scholar] [CrossRef]
- CIMOD. Constraints and opportunities. In Proceedings of the International Symposium on Mountain Environment and Development, International Centre for Integrated Mountain Development, Kathmandu, Nepal, 1–2 December 1994. [Google Scholar]
- ICIMOD. Soil Fertility Issues in the Hindu Kush-Himalayas; Newsletter No. 32; International Centre for Integrated Mountain Development (ICIMOD): Kathmandu, Nepal, 1998. [Google Scholar]
- Gardner, R.; Mawdesley, K.; Tripathi, B.P.; Gaskin, S.; Adems, S. Soil Erosion and Nutrient Loss in the Middle Hills of Nepal (1996–1998); QueenMary and Westfield College: London, UK; University of London: London, UK, 2000. [Google Scholar]
- Shrestha, D.P. Assessment of soil erosion in the Nepalese Himalaya, a case study in Likhu khola valley, middle mountain region. Land Husb. 1997, 2, 59–80. [Google Scholar]
- Maskey, R.B.; Joshi, D. Soil and nutrient under different soil management practices in the Middle Mountains of Central Nepal. In Soil Fertility and Erosion Issues in the Middle Mountain of Nepal, Jikhu Khola Watershed; Shah, P.B., Shreier, H., Brown, S.J., Riley, K.W., Eds.; Topographical Survey Branch: Kathmandu, Nepal, 1991; pp. 105–120. [Google Scholar]
- Upadhyaya, G.P.; Sthapit, M.; Shrestha, K.N. Runoff and soil loss studies in the Kulekhani Watershed: Results 1985–1990. In Soil Fertility and Erosion Issues in the Middle Mountain of Nepal, Jikhu Khola Watershed; Shah, P.B., Shreier, H., Brown, S.J., Riley, K.W., Eds.; Topographical Survey Branch: Kathmandu, Nepal, 1991; pp. 25–32. [Google Scholar]
- Sherchan, P.P.; Gurung, G.B.; Chand, S.P. A review of current soil related research activities at Pakhribas Agricultural Centre. In Soil Fertility and Erosion Issues in the Middle Mountain of Nepal, Jikhu Khola Watershed; Shah, P.B., Shreier, H., Brown, S.J., Riley, K.W., Eds.; Topographical Survey Branch: Kathmandu, Nepal, 1991; pp. 83–104. [Google Scholar]
- Jones, R.J.A.; Le Bissonnais, Y.; Bazzoffi, P.; Sanchez Diaz, J.; Düwel, O.; Loj, G.; Øygarden, L.; Prasuhn, V.; Rydell, B.; Strauss, P. Nature and extent of soil erosion in Europe. In Reports of the Technical Working Groups Established under the Thematic Strategy for Soil Protection. 2; Office for Official Publications of the European Communities: Luxembourg, 2004. [Google Scholar]
- Pimentel, D.; Harvey, C.; Resosudarmo, P.; Sinclair, K.; Kurz, D.; McNair, M.; Crist, S.; Shpritz, L.; Fitton, L.; Saffouri, R. Environmental and economic costs of soil erosion and conservation benefits. Science 1995, 267, 1117–1123. [Google Scholar] [CrossRef] [PubMed]
- Chalise, S. Mountain Environment and Climate Change in the Hindu-Kush Himalayas. In Mountain Environment in Changing Climates; Benisten, M., Ed.; Routledge: London, UK, 1994; pp. 382–404. [Google Scholar]
- Nayava, J.L. Rainfall in Nepal. Himal. Rev. 1980, 12, 1–18. [Google Scholar]
- Yitayew, M.; Pokrzywka, S.J.; Renard, K.G. Using GIS for facilitating erosion estimation. Appl. Eng. Agric. 1999, 15, 295–301. [Google Scholar] [CrossRef]
- Morgan, R.P.C. Soil Erosion and Conservation; Soil Conservation Society of America: Ankeny, lowa, 1985. [Google Scholar]
- Ganasri, B.P.; Ramesh, H. Assessment of soil erosion by RUSLE model using remote sensing and GIS-A case study of Nethravathi Basin. Geosci. Front. 2016, 7, 953–961. [Google Scholar] [CrossRef]
- Sharpley, A.N.; Williams, J.R. Erosion/Productivity Impact Calculator: 1. Model Documentation. USA Dep. Agric. Tech. Bull. 1990, 1768, 235. [Google Scholar]
- Sheikh, A.H.; Palria, S.; Alam, A. Integration of GIS and Universal Soil Loss Equation (USLE) for soil loss estimation in a Himalayan watershed. Recent Res. Sci. Tech. 2011, 3, 51–57. [Google Scholar]
- Gao, G.Y.; Fu, B.J.; Liu, Y.; Wang, S.; Zhou, J. Coupling the modified SCS-CN and RUSLE models to simulate hydrological effects of restoring vegetation in the Loess Plateau of China. Hydrol. Earth Syst. Sci. 2012, 16, 2347–2364. [Google Scholar] [CrossRef] [Green Version]
- Panagos, P.; Borrelli, P.; Meusburger, K.; Alewell, C.; Lugato, E.; Montanarella, L. Land Use Policy Estimating the soil erosion cover-management factor at the European scale. Land Use Policy 2015, 48, 38–50. [Google Scholar] [CrossRef]
- Erencin, Z. C-Factor Mapping Using Remote Sensing and GIS; A case Study of Lom Sak/Lom Kao, Thailand; International Institute for Aerospace Survey and Earth Sciences (ITC): Upper Aise, The Netherlands, 2000. [Google Scholar]
- Shin, G.J. The Analysis of Soil Erosion Analysis in Watershed Using GIS. Ph.D. Thesis, Kangwon National University, Chuncheon, South Korea, 1999. [Google Scholar]
- Singh, G.; Babu, R.; Narain, P.; Bhushan, L.S.; Abrol, L.P. Soil erosion rates in India. J. Soil Water Conserv. 1992, 47, 97–99. [Google Scholar]
- Devatha, C.P.; Deshpande, V.; Renukaprasad, M.S. Estimation of soil loss using USLE model for Kulhan Watershed, Chattisgarh-A case study. Aquat. Procedia 2015, 4, 1429–1436. [Google Scholar] [CrossRef]
- Kumar, S.; Kushwaha, S.P.S. Modeling soil erosion risk based on RUSLE-3D using GIS in a Shivalik sub-watershed. J. Earth Syst. Sci. 2013, 122, 389–398. [Google Scholar] [CrossRef]
- McCool, D.K.; Brown, L.C.; Foster, G.R.; Mutchler, C.K.; Meyer, L.D. Revised slope steepness factor for the universal soil loss equation. Trans. ASAE 1987, 30, 1387–1396. [Google Scholar] [CrossRef]
- Maetens, W.; Vanmaercke, M.; Poesen, J.; Jankauskas, B.; Jankauskien, G.; Ionita, I. Effects of land use on annual runoff and soil loss in Europe and the Mediterranean: A meta-analysis of plot data. Prog. Phys. Geogr. Earth Environ. 2012, 36, 599–653. [Google Scholar] [CrossRef]
- Stocking, M. Rates of erosion and sediment yield in the African environment. Chall. Afr. Hydrol. Water Resour. 1984, 285–295, IAHS Publ. no. 144. [Google Scholar]
- Lu, H.; Prosser, I.P.; Moran, C.J.; Gallant, J.C.; Priestley, G.; Stevenson, J.G. Predicting sheetwash and rill erosion over the Australian continent. Soil Res. 2003, 41, 1037–1062. [Google Scholar] [CrossRef]
- Suárez de Castro, F.; Rodríguez Grandas, A. Investigaciones Sobre la Erosión y la Conservación de los Suelos en Colombia; Federación Nacional de Cafeteros: Bogotá, Colombia, 1962. [Google Scholar]
- Assouline, S.; Ben-Hur, M. Effects of rainfall intensity and slope gradient on the dynamics of interrill erosion during soil surface sealing. Catena 2006, 66, 211–220. [Google Scholar] [CrossRef]
- Mohammad, A.G.; Adam, M.A. The impact of vegetative cover type on runoff and soil erosion under different land uses. Catena 2010, 81, 97–103. [Google Scholar] [CrossRef]
- Karamage, F.; Shao, H.; Chen, X.; Ndayisaba, F.; Nahayo, L.; Kayiranga, A.; Omifolaji, J.K.; Liu, T.; Zhang, C. Deforestation effects on soil erosion in the lake kivu basin, D.R. Congo-Rwanda. Forests 2016, 7, 281. [Google Scholar] [CrossRef]
- Trabucchi, M.; Puente, C.; Comin, F.A.; Olague, G.; Smith, S.V. Mapping erosion risk at the basin scale in a Mediterranean environment with opencast coal mines to target restoration actions. Reg. Environ. Chang. 2012, 12, 675–687. [Google Scholar] [CrossRef] [Green Version]
- Benavides-Solorio, J.; MacDonald, L.H. Post-fire runoff and erosion from simulated rainfall on small plots, Colorado Front Range. Hydrol. Process. 2001, 15, 2931–2952. [Google Scholar] [CrossRef]
- Krümmelbein, J.; Wang, Z.; Zhao, Y.; Peth, S.; Horn, R. Influence of various grazing intensities on soil stability, soil structure and water balance of grassland soils in Inner Mongolia, PR China. Adv. Geoecol. 2006, 38, 93–101. [Google Scholar]
- Blanco-Canqui, H.; Stalker, A.L.; Rasby, R.; Shaver, T.M.; Drewnoski, M.E.; van Donk, S.; Kibet, L. Does cattle grazing and baling of corn residue increase water erosion? Soil Sci. Soc. Am. J. 2016, 80, 168–177. [Google Scholar] [CrossRef]
- Lal, R. Soil erosion and land degradation. The global risks. In Advances in Soil Science; Springer: Berlin, Germany, 1990; pp. 129–172. [Google Scholar]
- Lal, R. Soil degradation by erosion. J. Land Degrad. Dev. 2001, 12, 519–539. [Google Scholar] [CrossRef]
- Laflen, J.M.; Saveson, J.L. Surface runoff from graded lands of low slopes. Trans. Am. Soc. Agric. Eng. 1970, 13, 340. [Google Scholar]
- Mutchler, C.K.; Greer, J.D. Effect of slope length on erosion from low slopes. Trans. Am. Soc. Agric. Eng. 1980, 23, 866. [Google Scholar] [CrossRef]
- Lal, R. Effects of slope length on runoff from Alfisols in Western Nigeria. Geoderma 1983, 31, 185. [Google Scholar] [CrossRef]
- Akeson, M.; Singer, M.J. A preliminary length factor for erosion on steep slopes in Guatemala and its use to evaluate “curvas a nivel”. Geoderma 1984, 33, 265. [Google Scholar] [CrossRef]
- Pandey, A.; Mishra, S.K.; Gautam, A.K. Soil Erosion Modeling Using Satellite Rainfall Estimates. J. Water Resour. Hydraul. Eng. 2015, 4, 318–325. [Google Scholar] [CrossRef]
- Uddin, K.; Murthy, M.S.R.; Wahid, S.M.; Matin, M.A. Estimation of Soil Erosion Dynamics in the Koshi Basin Using GIS and Remote Sensing to Assess Priority Areas for Conservation. PLoS ONE. 2016, 11, e0150494. [Google Scholar] [CrossRef] [PubMed]
- Morgan, R.P.C. Soil Erosion and Conservation; Davidson, D.A., Ed.; Longman Scientific and Technical, Longman Group UK Limited: Harlow, UK, 1986; 298p, ISBN 0-582-30158-0. [Google Scholar]
Figure 1.
Location of the study area map: Nepal Himalaya. The inset map shows the position of Nepal in the Himalayan range. The southern plain area (< 700 m) and the hilly region (700–1500 m) of Nepal are commonly represented as Terai and Chure, respectively.
Figure 1.
Location of the study area map: Nepal Himalaya. The inset map shows the position of Nepal in the Himalayan range. The southern plain area (< 700 m) and the hilly region (700–1500 m) of Nepal are commonly represented as Terai and Chure, respectively.

Figure 2.
The methodological framework of implementing the RUSLE model for soil erosion estimation.

Figure 3.
Factor maps of soil erosion modeling of Nepal (a) Map of Rainfall erosivity factor of Nepal; (b) Soil Erodibility factor Map of Nepal (c) Topographic factor Map of Nepal (d) Cover Management factor map of Nepal (e) Support Practice factor Map of Nepal.
Figure 3.
Factor maps of soil erosion modeling of Nepal (a) Map of Rainfall erosivity factor of Nepal; (b) Soil Erodibility factor Map of Nepal (c) Topographic factor Map of Nepal (d) Cover Management factor map of Nepal (e) Support Practice factor Map of Nepal.


Figure 4.
Map of Nepal showing Potential Soil Erosion Rate (t ha−1 yr−1) of Nepal.

Figure 5.
Mean soil erosion rate and total soil loss by (a) physiographic region and (b) major river basin.
Figure 5.
Mean soil erosion rate and total soil loss by (a) physiographic region and (b) major river basin.

Figure 6.
Bar diagram showing soil erosion rate of Nepal by (a) Slope (b) LULC.


Table 1.
The datasets used for the RUSLE modeling.
| Datasets | Data Source |
|---|---|
| DEM* | ASTER GDEM† version 2 (30 m) |
| www.jspacesystems.or.jp/ersdac/GDEM/E/4.html | |
| A product of METI§ and NASA# | |
| Soil Map | Digital Soil Map of the World (2007) |
| www.fao.org/geonetwork/srv/en/metadata.show?id=14116&currTab=distribution | |
| Produced by FAO-UNESCO∞ (1:5,000,000 scale). | |
| Landcover Map | Landcover Map of Nepal (2010) |
| Produced by ICIMODΩ | |
| Rainfall Map | Mean Annual Precipitation of Nepal |
| Produced by DHM∂ |
*DEM—Digital Elevation Model; †ASTER GDEM—Advanced Spaceborne Thermal Emission and Reflection, Global Digital Elevation Model; §METI—Ministry of Economy, Trade and Industry, Japan; #NASA—National Aeronautics and Space Administration, US; ∞FAO–UNESCO-Food and Agriculture Organization, the United Nations Educational, Scientific and Cultural Organization; ΩICIMOD—International Center for Integrated Mountain Development; ∂DHM—Department of Hydrology and Meteorology, Government of Nepal.
Table 2.
Cover Management Factor.
| Land Use | C Factor |
|---|---|
| Forest | 0.03 |
| Shrubland | 0.03 |
| Grassland | 0.01 |
| Agricultural Land | 0.21 |
| Barren Land | 0.45 |
| Water Body | 0.00 |
| Snow Glacier | 0.00 |
| Built-Up | 0.00 |
Table 3.
P factor values for slope as per agricultural practice [61].
Table 3.
P factor values for slope as per agricultural practice [61].
| Slope % | Contouring |
|---|---|
| 0–7 | 0.55 |
| 7–11.3 | 0.60 |
| 11.3–17.6 | 0.80 |
| 17.6–26.8 | 0.95 |
| > 26.8 | 1.00 |
Table 4.
Potential soil erosion rate of Nepal.
| Erosion Class (t ha−1 yr−1) | Area (km2) | Min | Max | Mean Erosion Rate (t ha−1 yr−1) | Total Erosion (mT yr−1) |
|---|---|---|---|---|---|
| 0–25 | 110,741 | 0 | 21 | 5.22 | 57.80 |
| 25–50 | 12,965 | 28 | 49 | 34.96 | 45.33 |
| 50–100 | 9422 | 56 | 98 | 75.84 | 71.46 |
| 100–150 | 6495 | 105 | 147 | 123.91 | 80.48 |
| 150–200 | 3454 | 154 | 196 | 172.06 | 59.42 |
| 200–250 | 1742 | 203 | 245 | 221.63 | 38.61 |
| 250–273 | 632 | 252 | 273 | 261.89 | 16.55 |
Table 5.
Soil erosion rate by physiographic region.
| Physiographic Region | Area (km2) | Min | Max | Mean Erosion Rate (t ha−1 yr−1) | Soil Loss (mT yr−1) |
|---|---|---|---|---|---|
| Terai | 20,077 | 0 | 154 | 0.1 | 0.1 |
| Chure | 18,923 | 0 | 273 | 6.9 | 13.0 |
| Middle Mountain | 43,065 | 7 | 273 | 38.4 | 165.3 |
| High Mountain | 29,826 | 7 | 273 | 32.5 | 96.8 |
| High Himal | 33,543 | 0 | 273 | 28.1 | 94.4 |
Table 6.
Soil erosion rate by basin.
| SN | Basin Name | Area of the Basin (km2) | Mean Erosion Rate (t ha−1 yr−1) | Soil Loss (mT yr−1) |
|---|---|---|---|---|
| 1 | Mahakali | 4995 | 32.9 | 15.6 |
| 2 | Churiya | 6204 * | 3.3 | 2.2 |
| 3 | Karnali | 43,010 | 32.2 | 135.8 |
| 4 | Babai | 3335 | 15.8 | 5.3 |
| 5 | Rapti | 6368 | 28.4 | 18.0 |
| 6 | Gandaki | 31,897 | 30.7 | 96.1 |
| 7 | Bagmati | 3421 | 14.8 | 5.1 |
| 8 | Kamala | 2381 | 7.9 | 1.9 |
| 9 | Koshi | 26,218 | 31.0 | 79.7 |
| 10 | Mechi | 493 | 25.8 | 3.3 |
* sum of all Churiya basins.
Table 7.
Soil erosion classes by severity and conservation priority.
| Erosion Rate (t ha−1 yr−1) | Class | Area (km2) | Area % | Conservation Priority |
|---|---|---|---|---|
| 0–5 | Slight | 64,224 | 44.1 | 6 |
| 5–10 | Moderate | 20,756 | 14.2 | 5 |
| 10–20 | High | 15,462 | 10.6 | 4 |
| 20–40 | Very High | 19,337 | 13.3 | 3 |
| 40–80 | Severe | 9885 | 6.8 | 2 |
| 80 < | Very Severe | 16,087 | 11.0 | 1 |
© 2019 by the authors. Licensee MDPI, Basel, Switzerland. This article is an open access article distributed under the terms and conditions of the Creative Commons Attribution (CC BY) license (http://creativecommons.org/licenses/by/4.0/).
Share and Cite
MDPI and ACS Style
Koirala, P.; Thakuri, S.; Joshi, S.; Chauhan, R. Estimation of Soil Erosion in Nepal Using a RUSLE Modeling and Geospatial Tool. Geosciences 2019, 9, 147. https://0-doi-org.brum.beds.ac.uk/10.3390/geosciences9040147
AMA Style
Koirala P, Thakuri S, Joshi S, Chauhan R. Estimation of Soil Erosion in Nepal Using a RUSLE Modeling and Geospatial Tool. Geosciences. 2019; 9(4):147. https://0-doi-org.brum.beds.ac.uk/10.3390/geosciences9040147
Chicago/Turabian StyleKoirala, Pooja, Sudeep Thakuri, Subesh Joshi, and Raju Chauhan. 2019. "Estimation of Soil Erosion in Nepal Using a RUSLE Modeling and Geospatial Tool" Geosciences 9, no. 4: 147. https://0-doi-org.brum.beds.ac.uk/10.3390/geosciences9040147
Note that from the first issue of 2016, this journal uses article numbers instead of page numbers. See further details here.