The Impact of Urinary Incontinence on Quality of Life: A Cross-Sectional Study in the Metropolitan City of Naples


 , , ,
, , ,
Abstract
:1. Introduction
2. Materials and Methods
2.1. Design
2.2. Material
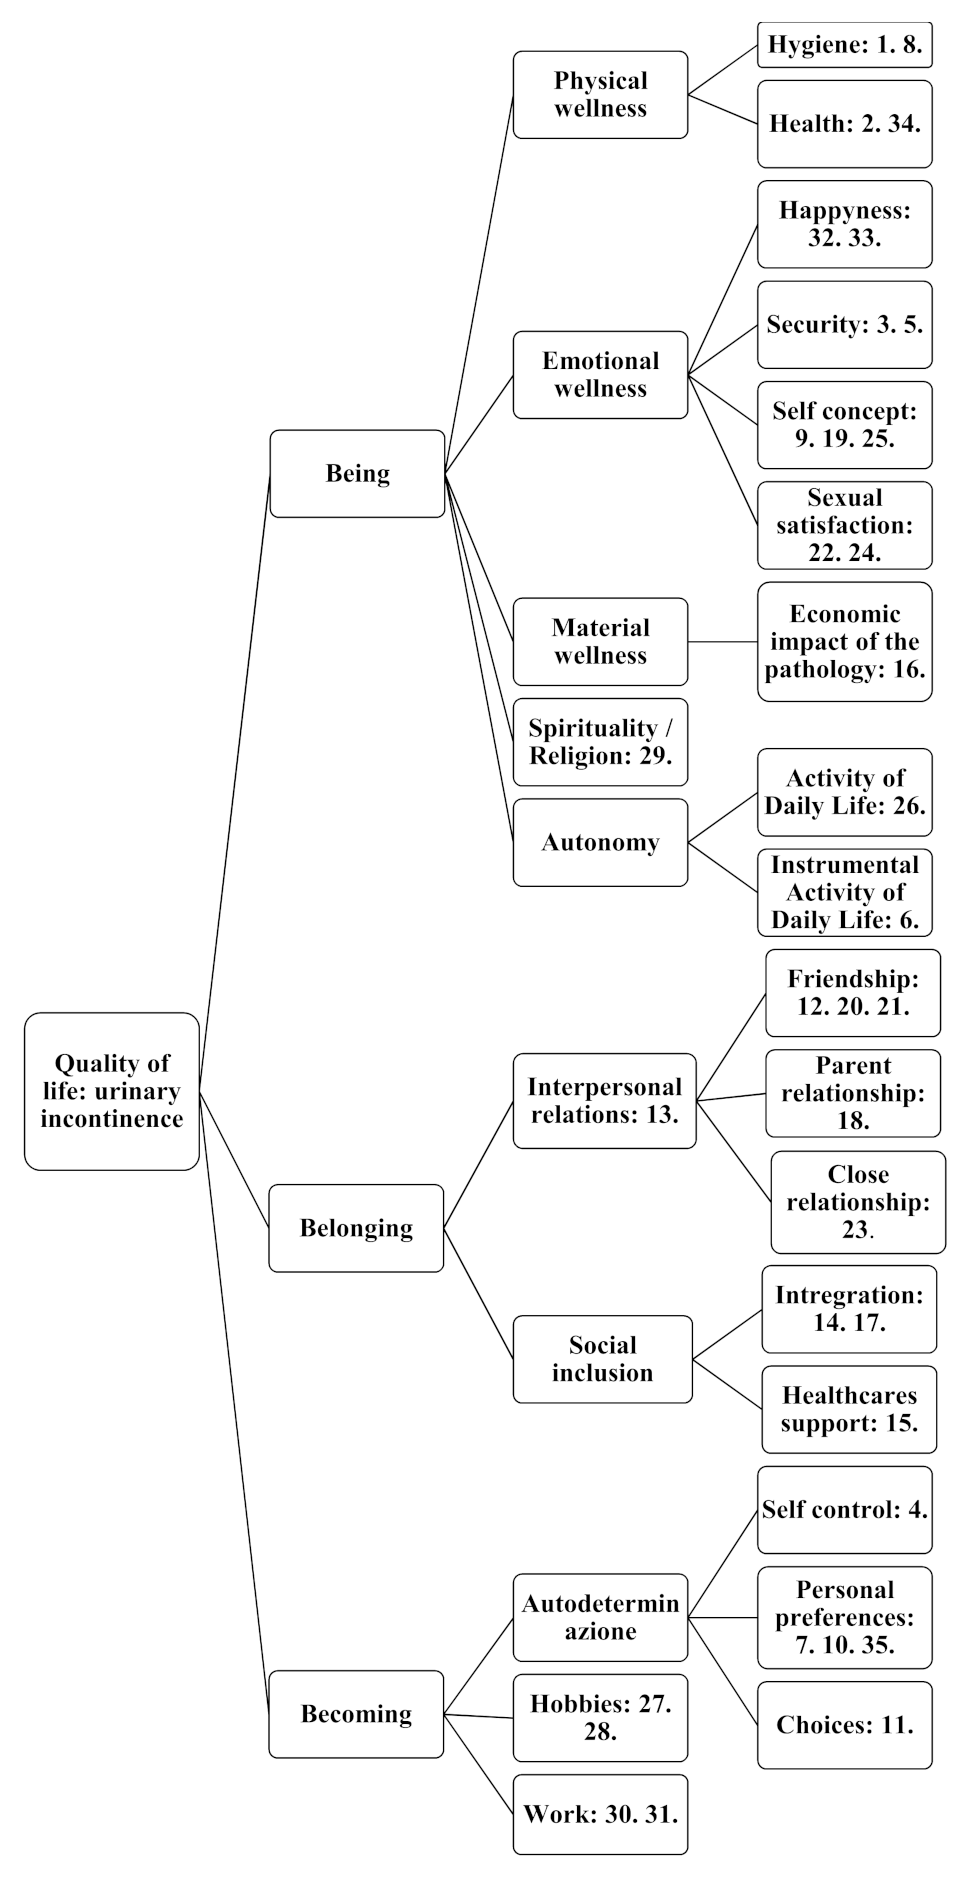
2.3. Questionnaire Structure
- Walking autonomy: this autonomy was assessed in order to identify those patients who were physically unable to independently reach the nearest toilet. The item assessed the walking ability and not the quality of gait; therefore, if the patients used orthopaedic or walking aids that supported them in walking, they were considered nonautonomous. In the absence of walking autonomy, a score of 5 was assigned, otherwise, 0.
- Frequency of urination per day: the option “less than 6 times” corresponded to 0, “from 6 to 10 times” corresponded to 1, “from 10 to 15 times” corresponded to 2 and “more than 15 times a day” corresponded to 3.
- Losses during the day: “episodes of UI during the day” or “episodes of UI during the night” options corresponded to 1, while the “both day and night” option corresponded to a severity score of 2.
- Frequency of the episodes of UI: the “rarely” option corresponded to 1, “once or more times a week” corresponded to 2, “once a day” corresponded to 3 and “more than once a day” corresponded to 4.
- Amount of urine leakage: the question posed four images of a medium-sized sanitary napkin with a variable wet surface. The numerical scores varied respectively from 1 for the least absorption of liquid to 4 for complete saturation.
- Sphincter control during urination: if the patient was able to stop the flow of urine when urination has started, a score of 0 was be assigned, otherwise, 1.
- Circumstances in which the patient had involuntary leakage of urine: for each circumstance that led the patient to lose urine, 1 point of severity of UI was assigned.
- Absorbent aids used by the patient: a score of 0 was assigned if the patient did not use aids at all, 1 point if he or she used a draw sheet, 2 points if he or she used a diaper or absorbent pad or both and 3 points if he or she used a catheter.
- Number of changes of aids made per day (every 24 h): the option “1 change per day” corresponded to 1, “2 changes per day” corresponded to 2, “3 changes per day” corresponded to 3 and “more than 3 changes per day” corresponded to 4.
2.4. Data Collection
2.5. Analysis
2.6. Sample Characteristics
2.7. Ethics
3. Results
4. Discussion
5. Conclusions
Supplementary Materials
Author Contributions
Funding
Conflicts of Interest
References
- Abrams, P.; Cardozo, L.; Fall, M.; Griffiths, D.; Rosier, P.; Ulmsten, U.; Van Kerrebroeck, P.; Victor, A.; Wein, A.J. The standardisation of terminology in lower urinary tract function: Report from the standardisation sub-committee of the International Continence Society. Urology 2003, 61, 37–49. [Google Scholar] [CrossRef]
- Botlero, R.; Urquhart, D.M.; Davis, S.R.; Bell, R.J. Prevalence and incidence of urinary incontinence in women: Review of the literature and investigation of methodological issues. Int. J. Urol. 2008, 15, 230–234. [Google Scholar] [CrossRef] [PubMed]
- Price, N.; Currie, I. Urinary incontinence in women: Diagnosis and management. Practitioner 2010, 254, 27–33. [Google Scholar] [PubMed]
- National Institute for Health and Care Excellence. Urinary Incontinence in Women: Management [CG171]. 2015. Available online: http://tinyurl.com/jcmyvyl (accessed on 21 September 2016).
- National Institute for Health and Care Excellence. Lower Urinary Tract Symptoms in Men: Management [CG97]. 2015. Available online: http://tinyurl.com/z33bgyn (accessed on 21 September 2016).
- Bardsley, A. An overview of urinary incontinence. Br. J. Nurs. 2016, 25, S14–S21. [Google Scholar] [CrossRef] [PubMed] [Green Version]
- Yoo, R.; Spencer, M. Continence Promotion and Successful Aging: The Role of the Multidisciplinary Continence Clinic. Geriatrics 2018, 3, 91. [Google Scholar] [CrossRef] [PubMed] [Green Version]
- Wang, C.; Li, J.; Wan, X.; Wang, X.; Kane, R.L.; Wang, K. Effects of stigma on Chinese women’s attitudes towards seeking treatment for urinary incontinence. J. Clin. Nurs. 2014, 24, 1112–1121. [Google Scholar] [CrossRef] [PubMed]
- Gümüşsoy, S.; Kavlak, O.; Donmez, S. Investigation of body image, self-esteem, and quality of life in women with urinary incontinence. Int. J. Nurs. Pr. 2019, 25, e12762. [Google Scholar] [CrossRef]
- Li, F.L.W.; Le Low, L.P.; Lee, D.T. Chinese women’s experiences in coping with urinary incontinence. J. Clin. Nurs. 2007, 16, 610–612. [Google Scholar] [CrossRef]
- Tang, D.H.; Colayco, D.C.; Piercy, J.; Patel, V.; Globe, D.; Chancellor, M.B. Impact of urinary incontinence on health-related quality of life, daily activities, and healthcare resource utilization in patients with neurogenic detrusor overactivity. BMC Neurol. 2014, 14, 74. [Google Scholar] [CrossRef] [Green Version]
- Kiviniemi, K.; Suominen, T. ‘Going to the bathroom four or five times a night… ’: Seven men talk about their experiences of benign prostatic hyperplasia and the perioperative period. J. Clin. Nurs. 1999, 8, 542–549. [Google Scholar] [CrossRef]
- Townsend, M.K.; Lajous, M.; Medina-Campos, R.H.; Catzin-Kuhlmann, A.; López-Ridaura, R.; Rice, M.S. Risk factors for urinary incontinence among postmenopausal Mexican women. Int. Urogynecol. J. 2016, 28, 769–776. [Google Scholar] [CrossRef] [PubMed]
- Wan, X.; Wang, C.; Xu, D.; Guan, X.; Sun, T.; Wang, K. Disease stigma and its mediating effect on the relationship between symptom severity and quality of life among community-dwelling women with stress urinary incontinence: A study from a Chinese city. J. Clin. Nurs. 2014, 23, 2170–2180. [Google Scholar] [CrossRef] [PubMed]
- Senra, C.; Pereira, M.G. Quality of life in women with urinary incontinence. Rev. Assoc. Médica Bras. 2015, 61, 178–183. [Google Scholar] [CrossRef] [PubMed]
- Weber, B.A.; Roberts, B.L.; Resnick, M.; Deimling, G.; Zauszniewski, J.A.; Musil, C.; Yarandi, H.N. The effect of dyadic intervention on self-efficacy, social support, and depression for men with prostate cancer. Psycho-Oncology 2004, 13, 47–60. [Google Scholar] [CrossRef]
- Lim, R.; Liong, M.L.; Leong, W.S.; Khan, N.A.K.; Yuen, K.H. Effect of Stress Urinary Incontinence on the Sexual Function of Couples and the Quality of Life of Patients. J. Urol. 2016, 196, 153–158. [Google Scholar] [CrossRef]
- Gotoh, M. Quality of life assessment for patients with urinary incontinence. Nagoya J. Med Sci. 2007, 69, 123–131. [Google Scholar]
- Lim, R.; Liong, M.L.; Lim, K.K.; Leong, W.S.; Yuen, K.H. The Minimum Clinically Important Difference of the International Consultation on Incontinence Questionnaires (ICIQ-UI SF and ICIQ-LUTSqol). Urology 2019, 133, 91–95. [Google Scholar] [CrossRef]
- Aylaz, R.; Isik, K.; Bayir, B.; Yetis, G. The effect of urinary incontinence on quality of life in women 65 years and older. Ulnonu Univ. Saglik Bilimleri Dergisi 2016, 5, 19–25. [Google Scholar]
- Kurt, E.; Özdilli, K.; Yorulmaz, H. Romatoid Artrit’ li Hastalarda Beden İmajı ve Benlik Saygısı. Arch. Neuropsychiatry 2013, 50, 202–208. [Google Scholar] [CrossRef] [Green Version]
- Yan, W.; Li, X.; Sun, S.; Xiang, Y.; Zhou, Y.; Zeng, X.; Xie, F.; Jiang, H.; Liu, Q.; Xiang, J. Risk factors for female pelvic organ prolapse and urinary incontinence. Zhong Nan Da Xue Xue Bao Yi Xue Ban 2018, 43, 1345–1350. [Google Scholar]
- Tsui, A.; Kuh, D.; Cardozo, L.; Davis, D. Vascular risk factors for male and female urgency urinary incontinence at age 68 years from a British birth cohort study. BJU Int. 2018, 122, 118–125. [Google Scholar] [CrossRef] [PubMed] [Green Version]
- Nitti, V.W.; Mourtzinos, A.; Brucker, B.M. SUFU Pad Test Study Group Correlation of Patient Perception of Pad Use with Objective Degree of Incontinence Measured by Pad Test in Men with Post-Prostatectomy Incontinence: The SUFU Pad Test Study. J. Urol. 2014, 192, 836–842. [Google Scholar] [CrossRef] [PubMed]
- Getliffe, K.; Fader, M.; Cottenden, A.; Jamieson, K.; Green, N. Absorbent products for incontinence: ‘treatment effects’ and impact on quality of life. J. Clin. Nurs. 2007, 16, 1936–1945. [Google Scholar] [CrossRef] [PubMed]
- Barentsen, J.A.; Visser, E.; Hofstetter, H.; Maris, A.M.; Dekker, J.H.; De Bock, G.H. Severity, not type, is the main predictor of decreased quality of life in elderly women with urinary incontinence: A population-based study as part of a randomized controlled trial in primary care. Health Qual. Life Outcomes 2012, 10, 153. [Google Scholar] [CrossRef] [PubMed] [Green Version]
- Kralik, D.; Seymour, L.; Eastwood, S.; Koch, T. Managing the self: Living with an indwelling urinary catheter. J. Clin. Nurs. 2007, 16, 177–185. [Google Scholar] [CrossRef]
- Sacco, E.; Bientinesi, R.; Gandi, C.; Palermo, G.; Pierconti, F.; Bassi, P. Objectively improving appropriateness of absorbent products provision to patients with urinary incontinence: The DIAPPER study. Neurourol. Urodyn. 2017, 37, 485–495. [Google Scholar] [CrossRef]
- Sacco, E.; Bientinesi, R.; Gandi, C.; Di Gianfrancesco, L.; Pierconti, F.; Racioppi, M.; Bassi, P. Patient pad count is a poor measure of urinary incontinence compared with 48-h pad test: Results of a large-scale multicentre study. BJU Int. 2018, 123, E69–E78. [Google Scholar] [CrossRef]
- Rubilotta, E.; Balzarro, M.; D’Amico, A.; Cerruto, M.A.; Bassi, S.; Bovo, C.; Iacovelli, V.; Bianchi, D.; Artibani, W.; Agrò, E.F. Pure stress urinary incontinence: Analysis of prevalence, estimation of costs, and financial impact. BMC Urol. 2019, 19, 44. [Google Scholar] [CrossRef] [Green Version]
- Moore, C.K. The Impact of Urinary Incontinence and Its Treatment on Female Sexual Function. Curr. Urol. Rep. 2010, 11, 299–303. [Google Scholar] [CrossRef]
- Mallah, F.; Montazeri, A.; Ghanbari, Z.; Tavoli, A.; Haghollahi, F.; Aziminekoo, E. Effect of Urinary Incontinence on Quality of Life among Iranian Women. J. Fam. Reprod. Health 2014, 8, 13–19. [Google Scholar]
- Minassian, V.A.; Devore, E.; Hagan, K.; Grodstein, F. Severity of Urinary Incontinence and Effect on Quality of Life in Women by Incontinence Type. Obstet. Gynecol. 2013, 121, 1083–1090. [Google Scholar] [CrossRef] [PubMed] [Green Version]
- Hay-Smith, E.J.C.; Mac Habée-Séguin, G. Pelvic floor muscle training versus no treatment, or inactive control treatments, for urinary incontinence in women. Cochrane Database Syst. Rev. 2014, CD005654. [Google Scholar] [CrossRef]
- Ghaderi, F.; Oskouei, A.E. Physiotherapy for Women with Stress Urinary Incontinence: A Review Article. J. Phys. Ther. Sci. 2014, 26, 1493–1499. [Google Scholar] [CrossRef] [PubMed] [Green Version]
- Fitz, F.F.; Gimenez, M.M.; Ferreira, L.D.A.; Matias, M.M.P.; Bortolini, M.A.T.; Castro, R.A. Pelvic floor muscle training for female stress urinary incontinence: A randomised control trial comparing home and outpatient training. Int. Urogynecol. J. 2019, 31, 989–998. [Google Scholar] [CrossRef]
- Yang, S.; Sang, W.; Feng, J.; Zhao, H.; Li, X.; Li, P.; Fan, H.; Tang, Z.; Gao, L. The effect of rehabilitation exercises combined with direct vagina low voltage low frequency electric stimulation on pelvic nerve electrophysiology and tissue function in primiparous women: A randomised controlled trial. J. Clin. Nurs. 2017, 26, 4537–4547. [Google Scholar] [CrossRef]
- Demir, G.; Erbesler, Z.A. Quality of life and factors associated with it in elderly women with urinary incontinence. Turk. J. Geriatr. 2017, 20, 213–222. [Google Scholar]
- Bogner, H.R.; Gallo, J.J.; Sammel, M.D.; Ford, D.E.; Armenian, H.K.; Eaton, W.W. Urinary Incontinence and Psychological Distress in Community-Dwelling Older Adults. J. Am. Geriatr. Soc. 2002, 50, 489–495. [Google Scholar] [CrossRef] [Green Version]
- Balzarro, M.; Rubilotta, E.; Goss, C.; Costantini, E.; Artibani, W.; Sand, P. Counseling in urogynecology: A difficult task, or simply good surgeon–patient communication? Int. Urogynecol. J. 2018, 29, 943–948. [Google Scholar] [CrossRef]


| Demographic and Clinical Characteristics | N (%) |
|---|---|
| Age (years) (Mean, SD) | 65.32 (DS 17.89) |
| Sex (female) | 15 (60) |
| Women who gave birth (nulliparous) | 13 (13.3) |
| Body Mass Index (Mean, SD) | 30.55 (DS 5.97) |
| Workers (unemployed) | 4 (84) |
| Education: | |
| Primary | 18 (72) |
| Secondary | 3 (12) |
| High | 3 (12) |
| Higher | 1 (4) |
| Physical activity (yes) | 1 (4) |
| Medical comorbidity (present) | 19 (76) |
| Deambulation autonomy (absent) | 3 (12) |
| Incontinence type: | |
| Stress | 1 (4) |
| Urgency | 5 (20) |
| Mixed | 14 (56) |
| Overflow | 5 (20) |
| Functional | 0 |
| Further Clinical Characteristics | N | % |
|---|---|---|
| For how long has he/she been suffering from UI symptoms? | ||
| Few weeks | 0 | 0 |
| Less than a year | 0 | 0 |
| Just over 1 year | 7 | 28 |
| Between 2 and 5 years | 8 | 32 |
| More than five years | 10 | 40 |
| Daily changes (24h): | ||
| 1 | 2 | 8 |
| 2 | 5 | 20 |
| 3 | 7 | 28 |
| More than 3 | 11 | 44 |
| How often he/she uses bathroom per day (24 h): | ||
| Less than 6 | 2 | 8 |
| From 6 to 10 times | 12 | 48 |
| From 10 to 15 times | 5 | 20 |
| More than 15 times | 6 | 24 |
| UI aids used: | ||
| None | 6 | 24 |
| Traverse | 1 | 4 |
| Absorbent | 14 | 56 |
| Diaper | 8 | 32 |
| Catheter | 1 | 4 |
| Adverse drugs taken by patients with urinary incontinence: | ||
| Diuretics | 16 | 64 |
| Laxatives | 4 | 16 |
| Sedatives | 6 | 24 |
| Muscle relaxants | 1 | 4 |
| None | 6 | 24 |
| Scales and Domains | Mean ± SD | Mi | Ma | Severity | Tot. QOL | The Being | The Belonging | The Becoming | |||||
|---|---|---|---|---|---|---|---|---|---|---|---|---|---|
| r | p | r | p | r | p | r | p | r | p | ||||
| Severity | 17.6 ± 4.36 | 7 | 23 | - | 0.25 | 0.40 | 0.17 | 0.42 | 0.14 | 0.51 | 0.02 | 0.93 | |
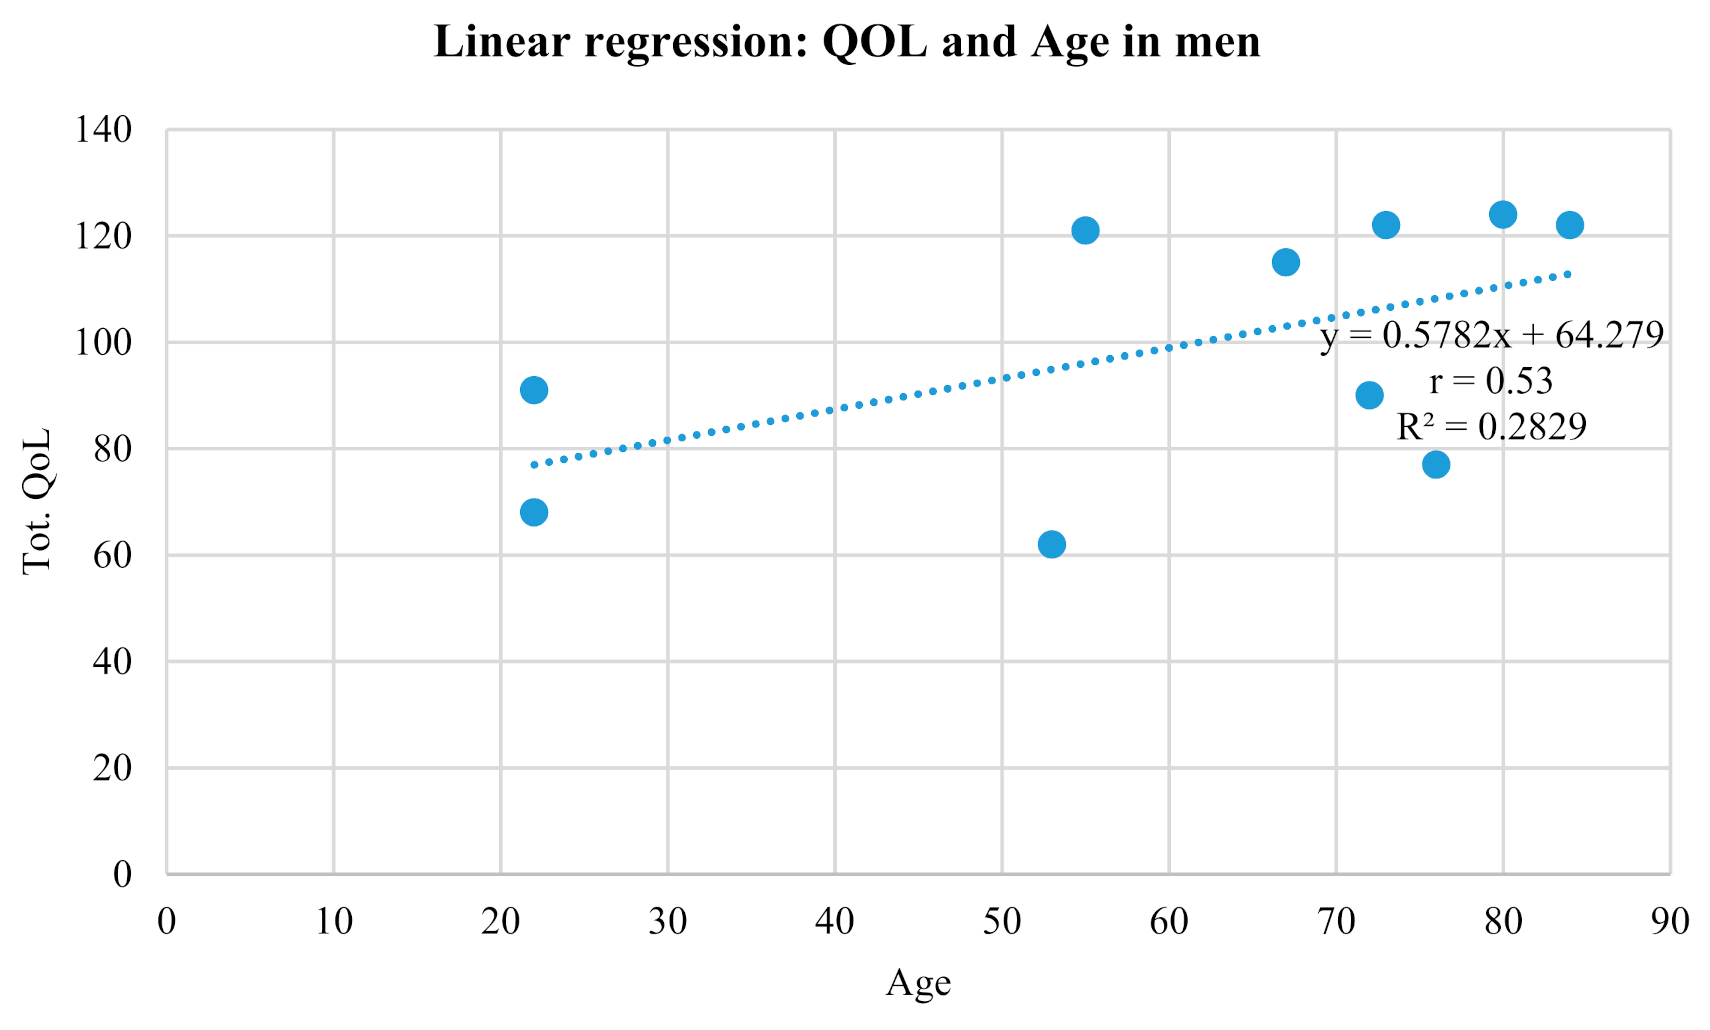
| Age | 65.32 ± 17.89 | 22 | 87 | 0.59 | 0.001 * | 0.13 | 0.52 | 0.17 | 0.41 | 0.04 | 0.84 | 0.16 | 0.45 |
| BMI | 30.55 ± 5.92 | 20 | 40.2 | 0.58 | 0.002 * | 0.08 | 0.69 | 0.07 | 0.74 | 0.17 | 0.41 | 0.17 | 0.40 |
| Tot QoL | 91.24 ± 20.11 | 58 | 124 | 0.25 | 0.40 | - | - | - | - | ||||
| Being | 47.52 ± 8.61 | 33 | 61 | 0.17 | 0.42 | - | - | - | - | ||||
| Belonging | 20.52 ± 7.71 | 10 | 34 | 0.14 | 0.51 | - | - | - | - | ||||
| Becoming | 23.2 ± 5.53 | 14 | 33 | 0.02 | 0.93 | - | - | - | - | ||||
| Variables | N | % | Severity | Tot. QOL | ||
|---|---|---|---|---|---|---|
| Sex | ||||||
| Male | 10 | 40 | 15.8 ± 5.41 | U = 50 | 99.2 ± 24.45 | U = 50.5 |
| Female | 15 | 60 | 18.8 ± 3.14 | p = 0.174 | 85.93 ± 15.29 | p = 0.183 |
| Age | ||||||
| <70 | 12 | 48 | 16 ± 5.20 | U = 57 | 90.33 ± 19.12 | U = 72.5 |
| >70 | 13 | 52 | 19.08 ± 2.87 | p = 0.262 | 92.07 ± 21.74 | p = 0.787 |
| Education | ||||||
| Primary | 18 | 72 | 18.5 ± 3.84 | U = 38 | 96.5 ± 19.28 | U = 28 |
| >Primary | 7 | 28 | 15.28 ± 5.06 | p = 0.138 | 77.14 ± 16.4 | p = 0.036 * |
| Body Mass Index (BMI) | ||||||
| Regular <25 | 5 | 20 | 14 ± 5.29 | K = 9.47 | 83 ± 20.61 | K = 2.19 |
| Overweight | 7 | 28 | 15.43 ± 4.24 | p = 0.008 * | 102.28 ± 23.58 | p = 0.317 |
| Obese >30 | 13 | 52 | 20.15 ± 2.11 | 88.46 ± 16.78 | ||
| Comorbidity | ||||||
| Present | 19 | 76 | 18.89 ± 3.09 | U = 24 | 93.73 ± 19.73 | U = 39.5 |
| Absent | 6 | 24 | 13.5 ± 5.5 | p = 0.038 * | 83.33 ± 21.01 | p = 0.280 |
| Childbirths number | ||||||
| 1–3 | 5 | 20 | 20.2 ± 1.30 | U = 45.5 | 90.2 ± 13.46 | U = 9 |
| +3 | 7 | 28 | 19.14 ± 3.85 | p = 0.810 | 78.28 ± 12.34 | p = 0.193 |
| Pelvic floor rehabilitation | ||||||
| Yes | 6 | 24 | 16.33 ± 5 | U = 41.5 | 114.67 ± 12.29 | U = 8 |
| No | 19 | 76 | 18 ± 4.20 | p = 0.954 | 83.84 ± 16.02 | p = 0.002 * |
| Types of incontinence | ||||||
| Urgency | 5 | 20 | 14.6 ± 6.10 | K = 4.53 | 94.6 ± 15.88 | K = 5.35 |
| Mixed | 14 | 56 | 19.21 ± 3.26 | p = 0.103 | 84.78 ± 16.50 | p = 0.068 |
| Overflow | 5 | 20 | 17 ± 4 | 110.6 ± 22.95 | ||
| For how long has he/she been suffering? | ||||||
| >1 year | 7 | 28 | 18.14 ± 5.05 | K = 5.76 | 88.14 ± 10.97 | K = 0.28 |
| >2 <5 years | 8 | 32 | 15.37 ± 3.29 | p = 0.055 | 90 ± 28.33 | p = 0.865 |
| >5 years | 10 | 40 | 19 ± 4.29 | 94.4 ± 18.83 | ||
| Daily changes (24 h) | ||||||
| 2 | 5 | 20 | 15.6 ± 3.36 | K = 5.64 | 82.6 ± 16.77 | K = 0.91 |
| 3 | 7 | 28 | 18.43 ± 2.99 | p = 0.059 | 91.28 ± 25.08 | p = 0.634 |
| More than 3 | 11 | 44 | 19.73 ± 3.10 | 92.45 ± 18.8 | ||
| How often he/she uses bathroom per day (24 h) | ||||||
| 6–10 times | 12 | 48 | 17.66 ± 3.20 | K = 1.02 | 89.66 ± 21.96 | K = 0.31 |
| 10–15 times | 5 | 20 | 19.6 ± 2.96 | p = 0.600 | 97.4 ± 23.98 | p = 0.853 |
| >15 times | 6 | 24 | 16.5 ± 6.80 | 92 ± 16.78 | ||
| Use of aids | ||||||
| No | 6 | 24 | 13.16 ± 5.6 | U = 22.5 | 82.33 ± 21.31 | U = 33.5 |
| Yes | 19 | 76 | 19 ± 2.83 | p = 0.030 * | 94.05 ± 19.45 | p = 0.144 |
| Use of diuretics | ||||||
| No | 9 | 36 | 14.33 ± 4.62 | U = 24 | 85.44 ± 18.17 | U = 54.5 |
| Yes | 16 | 64 | 19.44 ± 3.01 | p = 007 * | 94.5 ± 20.97 | p = 0.337 |
| Use of sedatives | ||||||
| No | 19 | 76 | 16.89 ± 4.71 | U = 42.5 | 91.26 ± 18.61 | U = 56 |
| Yes | 6 | 24 | 19.83 ± 1.83 | p = 0.373 | 91.17 ± 26.35 | p = 0.976 |
| Classes | Severity | Tot. QOL | The Being | The Belonging | The Becoming | ||||||||||
|---|---|---|---|---|---|---|---|---|---|---|---|---|---|---|---|
| Range | N | % | Range | N | % | Range | N | % | Range | N | % | Range | N | % | |
| Total sample N = 25% = calculated on total sample | |||||||||||||||
| Slight | 5–10 | 2 | 8 | 30–65 | 2 | 8 | 17–34 | 3 | 12 | 9–18 | 13 | 52 | 9–18 | 6 | 24 |
| Mild | 11–20 | 15 | 60 | 66–100 | 15 | 60 | 35–51 | 14 | 56 | 19–27 | 6 | 24 | 19–27 | 13 | 52 |
| Severe | 21–32 | 8 | 32 | 101–140 | 8 | 32 | 52–68 | 8 | 32 | 28–36 | 6 | 24 | 28–36 | 6 | 24 |
| Men N = 10% = calculated on male sample | |||||||||||||||
| Slight | 21–32 | 2 | 20 | 30–65 | 1 | 10 | 17–34 | 2 | 20 | 9–18 | 3 | 30 | 9–18 | 1 | 10 |
| Mild | 11–20 | 6 | 60 | 66–100 | 4 | 40 | 35–51 | 3 | 30 | 19–27 | 2 | 20 | 19–27 | 4 | 40 |
| Severe | 21–32 | 2 | 20 | 101–140 | 5 | 50 | 52–68 | 5 | 50 | 28–36 | 5 | 50 | 28–36 | 5 | 50 |
| Women N = 15% = calculated on female sample | |||||||||||||||
| Slight | 5–10 | 0 | 0 | 30–65 | 1 | 6.6 | 17–34 | 1 | 6.6 | 9–18 | 10 | 66.6 | 9–18 | 5 | 33.3 |
| Mild | 11–20 | 9 | 60 | 66–100 | 11 | 73.3 | 35–51 | 11 | 73.3 | 19–27 | 4 | 26.6 | 19–27 | 9 | 60 |
| Severe | 21–32 | 6 | 40 | 101–140 | 3 | 20 | 52–68 | 3 | 20 | 28–36 | 1 | 6.6 | 28–36 | 1 | 6.6 |
| Variables | N | % | Being | Belonging | Becoming | |||
|---|---|---|---|---|---|---|---|---|
| Sex | ||||||||
| Male | 10 | 40 | 48.8 ± 10.99 | U = 62 | 24.4 ± 8.14 | U = 42.5 | 26 ± 6.05 | U = 39 |
| Female | 15 | 60 | 46.6 ± 6.88 | p = 0.490 | 17.93 ± 6.44 | p = 0.075 | 21.33 ± 4.42 | p = 0.048 * |
| Age | ||||||||
| <70 | 12 | 48 | 48.53 ± 8.74 | U = 69 | 19.66 ± 7.14 | U = 71.5 | 22.08 ± 4.83 | U = 60.5 |
| >70 | 13 | 52 | 46.54 ± 8.71 | p = 0.462 | 21.31 ± 8.42 | p = 0.326 | 24.23 ± 6.11 | p = 0.924 |
| Education | ||||||||
| Primary | 18 | 72 | 50.22 ± 7.60 | U = 24 p = 0.026 * | 21.88 ± 7.96 | U = 39.5 p = 0.164 | 24.38 ± 5.36 | U = 36 p = 0.109 |
| >Primary | 7 | 28 | 40.57 ± 7.37 | 17 ± 6.19 | 20.14 ± 5.08 | |||
| Body mass index (BMI) | ||||||||
| Regular <25 | 5 | 20 | 42.8 ± 8.10 | K = 2.87 | 19.2 ± 9.15 | K = 1.70 | 21 ± 6.12 | K = 2.79 |
| Overweight | 7 | 28 | 51.86 ± 8.99 | p = 0.238 | 24.14 ± 8.78 | p = 0.426 | 26.28 ± 5.99 | p = 0.248 |
| Obese >30 | 13 | 52 | 47 ± 8.08 | 19.08 ± 6.47 | 22.38 ± 4.73 | |||
| Comorbidity | ||||||||
| Present | 19 | 76 | 49.10 ± 8.03 | U = 33 | 20.79 ± 8.04 | U = 56 | 23.84 ± 5.65 | U = 42 |
| Absent | 6 | 24 | 42.5 ± 9.14 | p = 0.133 | 19.67 ± 7.2 | p = 0.976 | 21.17 ± 5.04 | p = 0.357 |
| Childbirths numbers | ||||||||
| 1–3 | 5 | 20 | 49.4 ± 5.77 | U = 11.5 | 19.4 ± 5.98 | U = 7.5 | 21.4 ± 3.43 | U = 11 |
| +3 | 7 | 28 | 44.23 ± 8.28 | p = 0.373 | 14.43 ± 2.64 | p = 0.123 | 19.43 ± 3.41 | p = 0.332 |
| Pelvic floor rehabilitation | ||||||||
| Yes | 6 | 24 | 55.17 ± 5.74 | U = 16 | 28.83 ± 4.21 | U = 8.5 | 29.67 ± 3.98 | U = 9 |
| No | 19 | 76 | 45.10 ± 7.99 | p = 0.009* | 17.58 ± 6.02 | p = 0.002* | 21.16 ± 4.25 | p = 0.002 * |
| Types of incontinence | ||||||||
| Urgency | 5 | 20 | 46 ± 7.81 | K = 4.12 | 23.8 ± 5.89 | K = 5.84 | 24.8 ± 3.35 | K = 6.20 |
| Mixed | 14 | 56 | 46.43 ± 7.53 | p = 0.127 | 17.36 ± 6.7 | p = 0.052 | 21 ± 4.77 | p = 0.044 * |
| Overflow | 5 | 20 | 54.8 ± 8.95 | 27.2 ± 8.04 | 28.6 ± 6.11 | |||
| For how long has he/she been suffering? | ||||||||
| >1 year | 7 | 28 | 46.14 ± 6.01 | K = 0.91 | 19.71 ± 5.44 | K = 0.04 | 22.28 ± 3.35 | K = 0.32 |
| >2 <5 years | 8 | 32 | 46 ± 12.22 | p = 0.634 | 20.75 ± 8.73 | p = 0.975 | 23.25 ± 7.57 | p = 0.850 |
| >5 years | 10 | 40 | 49.7 ± 6.96 | 20.9 ± 8.89 | 23.8 ± 5.33 | |||
| Daily changes (24 h) | ||||||||
| 2 | 5 | 20 | 42.6 ± 8.02 | K = 2.22 | 18.2 ± 4.32 | K = 0.11 | 21.8 ± 4.76 | K = 0.54 |
| 3 | 7 | 28 | 45.57 ± 9.41 | p = 0.328 | 21.43 ± 9.85 | p = 0.943 | 24.28 ± 6.68 | p = 0.762 |
| >3 | 11 | 44 | 50.09 ± 8.12 | 19.72 ± 7.58 | 22.63 ± 5.54 | |||
| How often he/she uses bathroom per day (24 h) | ||||||||
| 6–10 times | 12 | 48 | 45.33 ± 9.53 | K = 1.37 | 21.25 ± 8 | K = 0.20 | 23.08 ± 6.04 | K = 1.87 |
| 10–15 times | 5 | 20 | 49.8 ± 9.2 | p = 0.503 | 21.4 ± 8.99 | p = 0.901 | 26.2 ± 6.06 | p = 0.391 |
| >15 times | 6 | 24 | 50.17 ± 6.11 | 19.5 ± 8.9 | 22.33 ± 4.46 | |||
| Use of aids | ||||||||
| No | 6 | 24 | 42.67 ± 9.02 | U = 34 | 18.33 ± 7.94 | U = 45 | 21.33 ± 5.08 | U = 44 |
| Yes | 19 | 76 | 49.05 ± 8.11 | p = 0.152 | 21.21 ± 7.73 | p = 0.465 | 23.79 ± 5.66 | p = 0.423 |
| Use of diuretics | ||||||||
| No | 9 | 36 | 44.66 ± 8.09 | U = 54 | 19 ± 6.7 | U = 32.5 | 21.77 ± 4.68 | U = 57 |
| Yes | 16 | 64 | 49.12 ± 8.72 | p = 0.322 | 21.37 ± 8.31 | p = 0.610 | 24 ± 5.94 | p = 0.412 |
| Use of sedatives | ||||||||
| No | 19 | 76 | 47.68 ± 8.33 | U = 55 | 20.47 ± 7.26 | U = 53.5 | 23.1 ± 5.17 | U = 55.5 |
| Yes | 6 | 24 | 47 ± 10.26 | p = 0.920 | 20.67 ± 9.79 | p = 0.849 | 23.5 ± 7.09 | p = 0.952 |
Publisher’s Note: MDPI stays neutral with regard to jurisdictional claims in published maps and institutional affiliations. |
© 2020 by the authors. Licensee MDPI, Basel, Switzerland. This article is an open access article distributed under the terms and conditions of the Creative Commons Attribution (CC BY) license (http://creativecommons.org/licenses/by/4.0/).
Share and Cite
Corrado, B.; Giardulli, B.; Polito, F.; Aprea, S.; Lanzano, M.; Dodaro, C. The Impact of Urinary Incontinence on Quality of Life: A Cross-Sectional Study in the Metropolitan City of Naples. Geriatrics 2020, 5, 96. https://0-doi-org.brum.beds.ac.uk/10.3390/geriatrics5040096
Corrado B, Giardulli B, Polito F, Aprea S, Lanzano M, Dodaro C. The Impact of Urinary Incontinence on Quality of Life: A Cross-Sectional Study in the Metropolitan City of Naples. Geriatrics. 2020; 5(4):96. https://0-doi-org.brum.beds.ac.uk/10.3390/geriatrics5040096
Chicago/Turabian StyleCorrado, Bruno, Benedetto Giardulli, Francesco Polito, Salvatore Aprea, Mariangela Lanzano, and Concetta Dodaro. 2020. "The Impact of Urinary Incontinence on Quality of Life: A Cross-Sectional Study in the Metropolitan City of Naples" Geriatrics 5, no. 4: 96. https://0-doi-org.brum.beds.ac.uk/10.3390/geriatrics5040096