Article

Who Is the Most Vulnerable to Anxiety at the Beginning of the COVID-19 Outbreak in China? A Cross-Sectional Nationwide Survey

Department of Laboratorial Science and Technology & Vaccine Research Center, School of Public Health, Peking University, Beijing 100191, China
*
Author to whom correspondence should be addressed.
Submission received: 24 April 2021 / Revised: 11 June 2021 / Accepted: 15 June 2021 / Published: 30 July 2021
(This article belongs to the Special Issue Mental Health and Coping During COVID-19)

Abstract

:
(1) Background: The COVID-19 pandemic has not only changed people’s health behavior, but also induced a psychological reaction among the public. Research data is needed to develop scientific evidence-driven strategies to reduce adverse mental health effects. The aims of this study are to evaluate the anxiety reaction of Chinese people and the related determinants during the earliest phase of the COVID-19 outbreak in China. Evidence from this survey will contribute to a targeted reference on how to deliver psychological counseling service in the face of outbreaks. (2) Methods: A cross-sectional, population-based online survey was conducted from 28 January to 5 February 2020 using an open online questionnaire for people aged 18 years or above, residing in China and abroad. The socio-demographic information of the respondents was collected, and anxiety scores were calculated. A direct standardization method was used to standardize anxiety scores and a general linear model was used to identify associations between some factors (e.g., sex, age, education, etc.) and anxiety scores. (3) Results: A total of 10,946 eligible participants were recruited in this study, with a completion rate of 98.16% (10,946/11,151). The average anxiety score was 6.46 ± 4.12 (total score = 15); women (6.86 ± 4.11) scored higher than men (5.67 ± 4.04). The age variable was inversely and significantly associated with the anxiety score (β = −2.12, 95% CI: −2.47–−1.78). People possessing higher education (β = 1.15, 95% CI: 0.88–1.41) or a higher awareness of cognitive risk (β = 4.89, 95% CI: 4.33–5.46) reported higher levels of anxiety. There was a close association between poor subjective health and anxiety status (β = 2.83, 95% CI: 2.58–3.09). With the increase of confidence, the anxiety of the population exhibited a gradual decline (β = −2.45, 95% CI: −2.77–−2.13). (4) Conclusion: Most people were vulnerable to anxiety during the earliest phase of the COVID-19 outbreak in China. Younger women, individuals with high education, people with high cognitive risk and subjective poor health were vulnerable to anxiety during the epidemic. In addition, increasing confidence in resisting this pandemic is a protective determinant for individuals to develop anxiety. The findings suggest that policymakers adopt psychosocial interventions to reduce anxiety during the pandemic.

1. Introduction

COVID-19 has spread worldwide and created an unprecedented crisis [1]. The World Health Organization (WHO) declared the pandemic as a Public Health Emergency of International Concern on 30 January 2020 [2]. As of 28 January 2020, when this study was conducted, the COVID-19 virus had infected 5974 people in Mainland China; as of 1 February 2020, there were 14,380 cases of infection that had been reported [3]. As the novel coronavirus was highly contagious in nature, it created global fear. By the end of June 2020, more than ten million confirmed COVID-19 cases had been detected in 216 countries, territories, and areas, and more than 500,000 deaths had been reported [4]. The large number of patient deaths and stressful situations caused by the pandemic led to warnings being issued to society.
Anxiety in the general population is currently a major public health concern [5]. Widespread anxiety and distress can cause serious social and economic disruption during pandemics [6]. Negative emotions can cause behavioral changes such as being afraid to leave the house and continuously disinfecting the environment [7]. The lessons learned from experiences with the severe acute respiratory syndrome (SARS) [8,9,10], pandemic influenza A (H1N1) [11,12,13], and influenza A (H7N9) [14,15] in various culture settings demonstrate that attention must also be paid to mental health as part of the COVID-19 epidemic prevention and control. Cultural differences, disease perceptions, government involvement, and the stage of the outbreak are associated with public response, and these factors vary by disease and settings [16,17,18]. In the early phase of the pandemic, the lack of knowledge on the virus and the absence of valid information easily caused universal anxiety and panic among the general population [19]. Examining the general population’s psychological response during the initial phase of an emerging epidemic is useful for keeping both policy makers and the public informed about the state of preparedness. With COVID-19 contributing to increasingly difficult circumstances and amplified grief reactions, many individuals are prone to experiencing more mental health and psycho-social problems [20]. An indefinite period coupled with stressful situations lead to anxiety in people, which is exacerbated by internet rumors and misinformation about the pandemic. In fact, the onslaught of this “infodemic” has led to greater fear and worry among the population [21]. Thus, pessimism towards any kind of information can have negative psychological effects, easily leading to public cognitive risk, which is an inherent feature in all human cognitive activity, as well as an index that can measure the psychological panic of the public. Previous studies have suggested that people with higher risk perceptions were more likely to take comprehensive precautionary measures against infection [21,22]. At the same time, risk cognition also affects public psychology states. Excessive risk cognition increases the likelihood of an array of negative emotions, including anxiety and panic [23].
People worldwide may be particularly vulnerable to the adverse mental health effects caused by a lockdown, shielding, self-isolation, and physical distancing measures due to the COVID-19 pandemic. Anxiety, worry, and panic increased and became widespread during the epidemic and remained high in the post-outbreak period. Previous studies on SARS and H1N1 in different countries suggested that widespread anxiety and distress occurred in both the affected areas and the overall population [6]. Recent studies have reported that symptoms of anxiety and depression (16–28%) and self-reported stress (8%) are common mental issues during the COVID-19 pandemic [24]. Other research has examined different fields of mental health such as population anxiety, the psychological impact of quarantine, anxiety in medical workers fighting COVID-19, and anxiety caused by countrywide quarantine [25,26]. Subsyndromal mental health problems are a common repercussion during the COVID-19 pandemic [27]. There is accumulating evidence suggesting that investigating the level of anxiety in individuals and identifying the factors of anxiety can help scholars and practitioners clearly comprehend the severity of the pandemic’s effect and improve the effectiveness of health risk communications [28,29]. The aim of this study is to evaluate the anxiety reaction of Chinese people and the related determinants during the earliest phase of COVID-19 outbreak in China. Targeted interventions and psychological consultation services can thus be provided based on the scientific evidence for the target population.

2. Materials and Methods

2.1. Study Population

A cross-sectional, population-based online survey was conducted from 28 January to 5 February 2020. It was an open online questionnaire for people aged 18 years and above, residing in China and abroad. Everyone who saw it and was willing to respond could complete the questionnaire using mobile phones or computers.

2.2. Measures

We designed a structured Chinese questionnaire and collected data on Wenjuanxing, an online platform providing functions equivalent to Amazon Mechanical Turk. Through the questionnaire, we collected the following information: (1) the socio-demographic information of the respondents; (2) anxiety reaction towards COVID-19; (3) subjective health; (4) awareness of cognitive risk; and (5) confidence in combatting the COVID-19 pandemic.

2.2.1. Socio-Demographic Variables

The demographic information collected included age, sex, marriage, education, occupation, area/province, family members, residence. Contact history variables included close contact with an individual with confirmed COVID-19, indirect contact with an individual with confirmed COVID-19, and contact with an individual with suspected COVID-19 or infected materials.

2.2.2. Anxiety Reaction towards COVID-19

Participants’ anxiety reaction was measured via 5-item short forms of the State scale of the Spielberger State–Trait Anxiety Inventory (STAIS-5) and adjusted to adapt to the Chinese context [30]. Participants answered each item on a 4-point scale (from 0 to 3 points). The total anxiety score was divided into normal (0–6), mild anxiety (7–9), moderate anxiety (10–13), and severe anxiety (14–15). Someone scoring ≥10 on the STAIS-5 should be considered potentially clinically anxious [30]. The internal reliability (α) was 0.877.

2.2.3. Subjective Health Status

Subjective health status was measured via one item: “How would you define your health status?” Health status was divided into four categories, ranging from 1 to 4, with 1 = unhealthy, 2 = ordinary, 3 = good health, and 4 = very healthy.

2.2.4. Cognitive Risk

Cognitive risk was assessed based on previous studies conducted among the general public [31], with one item examining how likely participants thought it was that they would contract the virus: “How likely do you think it is that you will get COVID-19?” Risks were divided into five categories ranging from 1 to 5, with 1 = no risk, 2 = low risk, 3 = medium risk, 4 = high risk, and 5 = extremely high risk.

2.2.5. Confidence

Participants’ confidence was measured via one item: “How confident are you about combatting the COVID-19 pandemic?” Confidence was divided into five categories, ranging from 1 to 5, with 1 = very unconfident, 2 = unconfident, 3 = somewhat confident, 4 = confident, 5 = very confident.

2.3. Data Management and Statistical Analysis

We used SPSS (version 20.0, IBM, New York, NY, USA) and STATA (version 15.1, Stata Corp LLC, College Station, Texas, TX, USA) for data cleaning and statistical analysis. Categorical variables were expressed as absolute and relative frequencies in different groups. We standardized anxiety scores to improve comparability among provinces by adjusting for age and education. Tests comparing demographic variables among anxiety score categories were performed using a two-tailed t-test for continuous variables and the Pearson c2 test for categorical variables. The general linear model (GLM) was used to analyze associations between socio-demographic factors, cognitive risk, confidence, and anxiety scores, adjusted respectively. The β values and their 95% confidence intervals (CI) were calculated as estimates of the correlations. All p values were 2-sided and p < 0.05 was considered statistically significant. A dose-response analysis with curve fitting was conducted using Empower (R) (Empowerstats.X&Y solutions Inc., Boston, MA, USA). The spatial data analyses were conducted using ArcGIS (version 10.2, ESRI Corp, Redlands, CA, USA).

2.4. Quality Control

We monitored the progress of the survey daily. After the collection, we checked the accuracy of data, and excluded the questionnaire if (1) the age range was below 18; (2) the answering time was less than 150 s; and (3) there was logical contradiction between the answers to the questionnaire. All data were checked for consistency by two members.

2.5. Ethical Approval

This study was approved as an ethical exemption by the Peking University Health Science Center Ethics Committee (IRB00001052). All subjects participated in the survey voluntarily, and the information in the database was completely de-identified.

3. Results

3.1. Participants and Characteristics

A total of 11,151 individuals participated in this online survey. Among these, 205 were excluded due to the fact that they were out of the age range or provided incomplete questionnaires, and the rate of completeness was 98.16%. Among the 10,946 eligible participants, 176 (1.61%) were from Hubei province, 10,552 (96.40%) were from other provinces in China (mainly from Beijing, Shandong, Sichuan, Hainan, Guangxi, etc.), and 218 (1.99%) were from abroad (Figure 1). Table 1 shows the socio-demographic characteristics of the participants.
We found that nearly half of the participants had varying levels of anxiety; 4.17% (457) had severe anxiety, 23.82% (2608) had moderate anxiety, and 21.84% (2391) had mild anxiety. Tests of the group differences through multivariate analyses of variance revealed the following: participants with severe anxiety were more likely to be younger female, unmarried, have a bachelor’s degree or higher, and have a less healthy condition as compared to those with mild or moderate anxiety (p < 0.001) (Table 1). Based on the standardized anxiety scores, we found that people in Hubei province, which was the epicenter of this disease in China, were the most anxious, followed by those living in Shanghai, Beijing, and Zhejiang (Figure 2).

3.2. The Association between Age and Anxiety Score

Table 2 shows the association between age and anxiety score from the GLM analysis. As age increased, the anxiety of the population gradually decreased in the sex/marriage-adjusted model (β = −2.15, 95% CI: −2.46–−1.84). Anxiety was highest in those younger than 30 years old. In addition, there was a close relation of age to anxiety scores after adjusting for other factors affecting anxiety in a multivariate model (β = −2.12, 95% CI: −2.47–−1.78). Overall, the age variable was inversely and significantly associated with the anxiety score. The p value for trend was < 0.001.
In the analyses stratified by hierarchy (Appendix A Table A1), the results show that the anxiety score of females was much higher than that of males. An inverse association of age with the anxiety score was consistently present in the sex hierarchies.

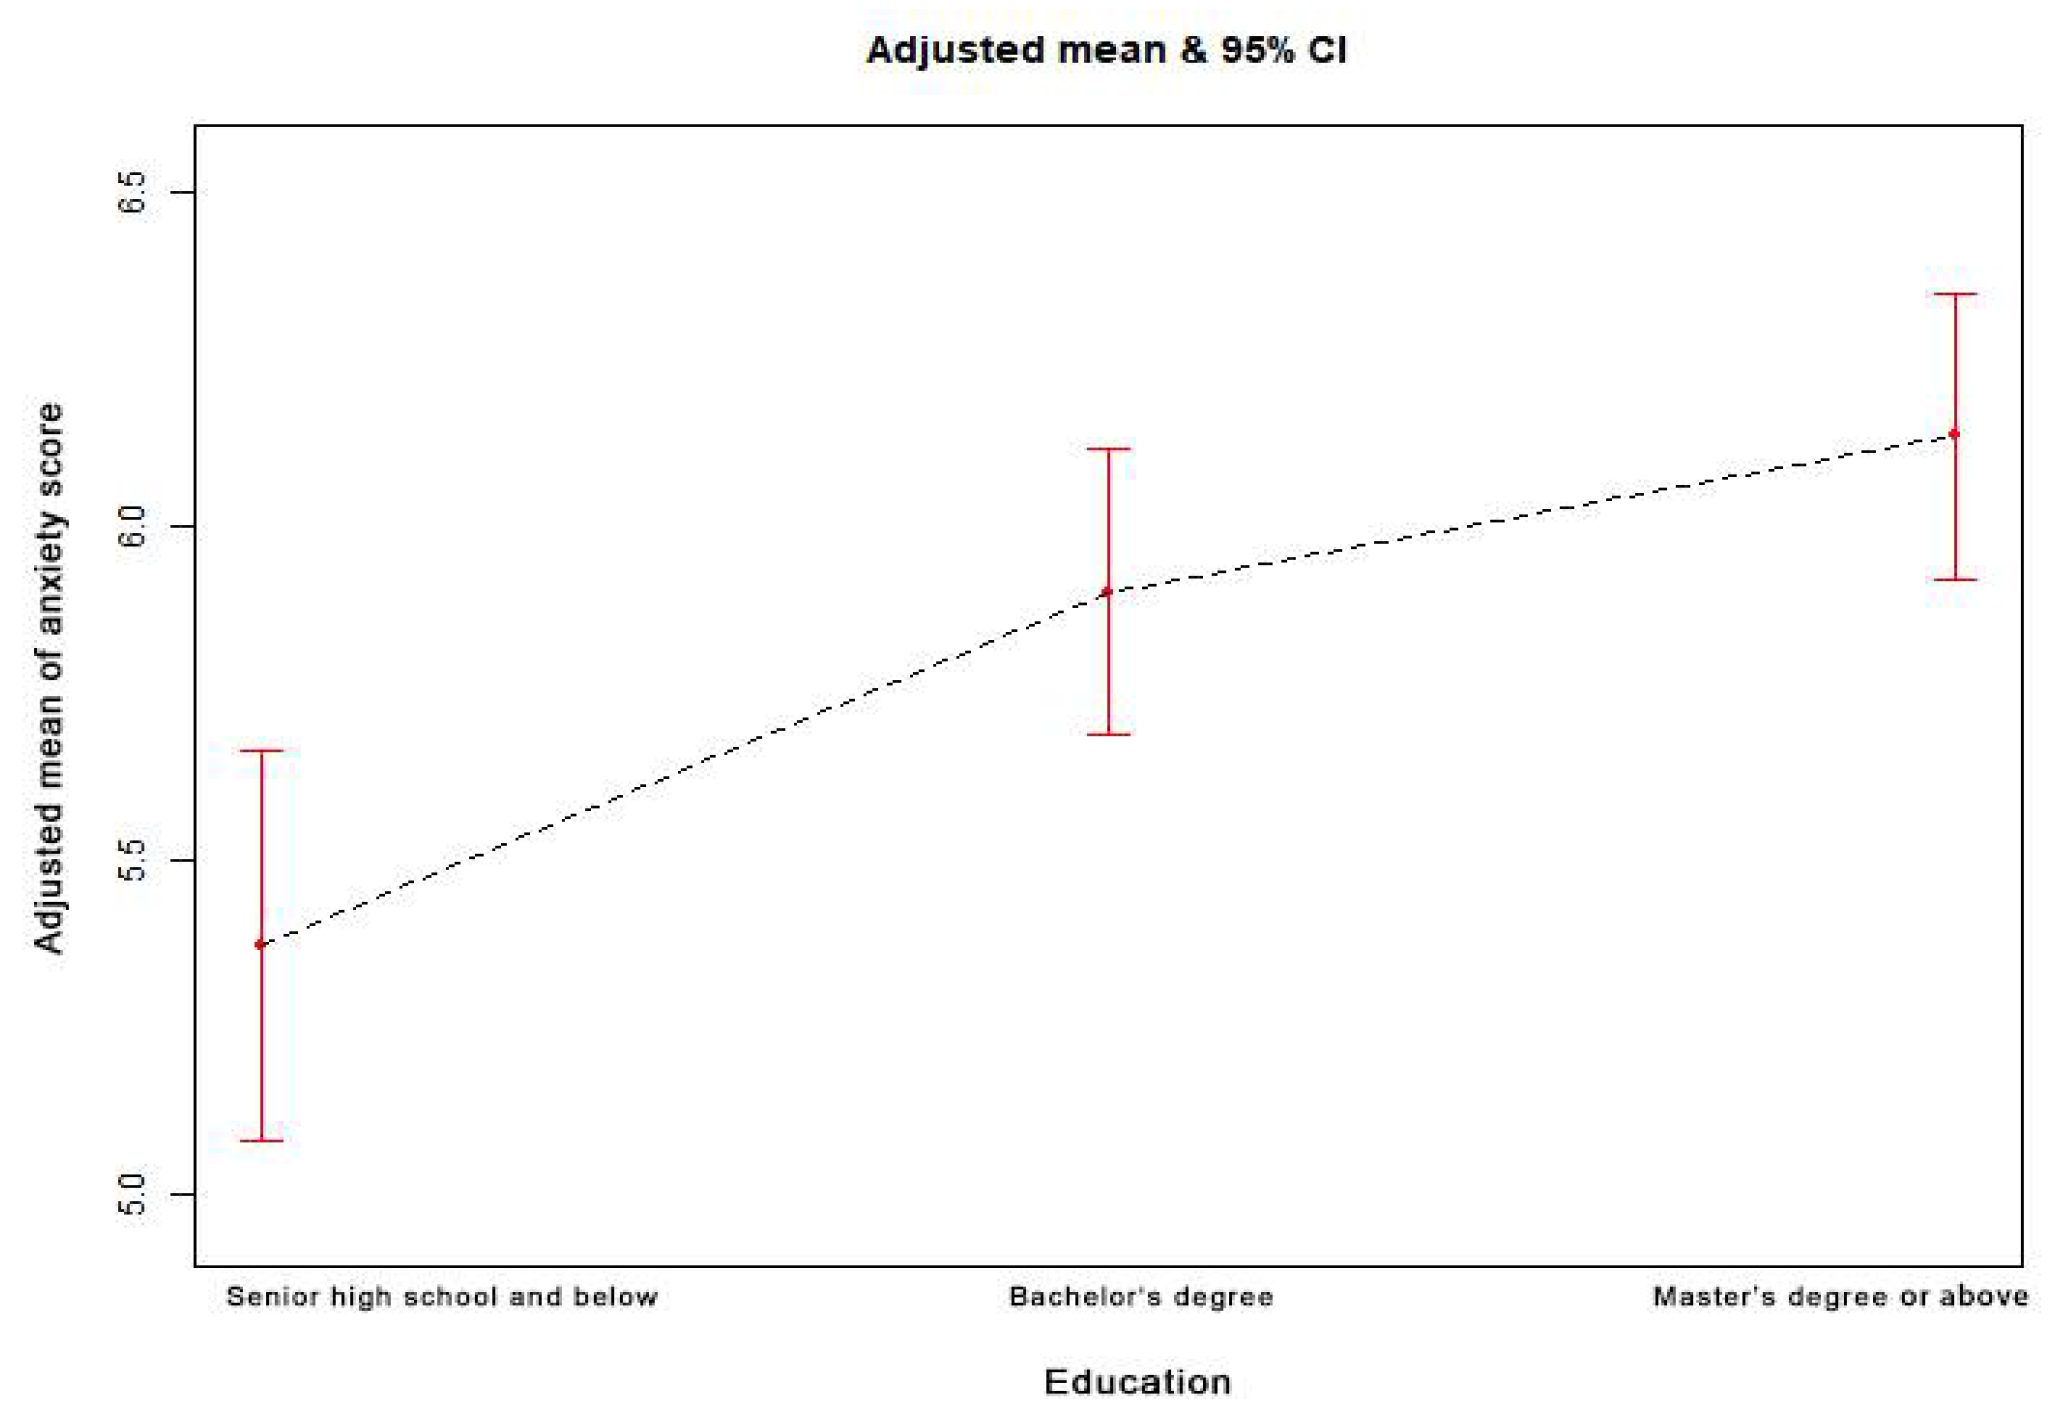
3.3. The Association between Education and Anxiety Score

The association between the educational qualification of the participants and the anxiety score from the GLM analysis is demonstrated in Table 2. Compared to the senior high school and below group (17.64%), the bachelor’s degree (57.11%) and master’s degree or above groups (25.25%) showed a closer connection with the anxiety score (p < 0.001). After adjustment for age, sex, and marriage, it was noticed that people with higher education were more anxious about the outbreak (β = 1.19, 95% CI: 0.92–1.46). In addition, there was a close link between education and the anxiety score after adjusting for other factors affecting anxiety in a multivariate model (β = 1.15, 95% CI: 0.88–1.41). Overall, the education variable was positively and significantly associated with the anxiety score. The p value for trend was < 0.001.

3.4. The Association between Health and Anxiety Score

The association between health and anxiety scores from the GLM analysis is shown in Table 2. Compared to those in a very healthy condition (57.85%), people who were ordinary or unhealthy (10.20%) were more anxious about the outbreak in the model adjusted for age, sex, and marriage (β = 2.78, 95% CI: 2.52–3.03). Furthermore, health condition was associated to the anxiety score after adjusting for other factors affecting anxiety in a multivariate model (β = 2.83, 95% CI: 2.58–3.09). Overall, it could be said that the health variable was significantly associated with the anxiety score. The p value for trend was < 0.001.

3.5. The Association between Cognitive Risk and Anxiety Score

The association between cognitive risk and the anxiety score from GLM analysis is reflected in Table 3. Compared to the no cognitive risk group (16.01%), the high cognitive risk (5.40%) and extremely high cognitive risk groups (1.62%) showed a close connection with the anxiety score (p < 0.001). After adjustment for age, sex, and marriage, people with higher cognitive risk were more anxious about the outbreak (β = 5.15, 95% CI: 4.57–5.73). Additionally, extremely high cognitive risk was connected with anxiety score after adjusting for other factors affecting anxiety in a multivariate model (β = 4.89, 95% CI: 4.33–5.46). Overall, the cognitive variable was positively and significantly associated with the anxiety score. The p value for trend was < 0.001.

3.6. The Association between Confidence and Anxiety Score

The association between confidence and the anxiety score from GLM analysis is demonstrated in Table 3. With the increase in confidence, the anxiety of the population gradually decreased in the model adjusted for age, sex, and marriage (β = −2.92, 95% CI: −3.26–−2.58). Additionally, it was noticed that confidence was connected with anxiety scores after adjusting for other factors affecting anxiety in a multivariate model (β = −2.45, 95% CI: −2.77–−2.13). Overall, the confidence variable was inversely and significantly associated with the anxiety score. The p value for trend was < 0.001.

3.7. The Dose–Response Relationship of Age, Education, and Anxiety Score

Figure 3 shows that the relationship between age and the anxiety score is nonlinear. The risk of anxiety decreased with increasing age, as shown by the estimated dose–response curve. Appendix A Figure A1 shows that the relationship between education and the anxiety score is nonlinear. The risk of anxiety increased with higher education, as shown by the estimated dose–response curve.

4. Discussion

Our web-based study indicated that nearly half of the participants experienced varying degrees of anxiety, with 4.17% (457) experiencing severe anxiety, 23.82% (2608) experiencing moderate anxiety, and 21.84% (2391) experiencing mild anxiety. The proportion of anxiety reported in this study was higher than that of Iran [32], and similar with that of India [33]. Another survey supported the same viewpoint—that people’s psychological responses to COVID-19 were dramatic during the outbreak in China [34]. Our study demonstrated that nearly 7.02% (772) of the participants had high risk perception, and nearly 88.72% (9711) of them were confident that the government could control the outbreak. People of Hubei province in China, the epicenter of this disease, were the most anxious, followed by those living in Shanghai, Beijing, and Zhejiang, which are some of the most economically prosperous areas in China. These prosperous areas had the most interaction with Hubei, and in turn received a large number of infected travelers returning from Wuhan during special holidays such as the Chinese New Year. This was also the reason why the most high-risk areas during the outbreak were no longer Guangzhou, Shanxi, Hebei, Tianjin, and Jilin, although residents of those provinces were the most seriously affected during the SARS outbreak. In the early stage of the epidemic, travel data identified cities and regions susceptible to potential future outbreaks. People living in cities with large population mobility were found to be more prone to anxiety, restlessness, depression, and fear [35].
Our results showed age to have a significant inverse association with the anxiety score. With increasing age, the anxiety score of the population gradually decreased in the multivariate model (β = −2.12, 95% CI: −2.47–−1.78). The results are consistent with another survey [27]. A higher anxiety reaction could be triggered in younger populations. The COVID-19 pandemic created a huge challenge for the elderly [36]. However, younger people who had easier access to plentiful channels of information [27] had an increased anxiety reaction in the face of the emerging epidemic [21]. In sex hierarchies, our results showed that the anxiety level in females was much higher than that of males. Young females were the most vulnerable to anxiety, which is consistent with results reported during the SARS outbreak [37] and the H1N1 pandemic [13]. Similar findings in the Iranian general population were reported during the COVID-19 pandemic [32]. In recent years, with the world moving faster and increasingly becoming more competitive, young females have been experiencing increasing pressure from work, education, and life. In addition, females are much more perceptive and vulnerable to their surroundings [38]. One previous study showed that females were more likely to express negative emotional responses and exhibit avoidance behaviors in response to the avian flu [39]. Thus, it can be deduced that during an epidemic, vulnerable young females should be provided with more psychological support or counseling service to maintain their mental health and well-being [27].
The education variable was positively and significantly associated with anxiety scores in the multivariate model (β = 1.15, 95% CI: 0.88–1.41). Our findings demonstrated that anxiety scores were higher in people with higher levels of education, which reflected similar findings in other studies [40,41]. In most cases, those with higher education, who were more likely to possess prior knowledge and experience regarding the risks of an outbreak of infectious diseases, had experienced the SARS epidemic, especially in China. Additionally, individuals with higher educational degrees may be more capable of recognizing the risks of COVID-19 and also have a higher risk perception [42], leading to extended psychological anxiety during the initial stages of the outbreak [43,44]. In fact, at that stage, the occurrence of human-to-human transmission was rampant. This pandemic has caused 10 times as many cases as SARS did in less than half the time [1]. People with higher education may also be more concerned about national development and social stability, which may make them vulnerable to anxiety during epidemic outbreaks. Many studies have revealed that highly educated individuals tend to suffer from “knowledge anxiety” [45,46]. Furthermore, anxiety can develop into behavioral changes such as constantly disinfecting and scrambling for medicines. Therefore, these results suggest we should not only support medical treatment, but also pay attention to the psychological needs of these subpopulations during pandemics. Media influences mental well-being and can increase anxiety levels [47]. The government should strengthen the core spirit of the media to ensure the validity and accuracy of output information [48]. One report demonstrated that according to data from 2018, there were 112.2 mobile phones per 100 people on average in China, which guaranteed that the government could help people to strengthen their self-protection through online efforts [49]. According to the Compensatory Carry-Over Action Model (CCAM) theory, internet-based interventions and healthy internet activities can be effective at decreasing anxiety and depression among the general population [50]. Therefore, we strongly recommend that the government develop online health education strategies to address mental health issues, promote healthy behavior, and reduce psychological stress.
Respondents with poor subjective health were vulnerable to anxiety in the multivariate model (β = 2.83, 95% CI: 2.58–3.09). This result was consistent with those reported during the SARS outbreak [51]. The few early deaths reported by the media or by medical experts have indicated that the mortality rate of critically ill COVID-19 patients was related to other common comorbidities and complications. COVID-19 patients with hypertension, cardiac disease, diabetes mellitus, cancer, and COPD were shown to have a higher mortality rate [52,53]. One possible reason is that common comorbidities and complications could reduce body immunity and exacerbate organism damage [54]. People with poor subjective health status did feel they were at high risk of contracting COVID-19, thus increasing their feelings of anxiety.
People with higher risk perception are more likely to experience higher anxiety scores. Since various psychological vulnerability factors will play specific roles in “coronaphobia”, individuals will more easily present diversiform traits such as the intolerance to uncertainty, perceived vulnerability to disease, and susceptibility to anxiety [55]. Once individuals perceive themselves as vulnerable to disease, they will likely experience anxiety, which can leave them unable to tackle the outbreak despite having adequate knowledge, experience, preparation, and resources [11]. Our findings suggest that people with high-risk perception during the epidemic should be targeted for psychological counseling and assistance interventions. Typical clinical mental health consultation requires face-to-face interviews for evaluation. However, face-to-face interviews are challenging in the current scenario where social distancing is necessary to avoid spreading the COVID-19 infection. Therefore, considering online mental health consultation might be more beneficial. Meanwhile, implementing extensive mental health monitoring in the community is worthwhile [56].
This study’s results indicated that increased confidence was related to lower levels of anxiety. Vulnerable circumstances caused by the COVID-19 crisis resulted in individual deficiency of psychological resources, thereby lowering people’s self-control and causing some unusual behaviors [57]. One recent study from Japan found that lack of confidence was likely to lead to anxiety [58]. For the general population, adequate confidence during the epidemic is crucial to psychological intervention, which decreases fear and increases mental energy. Based on this finding, positive updates such as scientific information about the epidemic, personal protective measures, and optimistic progress of containment should be made available to the general population in a timely manner.
The anxiety caused by infectious disease potentially yields double-sided results. On the one hand, it may produce damage to individual mental health and further public panic; on the other hand, quick anxiety reactions are an alarm mechanism in humans, a result of millions of years of evolution. It reminds people to pay attention to stress during a dangerous epidemic, when awareness of prevention with early prophylaxis increases. Currently, the inundation of psychological alarm mechanisms is threatening public mental health and well-being. Therefore, future research on anxiety problems triggered by emerging pandemics, especially in the earliest stages, is required. Our findings have certain suggestive significance for Chinese people, and caution should be taken in referencing the conclusion of this study if applied to people of different cultural backgrounds. Future studies should consider cultural aspects of the psychological effects, and repeat our research in other countries with different cultural backgrounds.

5. Limitations

There are some limitations to our study. First, online research requires technical competencies related to using the Internet. Second, as causal relationships and attributions are difficult to derive from a cross-sectional analysis, this study was only able to provide preliminary findings. Third, the non-random sampling network survey method potentially caused selection bias, further affecting the results of this study. Due to the nature of an online survey, the sample population was mostly concentrated in urban areas, and often included those with a higher education level. However, we obtained a large sample size, which increased our confidence in our conclusions. Fourth, the study was based on participants’ self-report questionnaires, such that issues of subjectivity and potential bias come into play. Although we conducted quality control, there may be errors in the information. Finally, the procedure of measuring anxiety status can be challenging, which we admit is a limitation of the study. Thus, it can be said that further studies are needed to address these issues and gain more comprehensive knowledge of how to deal with mental health during the pandemic.

6. Conclusions

During the earliest phase of the COVID-19 outbreak, a high proportion of Chinese people were suffering from anxiety. Young females and people with higher education were vulnerable to experiencing anxiety problems during the early days of the outbreak due to the high accessibility of infectious disease information and their ability to judge potential threat. A higher awareness of cognitive risk and poor subjective health contributed to more precariousness, which consequently caused anxiety. On the contrary, individuals who had more confidence in resisting the epidemic had less precariousness, thus leading to lower anxiety risk. Therefore, targeted interventions related to improving public confidence in the containment of the epidemic are necessary for avoiding greater panic. People of Hubei province in China, the epicenter of this disease, were the most anxious. It is necessary to identify people who are vulnerable to decreasing mental health and develop effective intervention strategies to prevent anxiety among them. Evidence from this survey will help provide guidance to policymakers as they create intervention practices during novel disease outbreaks. To address mental health issues during the pandemic, policymakers should adopt several psycho-social interventions to reduce anxiety among the population in affected areas along with methods for controlling outbreaks.

Author Contributions

Conceived and designed the study, B.L. and F.C.; performed the study, B.L., B.H. and H.Z.; analyzed the data, B.L., B.H., H.L. and T.Z.; contributed reagents/materials/analysis tools, B.L., B.H., H.L. and Y.W.; wrote the paper, B.L. and F.C.; approved the final manuscript for publication, B.L. and F.C. All authors have read and agreed to the published version of the manuscript.

Funding

This work was supported by Fundamental Research Funds for the Central Universities and the Peking University Health Science Center [grant numbers BMU20170607].

Institutional Review Board Statement

Not applicable since the study is not involving humans or animals.

Informed Consent Statement

Not applicable since the study is not involving humans.

Data Availability Statement

The data presented in this study are available on request from the corresponding author.

Conflicts of Interest

The authors declare no conflict of interest in this work.

Appendix A

Table A1. The association between age and anxiety score, stratified by hierarchy.
Age CategorynNon-Adjusted ModelModel I aModel II b
(95% CI LL, UL)p Value(95% CI LL, UL)p Value(95% CI LL, UL)p Value
Male3680
<30 years1053000
30–40 years1040−0.16 (−0.50, 0.18)0.3588−0.44 (−0.90, 0.03)0.0655−0.52 (−0.98, −0.05)0.0296
40–50 years874−0.55 (−0.91, −0.19)0.0028−0.88 (−1.41, −0.36)0.0010−0.98 (−1.50, −0.46)0.0002
≥50 years713−1.45 (−1.83, −1.07)<0.0001−1.79 (−2.33, −1.24)<0.0001−1.84 (−2.39, −1.28)<0.0001
Female7266
<30 years2416000
30–40 years2092−0.13 (−0.37, 0.10)0.2769−0.28 (−0.60, 0.03)0.0780−0.57 (−0.88, −0.25)0.0004
40–50 years1618−1.27 (−1.52, −1.01)<0.0001−1.43 (−1.79, −1.08)<0.0001−1.73 (−2.08, −1.38)<0.0001
≥50 years1140−2.28 (−2.56, −2.00)<0.0001−2.44 (−2.82, −2.05)<0.0001−2.77 (−3.18, −2.36)<0.0001
p interaction<0.0001
a Adjusted for marriage; b Adjusted for marriage, education, occupation, family members, contact history, cognitive risk, confidence, residence.
Figure A1. The dose–response relationship between education and the anxiety score. (Notes: Generalized additive models; Outcome variable: anxiety score; Exposure variable: education; Adjustment variables: age, sex, marriage, occupation, family members, contact history).
Healthcare 09 00970 g0a1

References

  1. Gates, B. Responding to Covid-19—A Once-in-a-Century Pandemic? N. Engl. J. Med. 2020, 382, 1677–1679. [Google Scholar] [CrossRef] [PubMed]
  2. Sohrabi, C.; Alsafi, Z.; O’Neill, N.; Khan, M.; Kerwan, A.; Al-Jabir, A.; Iosifidis, C.; Agha, R. World Health Organization declares global emergency: A review of the 2019 novel coronavirus (COVID-19). Int. J. Surg. 2020, 76, 71–76. [Google Scholar] [CrossRef]
  3. Shi, H.; Han, X.; Jiang, N.; Cao, Y.; Alwalid, O.; Gu, J.; Fan, Y.; Zheng, C. Radiological findings from 81 patients with COVID-19 pneumonia in Wuhan, China: A descriptive study. Lancet Infect. Dis. 2020, 20, 425–434. [Google Scholar] [CrossRef]
  4. USA Today. The World Surpasses 20 Million COVID-19 Cases: A Look at the Milestones and Setbacks. Available online: https://www.usatoday.com/story/news/nation/2020/07/23/united-states-coronavirus-cases-deaths-timeline/5485674002/ (accessed on 23 July 2020).
  5. Blakey, S.M.; Abramowitz, J.S. Psychological Predictors of Health Anxiety in Response to the Zika Virus. J. Clin. Psychol. Med. Set. 2017, 24, 270–278. [Google Scholar] [CrossRef] [PubMed]
  6. Liao, Q.; Cowling, B.J.; Lam, W.W.T.; Ng, D.M.W.; Fielding, R. Anxiety, worry and cognitive risk estimate in relation to protective behaviors during the 2009 influenza A/H1N1 pandemic in Hong Kong: Ten cross-sectional surveys. BMC Infect. Dis. 2014, 14, 169. [Google Scholar] [CrossRef] [Green Version]
  7. Abdulkareem, S.A.; Augustijn, E.-W.; Filatova, T.; Musial, K.; Mustafa, Y.T. Risk perception and behavioral change during epidemics: Comparing models of individual and collective learning. PLoS ONE 2020, 15, e0226483. [Google Scholar] [CrossRef]
  8. Lau, J.T.F.; Yang, X.; Tsui, H.; Kim, J.H. Monitoring community responses to the SARS epidemic in Hong Kong: From day 10 to day 62. J. Epidemiol. Commun. Health 2003, 57, 864–870. [Google Scholar] [CrossRef]
  9. Brug, J.; Aro, A.R.; Oenema, A.; De Zwart, O.; Richardus, J.H.; Bishop, G.D. SARS Risk Perception, Knowledge, Precautions, and Information Sources, the Netherlands. Emerg. Infect. Dis. 2004, 10, 1486–1489. [Google Scholar] [CrossRef] [PubMed]
  10. Wu, P.; Fang, Y.; Guan, Z.; Fan, B.; Kong, J.; Yao, Z.; Liu, X.; Fuller, C.J.; Susser, E.; Lu, J.; et al. The Psychological Impact of the SARS Epidemic on Hospital Employees in China: Exposure, Risk Perception, and Altruistic Acceptance of Risk. Can. J. Psychiatry 2009, 54, 302–311. [Google Scholar] [CrossRef] [PubMed]
  11. Rubin, G.J.; Amlôt, R.; Page, L.; Wessely, S. Public perceptions, anxiety, and behaviour change in relation to the swine flu outbreak: Cross sectional telephone survey. BMJ 2009, 339, b2651. [Google Scholar] [CrossRef] [Green Version]
  12. Bayham, J.; Kuminoff, N.V.; Gunn, Q.; Fenichel, E. Measured voluntary avoidance behaviour during the 2009 A/H1N1 epidemic. Proc. R. Soc. B Biol. Sci. 2015, 282, 20150814. [Google Scholar] [CrossRef] [Green Version]
  13. Lau, J.T.F.; Griffiths, S.; Choi, K.C.; Tsui, H.Y. Avoidance behaviors and negative psychological responses in the general population in the initial stage of the H1N1 pandemic in Hong Kong. BMC Infect. Dis. 2010, 10, 139. [Google Scholar] [CrossRef] [Green Version]
  14. Wang, L.; Cowling, B.; Wu, P.; Yu, J.; Li, F.; Zeng, L.; Wu, J.T.; Li, Z.; Leung, G.; Yu, H. Human Exposure to Live Poultry and Psychological and Behavioral Responses to Influenza A(H7N9), China. Emerg. Infect. Dis. 2014, 20, 1296–1305. [Google Scholar] [CrossRef] [PubMed]
  15. Yu, J.; Wu, P.; Wang, L.; Cowling, B.J.; Yu, J.; Fang, V.J.; Li, F.; Zeng, L.; Wu, J.T.; Li, Z.; et al. Live poultry exposure and public response to influenza A(H7N9) in urban and rural China during two epidemic waves in 2013–2014. PLoS ONE 2015, 10, e0137831. [Google Scholar] [CrossRef]
  16. Cheng, C.; Tang, C.S.-K. The psychology behind the masks: Psychological responses to the severe acute respiratory syndrome outbreak in different regions. Asian J. Soc. Psychol. 2004, 7, 3–7. [Google Scholar] [CrossRef] [PubMed]
  17. Vartti, A.-M.; Oenema, A.; Schreck, M.; Uutela, A.; De Zwart, O.; Brug, J.; Aro, A.R. SARS Knowledge, Perceptions, and Behaviors: A Comparison between Finns and the Dutch during the SARS Outbreak in 2003. Int. J. Behav. Med. 2009, 16, 41–48. [Google Scholar] [CrossRef] [Green Version]
  18. De Zwart, O.; Veldhuijzen, I.K.; Elam, G.; Aro, A.R.; Abraham, T.; Bishop, G.D.; Voeten, H.A.C.M.; Richardus, J.H.; Brug, J. Perceived Threat, Risk Perception, and Efficacy Beliefs Related to SARS and Other (Emerging) Infectious Diseases: Results of an International Survey. Int. J. Behav. Med. 2009, 16, 30–40. [Google Scholar] [CrossRef] [Green Version]
  19. Bults, M.; Beaujean, D.J.M.A.; de Zwart, O.; Kok, G.; van Empelen, P.; van Steenbergen, J.E.; Richardus, J.H.; Voeten, H.A.C.M. Perceived risk, anxiety and behavioural responses of the general public during the early phase of the Influenza A (H1N1) pandemic in the Netherlands. Psychol. Health 2010, 25, 121–122. [Google Scholar]
  20. Wallace, C.L.; Wladkowski, S.; Gibson, A.; White, P. Grief During the COVID-19 Pandemic: Considerations for Palliative Care Providers. J. Pain Symptom Manag. 2020, 60, e70–e76. [Google Scholar] [CrossRef] [PubMed]
  21. Gao, J.; Zheng, P.; Jia, Y.; Chen, H.; Mao, Y.; Chen, S.; Wang, Y.; Fu, H.; Dai, J. Mental health problems and social media exposure during COVID-19 outbreak. PLoS ONE 2020, 15, e0231924. [Google Scholar] [CrossRef]
  22. Leung, G.; Quah, S.R.; Ho, L.-M.; Ho, S.-Y.; Hedley, A.J.; Lee, H.-P.; Lam, T.-H. A Tale of Two Cities: Community Psychobehavioral Surveillance and Related Impact on Outbreak Control in Hong Kong and Singapore During the Severe Acute Respiratory Syndrome Epidemic. Infect. Control Hosp. Epidemiol. 2004, 25, 1033–1041. [Google Scholar] [CrossRef] [Green Version]
  23. Takebayashi, Y.; Lyamzina, Y.; Suzuki, Y.; Murakami, M. Risk Perception and Anxiety Regarding Radiation after the 2011 Fukushima Nuclear Power Plant Accident: A Systematic Qualitative Review. Int. J. Environ. Res. Public Health 2017, 14, 1306. [Google Scholar] [CrossRef] [Green Version]
  24. Rajkumar, R.P. COVID-19 and mental health: A review of the existing literature. Asian J. Psychiatry 2020, 52, 102066. [Google Scholar] [CrossRef] [PubMed]
  25. Wang, C.; Pan, R.; Wan, X.; Tan, Y.; Xu, L.; Ho, C.S.; Ho, R.C. Immediate Psychological Responses and Associated Factors during the Initial Stage of the 2019 Coronavirus Disease (COVID-19) Epidemic among the General Population in China. Int. J. Environ. Res. Public Health 2020, 17, 1729. [Google Scholar] [CrossRef] [Green Version]
  26. Brooks, S.K.; Webster, R.K.; Smith, L.E.; Woodland, L.; Wessely, S.; Greenberg, N.; Rubin, G.J. The psychological impact of quarantine and how to reduce it: Rapid review of the evidence. Lancet 2020, 395, 912–920. [Google Scholar] [CrossRef] [Green Version]
  27. Ahmed, M.Z.; Ahmed, O.; Aibao, Z.; Hanbin, S.; Siyu, L.; Ahmad, A. Epidemic of COVID-19 in China and associated Psychological Problems. Asian J. Psychiatry 2020, 51, 102092. [Google Scholar] [CrossRef]
  28. Lu, W.-H.; Ko, N.-Y.; Chang, Y.-P.; Yen, C.-F.; Wang, P.-W. The Coronavirus Disease 2019 Pandemic in Taiwan: An Online Survey on Worry and Anxiety and Associated Factors. Int. J. Environ. Res. Public Health 2020, 17, 7974. [Google Scholar] [CrossRef]
  29. Rossi, R.; Socci, V.; Talevi, D.; Mensi, S.; Niolu, C.; Pacitti, F.; Di Marco, A.; Rossi, A.; Siracusano, A.; Di Lorenzo, G. COVID-19 Pandemic and Lockdown Measures Impact on Mental Health Among the General Population in Italy. Front. Psychiatry 2020, 11, 790. [Google Scholar] [CrossRef] [PubMed]
  30. Zsido, A.N.; Teleki, S.A.; Csokasi, K.; Rozsa, S.; Bandi, S. Development of the short version of the spielberger state—Trait anxiety inventory. Psychiatry Res. 2020, 291, 113223. [Google Scholar] [CrossRef]
  31. Prati, G.; Pietrantoni, L.; Zani, B. A Social-Cognitive Model of Pandemic Influenza H1N1 Risk Perception and Recommended Behaviors in Italy. Risk Anal. 2010, 31, 645–656. [Google Scholar] [CrossRef]
  32. Moghanibashi-Mansourieh, A. Assessing the anxiety level of Iranian general population during COVID-19 outbreak. Asian J. Psychiatry 2020, 51, 102076. [Google Scholar] [CrossRef]
  33. Roy, D.; Tripathy, S.; Kar, S.K.; Sharma, N.; Verma, S.K.; Kaushal, V. Study of knowledge, attitude, anxiety & perceived mental healthcare need in Indian population during COVID-19 pandemic. Asian J. Psychiatry 2020, 51, 102083. [Google Scholar] [CrossRef]
  34. Huang, Y.; Zhao, N. Generalized anxiety disorder, depressive symptoms and sleep quality during COVID-19 outbreak in China: A web-based cross-sectional survey. Psychiatry Res. 2020, 288, 112954. [Google Scholar] [CrossRef]
  35. Wu, J.; Wang, J.; Nicholas, S.; Maitland, E.; Fan, Q. Application of Big Data Technology for COVID-19 Prevention and Control in China: Lessons and Recommendations. J. Med. Internet Res. 2020, 22, e21980. [Google Scholar] [CrossRef] [PubMed]
  36. Mehra, A.; Rani, S.; Sahoo, S.; Parveen, S.; Singh, A.P.; Chakrabarti, S.; Grover, S. A crisis for elderly with mental disorders: Relapse of symptoms due to heightened anxiety due to COVID-19. Asian J. Psychiatry 2020, 51, 102114. [Google Scholar] [CrossRef]
  37. Lau, J.T.; Yang, X.; Pang, E.; Tsui, H.; Wong, E.; Wing, Y.K. SARS-related perceptions in Hong Kong. Emerg. Infect. Dis. 2005, 11, 417–424. [Google Scholar] [CrossRef] [PubMed]
  38. Stefanac, N.; Hetrick, S.; Hulbert, C.; Spittal, M.J.; Witt, K.; Robinson, J. Are young female suicides increasing? A comparison of sex-specific rates and characteristics of youth suicides in Australia over 2004–2014. BMC Public Health 2019, 19, 1389. [Google Scholar] [CrossRef] [PubMed] [Green Version]
  39. Smith, B.W.; Kay, V.S.; Hoyt, T.V.; Bernard, M.L. Predicting the anticipated emotional and behavioral responses to an avian flu outbreak. Am. J. Infect. Control. 2009, 37, 371–380. [Google Scholar] [CrossRef]
  40. Son, C.; Hegde, S.; Smith, A.; Wang, X.; Sasangohar, F. Effects of COVID-19 on College Students’ Mental Health in the United States: Interview Survey Study. J. Med. Internet Res. 2020, 22, e21279. [Google Scholar] [CrossRef]
  41. Araújo, F.J.D.O.; De Lima, L.S.A.; Cidade, P.I.M.; Nobre, C.B.; Neto, M.L.R. Impact Of Sars-Cov-2 And Its Reverberation In Global Higher Education And Mental Health. Psychiatry Res. 2020, 288, 112977. [Google Scholar] [CrossRef]
  42. Shook, E.; Curtis, A.; Curtis, J.; Gibson, G.; Horst, A.V.; Little, V.; Woolverton, C. Assessing the Geographic Context of Risk Perception and Behavioral Response to Potential Ebola Exposure. Int. J. Environ. Res. Public Health 2019, 16, 831. [Google Scholar] [CrossRef] [Green Version]
  43. Kashiwazaki, Y.; Takebayashi, Y.; Murakami, M. Relationships between radiation risk perception and health anxiety, and contribution of mindfulness to alleviating psychological distress after the Fukushima accident: Cross-sectional study using a path model. PLoS ONE 2020, 15, e0235517. [Google Scholar] [CrossRef] [PubMed]
  44. Germani, A.; Buratta, L.; Del Vecchio, E.; Mazzeschi, C. Emerging Adults and COVID-19: The Role of Individualism-Collectivism on Perceived Risks and Psychological Maladjustment. Int. J. Environ. Res. Public Health 2020, 17, 3497. [Google Scholar] [CrossRef] [PubMed]
  45. Tang, Z.; Guo, Z.; Zhou, L.; Xue, S.; Zhu, Q.; Zhu, H. Combined and Relative Effect Levels of Perceived Risk, Knowledge, Optimism, Pessimism, and Social Trust on Anxiety among Inhabitants Concerning Living on Heavy Metal Contaminated Soil. Int. J. Environ. Res. Public Health 2016, 13, 1076. [Google Scholar] [CrossRef] [Green Version]
  46. Thomas, M.S.C.; Ansari, D.; Knowland, V.C.P. Annual Research Review: Educational neuroscience: Progress and prospects. J. Child Psychol. Psychiatry 2019, 60, 477–492. [Google Scholar] [CrossRef] [Green Version]
  47. Bagroy, S.; Kumaraguru, P.; De Choudhury, M. A Social Media Based Index of Mental Well-Being in College Campuses. In Proceedings of the CHI Conference on Human Factors in Computing Systems, Denver, CO, USA, 6–11 May 2017; Association for Computing Machinery (ACM): New York, NY, USA, 2017; Volume 2017, pp. 1634–1646. [Google Scholar]
  48. Weible, C.M.; Nohrstedt, D.; Cairney, P.; Carter, D.; Crow, D.A.; Durnová, A.P.; Heikkila, T.; Ingold, K.; McConnell, A.; Stone, D. COVID-19 and the policy sciences: Initial reactions and perspectives. Policy Sci. 2020, 53, 225–241. [Google Scholar] [CrossRef] [Green Version]
  49. Wang, J.; Mishima, N. Province-level estimation of waste mobile phones in China and location planning of recycling centers. Waste Manag. Res. 2019, 37, 898–905. [Google Scholar] [CrossRef]
  50. Lippke, S.; Dahmen, A.; Gao, L.; Guza, E.; Nigg, C.R. To What Extent is Internet Activity Predictive of Psychological Well-Being? Psychol. Res. Behav. Manag. 2021, 14, 207–219. [Google Scholar] [CrossRef]
  51. Tang, C.S.-K.; Wong, C.-Y. Factors influencing the wearing of facemasks to prevent the severe acute respiratory syndrome among adult Chinese in Hong Kong. Prev. Med. 2004, 39, 1187–1193. [Google Scholar] [CrossRef] [PubMed]
  52. Groß, S.; Jahn, C.; Cushman, S.; Bär, C.; Thum, T. SARS-CoV-2 receptor ACE2-dependent implications on the cardiovascular system: From basic science to clinical implications. J. Mol. Cell. Cardiol. 2020, 144, 47–53. [Google Scholar] [CrossRef]
  53. Xu, G.; Yang, Y.; Du, Y.; Peng, F.; Hu, P.; Wang, R.; Yin, M.; Li, T.; Tu, L.; Sun, J.; et al. Clinical Pathway for Early Diagnosis of COVID-19: Updates from Experience to Evidence-Based Practice. Clin. Rev. Allergy Immunol. 2020, 59, 89–100. [Google Scholar] [CrossRef] [Green Version]
  54. Zhang, S.; Guo, M.; Duan, L.; Wu, F.; Hu, G.; Wang, Z.; Huang, Q.; Liao, T.; Xu, J.; Ma, Y.; et al. Development and validation of a risk factor-based system to predict short-term survival in adult hospitalized patients with COVID-19: A multicenter, retrospective, cohort study. Crit. Care 2020, 24, 1–13. [Google Scholar] [CrossRef]
  55. Asmundson, G.J.; Taylor, S. Coronaphobia: Fear and the 2019-nCoV outbreak. J. Anxiety Disord. 2020, 70, 102196. [Google Scholar] [CrossRef]
  56. Ni, M.Y.; Yang, L.; Leung, C.M.C.; Li, N.; Yao, X.I.; Wang, Y.; Leung, G.M.; Cowling, B.J.; Liao, Q. Mental Health, Risk Factors, and Social Media Use During the COVID-19 Epidemic and Cordon Sanitaire Among the Community and Health Professionals in Wuhan, China: Cross-Sectional Survey. JMIR Ment. Health 2020, 7, e19009. [Google Scholar] [CrossRef]
  57. Chen, S.; Westman, M.; Hobfoll, S.E. The Commerce and Crossover of Resources: Resource Conservation in the Service of Resilience. Stress Health 2015, 31, 95–105. [Google Scholar] [CrossRef] [Green Version]
  58. Nakamura, Y.; Okada, T.; Morikawa, M.; Yamauchi, A.; Sato, M.; Ando, M.; Ozaki, N. Perinatal depression and anxiety of primipara is higher than that of multipara in Japanese women. Sci. Rep. 2020, 10, 1–10. [Google Scholar] [CrossRef]
Figure 1. Sample size and number of cases distributed.
Healthcare 09 00970 g001
Figure 2. Anxiety scores by province.
Healthcare 09 00970 g002
Figure 3. The dose-response relationship of age and anxiety score. (Notes: Generalized additive models; Outcome variable: anxiety score; Exposure variable: age; Adjustment variable: sex, marriage, education, occupation, family members, contact history).
Healthcare 09 00970 g003
Table 1. Baseline characteristics of people by anxiety score category.
NormalMild AnxietyModerate AnxietySevere Anxietyp Value
(n = 5490)(n = 2391)(n = 2608)(n = 457)
Anxiety score2.95 ± 2.097.98 ± 0.8111.04 ± 1.0814.47 ± 0.50<0.001
Age(years)38.79 ± 12.6136.23 ± 12.2534.57 ± 10.6432.85 ± 9.90<0.001
Sex <0.001
Male2146 (39.09%)735 (30.74%)701 (26.88%)98 (21.44%)
Female3344 (60.91%)1656 (69.26%)1907 (73.12%)359 (78.56%)
Marriage <0.001
Unmarried1601 (29.16%)813 (34.00%)917 (35.16%)187 (40.92%)
Married3664 (66.74%)1510 (63.15%)1610 (61.73%)257 (56.24%)
Divorced161 (2.93%)45 (1.88%)62 (2.38%)11 (2.41%)
Widowed41 (0.75%)14 (0.59%)7 (0.27%)1 (0.22%)
Other23 (0.42%)9 (0.38%)12 (0.46%)1 (0.22%)
Education <0.001
Senior high school and below1165 (21.22%)409 (17.11%)305 (11.69%)52 (11.38%)
Bachelor’s degree3035 (55.28%)1395 (58.34%)1563 (59.93%)258 (56.46%)
Master’s degree or above1290 (23.50%)587 (24.55%)740 (28.37%)147 (32.17%)
Occupation <0.001
Medical professional924 (16.83%)431 (18.03%)515 (19.75%)96 (21.01%)
Laborers462 (8.42%)134 (5.60%)133 (5.10%)26 (5.69%)
Teachers and researchers1129 (20.56%)437 (18.28%)452 (17.33%)61 (13.35%)
Government staff195 (3.55%)88 (3.68%)129 (4.95%)18 (3.94%)
Commercial and service personnel1093 (19.91%)488 (20.41%)509 (19.52%)77 (16.85%)
Students723 (13.17%)412 (17.23%)467 (17.91%)102 (22.32%)
Retired staff305 (5.56%)126 (5.27%)52 (1.99%)11 (2.41%)
Other659 (12.00%)275 (11.50%)351 (13.46%)66 (14.44%)
Residence 0.002
Urban4351 (79.25%)1893 (79.17%)2145 (82.25%)382 (83.59%)
Rural1139 (20.75%)498 (20.83%)463 (17.75%)75 (16.41%)
Area 0.009
From Hubei province69 (1.26%)42 (1.76%)59 (2.26%)6 (1.31%)
From other provinces5324 (96.98%)2299 (96.15%)2485 (95.28%)444 (97.16%)
From abroad97 (1.77%)50 (2.09%)64 (2.45%)7 (1.53%)
Family members 0.270
< 3 family members566 (10.31%)210 (8.78%)263 (10.08%)43 (9.41%)
3–5 family members3085 (56.19%)1323 (55.33%)1462 (56.06%)263 (57.55%)
≥ 5 family members1839 (33.50%)858 (35.88%)883 (33.86%)151 (33.04%)
Contact history <0.001
No5170 (94.17%)2203 (92.14%)2312 (88.65%)3902 (85.34%)
Yes320 (5.83%)188 (7.86%)296 (11.35%)67 (14.66%)
Continuous variables are expressed by means (±Standard Distribution), and classification variables are expressed as a percentage.
Table 2. The association of age, education, health, and anxiety score in the whole population.
Variablesn (%)Non-Adjusted ModelModel I bModel II c
(95% CI LL, UL) ap Value(95% CI LL, UL)p Value(95% CI LL, UL)p Value
Age category
<30 years3469 (31.69)000
30–40 years3132 (28.61)−0.18 (−0.38, 0.02)0.0704−0.46 (−0.72, −0.20)0.0006−0.40 (−0.68, −0.12)0.0053
40–50 years2492 (22.77)−1.08 (−1.29, −0.87)<0.0001−1.28 (−1.57, −0.98)<0.0001−1.29 (−1.60, −0.98)<0.0001
≥50 years1853 (16.93)−2.07 (−2.30, −1.85)<0.0001−2.15 (−2.46, −1.84)<0.0001−2.12 (−2.47, −1.78)<0.0001
p Value for Trend<0.001
Education category
Senior high school and below1931 (17.64)000
Bachelor’s degree6251 (57.11)1.21 (1.00, 1.42)<0.00010.89 (0.67, 1.12)<0.00010.84 (0.62, 1.06)<0.0001
Master’s degree or above2764 (25.25)1.55 (1.31, 1.79)<0.00011.19 (0.92, 1.46)<0.00011.15 (0.88, 1.41)<0.0001
p Value for Trend<0.001
Health category
Very healthy6332 (57.85)000
Healthy3497 (31.95)1.57 (1.40, 1.73) <0.00011.76 (1.60, 1.92)<0.00011.76 (1.59, 1.92)<0.0001
Ordinary or unhealthy1117 (10.20)2.18 (1.92, 2.43)<0.00012.78 (2.52, 3.03)<0.00012.83 (2.58, 3.09)<0.0001
p Value for Trend<0.001
a 95% Confidence Interval (CI) lower limit (LL), upper limit (UL); b Adjusted for age, sex, and marriage; c Adjusted for age, sex, marriage, education, occupation, family members, contact history, cognitive risk, confidence, residence, concern.
Table 3. The association of cognitive risk, confidence, and anxiety score in the whole population.
Variablesn (%)Non-Adjusted ModelModel I bModel II c
(95% CI LL, UL) ap Value(95% CI LL, UL)p Value(95% CI LL, UL)p Value
Cognitive risk
No risk1755 (16.01)000
Low risk6440 (58.80)2.52 (2.32, 2.72)<0.00012.43 (2.33, 2.63)<0.00012.21 (2.02, 2.41)<0.0001
Medium risk1982 (18.17)4.95 (4.70, 5.19)<0.00014.79 (4.55, 5.03)<0.00014.36 (4.12, 4.60)<0.0001
High risk591 (5.40)4.99 (4.63, 5.34)<0.00014.87 (4.52, 5.22)<0.00014.52 (4.18, 4.87)<0.0001
Extremely high risk178 (1.62)5.27 (4.68, 5.85)<0.00015.15 (4.57, 5.73)<0.00014.89 (4.33, 5.46)<0.0001
p Value for Trend<0.001
Confidence
Unconfident1235 (11.28)000
Somewhat confident5322 (48.62)−0.41 (−0.66, −0.16)0.0012−0.56 (−0.80, −0.32)<0.0001−0.54 (−0.77, −0.31)<0.0001
Confident3535 (32.29)−1.94 (−2.20, −1.68)<0.0001−2.00 (−2.26, −1.75)<0.0001−1.72 (−1.95, −1.48)<0.0001
Very confident854 (7.80)−2.94 (−3.29, −2.59)<0.0001−2.92 (−3.26, −2.58)<0.0001−2.45 (−2.77, −2.13)<0.0001
p Value for Trend<0.001
a 95% Confidence Interval (CI) lower limit (LL), upper limit (UL); b Adjusted for age, sex, and marriage; c Adjusted for age, sex, marriage, education, occupation, family members, contact history, cognitive risk, confidence, residence, concern.
Publisher’s Note: MDPI stays neutral with regard to jurisdictional claims in published maps and institutional affiliations.

