A Scan-to-BIM Methodology Applied to Heritage Buildings


CIAUD, Lisbon School of Architecture, University of Lisbon, 1349-063 Lisbon, Portugal
*
Author to whom correspondence should be addressed.
†
These authors contributed equally to this work.
Heritage 2020, 3(1), 47-67; https://0-doi-org.brum.beds.ac.uk/10.3390/heritage3010004
Submission received: 30 November 2019
/
Revised: 30 January 2020
/
Accepted: 31 January 2020
/
Published: 6 February 2020
(This article belongs to the Special Issue Heritage Building Information Modeling (HBIM))
Abstract
:Heritage buildings usually have complex (non-parametric) geometries that turn their digitization through conventional methods in inaccurate and time-consuming processes. When it comes to the survey and representation of historical assets, remote sensing technologies have been playing key roles in the last few years: 3D laser scanning and photogrammetry surveys save time in the field, while proving to be extremely accurate at registering non-regular geometries of buildings. However, the efficient transformation of remote-sensing data into as-built parametric smart models is currently an unsolved challenge. A pragmatic and organized Historic Building Information Modeling (HBIM) methodology is essential in order to obtain a consistent model that can bring benefits and integrate conservation and restoration work. This article addresses the creation of an HBIM model of heritage assets using 3D laser scanning and photogrammetry. Our findings are illustrated in one case study: The Engine House Paços Reais in Lisbon. The paper first describes how and what measures should be taken to plan a careful scan-to-HBIM process. Second, the description of the remote-sensing survey campaign is conducted accordingly and is aimed at a BIM output, including the process of data alignment, cleaning, and merging. Finally, the HBIM modeling phase is described, based on point cloud data.
1. Introduction
Technological advances and the use of new non-invasive imaging tools and long-range methods such as 3D terrestrial laser scanning and photogrammetry make it easy to perform architectural surveys and to achieve high accuracy and precision that captures the details of the building that would not otherwise be possible [1,2].
The use of BIM tools for three-dimensional architectural reconstruction makes it possible to incorporate the existing building to a BIM methodology and take advantage of benefits such as calculations of design alternatives, cost estimates, material quantifications, data management, as-built documentation, constructive state analysis, execution plans, and others [3]. The use of the BIM methodology for existing buildings differs from when it is applied to new projects. For these cases, the as-built BIM model can be done either as an upgrade of an existing BIM model or the creation of a new one. In Europe, 80% of the buildings were constructed before 1990, and most of them do not have a BIM model to be incorporated into this work methodology. For these cases, reverse engineering with 3D laser scanning and photogrammetry survey processes is becoming standard procedure [4]. When we are dealing with a heritage building, some care must be taken to ensure that a suitable model, which can meet the needs of a Historic Building Information Modeling (HBIM) methodology, is obtained.
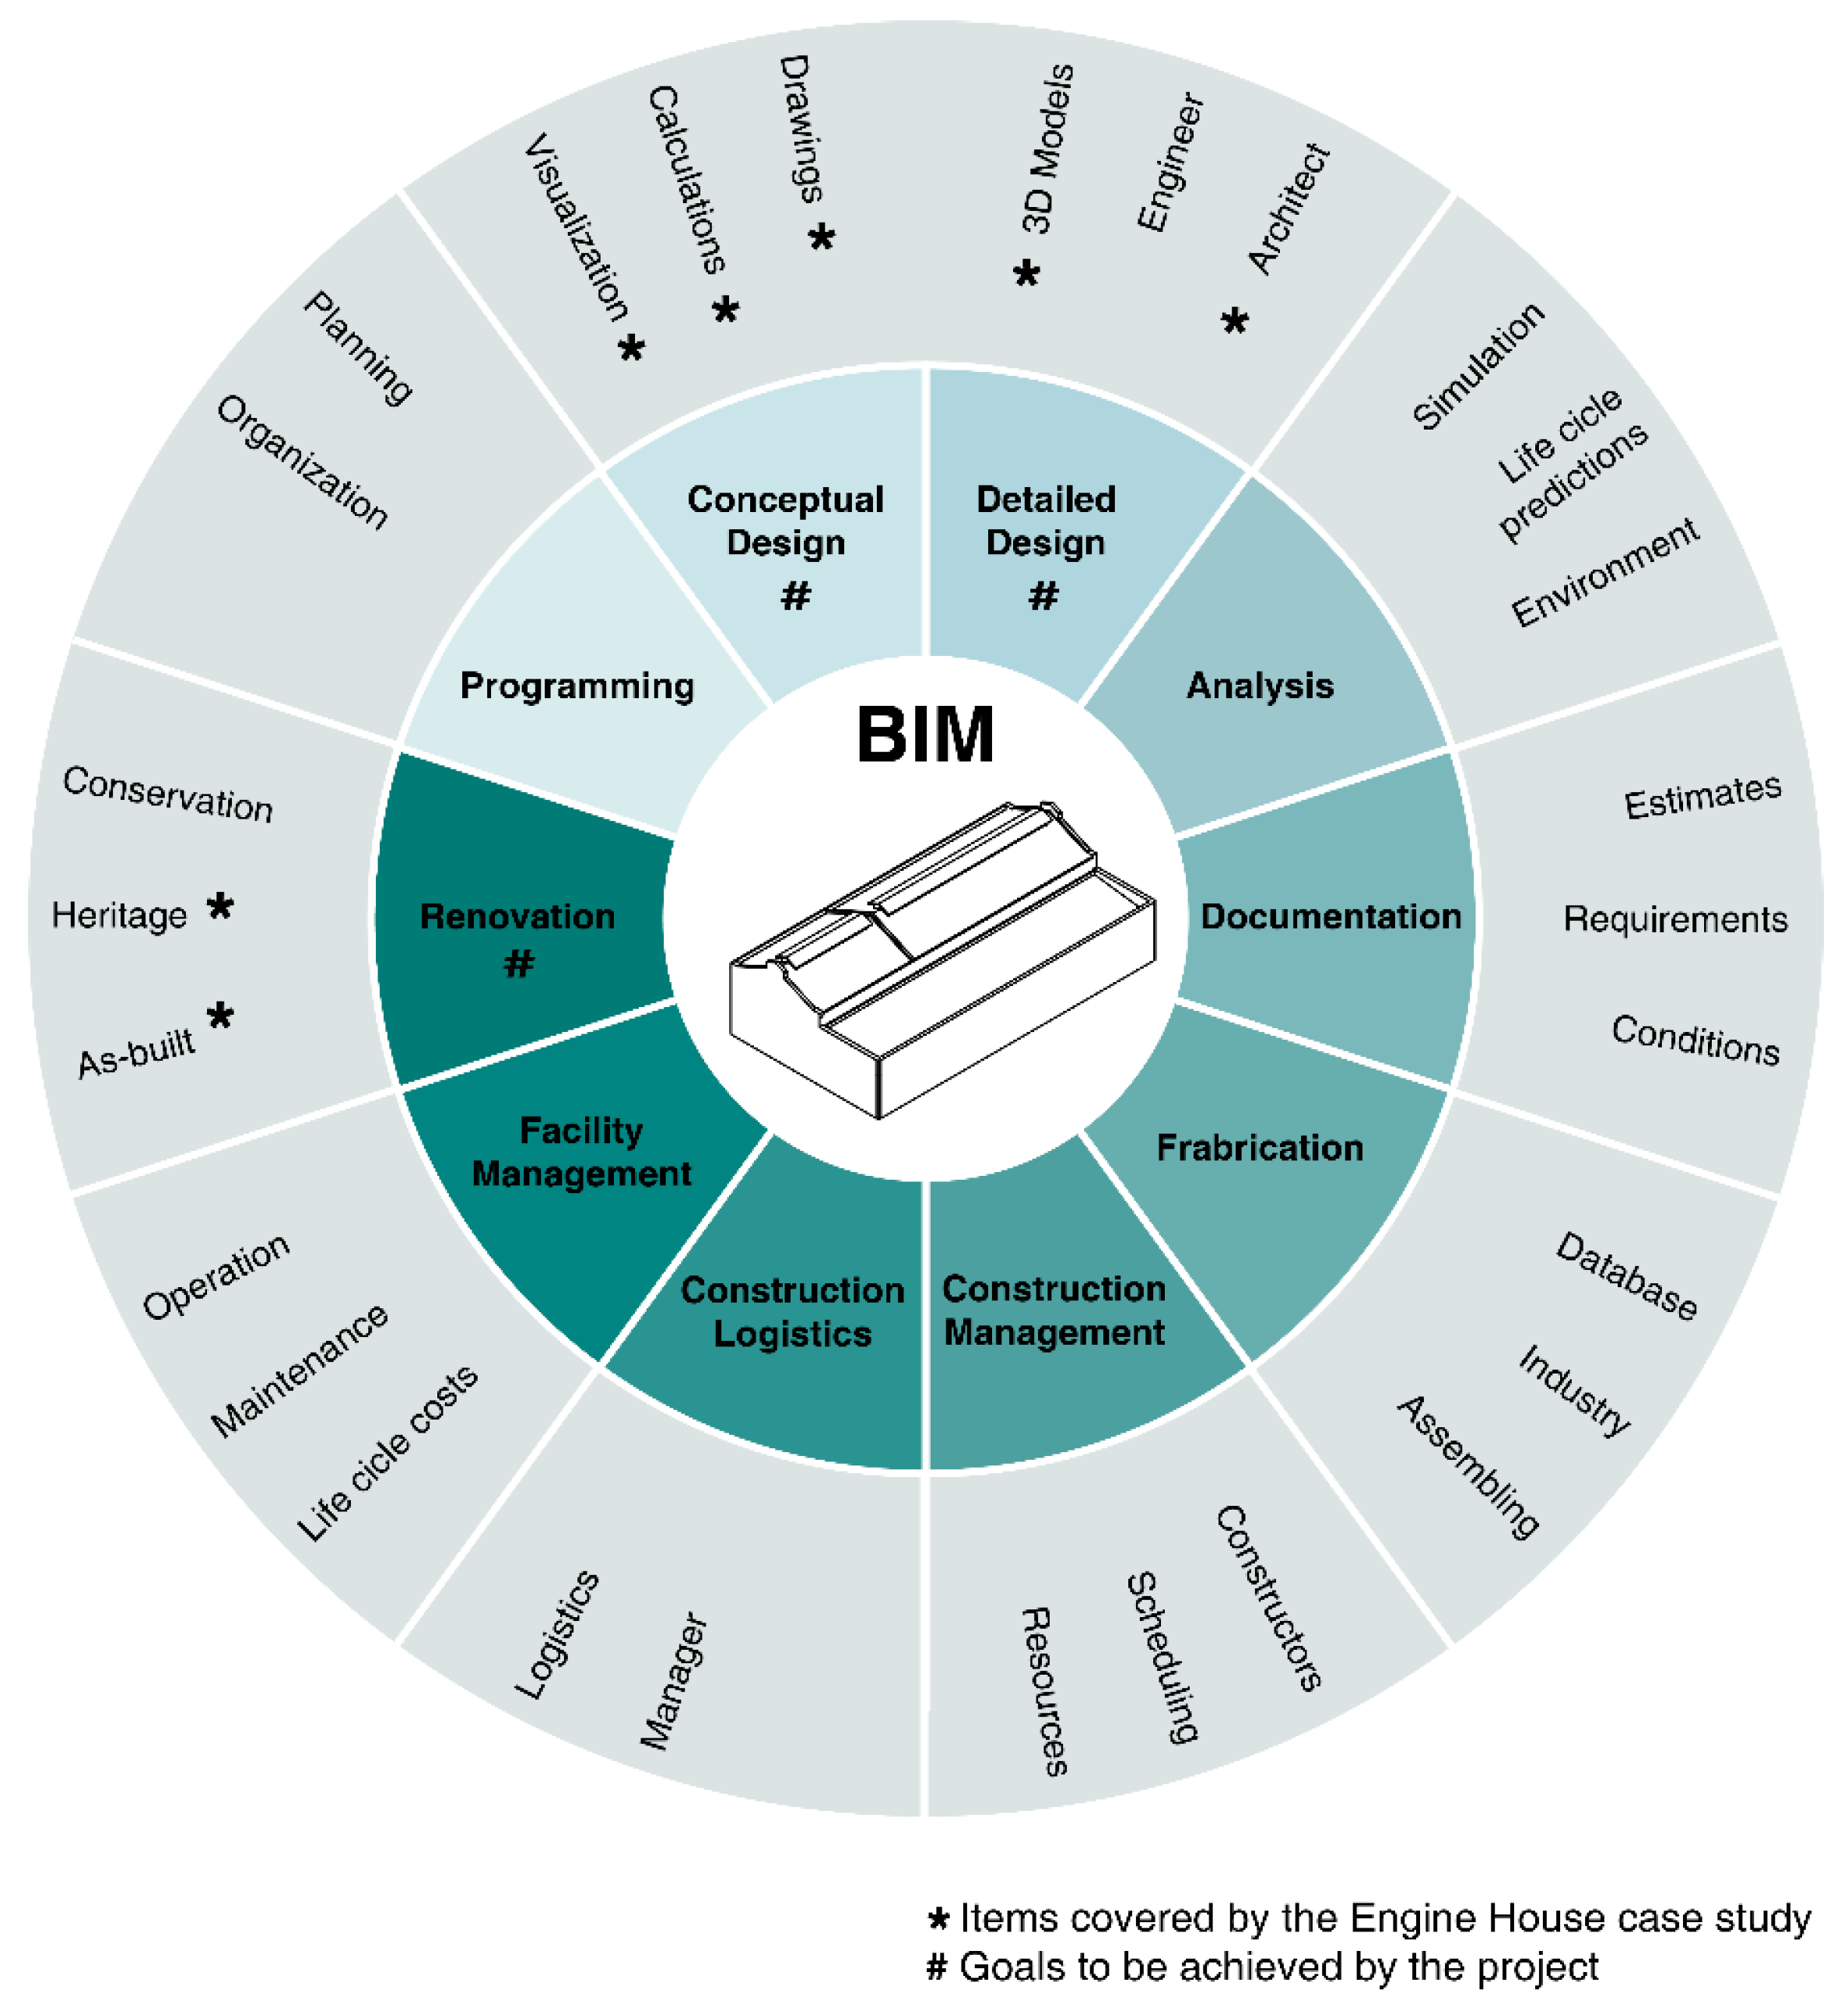
It is common to come across the misuse of the term BIM, often being linked to software and not to the process. BIM is not software, but an integrated, collaborative methodology centered on a digital building model that contains the information needed to manage the building throughout its life cycle, from design and construction, to maintenance and post-use management [5,6]. It can be defined as a union between technology, processes, and people [7]. The BIM workflow brings improvements to information management in design and construction by delivering all the data required for operational phases. Its applications cover areas such as clash detection, multidisciplinary collaboration, design option assessment, quantitative and cost estimates, building simulation, energy modeling, manufacturing and prefabrication, project management, and asset management facilities [8]. BIM needs a collaborative process for structured management and coordination, and introduces new design and construction practices that can challenge established traditional workflows [9,10]. With BIM, it is possible to automate processes and create standardized forms of detailing, thereby significantly reducing the amount of time required to produce the documents involved in construction [7]. The integration of BIM logic into the point cloud modeling process is consistent with the ability to use these native automatic processes of BIM tools in order to reduce repetitive work in modeling and documentation.
This article will address the architectural survey conducted with digital photogrammetry and 3D terrestrial laser scanning, how information is generated and manipulated and how to produce a 3D model using BIM software that can be incorporated into an HBIM workflow methodology. The Engine House of the Instituto Superior de Agronomia in Lisbon will be used as a case study to report the process, the challenges encountered and the solutions adopted in each of the stages. The client commissioned this survey to produce the necessary documentation to rehabilitate the building. While only traditional plans, sections and elevations were required; the team adopted a scan-to-BIM approach because it delivers better results than the traditional methods. We understand that the creation of a suitable BIM model is a starting point, and if done correctly, is essential to the success of a BIM working process (Figure 1). The purpose was to describe our survey and modeling workflows using this case study.
2. Background
2.1. Historic Building Information Modeling (HBIM)
The term HBIM is described by Murphy [11] as a parametric model generation solution, where architectural elements are not only represented in their geometry, but also in the corresponding attributes of a historical database. It is the application of the BIM methodology in historical heritage buildings and may be aimed at conservation status monitoring, heritage management, preventive maintenance, analysis of intervention options, conservation and restoration planning, construction simulation, disaster preparedness, and others [8,9,12,13].
The use of BIM for newer buildings can be applied using standardization procedures and methodologies that have already been developed for this purpose, whereas BIM for heritage is still a new and underdeveloped field of research [14,15]. Historic buildings often have a complex and non-regular shape, which means that more time is needed to represent the building in detail. This complexity also implies a more extended and more careful architectural survey, with a more significant scan points, and therefore, a higher cost [9].
The time and effort required for modeling increases with the complexity of the building. More detailed surveys generate bigger files, which are consequently more laborious to manage. Organic or very complex shapes are incredibly challenging for parametric modeling and BIM workflow. Two concepts are essential to address these issues in HBIM: modeling tolerance and level of development (LOD). They represent how much accuracy the model has compared to the existing object and the amount of detail and information put in the model. In historical buildings, a considerable variation in wall and floor thickness is common, as well as arbitrary deviations and inclinations. The tolerance level guides the modeler in decision-making [9,15], and LOD is essential for scoping work and to avoid both over and under modeling. The document G202—2013—Project Building Information Modeling Protocol Form prepared by AIA classifies the building elements separated by their discipline, and indicates what type of information is required for each of the LOD classifications [16].
One of the great benefits of using BIM is the reduction of repetitive work, either by automating documentation and modeling processes or by using a database of parametric architectural elements that can be adapted as needed. In historical buildings, this possibility is still remote due to the deficiency and sometimes lack of a resourceful library of architectural elements for this purpose. Baik describes the experience of creating a library of elements focused on Islamic architecture, which, being fed with parametric models, contributes to the dynamization of HBIM modeling for this type of architecture [17]. Other authors suggest that the buildings belonging to periods where construction standards start to develop, namely from the late nineteenth century and early twentieth century, could benefit from the development of libraries for those specific construction typologies and construction elements [13]. Thus, the importance of creating an HBIM database that addresses the field of historical heritage and to keep updating and customizing its elements to make them usable as needed is evident.
2.2. Scan to BIM
The integration of photogrammetry and laser scanning in the BIM workflow represents a significant advantage in the AEC sector, including existing building interventions. They are powerful techniques to document the initial condition, to keep an updated record of the construction site, to detect possible construction errors, to evaluate changes over time, and to produce as-built documentation. This is even more relevant for existing buildings where the variables of the site may not be all known a priori. During intervention in an existing building, it is normal that new relevant information appears along the process. Moreover, that may oblige the initial design to change with all the resulting implications and to update project documents. This can be quickly done and controlled in a BIM environment [15].
Photogrammetry and laser scanning are suitable survey techniques to be used on objects of high complexity or with a variety of scales [18,19]. Both are considered as mass data collection techniques [20]. The advantage of photogrammetry and 3D laser scanning is that it is possible to reduce the repetitive steps of traditional survey processes, making more time available for other essential process steps, such as building modeling or building analysis [21]. Both techniques, generated as the final product of a point cloud file, represents the captured geometry of the entire building.
The photogrammetric method is useful for situations where performing architectural surveys using traditional equipment is time-consuming or even impossible, and in cases where laser scanning is less indicated due to the size of the site or inaccessible places, such as high roofs [3]. For the photogrammetric survey to be performed correctly, it is necessary to ensure that all geometry is captured by images with enough information overlap and to avoid large jumps between photos. It is also essential to have proper weather conditions and homogeneous lighting. To conclude, further notes and measurements need to be taken on-site to correctly size and orient the model [22].
Laser scanners capture and record geometry, and in some cases, texture information on the surfaces of objects and sites [23]. The laser scanner terminology covers a variety of instruments with different types of principles and functions intended for different types of environments, purposes, and levels of accuracy and precision [20]. It is necessary to factor occlusions and inaccessible areas, to make sure that the entire environment is visible or clean enough to scan, to take enough scan points within the equipment range, and to ensure proper connections between each of the building rooms, floors, outdoor, and indoor environments. All these precautions are vital to ensure that, when the raw files are processed, the software can recognize corresponding features and to properly align each of the scans.
There are very few good examples of a detailed workflow to produce a 3D model from laser scanning and photogrammetry. Some authors worked on creating models for specific building elements with manual and automatic experiments [1,2,24], others explored the possibilities of wall creation [25,26], and others have focused on creating parametric and nonparametric families to populate existing element libraries [11,17]. Through these and further complementary examples in the literature, it is possible to understand how the theme has been explored with specific actions to optimize parts of the process. However, there is a lack of good examples that show broader challenges within the modeling. For instance, it is crucial to establish a concise and pragmatic methodology that explores the points that need to be considered, as well as to be prepared to minimize the errors in the survey, processing and data manipulation, and building modeling steps. This paper aims to fill this gap and to exemplify, with its case study, how to digitally reconstruct the building and balance the level of accuracy with the requirements needed to work with the model in a BIM environment.
3. Case Study
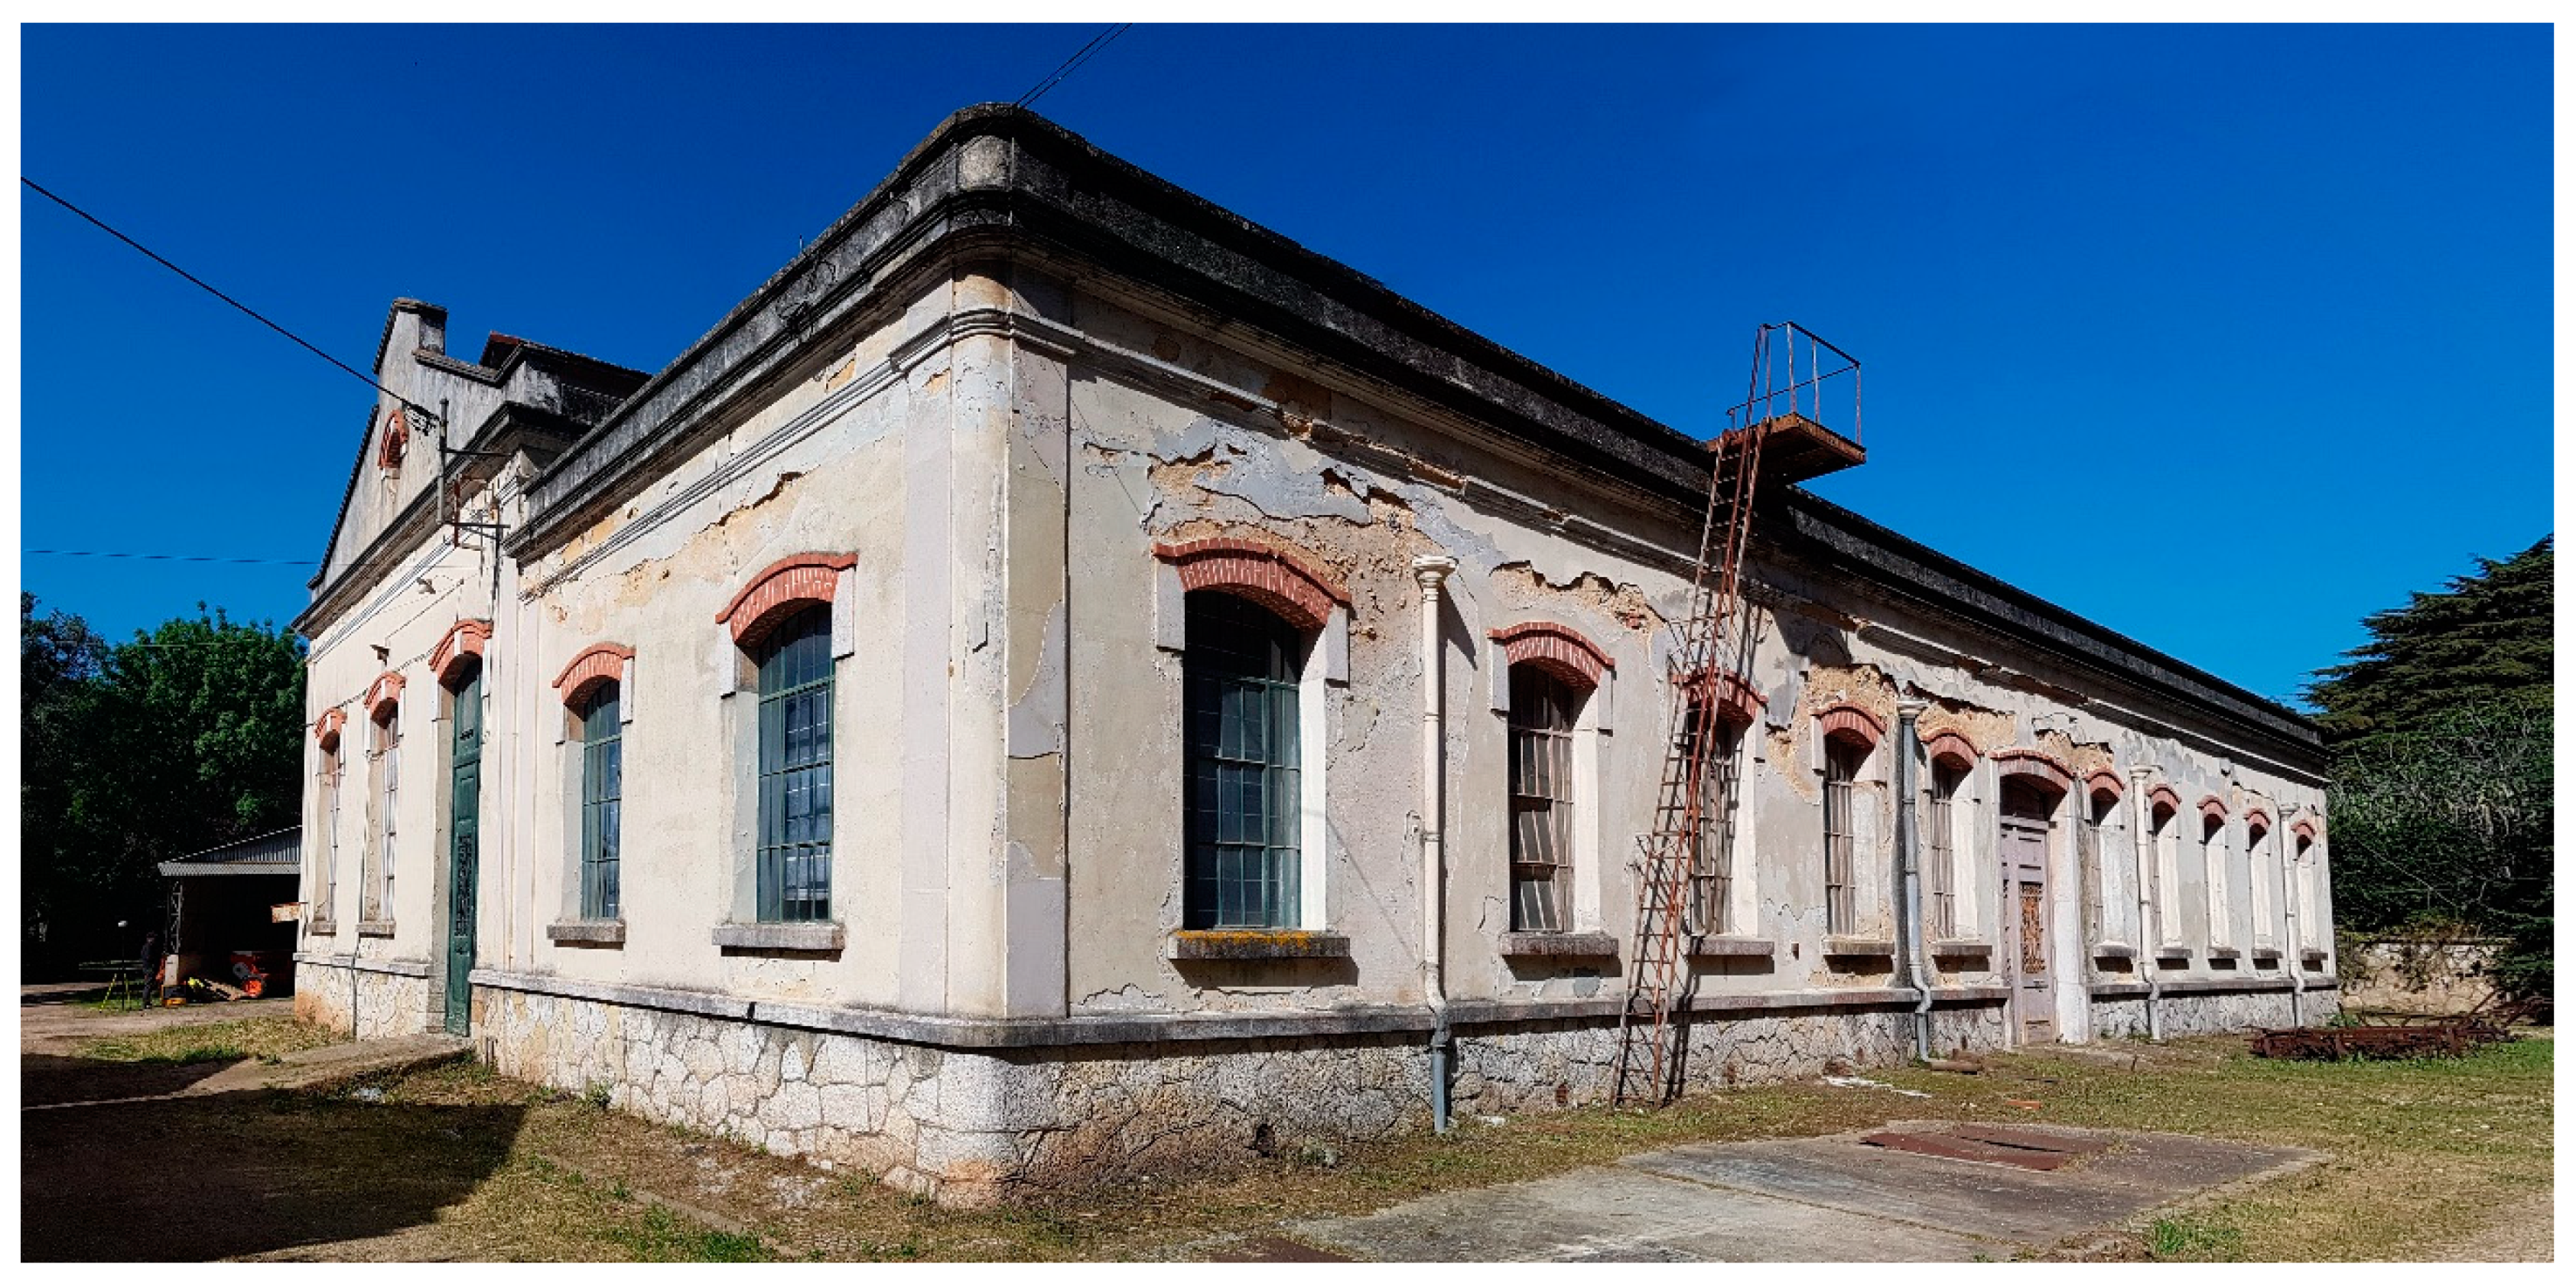
The Engine House (Geradora) of Paços Reais was built in about 1900 [27] and had different uses over the years. In the early 1900s, when the building was still called “Geradora de Electricidade dos Paços Reais”, it was intended to function as a power generator for the Ajuda region in Lisbon. At this time, the building belonged to the kingdom of Portugal. Later, already integrated with the Instituto Superior de Agronomia (ISA), it began to function as an agricultural museum with the exhibition of a variety of equipment, agricultural machines, and old photographs that show the evolution of technology in agriculture. Back then, the rooms were also used for university classes [27,28,29,30]. Currently, the building is poorly maintained, with rainwater falling from the roof, peeling walls, lack of paint, and general repair needed [27]. Due to its current state, it is only being used to store equipment and other university furniture.
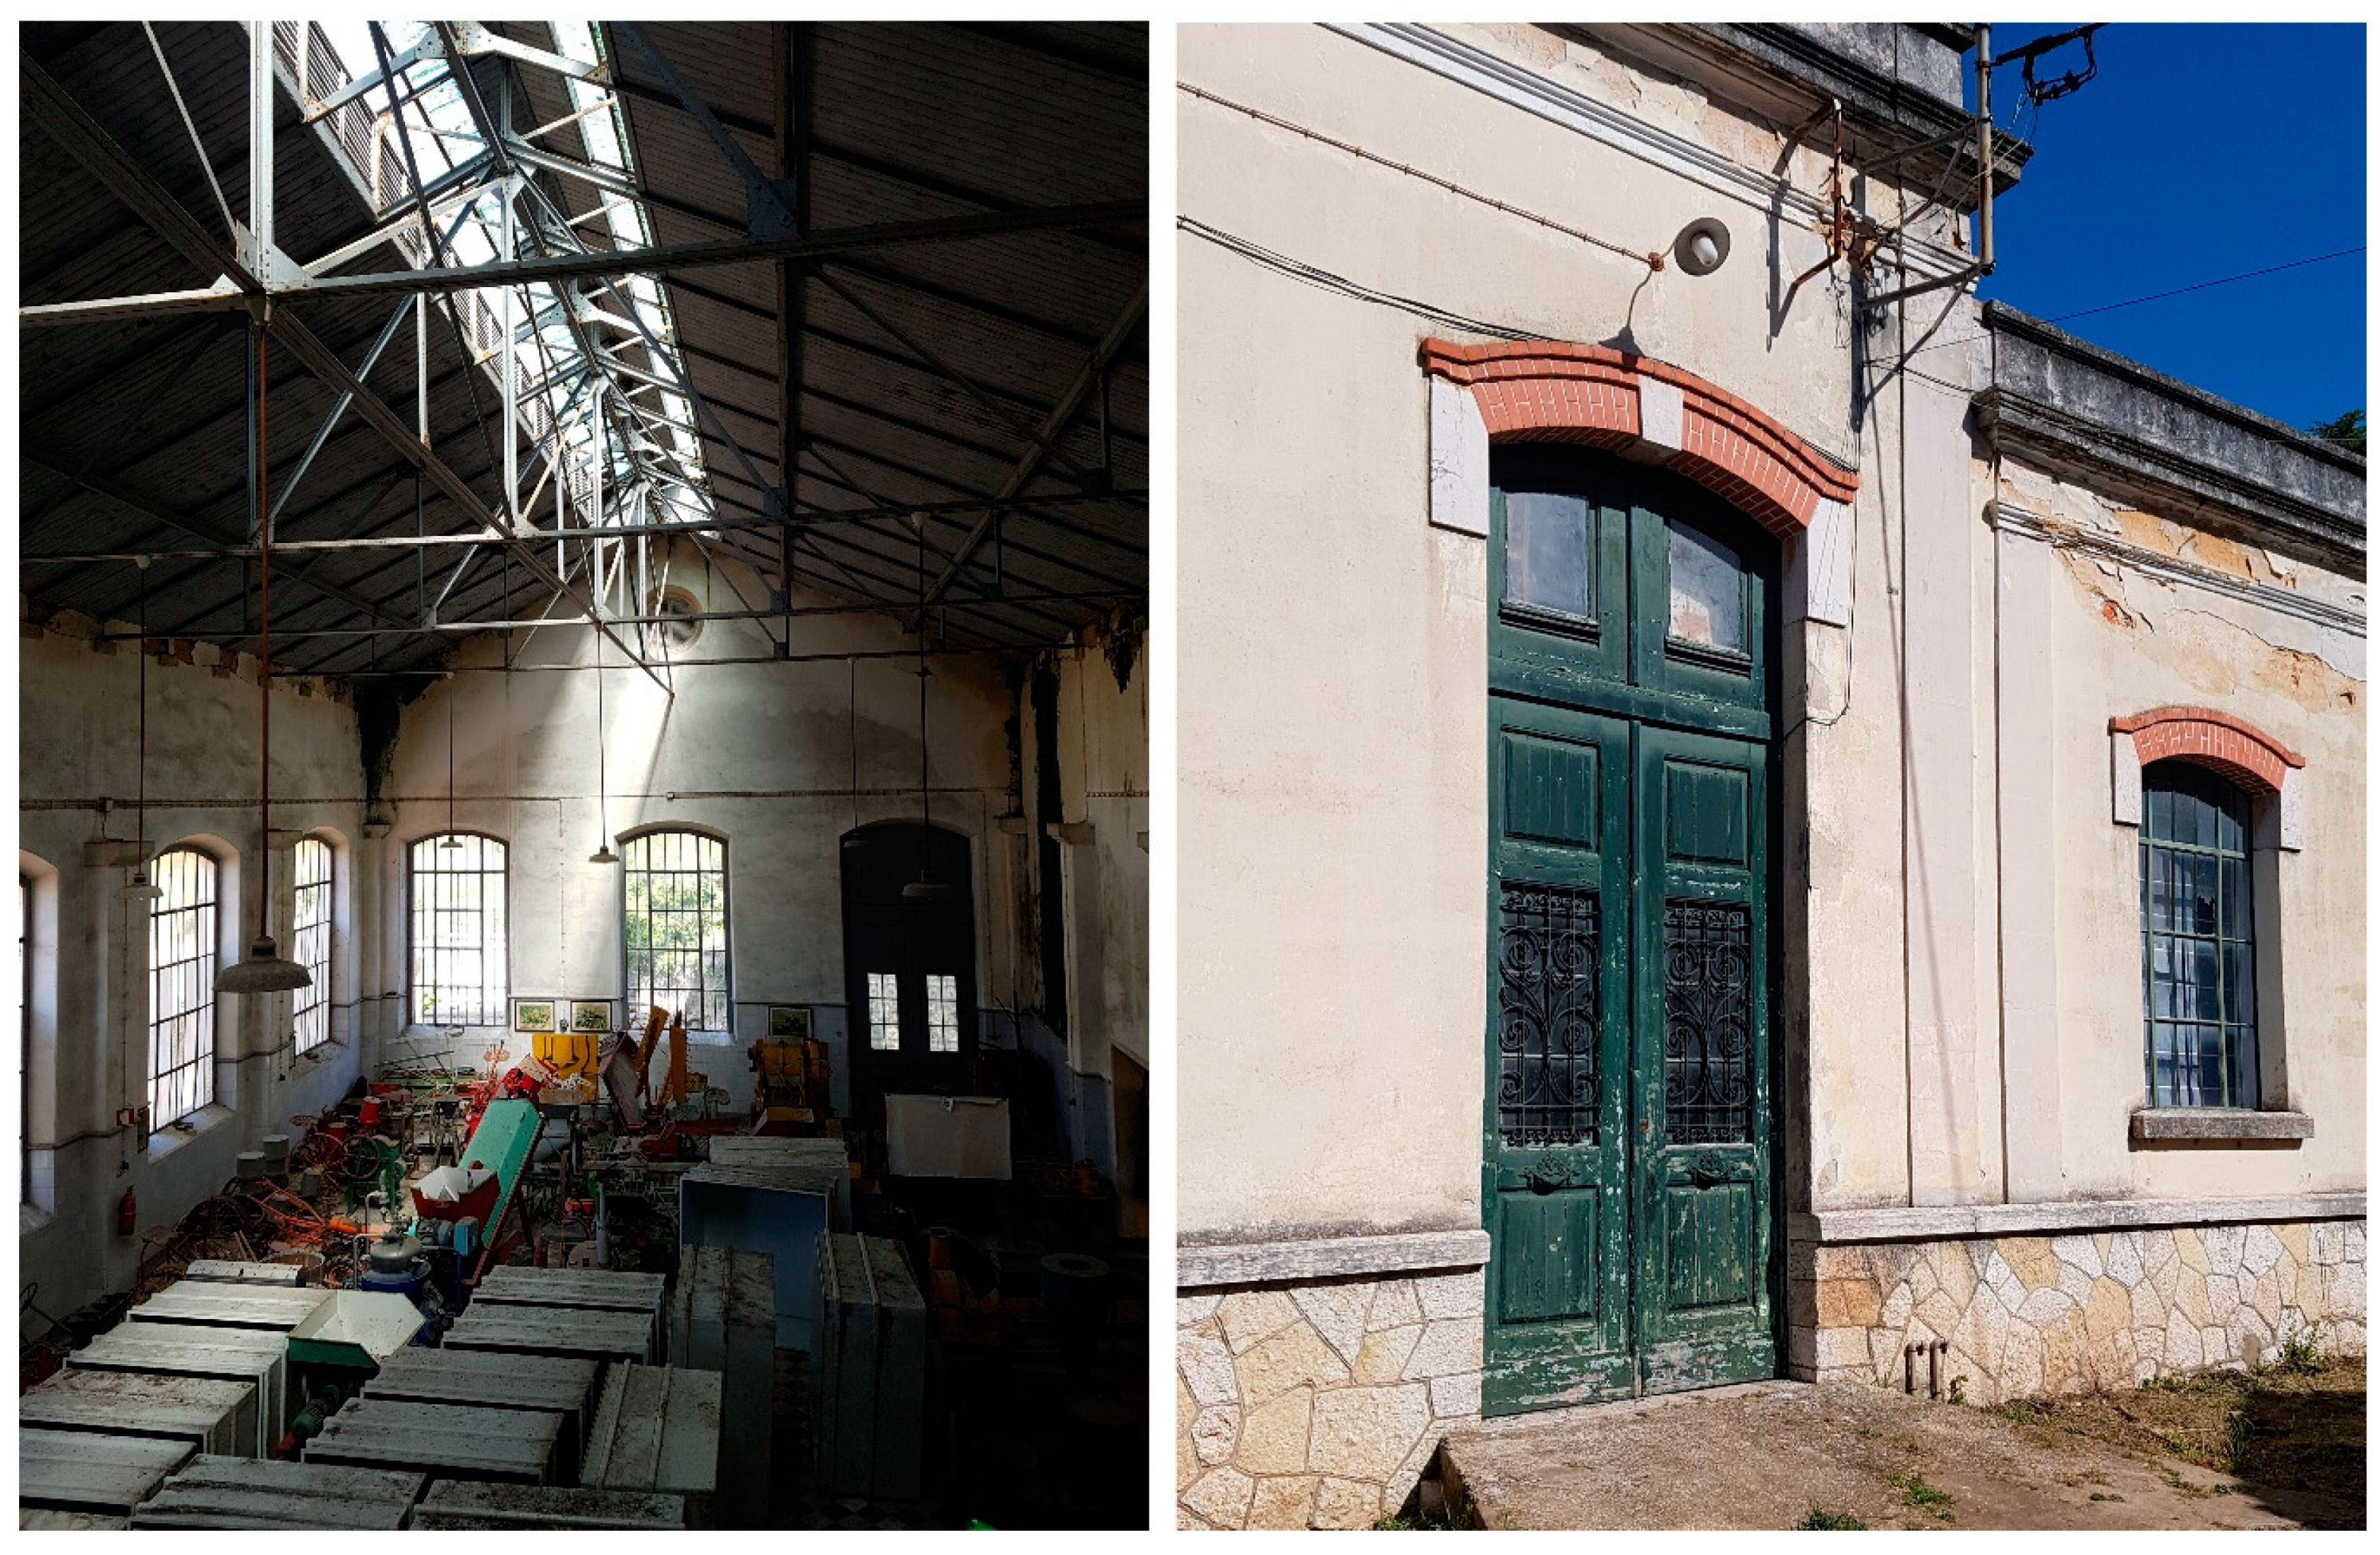
The Engine House is a two-store building plus basement and has approximately 1250 m2 of gross built area (Figure 2 and Figure 3). It has a mixed structure of masonry, concrete, stone, and a metallic structure. It consists of a sizeable principal nave where machines and equipment are currently installed, and a secondary nave with changing rooms and a few more rooms. The second floor, a mezzanine that was later added to contain offices, is supported by prestressed concrete joists. The building also has some metal trusses on the principal nave that support the roof that covers this area. Its facades have some brick details on the windows and doors, details of classic architecture on the roof and corners. Additionally, the building has a short sidewalk that goes all around and some constructions in its immediate vicinity.
3.1. Data Collection, Processing and Manipulation
The types of equipment used to survey the Engine House were a Faro Focus 120 S 3D laser scanner, a DJI (Dà-Jiāng Innovations ™) phantom four drone equipped with a 4 k camera, a Trimble R8 GNSS GPS, a Reflex camera Nikon D7200, and a smartphone for additional photographic recording
A total of 144 scans were made, of which 143 covered the entire interior of the building, its exterior facades and the lower level. One scan was made of the lower roof. A total of 11 GPS control points for georeferencing were collected and later used to georeference the photogrammetric point clouds and the LIDAR survey. It is necessary to collect a good number of different points around the building to ensure that the georeferencing process is done correctly and that errors are minimized. These are simple techniques without significant challenges, but they are essential for a good workflow. Keeping the final model in its actual coordinates is vital so that all stakeholders involved in the project can easily add new information, files, or do verifications on the model. The strategy for the photogrammetric survey was divided into two phases. The first one was an aerial campaign using the drone equipped with a camera, capturing approximately 900 images in less than two hours. The second one was a terrestrial campaign, recording around 250 photos. The entire survey was conducted in four sessions, accounting for a total duration of 10 h.
For the scanner to capture the main elements of the building, some preparation steps were necessary. The entire outdoor area was cleaned, objects were removed from the walls, all corners of the windows, doors and walls were exposed, and the survey was conducted with the doors, both open and closed to ensure that details and connections between spaces were registered. Thus, it was possible to capture the geometry with better quality. Common consequences of skipping those steps are inconsistent and there are gaps of information in the point cloud that could compromise the understanding and modeling of the building.
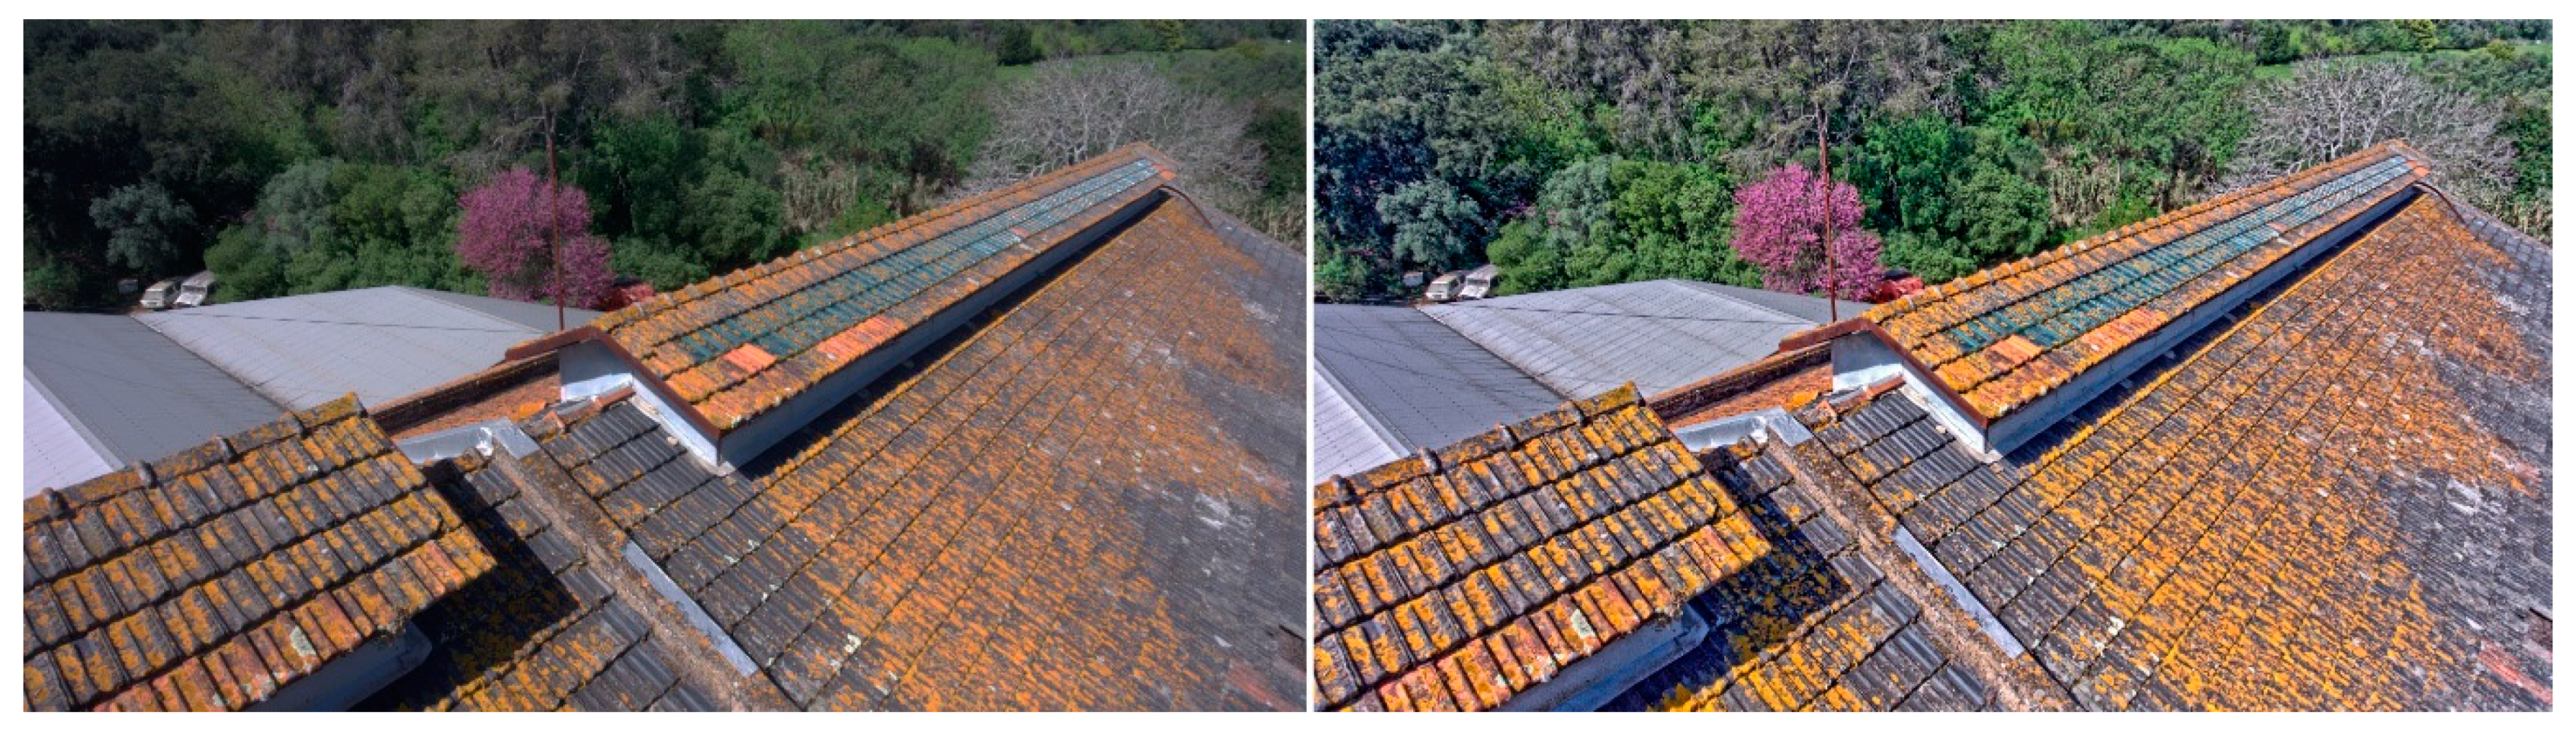
Drone imagery was used to capture the roof, which was not possible with the 3D laser scanner. Further, drone and ground-based imagery also enabled the capturing of the color and texture of the facades, which, later on, made possible the generation of orthoimages in elevations to perform studies of the state of conservation and damage mapping for each of them.
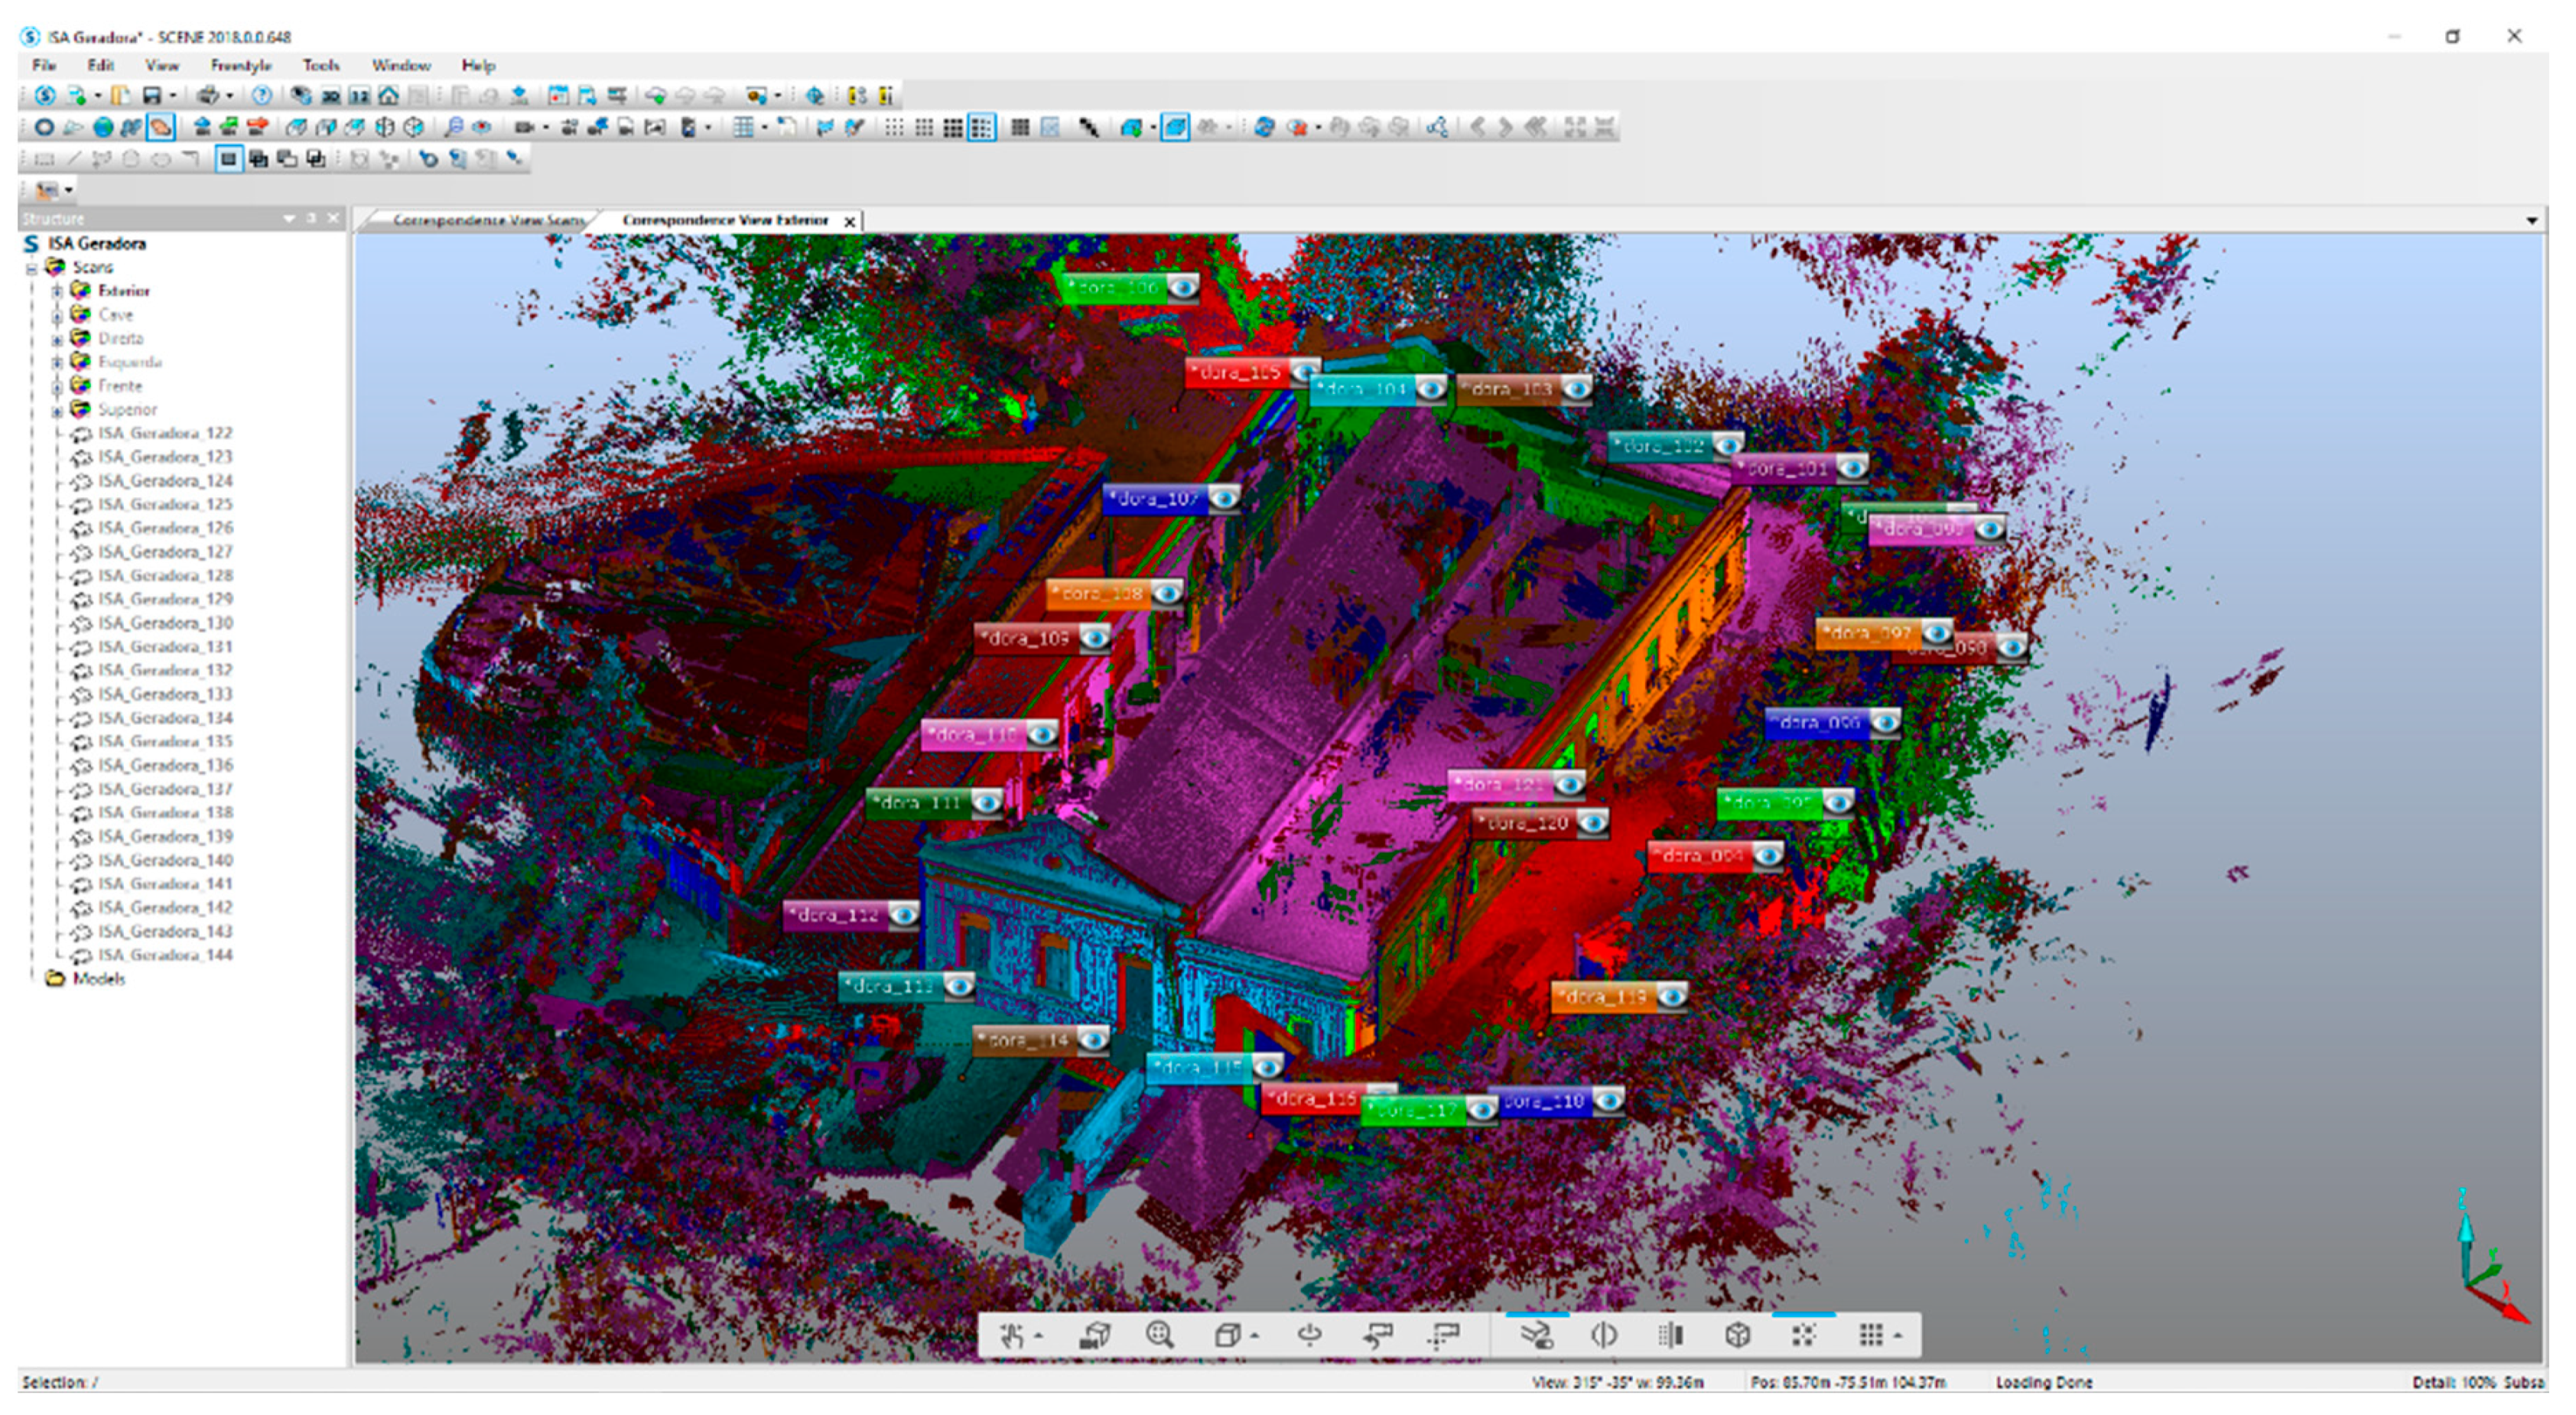
The processing and alignment of the scans generated in the survey were done with the Faro Scene software (Figure 4). A semi-automatic cloud-to-cloud alignment was performed. For better results, the operator should manually do a pre-alignment by selecting the matching scans and positioning them with an approximate relative location and orientation. Due to the size of the building and the high number of scans, clusters were created. Each cluster corresponds to a logical building part (for example, the basement, a set of rooms or a flor). At first, the registration was performed within each cluster and then between the already registered clusters. On the inside areas, the average accuracy and correspondence between the scans were between 0.50 mm and 2.00 mm, while on outside areas, it was between 3.00 mm and 5.00 mm, which is justified by the presence of trees and vegetation and the higher distance ranges. While the numerical results are satisfactory, a visual inspection must be carried out throughout the building, at least in two orthogonal orientations. In this case, this was done by dynamically visualizing moving horizontal and vertical sectioning planes. The inspection was done every 50 cm in critical places like stairs and windows. After this procedure, if a mismatch in the alignment of point clouds is found, the registration process must be repeated. It is essential to notice that there are some artifacts due to mirrors, tangential scattering, or moving objects that must be removed. After the registration was validated, the project was georeferenced. For this step, five control points were used with an average error of around 3 cm. The remaining GPS points were used to validate the georeferencing process.
After georeferencing, the laser scanning point clouds were merged, subsampled, and then exported in a point cloud file with approximately 95 million points in an e57 format to be further manipulated.
The photogrammetric process started with the conversion of raw images (Figure 5) under the criteria of adequate white balance, minimization of shadows and highlights, and masking of artifacts or undesirable objects (people, cars, and other elements). No correction in the lens distortion was applied since it represents a fundamental feature to conduct the internal calibration in further, proper, photogrammetric processing.
The Agisoft Photoscan software was used for internal and relative orientation. Both aerial and terrestrial converted images were processed together, while the internal orientation images were processed separately from them because they had different calibration parameters (1 in sensor + 8 mm lens in the DJI phantom vs. 1.11 in + 60 mm NIKKOR). The sparse cloud, obtained from the camera orientation, was filtered to remove outliers and weak reconstructed correspondences. The remaining point cloud was later densified using a half size of the photo (high Quality on the standard of Agisoft). Spatially reconstructed points were enhanced with the color information provided by the pixels of the corresponding photos (Figure 6). To guarantee an accurate match of scale and orientation with the laser scanner data (external orientation), a collection of coordinates from relevant points, recognizable also from the photos feeding the photogrammetric model, was extracted from the LIDAR data.
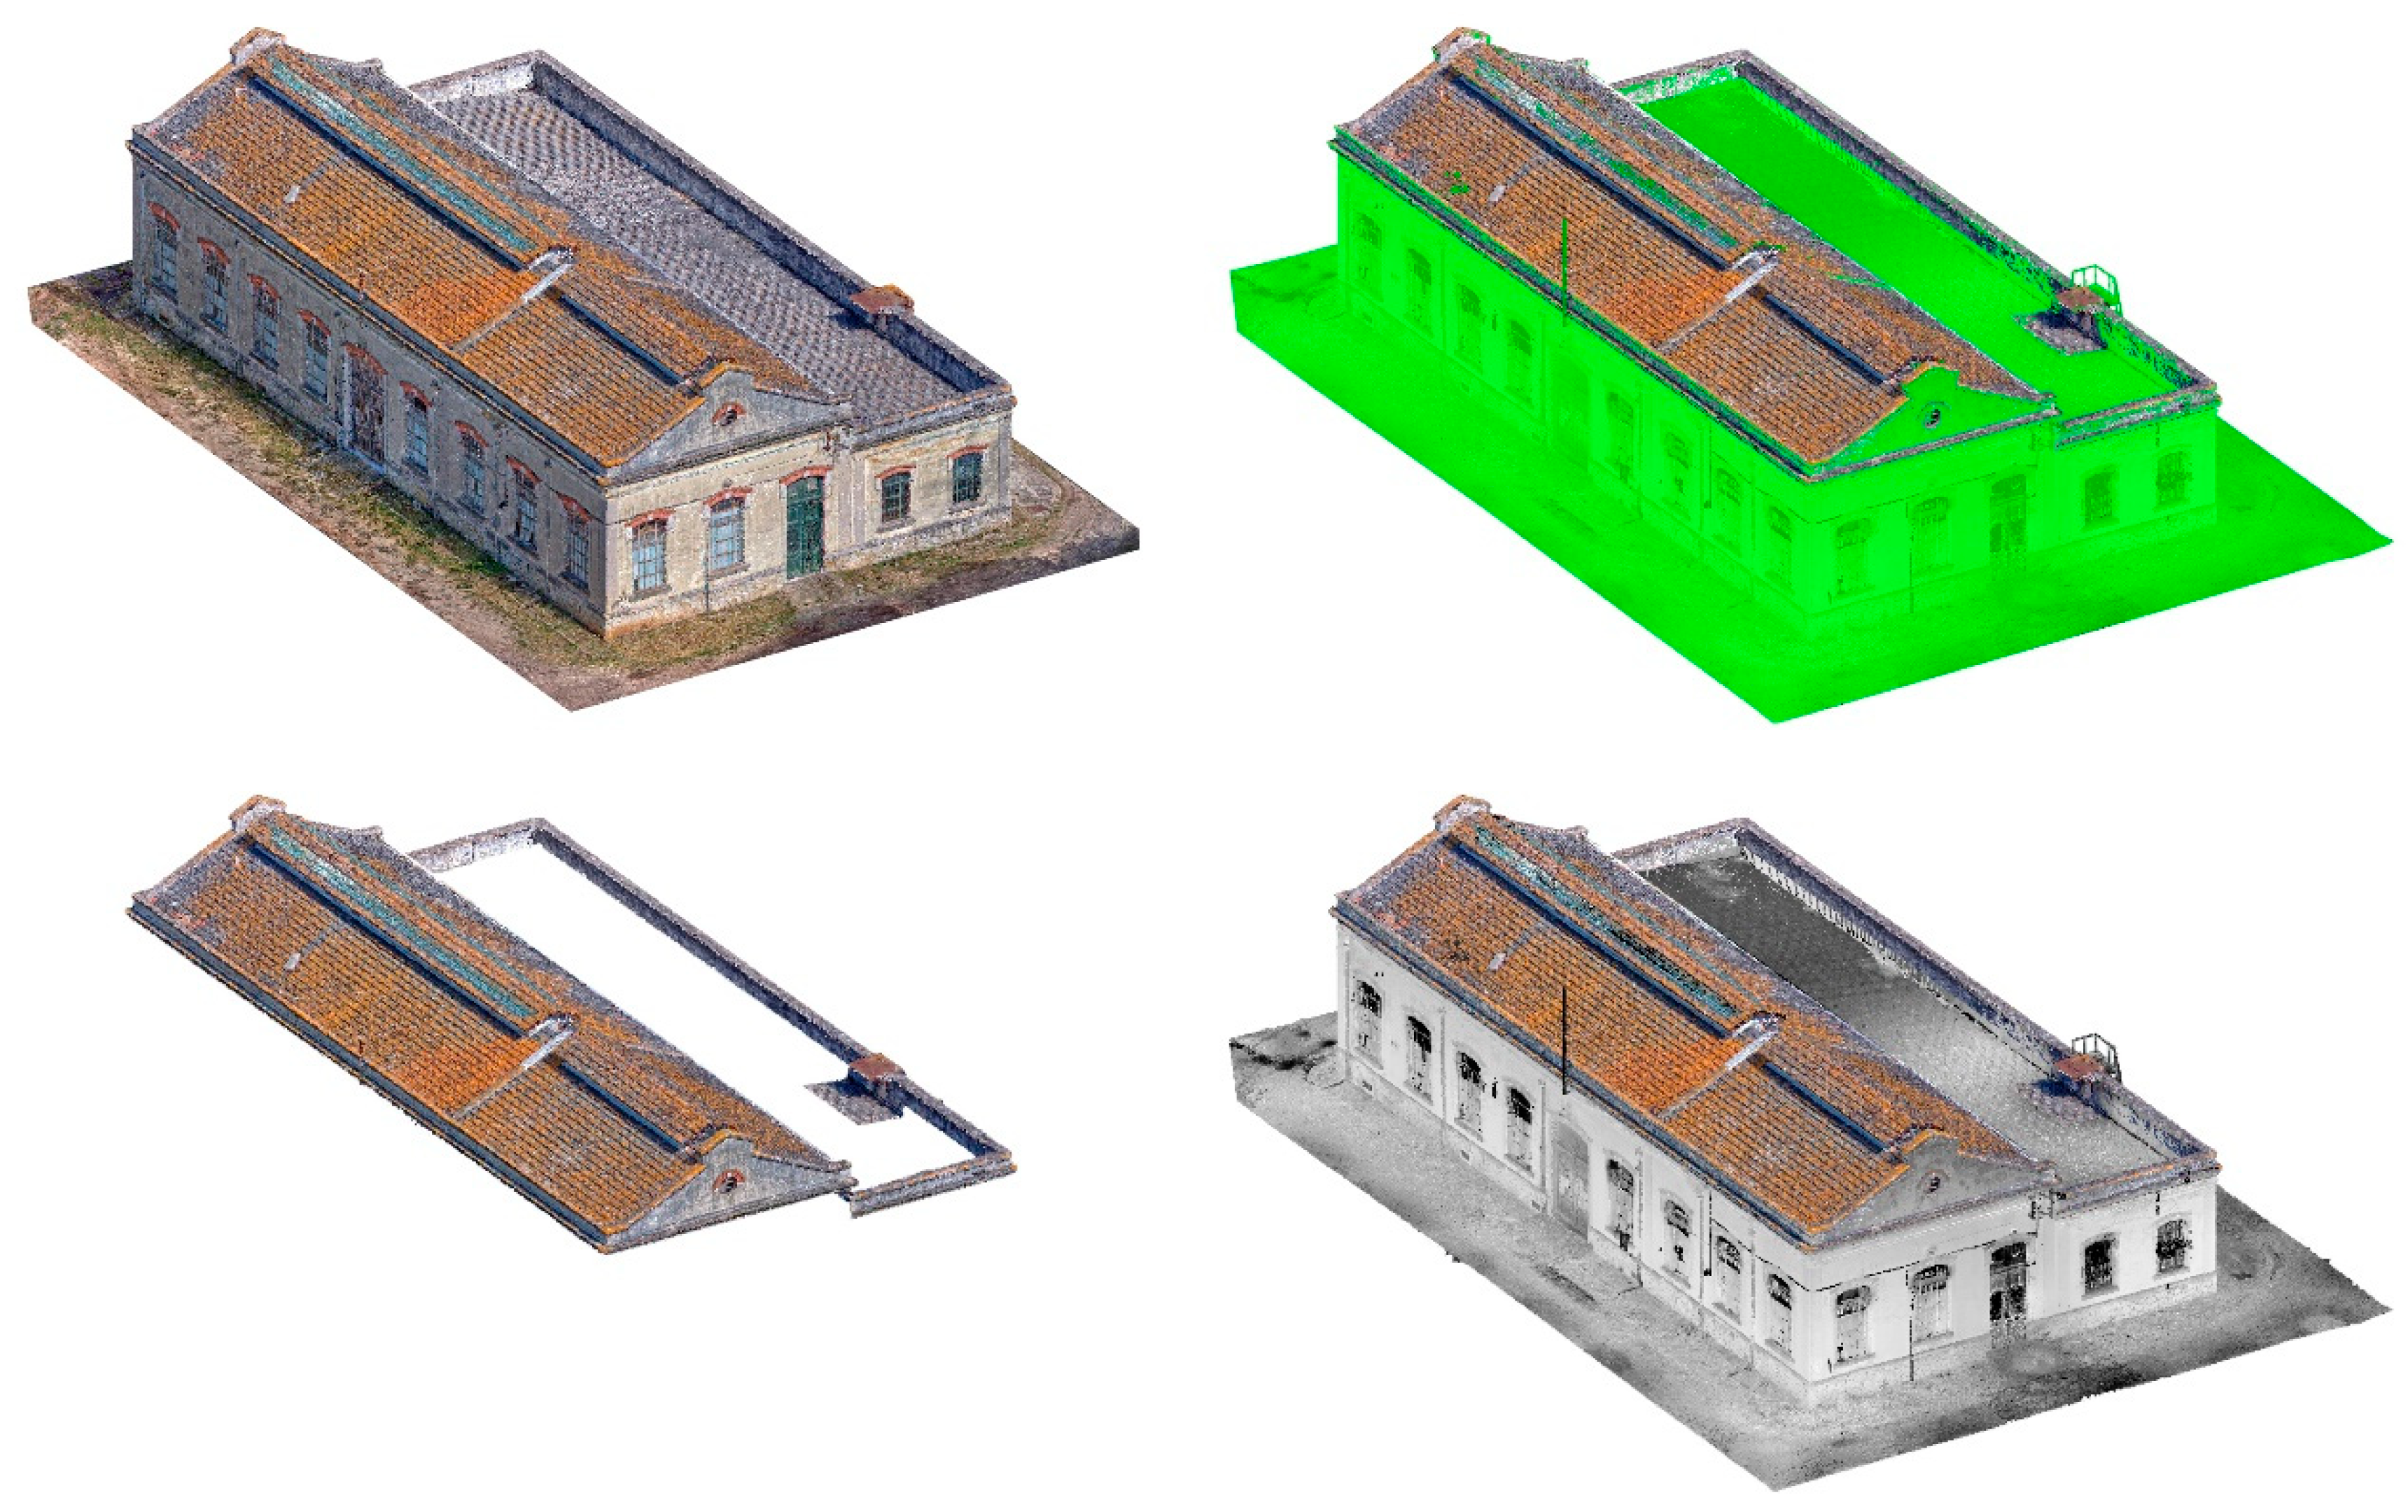
Before beginning to model the building on BIM software, it is essential to perform some procedures on the point cloud, such as noise reduction, elimination of inaccurate points, and even scene elements that are not needed for the project [23,31]. These procedures result in an optimized point cloud, and consequently, in a reduction of impact that the file size has on computer processing. In the case of the Engine House, Autodesk Recap software was used for the cleanup. Reflection artifacts, unnecessary objects from outside, people, as well as all internal furniture, were selected and eliminated. After these procedures, the point cloud with approximately 83 million points (12.6% fewer points than point cloud before the cleaning process) was saved. It was also at this stage that the georeferenced photogrammetric point cloud was incorporated into the 3D laser scanning cloud. Since the photogrammetric cloud has less definition and accuracy, only the regions that were not possible to scan were selected, i.e., the higher roof and some regions of the facade (Figure 7).
At this stage, the BIM modeling phase starts. In order to demonstrate our flow to a wider public, while ensuring the compatibility of data structure and formats to IFC (Industry Foundation Classes) standards, we selected the software Autodesk Revit. Autodesk has been a leading company in the promotion of IFC as the neutral-product model supporting the building lifecycle. In 1994, Autodesk organized a consortium, Industry Alliance for Interoperability (IAI), to advise on open language and classes to support software interoperability in the AEC/FM industries while promoting an information-centric solution and re-use of information [32]. This initiative has evolved in the last 25 year to become the BuildingSmart Institution and international non-profit industry-led organization, which develops and updates the IFC as a neutral and open specification for BIM.
Autodesk Revit has been continuously certified with the official standard and its upgrades, currently in progress in the IFC4 scheme certification [33]. Recent research has assessed the collaboration capacity in Revit [34] and compared its performance as a full IFC-complier [35], concluding that this software has the best performance in terms of standard compatibility, data loss, and misrepresentation along the data production processes. The selection of Revit for demonstration purposes in this paper is also supported by: (i) its effectiveness in importing and managing point clouds (through RCS and RCP Autodesk native formats); (ii) the provision of an intuitive three-dimensional virtual building modelling interface; and (iii) a powerful family editor tool, where standard Revit elements have corresponding IFC containers, requiring no user-actions [36] and ‘modeling-in-place’ feature allows for straightforward Boolean operations. Our demonstrated flow can be repeated without the loss of object information or geometric misrepresentation in any non-proprietary software where the data structure and format match the open Official Standard of IFC model specifications: ISO 16739-1:2018.
3.2. HBIM Modeling and Results
Much like the scanning, some steps need to be done before the modeling itself. The first one is to get a coordinate of a point in the point cloud and to set the survey point in Revit with the same coordinates. In this case, a point at ground level was chosen. Revit works with two systems of coordinates: the project base point that defines the origin of the coordinate project system (0, 0, 0), and the survey point that identifies a real-world location near the model [37]. With the survey point set-up, it was moved (without changing its coordinates) to the origin and the same position of the project base point. Thus, with this procedure, the model was guaranteed to be done close to the internal origin on Revit and to avoid some issues that could appear, as Revit does not perform well when the model is far from the internal origin coordinates. This also ensures that, when inserting the point cloud, the building’s ground level will be automatically be located at level 0 within Revit, thus avoiding the need to move or change its position.
The second step is inserting the point cloud into Revit. It must be done using the shared coordinates option, thus ensuring that the point cloud is positioned at the same coordinates that were defined when georeferenced. After that, it is essential to fix the point cloud within the project so that it is not accidentally moved or rotated. These operations are essential to ensure that the point cloud is always placed in the same position, even if it needs to be unloaded and later reinserted within the same project. In large projects, this positioning procedure allows us to segment the files and only load what is needed at that moment. The same reference guarantees that the multiple parts of a partitioned point cloud will always be loaded in the correct position.
With the point cloud inserted and fixed within Revit, it is possible to start the modeling procedures by reorienting the building within the workspace and doing a visual inspection to identify and create the existing levels. Defining a new orientation to reposition the building orthogonally in the work plane is essential. This procedure makes understanding geometry easier and avoids inconsistencies between the model and its conscious design intent, as in most cases, buildings are designed so that their walls are perpendicular to each other. This new orientation should be made by rotating the internal project North, whereas the true north of the survey should not be modified so that the model remains georeferenced. With the reoriented model, it is necessary to identify and create the primary levels of the building. These levels are necessary as they help in the creation of floors and walls and the correct insertion of the building elements. It is essential to take a pragmatic approach so that no excess levels are created, making the workflow confusing. In the Engine House case, the levels for all floors—main, lower, and upper levels—and roofs were created.
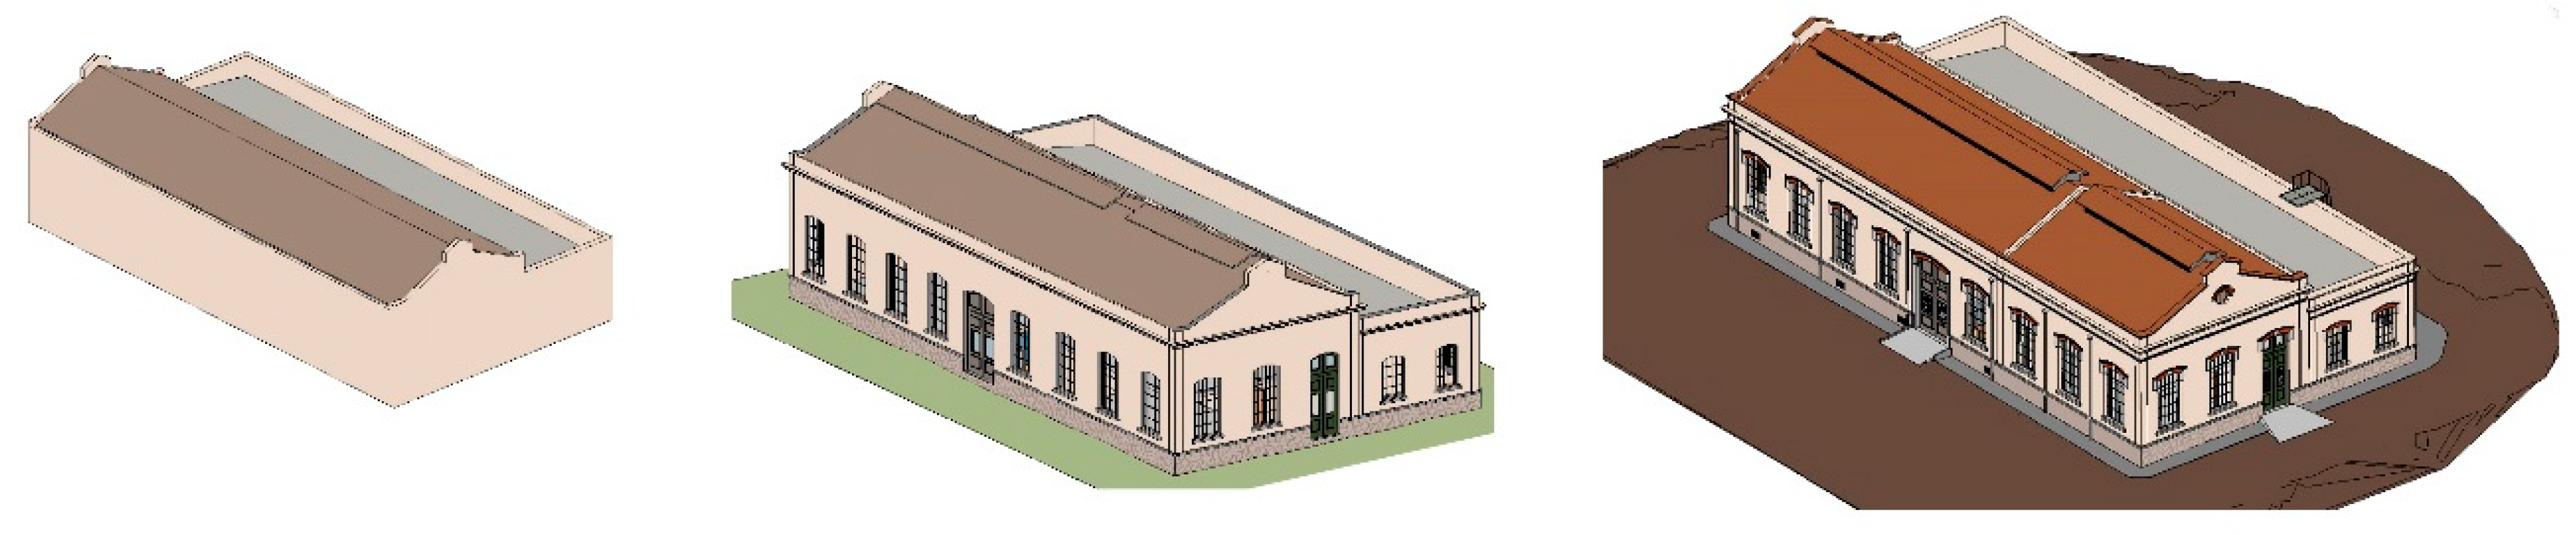
The approach adopted for modeling was to reconstruct the geometry of the building from macro to micro, that is, to prioritize the essential elements such as walls, floors, and roofs and then create complementary elements and other details (Figure 8). This pragmatic and organized methodology assists in concentrating decision-making and problem-solving efforts, as attention will only be focused on one aspect of the building. For example, while setting wall-related parameters such as finish and thickness, it is not necessary to think at this time about how to resolve the insertion of doors, windows, or any other existing openings.
In historical buildings, it is common to have walls with inhomogeneous thicknesses, deviations, and the lack of perpendicularity. The non-orthogonal walls impair HBIM workflow, and it is necessary to pay attention to this aspect to decide the approach that will be taken. The Engine House did not show large deviations in internal walls, which allowed for the orthogonal modeling of these elements. However, its external perimeter was not perfectly rectangular. One of the walls presented a difference of more than 5 cm in its real position from an expected perpendicular angle. In this case, if a considerable deviation verified, a model of the wall in its real position, with the correct deviation to keep the geometric characteristics accurate to reality, was decided. The walls were created with the corresponding thicknesses, accurate up to 1 cm tolerance. It was also decided to separate the exterior and interior finishes, allowing, at the end of the process, for the generation of a schedule with the number of finishes related to external or internal applications.
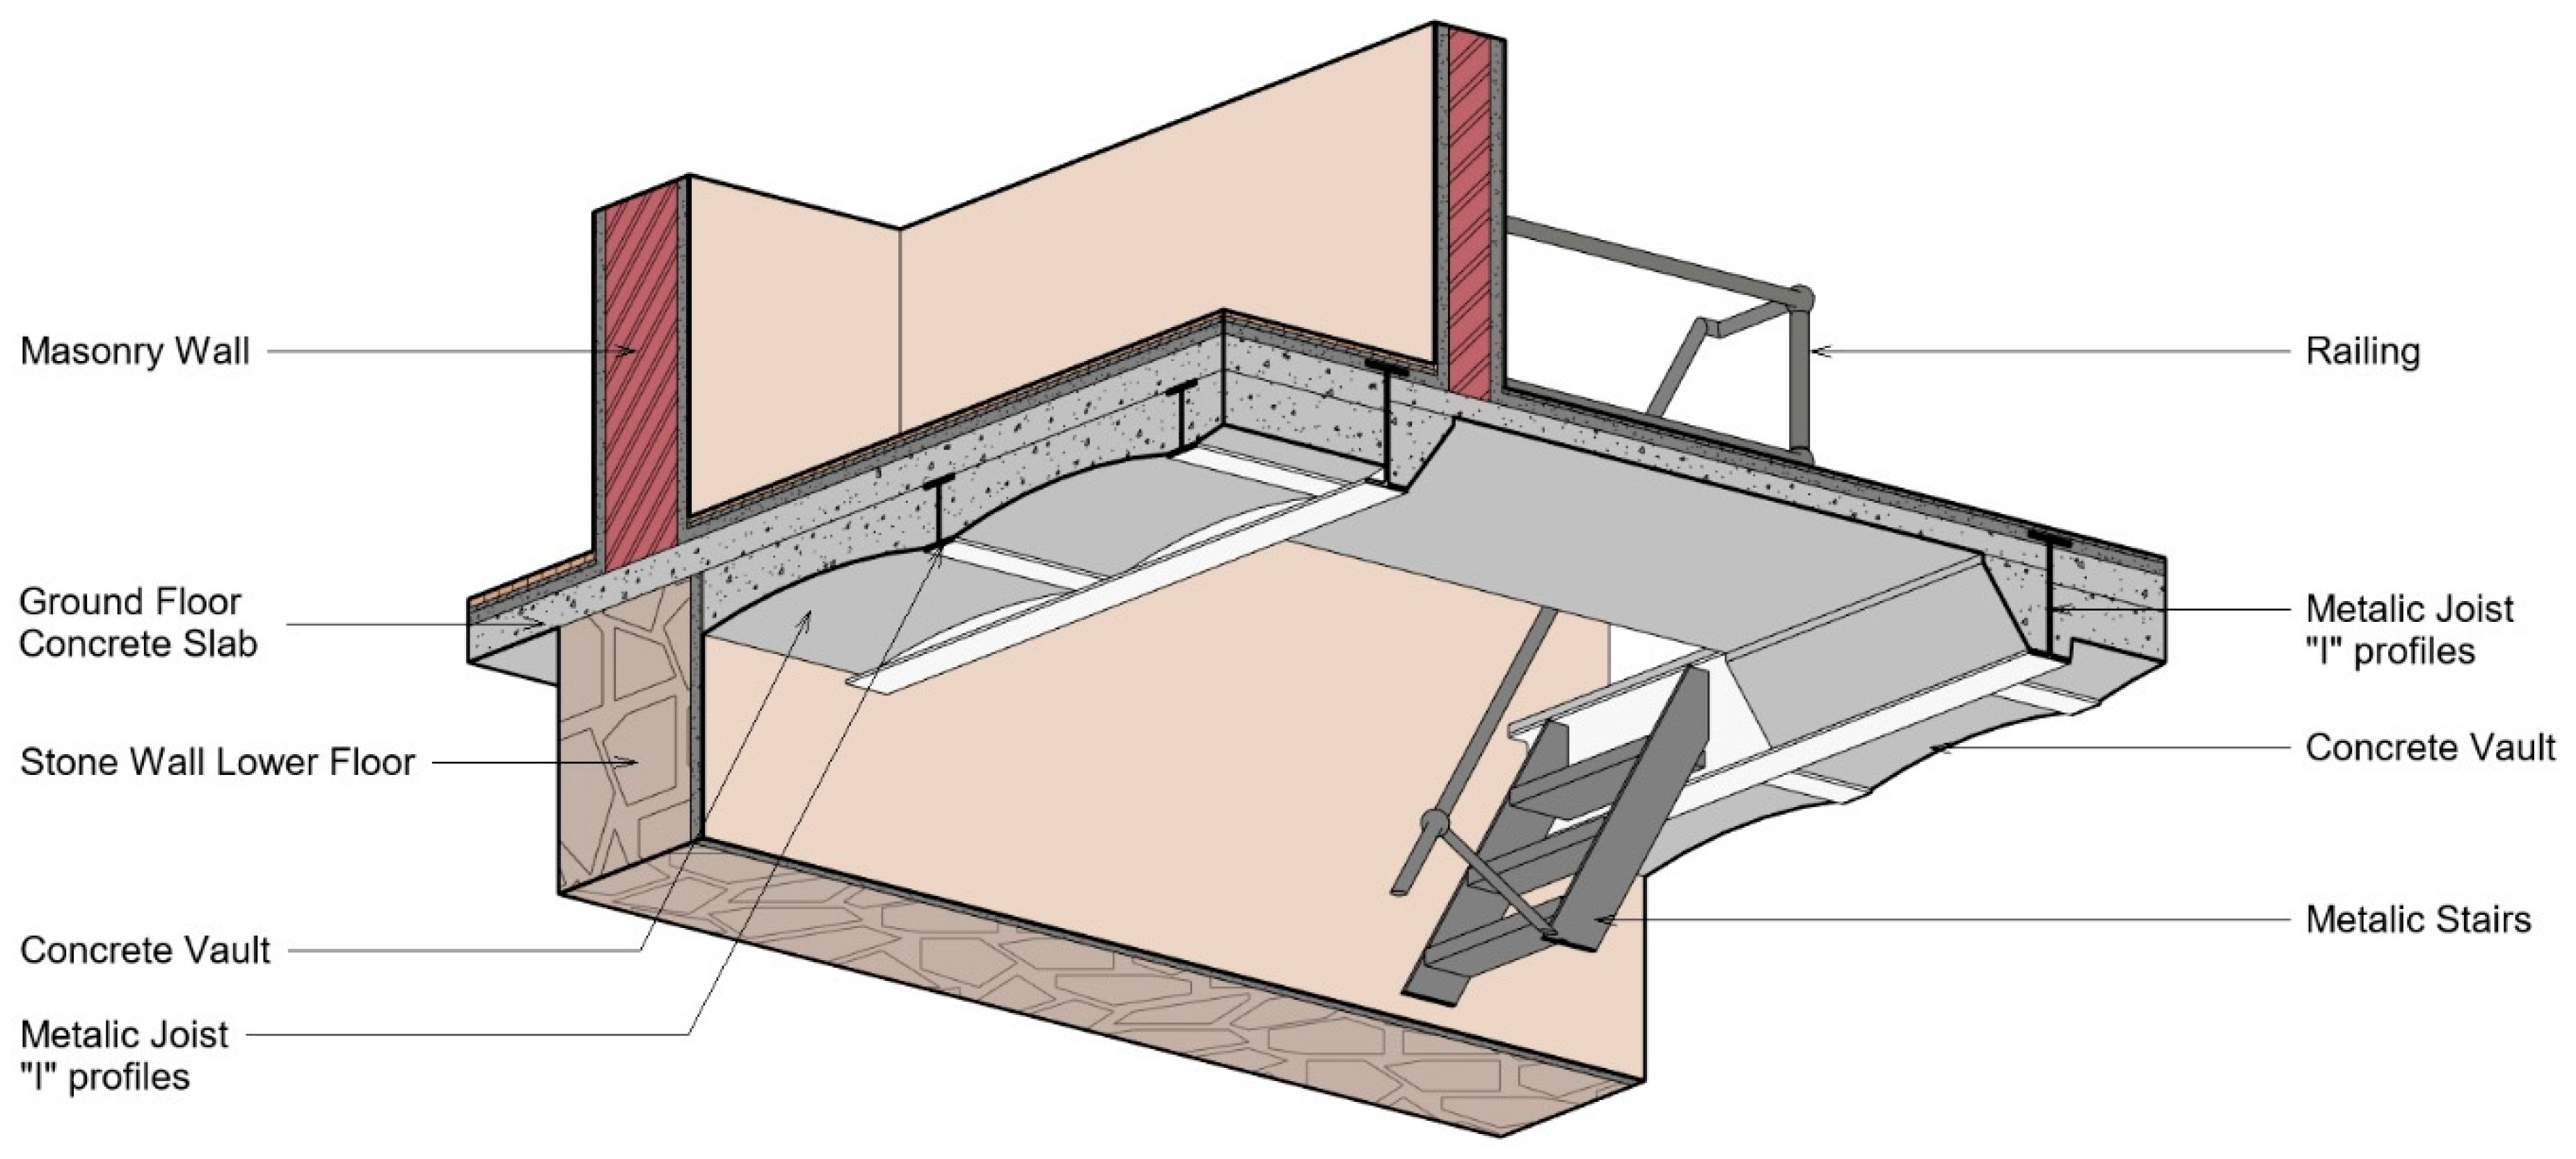
The model was created in order to avoid conflicts and clashes between the construction elements. The modeling was carried out by a single team that had full control as to how it was to be performed in order to avoid those conflicts. The interaction of floors, beams, walls, and other elements was carefully performed to ensure a perfect intersection and to reflect the original building with high fidelity (Figure 9). Still, we had conflict issues at some points, such as between the trusses with walls and roofs. This occurred due to the impossibility of accessing these points with proximity, making the survey of the highest areas of the building less accurate.
3.2.1. Family Creation
Within a BIM workflow, having an extensive family library makes modeling more natural and faster. Since, most of the time, these families are parametric elements, they can be adapted to project needs, thus enhancing productivity [17]. However, there is a deficiency of libraries that meet the requirements of HBIM projects, resulting in the need for the complete modeling of these families.
Autodesk Revit is a hugely versatile and powerful modeling tool, enabling us to create modeled families on the project itself or externally within the family editor. In either case, the element can be classified into the correct category so that it behaves appropriately within the project as a family made for this purpose. In the Engine House, all windows, external doors, and access hall doors were modeled. Other internal doors could be adapted from existing elements in the native software library.
Revit Family Editor does not support the insertion of point cloud files in traditional formats. Thus, it is necessary to separate the points referring to the objects to be modeled and export them in dxf format in order to insert it in the family editor (Figure 10). In the case of study, this procedure was done using the software CloudCompare. Another challenge was that, by default, the doors and windows in Revit are modeled with a rectangular wall insertion cut; however, in historic buildings with thick walls, it is customary to the insert the cut to be chamfered both horizontally and vertically. This situation makes it impossible to use existing families, and it is necessary to create new ones that use another type of wall cuts by combining some Boolean operations such as void forms, sweep, extrude, revolution tools, and others.
Creating custom families can be time-consuming, complex, and highly parameterized elements can often make this modeling as laborious as that of a complete building. It is necessary to understand for what purpose the family will be destined to decide how modeling will be done and to avoid unnecessary work. At the Engine House, the adequate families were identified, and it was decided which dimensions within them would be necessary to be parameterized. This saves modeling time by taking advantage of the same window family, for example, in more than one situation.
In addition to doors and windows, other elements were created as specific families, such as profiles from roof and facade details, stairs, handrails, and columns. The building has two internal stairs, and each one was modeled with a specific approach. The staircase that connects the ground level to the mezzanine has a metal structure and wooden floors. It is quite particular because each of its runs has different floor heights. Thus, if we chose to model the stairs with the native Revit tool that standardizes each step with the same height, we would end up with a big difference in the height of some floors and the central landing. It was decided to segment the construction in two stages, with the first two runs having a floor height of 17.75 cm and the third run with 20 cm to avoid more significant deviations. The stair supports were modeled separately from the stairs so that we had control of their exact positions. The handrails were modeled with the specific Revit tool for this purpose, with custom handrails and balusters following the existing pattern. We had no issues with the stairs that connect the basement to the ground floor. It is a standard metal ladder and did not show significant differences in its floor heights. The most complicated element to model was the handrail because its balusters have a distinct shape. In this case, specific handrail families were created.
Both cases showed us that the solution is not the same for all situations. It is often necessary to decompose the geometry to be modeled and to use various techniques and tools to get an ideal model. The non-uniformity of geometry and imperfection, which are present in reality, are points to be considered so that the adopted decisions and approaches are made consciously. It is important to carry out the modeling carefully with attention paid to the detail of the building so that the model matches the building geometrically and visually and meets the client’s needs.
3.2.2. Automation in Topography Creation
Complex construction elements need to be modeled and analyzed accurately and on time. This goal is pushing researchers towards the search for automated solutions in BIM data generation. During the last five years, the publications in BIM automation have grown around 400% (229 paper from 2014–2019 and 57 paper from 2009–2013, retrieved on SCOPUS using the keywords BIM and Automation). However, there is a disconnection between industry practitioners and researchers, particularly on the criteria guiding the implementation of BIM in the construction industry [38,39]. These mainly affect the implementation/integration of automation on real non-modular contexts. Complex forms, multiple morphological, and typological variables remain primary barriers to standardize automated solutions in BIM modeling. However, there are substantial chances the increment in processing capabilities, and new knowledge in graphic and computer vision will bring reliable standard solutions in the short-term future. Within automation for BIM, Topography modeling has received extensive attention, and scientific developments have been efficiently implemented in commercial solutions. The topography around the case study building had a few slopes and deformations, yet manual modeling still meant excessive work and inaccuracy. To avoid errors and to save time, an external plugin installed on Revit called “Scan Terrain” was used. This plugin allows us to create a topographic surface from the point cloud automatically. Users can define the size of the crop within the cloud, the distance between the created points and the height limit of the points that will be on its surface.
In this way, the topographic surface can be created in seconds, but it is essential, nevertheless, to perform a visual inspection and correction of some points that may have been created incorrectly. The plugin algorithm can identify horizontal surfaces and avoid vertical elements such as walls and furniture, but some elements such as steps, floors, and plants can still be confused with topography. The lack of regularity in the point cloud, the presence of areas that were not well captured by the scan and half-height vegetation were also interfering in the proper plugin’s functioning. Therefore, for best results, a preliminary point cloud cleaning is required, and after the topography is created, manual adjustments are required. Still, this method proves to be very efficient in delivering a model with high quality and accuracy and saving modeling time.
3.2.3. Results and Discussion
At the end of this modeling process, a BIM model with high accuracy and precision (Figure 11, Figure 12 and Figure 13), with a level of detail between LOD 300/350, according to the document G202—2013—Project Building Information Modeling Protocol Form from AIA [40], was obtained, thus integrating it with a restoration work methodology and enjoying the benefits that BIM brings to these projects. In addition to containing all the architectural elements, the final model also had the modeled structural building elements, roof, and stairs. Parametric families have been created for doors and windows, allowing them to be used in similar projects, simultaneously creating a verified library. In addition to the HBIM model, the complete set of plans with the floor plans (Figure 14), sections (Figure 15), and elevations were generated. The scan-to-BIM process proves to be extremely efficient when dealing with historic buildings as it not only saves a lot of field time in the survey, but also saves time in the office by using BIM software to do the three-dimensional reconstruction of the architecture as well as the technical drawings needed.
The proposed workflow (Figure 16) (Table 1) consisted of creating a BIM model that is prepared to have its level of detail increased if necessary in the future. Some of the elements were modeled in more detail, reaching the LOD 350 (trusses, doors and windows), while others stayed on the LOD 300 (walls and floors). This was due to the impossibility of checking the materials that constitute the core of some elements. Thus, their model was restricted to its dimensions, size, positions, orientation, and finishing materials, but without a distinction between the inner layers. The final model, besides the geometric reconstruction of the building, contains all the elements classified according to its use, with their finishing materials and structural and support elements when possible. The BIM model is not static; the LOD can be increased by updating geometric and non-geometric information (such as physical and material performance characteristics, costs, manufacturers, compositions, and others) at any time.
With this methodology established and applied, it is possible, in a second moment, to explore other specific points of the process, such as the modeling optimization of other building elements. Besides, there is a significant expansion potential when working with multidisciplinary teams to broadly approach the BIM methodology within heritage projects.
Scan-to-BIM mostly remains a manual process that consumes a lot of time and effort from users. This need for the manual approach is due to the enormous amount of data needed to be managed, the difficulties and challenges of rebuilding occluded parts of buildings, and the lack of semantic information in point clouds [25]. Automation of modeling optimization has been a recurring research topic and has had little progress so far. One challenge is the variety of building typologies contrasted with the requirement of a universal approach that meets all of them. Another one is the ambiguity and errors in the data collected [41,42]. Walls are one of the possible points for conducting automation experiments, as they have few parameters and little variation in their shapes [25,43,44]. It is also possible to think of approaches for the automatic generation of more complex geometries such as façade details, ornaments, and vaults [2], because, in these cases, creating models with manual processes can be very laborious.
4. Conclusions
The use of photogrammetry techniques and terrestrial 3D laser scanning made a significant contribution to the field of architectural survey, construction, conservation, and restoration. The possibility of recording the current state of construction of buildings with efficient, fast, non-invasive techniques, and above all, with a high degree of precision, enables more complete studies, more accurate interventions, and a reliable record of the building in its as-is condition.
It is essential to use new methodologies for the three-dimensional reconstruction of buildings to explore the full potential of the survey. The BIM methodology allows access to design information that the CAD system would not allow, such as having the complete 3D model of the entire building with embedded information and attributes, which can be extracted into data formats to be analyzed in later processes. Using a pragmatic and organized modeling methodology allows the model to be reconstructed more quickly and efficiently. The proficiency in tools available in the adopted software is essential to ensure quality models and practical solutions to complex problems. The creation of an HBIM model from the scan-to-BIM processes allows building integration within a workflow for heritage studies and makes it possible to enjoy all the benefits that BIM brings.
The experience of the operator is crucial at all stages. The use of laser scanning and photogrammetry equipment requires knowledge to avoid basic beginner errors that could make data alignment and point cloud generation impossible. Conversion of the point cloud to a BIM model requires a high degree of software expertise as well as knowledge of architecture and building techniques. Architects, engineers, and construction technicians have in-depth knowledge of these topics, allowing them to create consistent models with the required level of detail. This is even more important when it comes to models that will integrate a BIM methodology, for a 3D model that does not meet BIM’s needs, even if made with a BIM software, can jeopardize the entire process.
This study presents a basic modeling workflow that mostly happens manually. Automatic processes were used for 3D reconstruction of the topographic surface. A BIM model contains several types of elements, and for each of them, there is a different way of working. For future studies, it is interesting to explore more ways to streamline modeling through other automatic and semi-automatic methods, identify which elements can have which solutions, and how to incorporate other software and plugins into the HBIM workflow. It is also interesting to study and test new modeling approaches applied to other buildings from different periods and with different typologies. Another important aspect is to deepen parametric family creation studies, especially doors and windows, to meet the modeling demands of heritage buildings. Today’s family libraries lack elements that fit HBIM. Having parametric families that can quickly adapt to real cases will positively contribute to the entire process.
Author Contributions
All authors participated in the fieldwork described and paper writing. About the data processing, the first author developed the BIM modeling, first and second authors processed the laser scanning data, the second author managed data integration, third and fourth authors worked on the photogrammetric and GPS processing. All authors have read and agreed to the published version of the manuscript.
Funding
This research received no external funding.
Acknowledgments
The authors would like to thank the entire team that participated in the survey process. Thanks also to the 3D Digitization Laboratory and ArcHC_3D—Architectural Heritage Conservation Research Group from the Faculty of Architecture of the University of Lisbon, the Institute of Agronomy (ISA)—School of Agriculture for the possibility of working with the Engine House Paços Reais and also Daniela Blumetti for the paper revision and proofreading.
Conflicts of Interest
The authors declare no conflict of interest.
References
- Fryskowska, A.; Stachelek, J. A no-reference method of geometric content quality analysis of 3D models generated from laser scanning point clouds for hBIM. J. Cult. Herit. 2018, 34, 95–108. [Google Scholar] [CrossRef]
- Rodríguez-Moreno, C.; Reinoso-Gordo, J.F.; Rivas-López, E.; Gómez-Blanco, A.; Ariza-López, F.J.; Ariza-López, I. From point cloud to BIM: An integrated workflow for documentation, research and modelling of architectural heritage. Surv. Rev. 2016, 50, 212–231. [Google Scholar] [CrossRef]
- Barbosa, M. As-Built Building Information Modeling (BIM) Workflows: From Point cloud Data to BIM. Ph.D. Thesis, Universidade de Lisboa, Lisboa, Portugal, 4 May 2018. [Google Scholar]
- Volk, R.; Stengel, J.; Schultmann, F. Building Information Modeling (BIM) for existing buildings—Literature review and future needs. Autom. Constr. 2014, 38, 109–127. [Google Scholar] [CrossRef] [Green Version]
- Kirby, L.; Krygiel, E.; Kim, M. Mastering Autodesk Revit 2018; John Wiley & Sons: Indianapolis, IN, USA, 2017; ISBN 9781119386728. [Google Scholar]
- Singh, V.; Gu, N.; Wang, X. A theoretical framework of a BIM-based multi-disciplinary collaboration platform. Autom. Constr. 2011, 20, 134–144. [Google Scholar] [CrossRef]
- Eastman, C.; Teicholz, P.; Sacks, R.; Liston, K. BIM Handbook: A Guide to Building Information Modeling for Owners; John Wiley: Hoboken, NJ, USA, 2011. [Google Scholar]
- Castellano-Román, M.; Pinto, F. Dimensions and Levels of Knowledge in Heritage Building Information Modelling, HBIM: The model of the Charterhouse of Jerez (Cádiz, Spain). Digit. Appl. Archaeol. Cult. Herit. 2019, 14, e00110. [Google Scholar] [CrossRef]
- Antonopoulou, S.; Bryan, P. BIM for Heritage: Developing a Historic Building Information Model; Historic England: Swindon, UK, 2017. [Google Scholar]
- Hull, J.; Bryan, P. BIM for Heritage: Developing the Asset Information Model; Historic England: Swindon, UK, 2019. [Google Scholar]
- Murphy, M.; McGovern, E.; Pavia, S. Historic Building Information Modelling—Adding intelligence to laser and image based surveys of European classical architecture. ISPRS J. Photogramm. Remote Sens. 2013, 76, 89–102. [Google Scholar] [CrossRef]
- Brumana, R.; Della Torre, S.; Previtali, M.; Barazzetti, L.; Cantini, L.; Oreni, D.; Banfi, F. Generative HBIM modelling to embody complexity (LOD, LOG, LOA, LOI): Surveying, preservation, site intervention—The Basilica di Collemaggio (L’Aquila). Appl. Geomat. 2018, 10, 545–567. [Google Scholar] [CrossRef]
- Prizeman, O.E.C. HBIM and matching techniques: Considerations for late nineteenth- and early twentieth-century buildings. J. Archit. Conserv. 2015, 21, 145–159. [Google Scholar] [CrossRef]
- Capone, M.; Lanzara, E. Scan-To-BIM vs 3D Ideal Model HBIM: Parametric Tools to Study Domes Geometry. ISPRS Ann. Photogramm. Remote Sens. Spat. Inf. Sci. 2019, 42, 219–226. [Google Scholar] [CrossRef] [Green Version]
- Barbosa, M.; Pauwels, P.; Ferreira, V.; Mateus, L. Towards increased BIM usage for existing building interventions. Struct. Surv. 2016, 34, 168–190. [Google Scholar] [CrossRef]
- American Institute of Architects G202-2013 Project BIM Protocol. 2013. Available online: http://architectis.it/onewebmedia/AIA%C2%AE%20Document%20G202TM%20%E2%80%93%202013.pdf (accessed on 10 November 2019).
- Baik, A. From point cloud to Jeddah Heritage BIM Nasif Historical House—Case study. Digit. Appl. Archaeol. Cult. Herit. 2017, 4, 1–18. [Google Scholar] [CrossRef]
- Brumana, R.; Condoleo, P.; Grimoldi, A.; Banfi, F.; Angelo Giuseppe, L.; Previtali, M. HR LOD based HBIM to detect influences on geometry and shape by stereotomic construction techniques of brick vaults. Appl. Geomat. 2018, 10, 529–543. [Google Scholar] [CrossRef]
- Mateus, L.; Fernández, J.; Ferreira, V.; Oliveira, C.; Aguiar, J.; Gago, A.S.; Pacheco, P.; Pernão, J. GRAPHICAL DATA FLOW BASED in TLS and PHOTOGRAMMETRY for CONSOLIDATION STUDIES of HISTORICAL SITES. the CASE STUDY of JUROMENHA FORTRESS in Portugal. Int. Arch. Photogramm. Remote Sens. Spat. Inf. Sci. ISPRS Arch. 2019, 42, 767–773. [Google Scholar] [CrossRef] [Green Version]
- Boardman, C.; Bryan, P. 3D Laser Scanning for Heritage: Advice and Guidance on the Use of Laser Scanning in Archaeology and Architecture. Hist. Engl. 2018, 119, 529–543. [Google Scholar]
- Mateus, L.; Ferreira, V.; Aguiar, J.; Dias, A. Terrestrial Laser Scanning and Digital Photogrammetry as Tools for the Archaeological Recording—The Case of Convento de Cristo. In Proceedings of the Proceedings of the First International Conference on Best Practices in World Heritage, Menorca, Spain, 9–13 April 2012; pp. 400–412. [Google Scholar]
- Waldhäusl, P.; Ogleby, C. 3 × 3-Rules for Simple Photogrammetric Documentation of Architecture. Int. Arch. Photogramm. Remote Sens. 1994, 30, 426–429. [Google Scholar]
- Vosselman, G.; Maas, H.-G. Airborne and Terrestrial Laser Scanning, 1st ed.; Whittles Publishing: Dunbeath, UK, 2010; ISBN 9781904445876. [Google Scholar]
- López, F.J.; Lerones, P.M.; Llamas, J.; Gómez-García-Bermejo, J.; Zalama, E. A Framework for Using Point Cloud Data of Heritage Buildings Toward Geometry Modeling in A BIM Context: A Case Study on Santa Maria La Real De Mave Church. Int. J. Archit. Herit. 2017, 11, 965–986. [Google Scholar] [CrossRef]
- Macher, H.; Landes, T.; Grussenmeyer, P. From Point Clouds to Building Information Models: 3D Semi-Automatic Reconstruction of Indoors of Existing Buildings. Appl. Sci. 2017, 7, 1030. [Google Scholar] [CrossRef] [Green Version]
- Ochmann, S.; Vock, R.; Wessel, R.; Klein, R. Automatic reconstruction of parametric building models from indoor point clouds. Comput. Graph. 2016, 54, 94–103. [Google Scholar] [CrossRef] [Green Version]
- Instituto Superior de Agronomia Intervenção do Professor Raul Bruno de Sousa na Tertúlia O ISA e o seu património: A particularidade do Ensino Tropical. Available online: https://www.isa.ulisboa.pt/files/site/pub/Intervencao_do_Professor_Bruno_de_Sousa_na_Tertulia_O_ISA_e_o_seu_patrimonio_a_particularidade_do_Ensino_Tropical.pdf (accessed on 10 November 2019).
- Instituto Superior de Agronomia Património Cultural da Tapada da Ajuda. Available online: http://www.isa.utl.pt/tapada/3_patrim_cultural.htm (accessed on 10 November 2019).
- Instituto Superior de Agronomia Património Com Valor Histórico E Arquitectónico Que Pode Encontrar Na Tapada Da Ajuda. Available online: https://www.isa.ulisboa.pt/files/site/pub/TapadadaAjuda.pdf (accessed on 10 November 2019).
- Instituto Superior de Agronomia Evolução histórica da Tapada da Ajuda. Available online: http://www.isa.utl.pt/tapada/1_evolucao_historica.htm (accessed on 10 November 2019).
- Mateus, L. Contributos para o projecto de conservação, restauro e reabilitação. Uma Metodologia Documental Baseada na Fotogrametria Digital e no Varrimento Laser 3D Terrestres. Ph.D. Thesis, Universidade Técnica de Lisboa, Lisboa, Portugal, 2012. [Google Scholar]
- Autodesk White Paper Building Information Modeling (Autodesk Building Industry Solutions). 2002. Available online: http://www.laiserin.com/features/bim/autodesk_bim.pdf (accessed on 10 November 2019).
- BuildingSmart Certified Software—Building SMART International. Available online: https://www.buildingsmart.org/compliance/software-certification/certified-software/ (accessed on 30 January 2020).
- Zada, A.J.; Tizani, W.; Oti, A.H. Building Information Modelling (BIM)—Versioning for Collaborative Design. In Proceedings of the 2014 International Conference on Computing in Civil and Building Engineering, Orlando, FL, USA, 23–25 June 2014; pp. 512–519. [Google Scholar]
- Nizam, R.S.; Zhang, C. Current state of information exchange between the two most popular BIM software: Revit and Tekla. In Proceedings of the 1st International Conference on Sustainable Buildings and Structures, Suzhou, China, 29 October–1 November 2015; CRC Press: Boca Raton, FL, USA, 2016; pp. 175–181. [Google Scholar]
- Autodesk. About Revit and IFC|Revit Products 2020|Autodesk Knowledge Network. Available online: https://knowledge.autodesk.com/support/revit-products/learn-explore/caas/CloudHelp/cloudhelp/2020/ENU/Revit-DocumentPresent/files/GUID-6708CFD6-0AD7-461F-ADE8-6527423EC895-htm.html (accessed on 30 January 2020).
- Autodesk Project Base Point and Survey Point|Revit Products 2019|Autodesk Knowledge Network. Available online: https://knowledge.autodesk.com/support/revit-products/learn-explore/caas/CloudHelp/cloudhelp/2019/ENU/Revit-Model/files/GUID-68611F67-ED48-4659-9C3B-59C5024CE5F2-htm.html (accessed on 9 November 2019).
- Leite, F.; Akcamete, A.; Akinci, B.; Atasoy, G.; Kiziltas, S. Analysis of modeling effort and impact of different levels of detail in building information models. Autom. Constr. 2011, 20, 601–609. [Google Scholar] [CrossRef]
- Alwisy, A.; Bu Hamdan, S.; Barkokebas, B.; Bouferguene, A.; Al-Hussein, M. A BIM-based automation of design and drafting for manufacturing of wood panels for modular residential buildings. Int. J. Constr. Manag. 2019, 19, 187–205. [Google Scholar] [CrossRef]
- BIM Forum Level of Development (LOD) Specification Part I & Commentary. 2019. Available online: https://bimforum.org/wp-content/uploads/2019/04/LOD-Spec-2019-Part-I-and-Guide-2019-04-29.pdf (accessed on 10 November 2019).
- Nagel, C.; Stadler, A.; Kolbe, T.H. Conceptual Requirements for the Automatic Reconstruction of Building Information Models from Uninterpreted 3D Models. In Proceedings of the Academic Track of the Geoweb 2009-3D Cityscapes Conference, Vancouver, BC, Canada, 27–31 July 2009; pp. 46–53. [Google Scholar]
- Thomson, C.; Boehm, J. Automatic geometry generation from point clouds for BIM. Remote Sens. 2015, 7, 11753–11775. [Google Scholar] [CrossRef] [Green Version]
- Xiong, X.; Adan, A.; Akinci, B.; Huber, D. Automatic creation of semantically rich 3D building models from laser scanner data. Autom. Constr. 2013, 31, 325–337. [Google Scholar] [CrossRef] [Green Version]
- Tamke, M.; Evers, H.L.; Ochmann, S. DURAARK SME Use Case—Design and Retrofitting, DURAARK—EU research project FP7—ICT—Digital Preservation Grant agreement No.: 600908. 2015. Available online: http://duraark.eu/wp-content/uploads/2015/04/DURAARK_D7_2.pdf (accessed on 6 February 2020).
Figure 1.
Diagram of a Building Information Modeling (BIM) work process.

Figure 2.
Engine House (Geradora) of Paços Reais. General view of the building.

Figure 3.
Engine House (Geradora) of Paços Reais. (Left): principal nave with exposed trusses; (Right): details of the main door.
Figure 3.
Engine House (Geradora) of Paços Reais. (Left): principal nave with exposed trusses; (Right): details of the main door.

Figure 4.
Processing and alignment of scans with Faro Scene software.

Figure 5.
(Left) Raw image from DJI Phantom Pro; (Right) Revealed image.

Figure 6.
Photogrammetry point cloud.

Figure 7.
Selection and cleaning of point cloud data. The joining of the photogrammetry and the 3D laser scanning point cloud to generate the project’s final point cloud.
Figure 7.
Selection and cleaning of point cloud data. The joining of the photogrammetry and the 3D laser scanning point cloud to generate the project’s final point cloud.

Figure 8.
Evolution of the level of detail in the design as modeling progresses.

Figure 9.
Three-dimensional Detail of the connection between the basement and ground floor.

Figure 10.
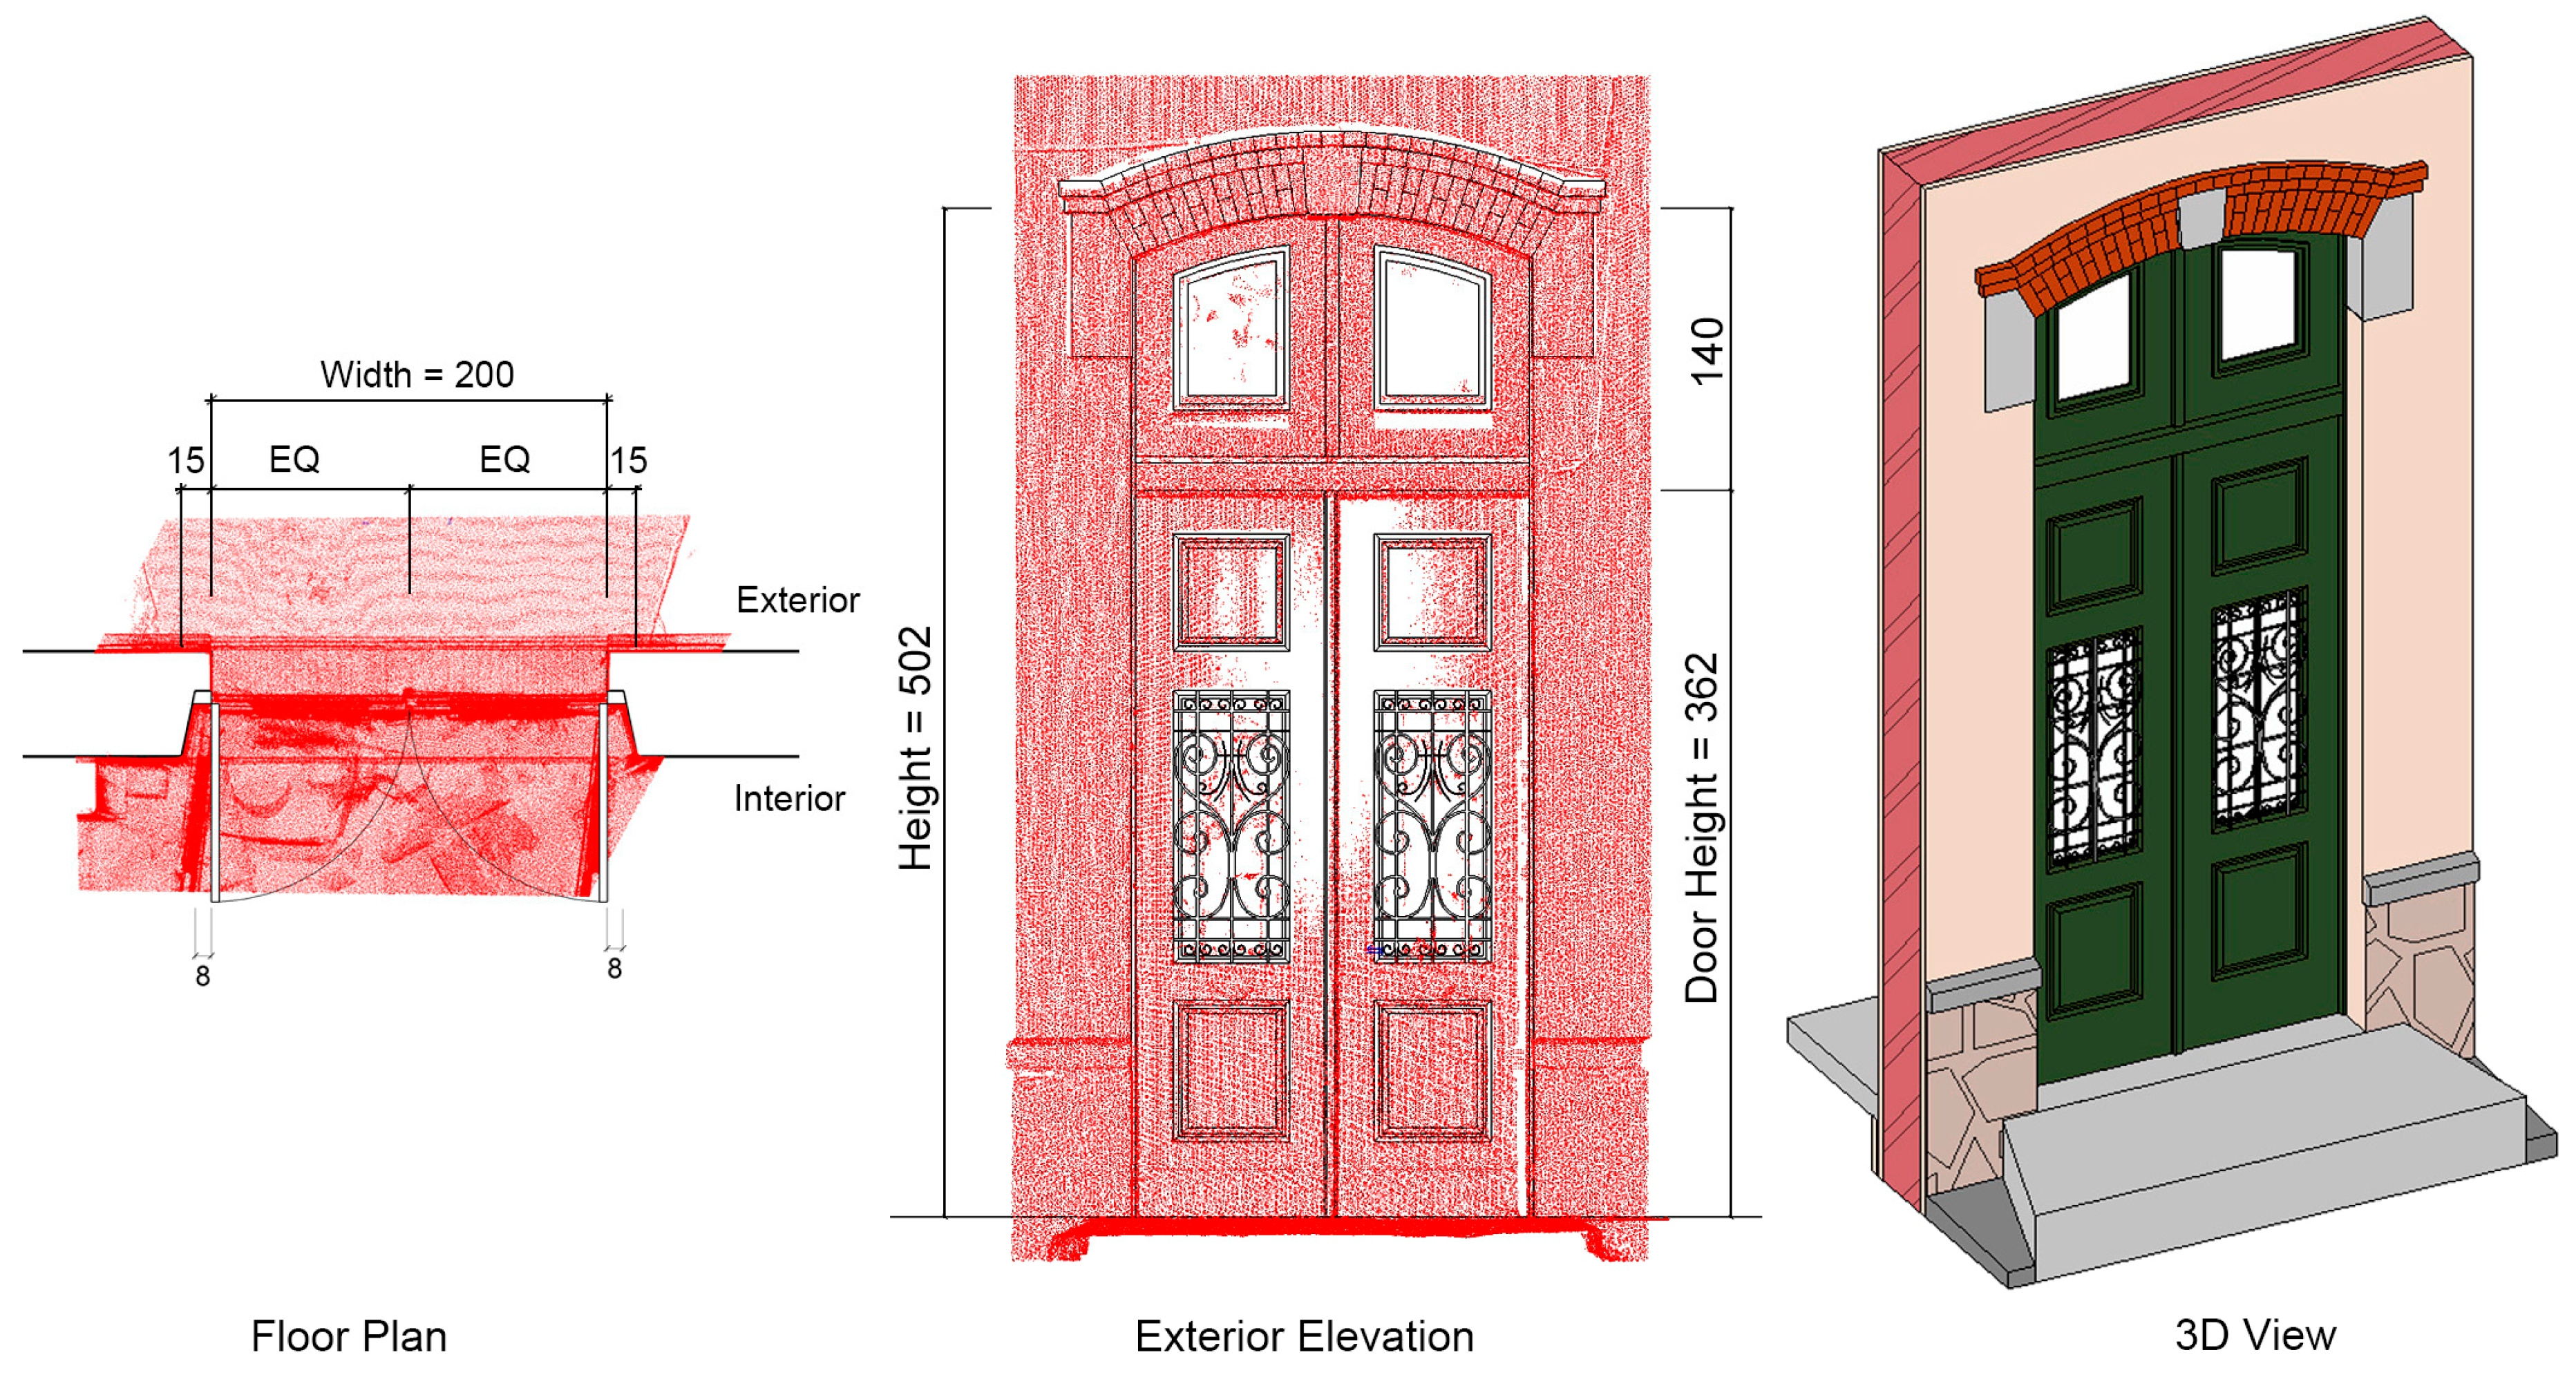
One door created as a parametric family using the point cloud in the Revit Family Editor. (Left) floor plan; center: exterior elevation; (Right) 3D view. All dimensions are in centimeters.
Figure 10.
One door created as a parametric family using the point cloud in the Revit Family Editor. (Left) floor plan; center: exterior elevation; (Right) 3D view. All dimensions are in centimeters.

Figure 11.
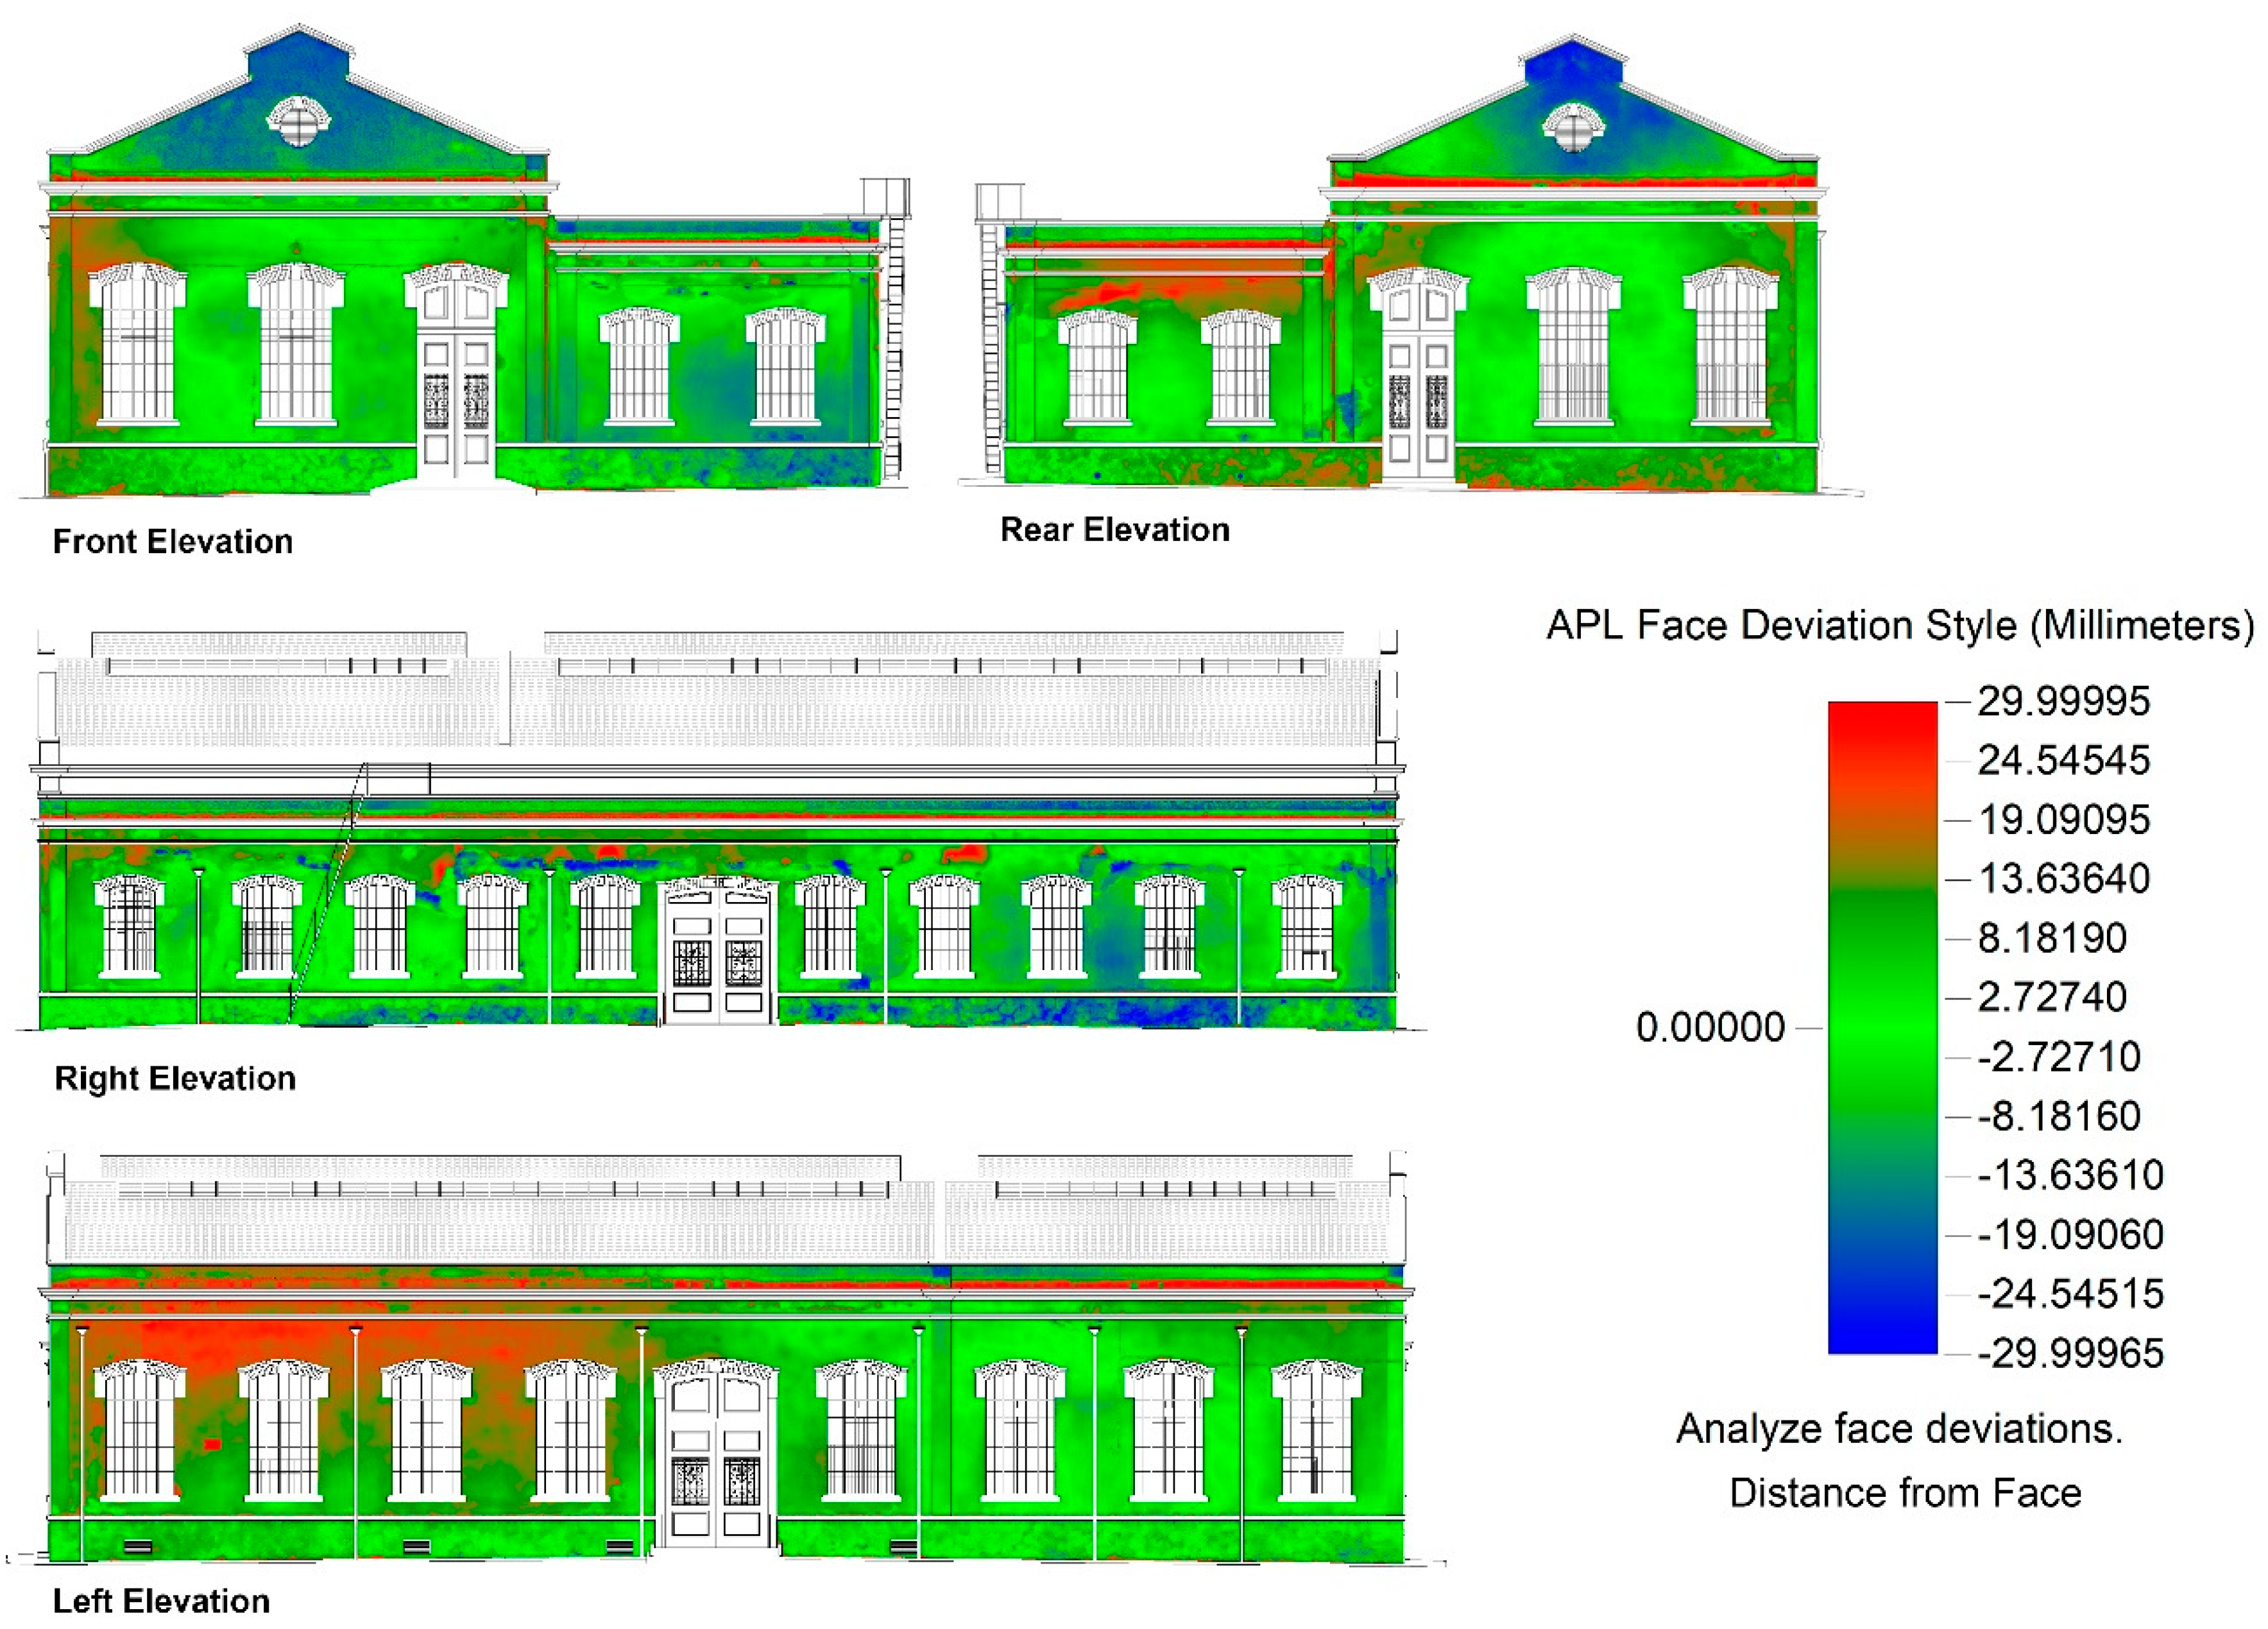
Face deviation of the external walls using Autodesk Point Layout.

Figure 12.
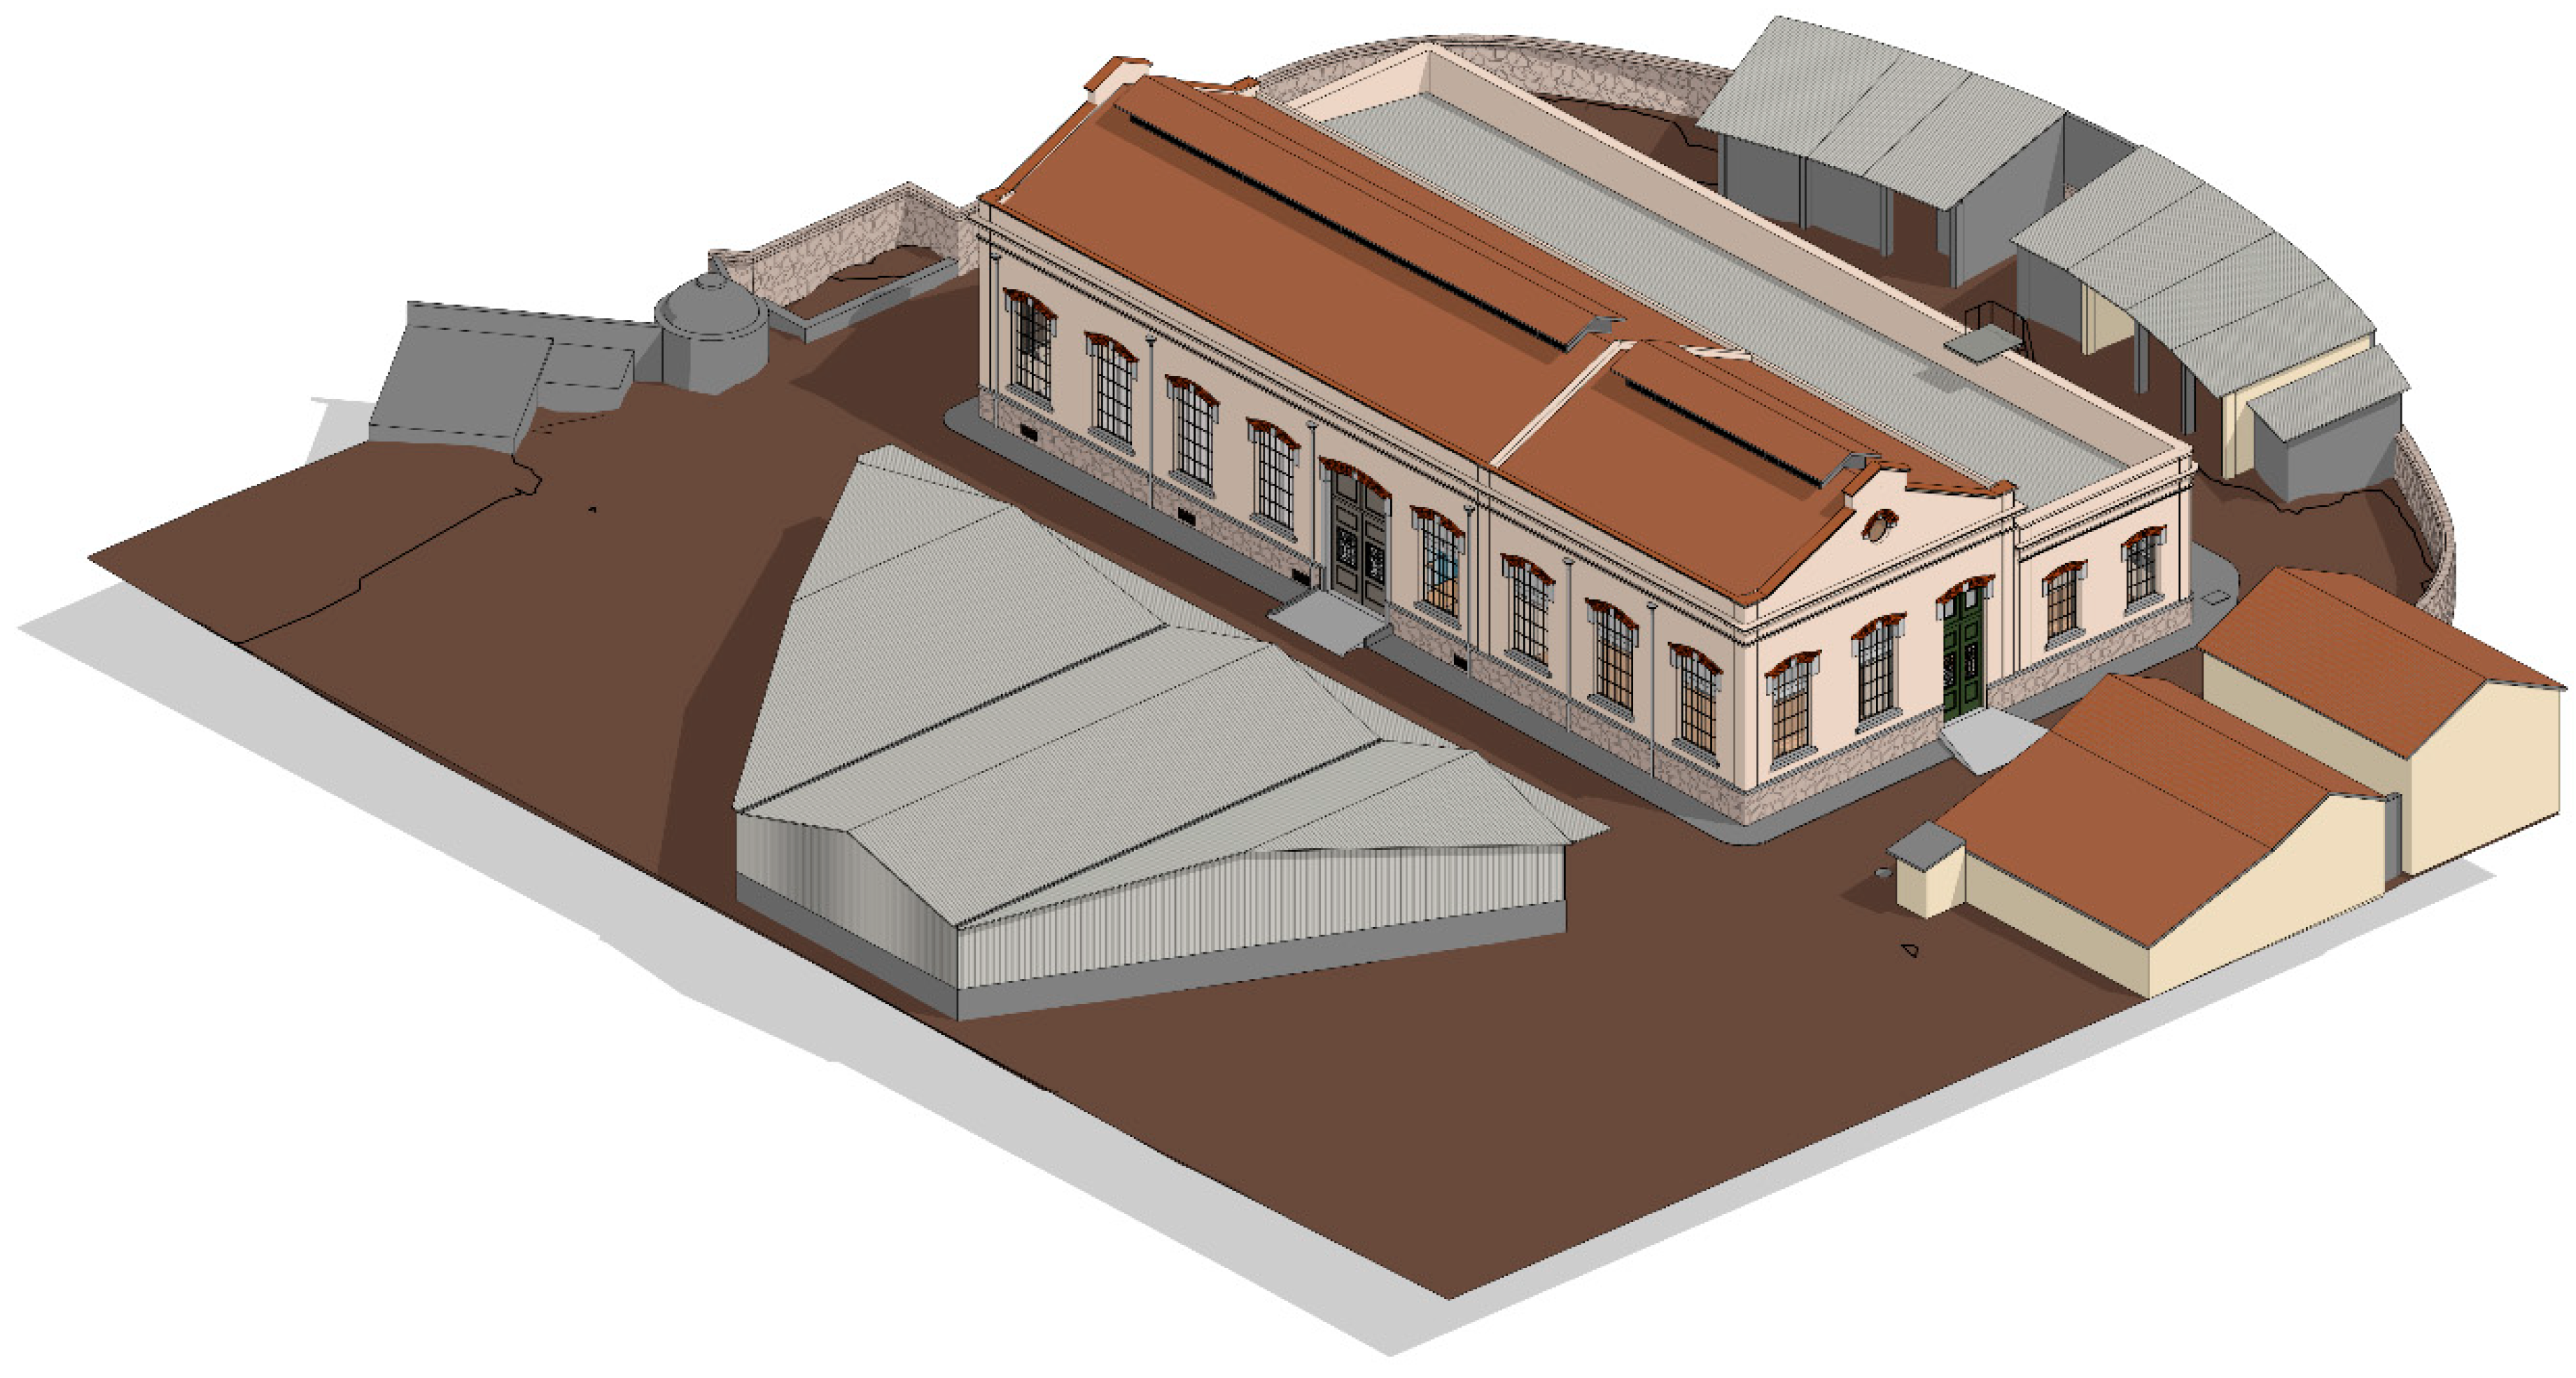
Final model with the nearby buildings.

Figure 13.
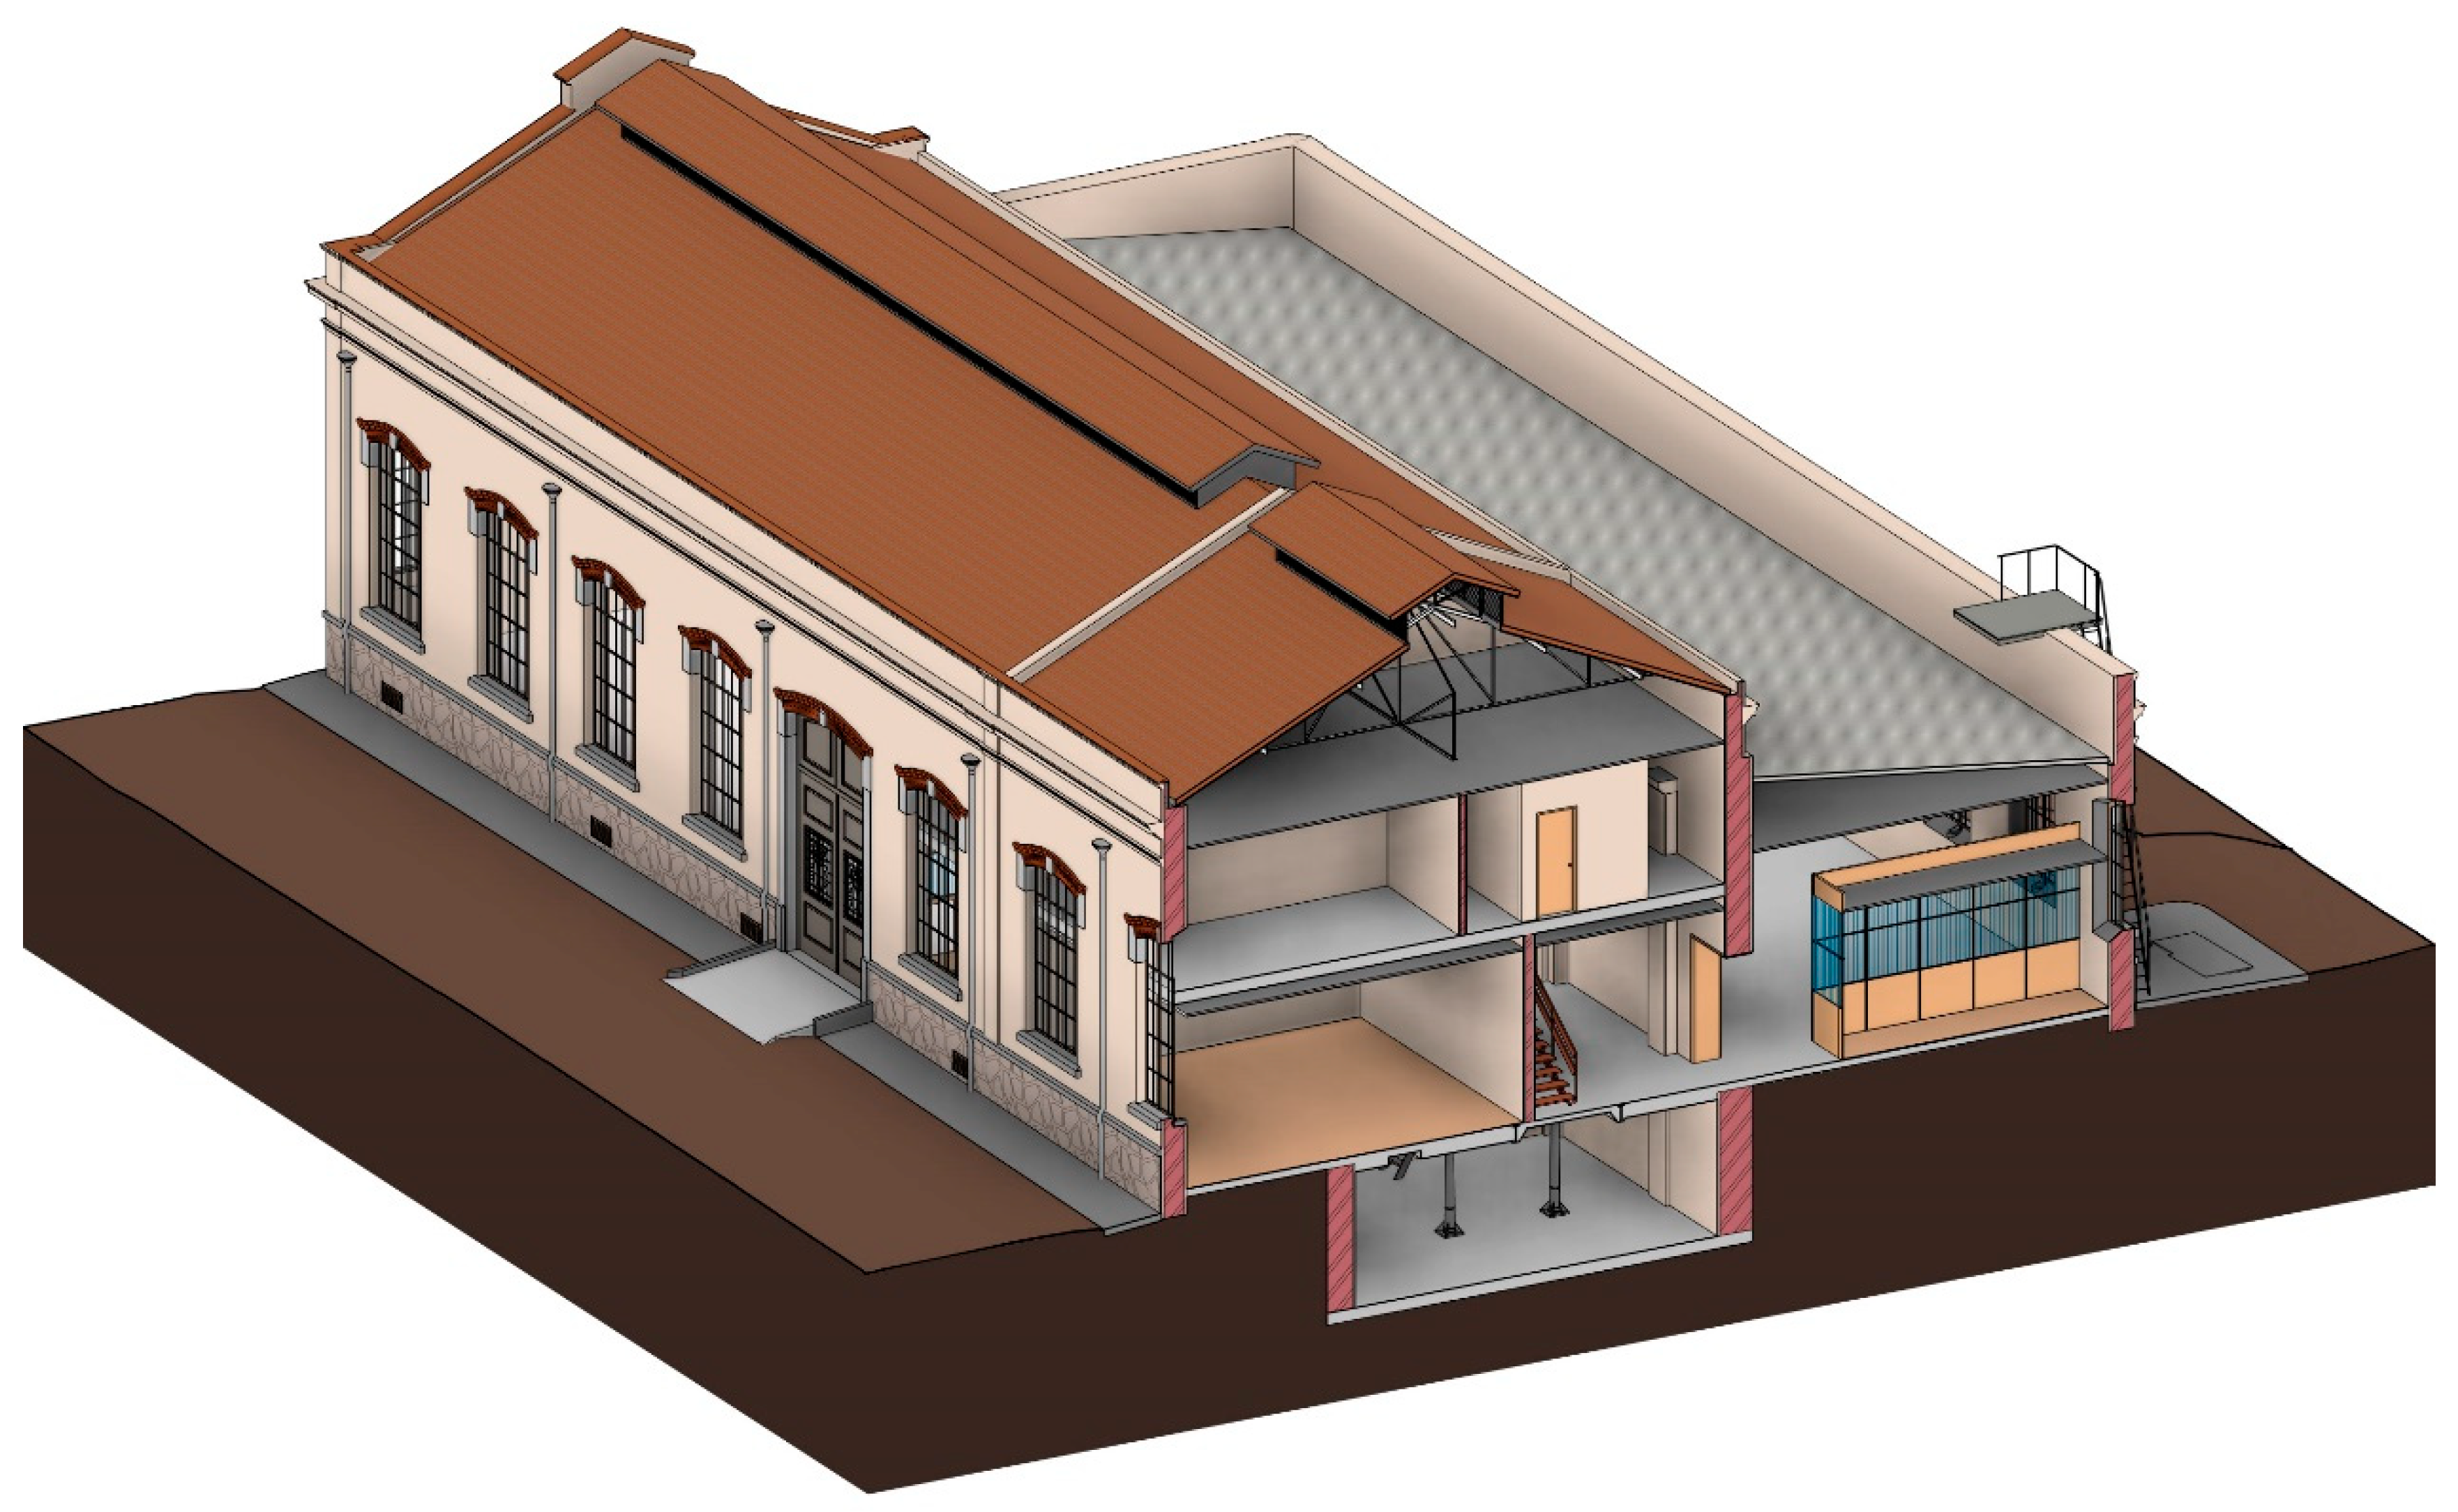
Three-dimensional section showing all building levels and roof structure.

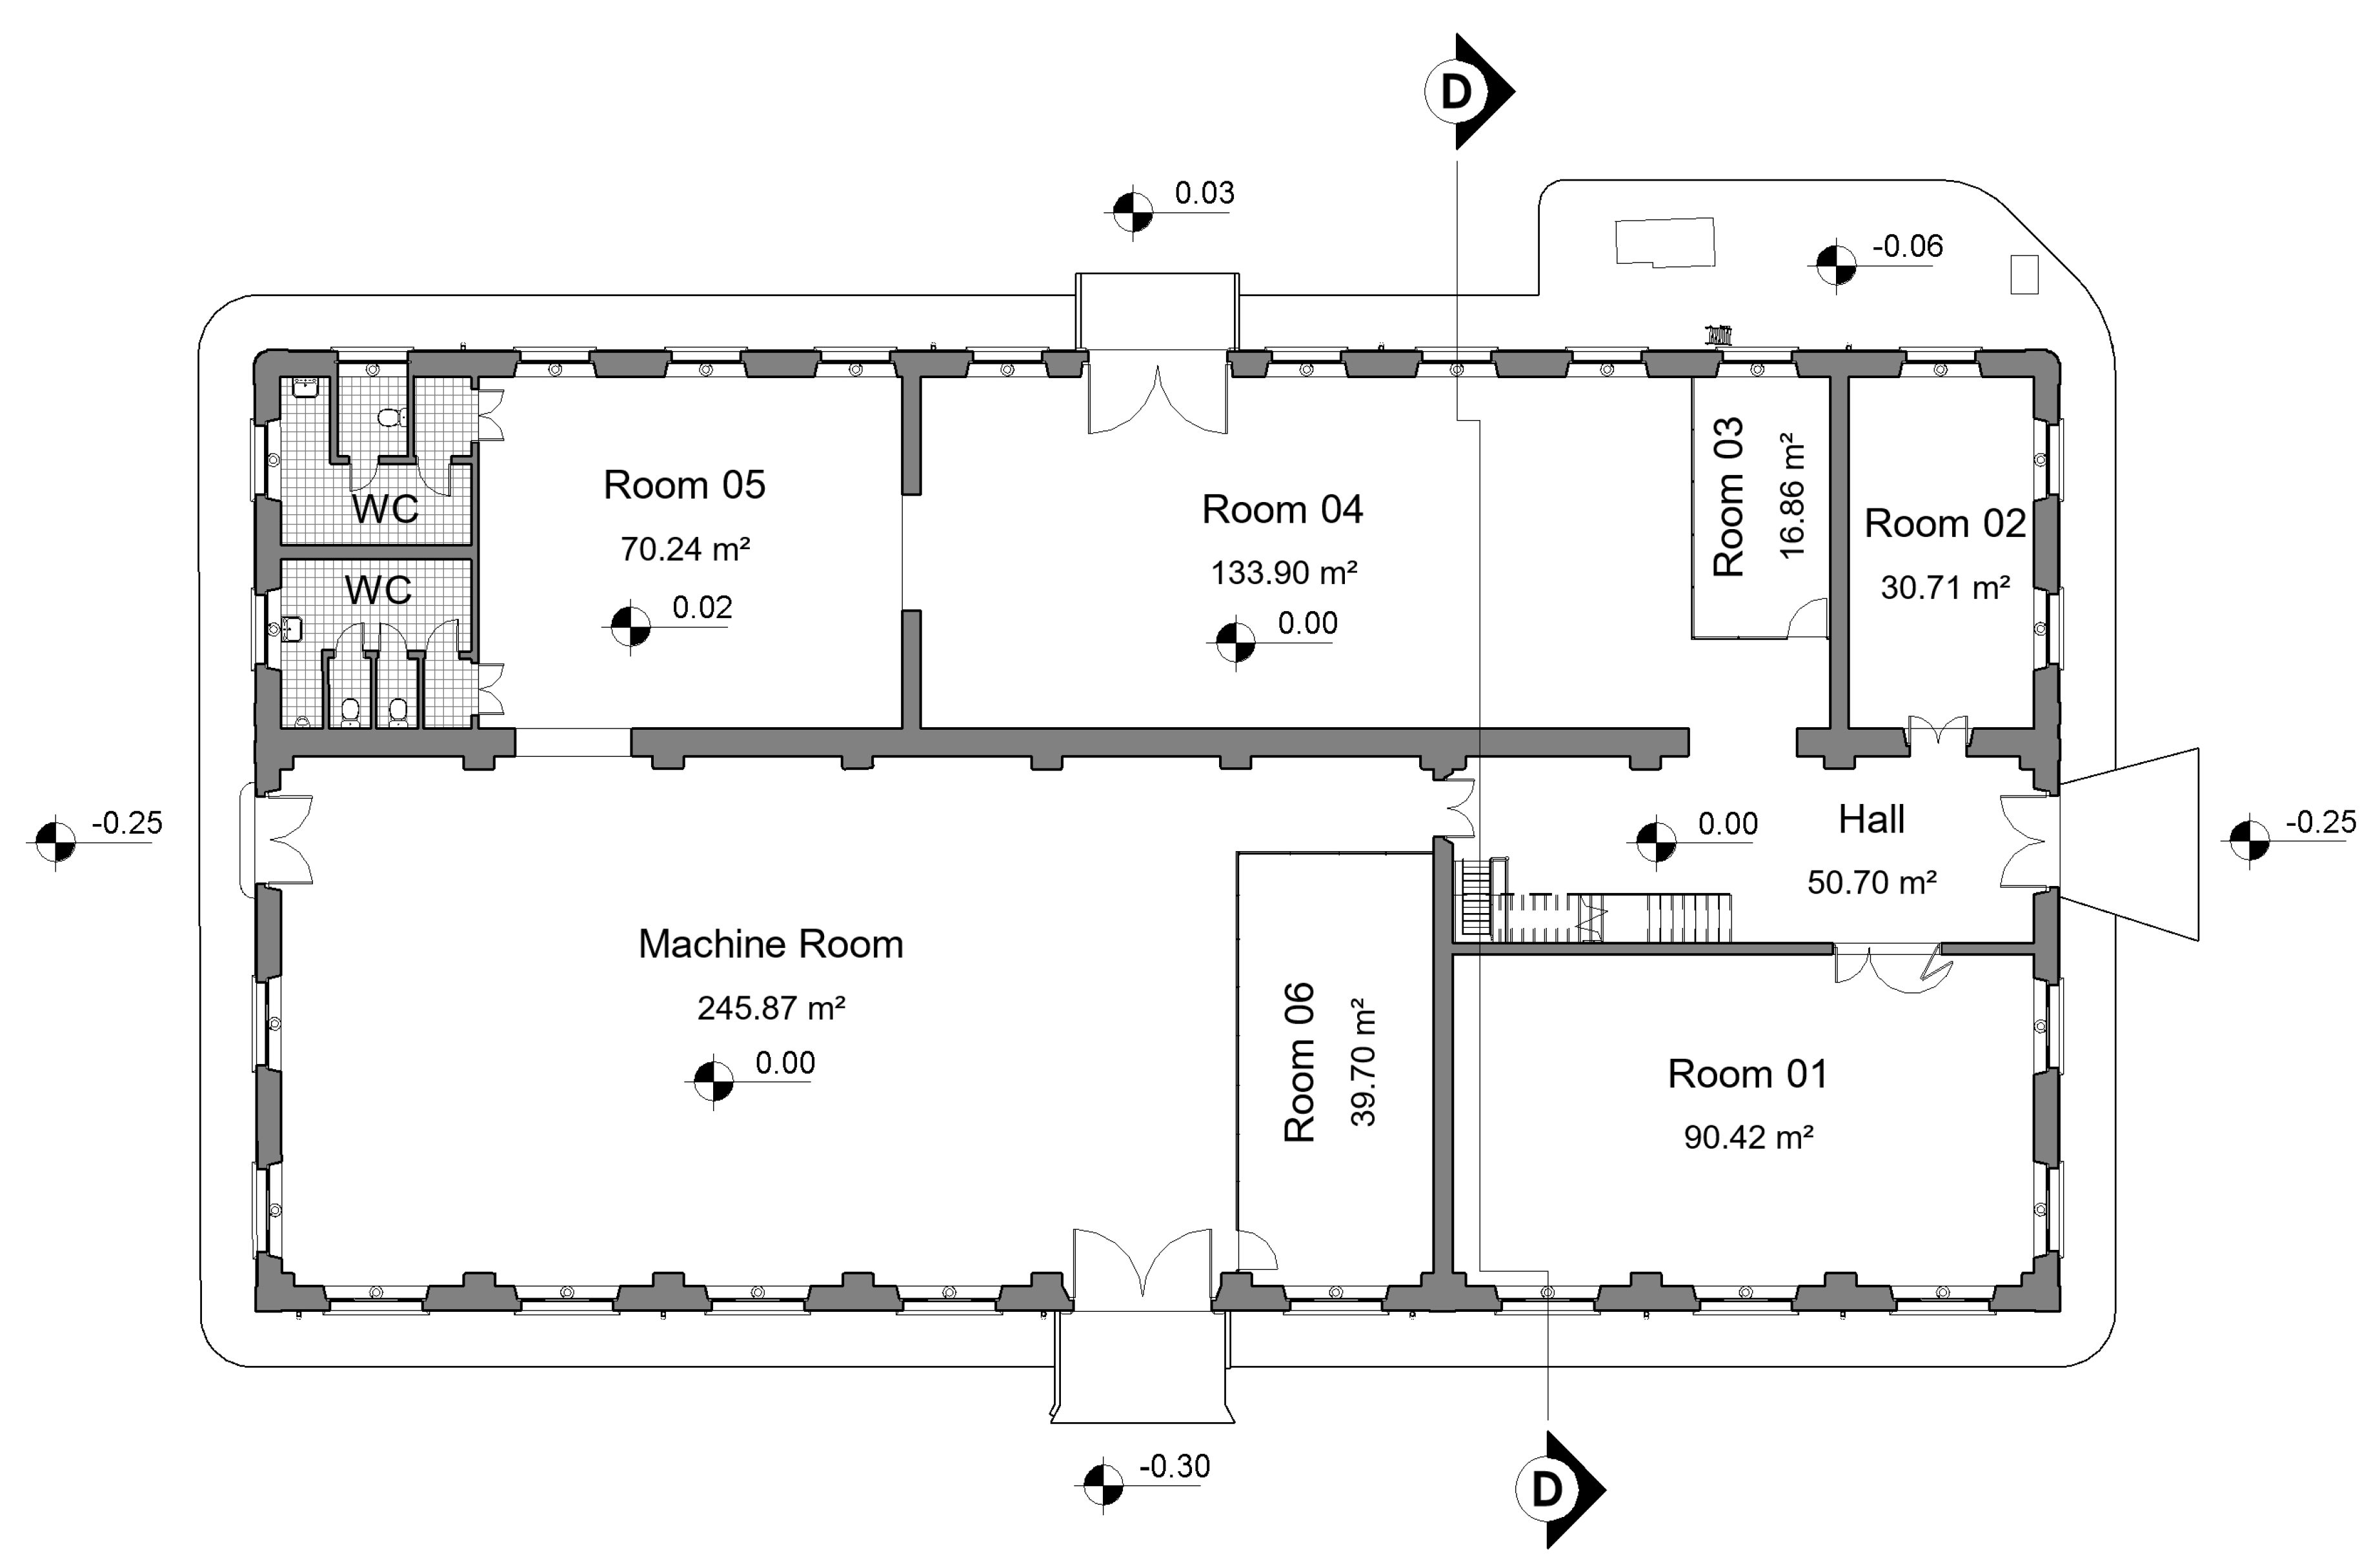
Figure 14.
Ground floor plan.

Figure 15.
Transversal section showing the levels, stairs, and structural trusses from the roof.

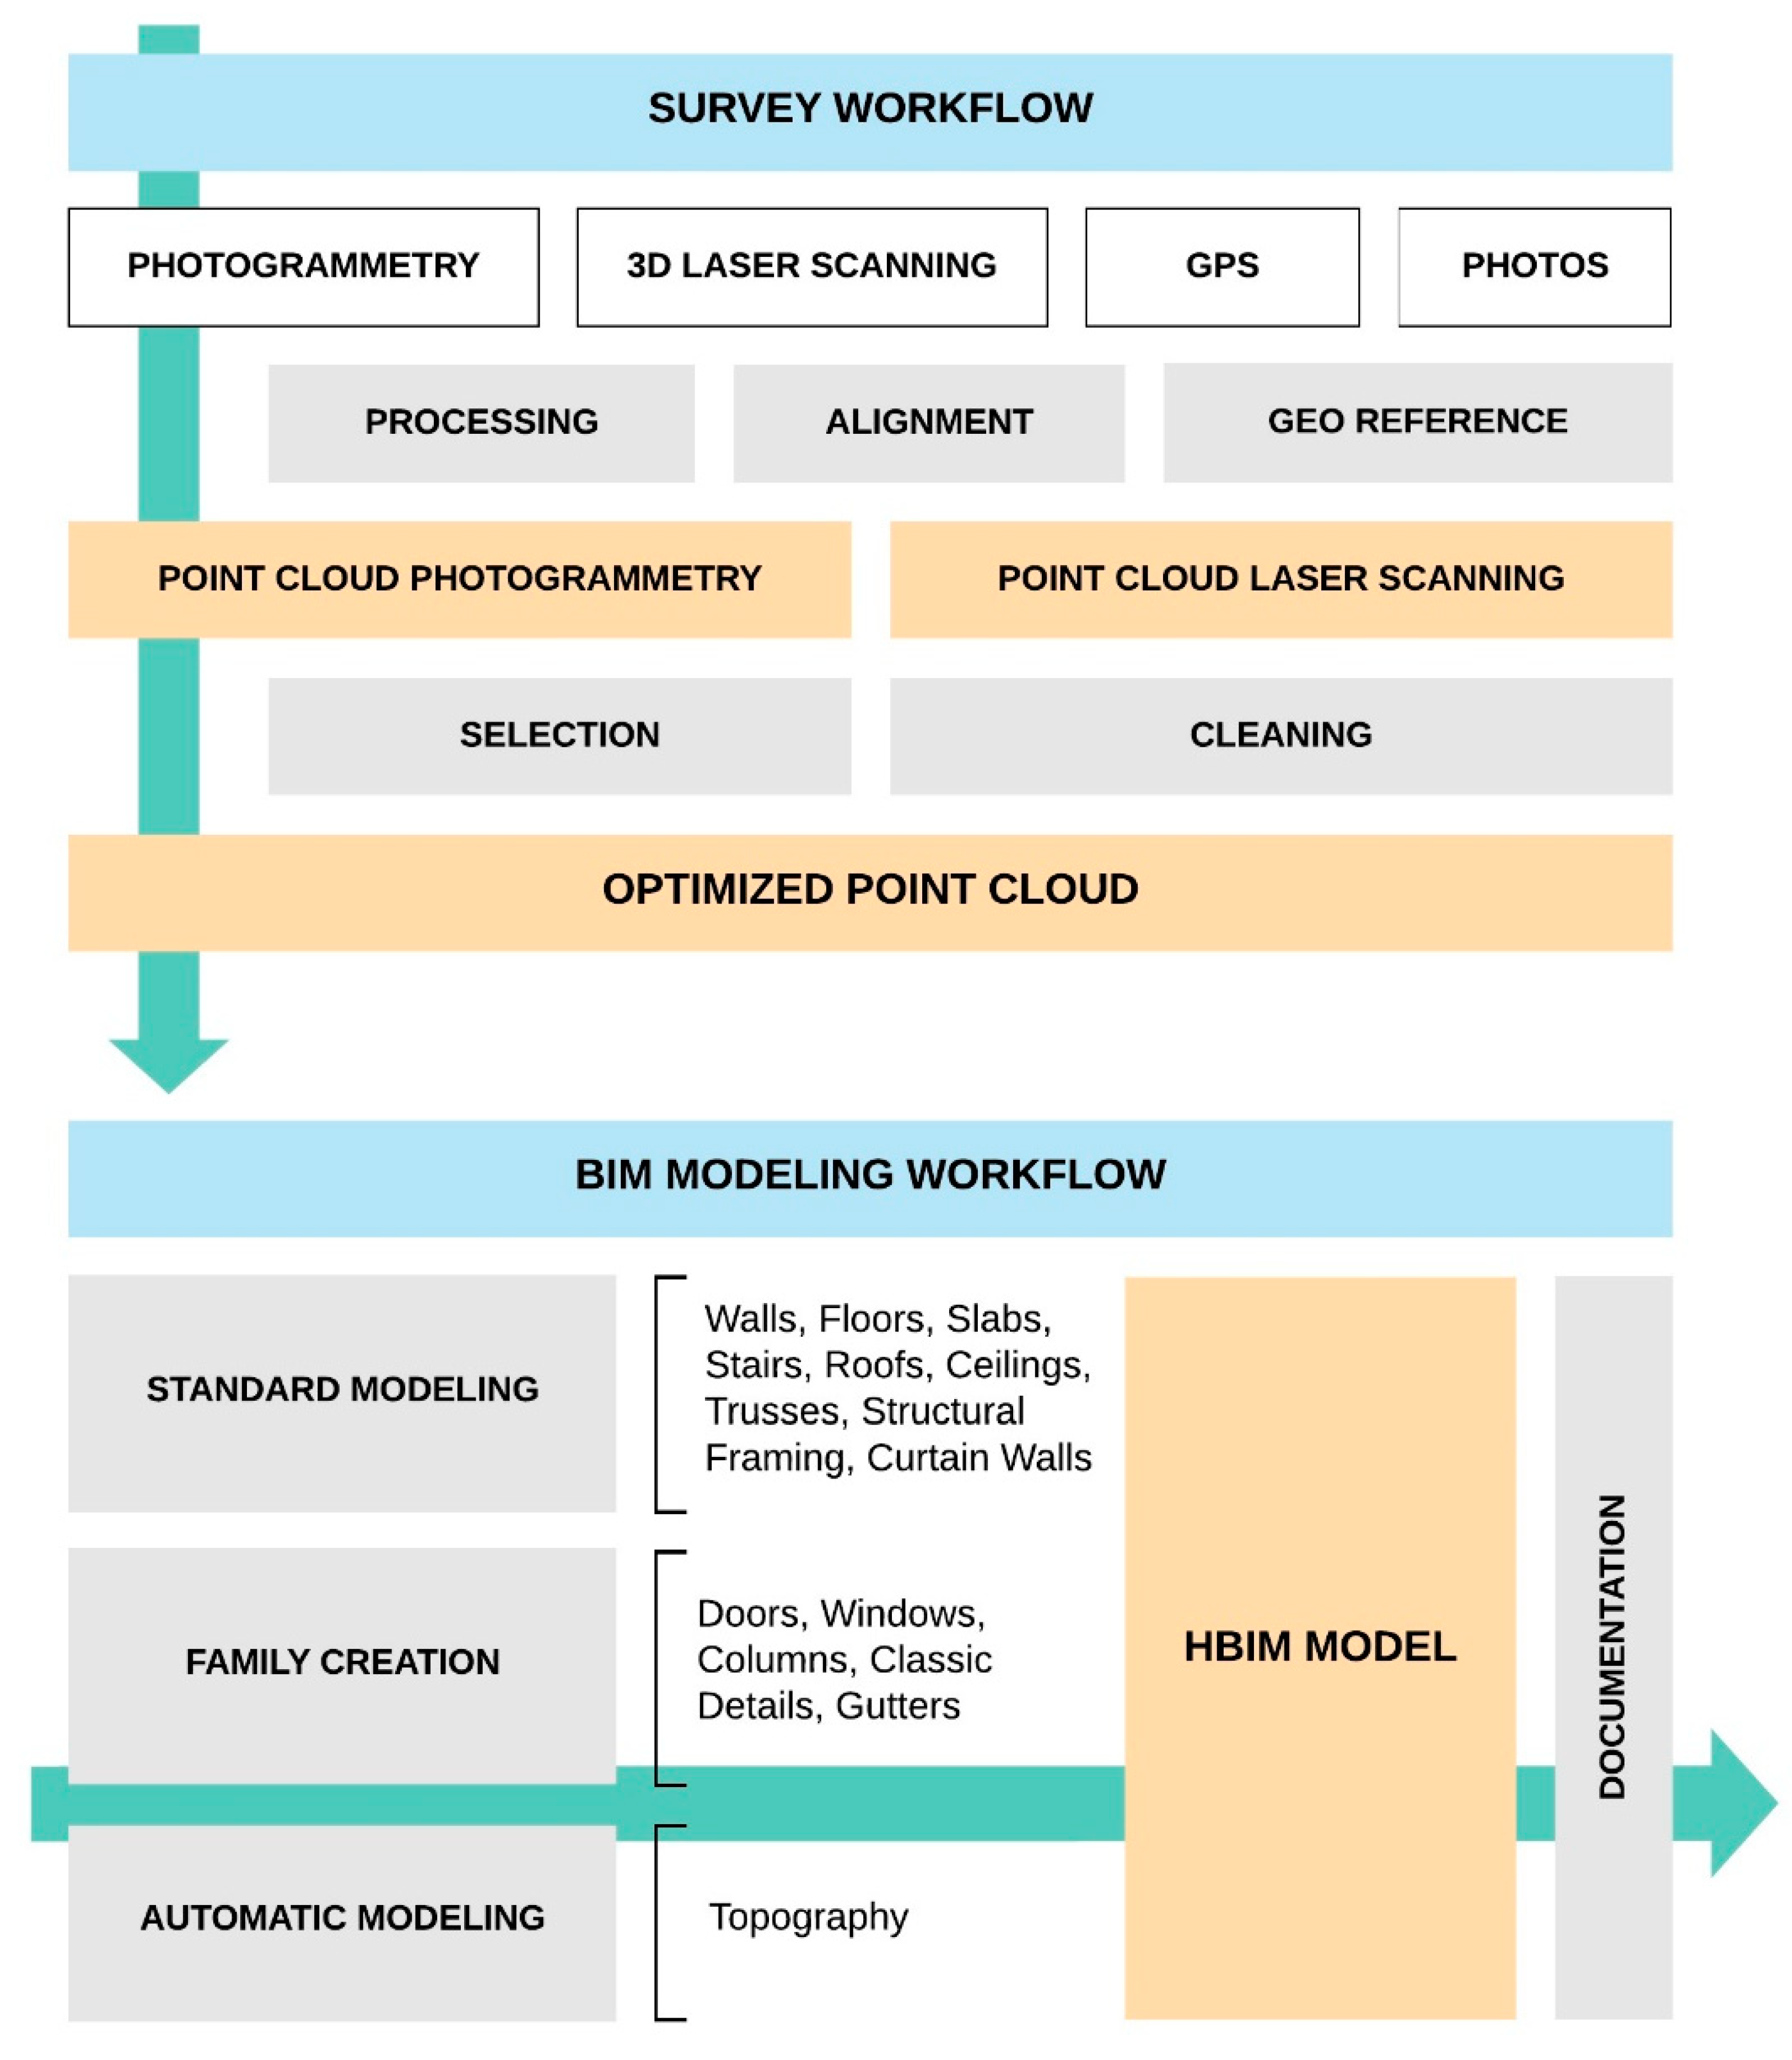
Figure 16.
Scan-to-BIM workflow.


Table 1.
Tools and working hour usage for each step.
| Phase | Tools | Hours |
|---|---|---|
| Survey | ||
| 3D Laser Scanning | Faro Focus 120 S 3D laser scanner | 10 |
| Photogrammetry | DJI Phantom Four drone plus 4K camera, Nikon D7200 | 2.5 |
| GPS | Trimble R8 GNSS GPS | 1 |
| Data Processing and Alignment | ||
| 3D Laser Scanning Point Cloud | Faro Scene | 14 |
| Photogrammetry Point Cloud | Agisoft Photoscan | 11 |
| Cleaning and Optimization | Cloud Compare, Autodesk Recap | 3 |
| BIM Modeling | ||
| Standard Modeling | Autodesk Revit 2018 | 36 |
| Family Creation | Autodesk Revit 2018 Family Editor | 30 |
| Automatic Modeling | Scan Terrain Revit Plug-in | 2.5 |
| Total | 110 |
© 2020 by the authors. Licensee MDPI, Basel, Switzerland. This article is an open access article distributed under the terms and conditions of the Creative Commons Attribution (CC BY) license (http://creativecommons.org/licenses/by/4.0/).
Share and Cite
MDPI and ACS Style
Rocha, G.; Mateus, L.; Fernández, J.; Ferreira, V. A Scan-to-BIM Methodology Applied to Heritage Buildings. Heritage 2020, 3, 47-67. https://0-doi-org.brum.beds.ac.uk/10.3390/heritage3010004
AMA Style
Rocha G, Mateus L, Fernández J, Ferreira V. A Scan-to-BIM Methodology Applied to Heritage Buildings. Heritage. 2020; 3(1):47-67. https://0-doi-org.brum.beds.ac.uk/10.3390/heritage3010004
Chicago/Turabian StyleRocha, Gustavo, Luís Mateus, Jorge Fernández, and Victor Ferreira. 2020. "A Scan-to-BIM Methodology Applied to Heritage Buildings" Heritage 3, no. 1: 47-67. https://0-doi-org.brum.beds.ac.uk/10.3390/heritage3010004