Article

Identifying Brazilwood’s Marker Component, Urolithin C, in Historical Textiles by Surface-Enhanced Raman Spectroscopy

1
CNR Istituto di Scienze e Tecnologie Chimiche (SCITEC), Dipartimento di Chimica, Biologia e Biotechnologie, Università degli Studi di Perugia, Via Elce di Sotto 8, 06123 Perugia, Italy
2
Dipartimento di Chimica e Chimica Industriale, Universitò di Pisa, Via Giuseppe Moruzzi 13, 56124 Pisa, Italy
3
Centro di Eccellenza SMAArt, Dipartimento di Chimica, Biologia e Biotechnologie, Università degli Studi di Perugia, Via Elce di Sotto 8, 06123 Perugia, Italy
4
Scientific Department, National Gallery London, Trafalgar Square, London WC2N 5DN, UK
5
Istituto per la Scienza del Patrimonio Culturali (ISPC-CNR), Via Guglielmo San Felice 8, 80134 Napoli, Italy
*
Author to whom correspondence should be addressed.
Submission received: 24 June 2021 / Revised: 21 July 2021 / Accepted: 22 July 2021 / Published: 25 July 2021

Abstract

:
The fugitive nature of the colorants obtained from sappanwood (Caesalpinia sappan L.) or the South American species commonly known as ‘brazilwoods’ (including other Caesalpinia species and Paubrasilia echinata (Lam.)) makes the identification of brazilwood dyes and pigments in historic artefacts analytically challenging. This difficulty has been somewhat alleviated recently by the recognition and structural elucidation of a relatively stable marker component found in certain brazilwood dyes and pigments—the benzochromenone metabolite urolithin C. This new understanding creates an ideal opportunity to explore the possibilities for urolithin C’s localization and identification in historical artefacts using a variety of analytical approaches. Specifically, in this work, micro-destructive surface-enhanced Raman spectroscopic methods following a one-sample two-step (direct application of the colloid and then subsequent exposure of the same sample to HF before reapplication of the colloid) approach are utilized for the examination of four historical brazilwood dyed textiles with the results confirmed via HPLC-DAD analysis. It is shown that characterization of reference urolithin C is possible, and diagnostic features of this molecule can also be traced in faded historical linen, silk and wool textiles, even in the presence of minor quantities of flavonoid, indigoid and tannin components. The exploitation of the same micro-sample through a series of SERS analyses affords a fuller potential for confirming the characterization of this species.

1. Introduction

Brazilwood dyestuffs and pigments are derived from a number of closely related and often historically confused species of trees of the Leguminosae family. Heartwood from the so-called ‘soluble redwoods’, sappanwood (Caesalpinia sappan L.) from Southeast Asia and several South American species commonly called brazilwoods (including Caesalpinia brasiliensis L. and Paubrasilia echinata (Lam.)), contain brazilin, the main colorant in brazilwood dyes. Brazilin (Figure 1a) is a tetracyclic homoisoflavonoid which converts to a more deeply red colored molecule, brazilein, through autoxidation of a hydroxyl group into a carbonyl group (Figure 1b). Other phenolic components isolated from brazilwood include xanthone, coumarin and various chalcones, flavones and other homoisoflavonoids [1].
The fugitive nature of brazilwood has been documented since the Middle Ages, and its use as both a dyestuff and a pigment has been regulated or proscribed as a result, particularly for use as a sole colorant [2]. It was, however, less expensive than other natural red dyestuffs and gave an attractive color when fresh, so found great use as a textile dye, an organic lake pigment in manuscripts (where light exposure was less of an issue) and in paintings. Evidence of the use of brazilwood-derived lake pigments has been found in paintings by a diverse range of artists, from Raphael to Rembrandt and Van Gogh [3,4,5]. For textiles, the dyestuff was generally extracted in neutral or basic aqueous solutions to which the mordanted textile was added. To prepare brazilwood lake pigments, various recipes are known. In some, the dyestuff is extracted from the raw material under alkaline conditions, then added with alum to precipitate the pigment from the solution. Alternatively, the dyestuff could be extracted in a slightly acidic solution (e.g., alum solution) and the pigment precipitated on addition of an alkaline solution or of a source of calcium carbonate or sulphate [1,6,7].
The analytical examination of brazilwood’s main colorants is generally straightforward for the characterization of unaltered homoisoflavonoid constituents by non-destructive FT-Raman and Infrared spectroscopies as well as micro-destructive chromatographic methods alike [8,9,10]. However, accurately identifying aged and faded brazilwood-based dyes and pigments in historic artworks is challenging. Brazilwood’s renowned lack of permanence has limited the identification of severely faded brazilwood in artefacts, in the heritage science domain, to only the most sensitive and specific micro-destructive techniques, such as HPLC with spectrophotometric or mass spectrometric detection [11]. Such studies have indicated the presence of a minor non-dyestuff component that appears to be a brazilwood marker, highlighted by Nowik [10]. This marker component has been recently identified as 3,8,9-trihydroxy-6H-benzo[c]chromen-6-one, urolithin C (Figure 1c), and unequivocally linked to brazilwood by Peggie et al. [12].
Urolithin C had initially been thought to be a degradation product of brazilein, yet its natural and unquantified presence in the heartwood has been highlighted, suggesting its unrelated presence [13]. Furthermore, observations by Peggie et al. have established a link between an alkaline extraction method and the increased presence of urolithin C in brazilwood dyes and lake pigments. Tamburini has subsequently noted that a sample dyed with sappanwood at alkaline pH showed a higher relative abundance of urolithin C than in a sample dyed at neutral pH, but also highlighted therein a much lower abundance of protosappanins [14]. Such deductions may provide information as to the origins of urolithin C within these dyes and pigments. In nature, tannin constituents play a major role in the formation of the urolithin metabolite. Studies have observed that in animal guts microbia can metabolize ellagitannin and ellagic acid into dibenzopyran-6-one derivatives with different hydroxyl substitutions, through the loss of one of the two lactones present in ellagic acid (lactonase/decarboxylase) followed by subsequent removal of hydroxyls through dehydroxylase activity [15,16]. In the context of the study of historical textiles and pigments, what is of particular interest is that urolithin C appears to be relatively stable, and still persists in degraded samples of brazilwood dyes or pigments even when other colorant components have been lost [13]. This provides an ideal opportunity for further analytical methods to be examined to assess their suitability in determining the presence of urolithin C.
Surface-enhanced Raman spectroscopy (SERS) is an ideal candidate for such studies, and is being increasingly adopted for the investigation of natural and synthetic organic dyes (and pigments derived from such colorants) associated with historical artefacts by combining Raman spectroscopy’s fingerprinting ability with plasmonic-enabled enhanced sensitivity. The SERS effect is due to a combination of an electromagnetic (EM) enhancement associated with plasmon excitation in metal particles and a chemical (CHEM) enhancement associated with the transfer of electrons from the analyte molecule to/from the metal particles in both ground and excited states, often forming a metal−molecule bond. The application of SERS techniques has expanded in key application areas of heritage science in the last twenty years [17] and is nowadays competitive in terms of sample requirements to HPLC for ultra-sensitive and selective constituent identifications with current in situ potential. The construction of in-house databases and optimized analytical protocols help to improve the reproducibility of measurements for the characterization of the low quantities and/or unknown components that are typically encountered in the analysis of historic samples. Although still a micro-destructive and qualitative technique when used for the analysis of real, historical samples, the versatility of SERS methodologies can allow a single sample to be used in a series of sequential analyses. First, a single micro-sample can be mixed with an activated colloidal solution and investigated as such. Following drying of this same sample, it can undergo suitable acid-based pre-treatments such as treatment with nitric acid or controlled exposure to hydrofluoric acid vapors before examination [18]. SERS screening methods are therefore potentially of great value for the investigation of naturally aged artefacts suspected of containing low concentrations of brazilwood dyestuffs and pigments which are of historical relevance and which necessitate less destructive investigations or even in situ analyses when sampling is prohibited, or where chromatographic methods are unavailable. The use of conventional SERS methodologies is most likely to be successful in cases where the brazilwood colorant is potentially present in the most superficial layer. The use of this technique when analyzing paint samples is, however, much more complicated, as high degrees of heterogeneity can be expected, given that the brazilwood is present as a lake pigment that may have been mixed with other pigments. The embedding of such samples in resins or other materials as cross-sections further adds to the complexity. The use of SERS methodologies thus seems most viable, at this stage, as a first approach, to use during the examination of textiles dyed with brazilwood, even in a faded condition.
In this work a reference sample of urolithin C was examined by classical Raman and colloidal SERS to understand whether characteristic features of the relatively persistent urolithin C marker component can be successfully distinguished. Based on the results of this study and additional work on reference samples, colloidal SERS was used to examine four historical textiles (with pre-treatments as necessary). Samples of the four textiles had been previously analyzed by HPLC-DAD during restoration campaigns (data included in the restoration documentation stored by the corresponding institutions) and were all known to contain urolithin C together with varying proportions of surviving brazilwood colorant components, other dyestuffs and a range of other molecules typical of historical dyed textile samples.

2. Materials and Methods

Urolithin C was purchased from Dalton Research Molecules, 349 Wildcat Road, Toronto, Ontario, M3J 2S#11, Canada, purity greater than 95% by HPLC, and used as such. Brazilin was purchased from ICN Biomedical Inc. Cat #205613. The powdered brazilwood lake reference was prepared at the National Gallery in 2003 from Sappan Lignum (Caesalpinia sappan), no further details of the recipe are available. Details of the four historical textile samples, two from tonacelles (ecclesiastical garments) and two from tapestries examined, are given in Table 1.
Samples S#11 and S#5 belong to the series of the Valois Tapestries, woven in Brussels in the sixteenth century and belonging to the Gallerie degli Uffizi, Florence, directed by Eike Schmidt. The series consists of eight sixteenth-century tapestries, representing Catherine de Medici and her family observing courtly festivities, collectively known as The Valois Tapestries [19]. The samples were collected during the restoration performed by Restauro Tessile di Bayer e Perrone da Zara, Florence, Italy, directed by Alessandra Griffo (Gallerie degli Uffizi) and funded by the Friends of the Uffizi, chaired by Maria Vittoria Colonna Rimbotti, with the contribution of Mrs. Veronica Atkins. Samples S#27 and S#9 are part of a collection of eighteenth-century Italian ecclesiastical garments belonging to a public authority, which was subjected to a restoration campaign in 2011–2012 during which the private company ‘Giordano Passarella’ was appointed, who performed the sampling.

2.1. High Performance Liquid Chromatography (HPLC-DAD/HPLC-ESI-Q-ToF-MS)

For HPLC-DAD analyses, a HPLC system 2089 quaternary gradient with a diode array spectrophotometric detector MD-2010 was used, equipped with an AS-950 autosampler (Jasco International Co., Tokyo, Japan). Injection volume was 20 µL. ChromNav software was used to carry out data acquisition and data analysis. The chromatographic separation was performed on an analytical reversed-phase column TC-C18 (2) (250 × 4.6 mm, 5 µm for samples S#27 and S#9 and 150 × 4.6 mm, 5 µm for samples S#11 and S#5) with a TC-C18 (2) pre-column (12.5 × 4.6 mm, 5 µm), both from Agilent Technologies (Palo Alto, Santa Clara, CA, USA). The eluents were A, trifluoroacetic acid (TFA 0.1% v/v) in bidistilled water, and B, trifluoroacetic acid (TFA 0.1% v/v) in HPLC-grade acetonitrile. The flow rate was 1.0 mL/min and the program was 15% B for 5 min, then to 50% B in 25 min, then to 70% B in 10 min, to 100% B in 1 min and then hold for 5 min; re-equilibration took 13 min. The separation took place at room temperature (25 °C). The detector operated with spectra acquisition in the range of 200–650 nm every 0.8 s with 4 nm resolution.
For HPLC-ESI-Q-ToF analyses, a HPLC 1200 Infinity coupled to a Jet Stream ESI-Q-ToF 6530 Infinity detector was used, equipped with an Agilent Infinity autosampler (Agilent Technologies, Palo Alto, Santa Clara, CA, USA). Injection volume was 4 µL for S#27 and 10 µL for S#9 and S#5. MassHunter® Workstation Software (B.04.00) was used to carry out mass spectrometer control, data acquisition and data analysis. The chromatographic separation was performed on an analytical reversed-phase column Poroshell 120 EC-C18 column (3.0 mm × 75 mm, 2.7 μm particle size) with a Zorbax Eclipse plus C-18 guard column (4.6 mm × 12.5 mm, 5 μm particle size), both from Agilent Technologies (Palo Alto, Santa Clara, CA, USA). The eluents were A, formic acid (FA 1% v/v) in LC-MS-grade water, and B, formic acid (FA 1% v/v) in LC-MS-grade acetonitrile. The flow rate was 0.4 mL/min and the program was 15% B for 2.6 min, then to 50% B in 13 min, to 70% B in 5.2 min, to 100% B in 0.5 min and then hold for 1 min; re-equilibration took 10 min. During the separation, the column was thermostated at 30 °C. The mass spectrometer operated in ESI ionization in negative mode and the working conditions were: drying gas (N2, purity > 98%) temperature 350 °C and 10 L/min flow; capillary voltage 4.5 KV; nebulizer gas pressure 35 psig; sheath gas temperature 375 °C and 11 L/min flow; and fragmentor voltage 175 V. High-resolution MS and MS/MS spectra (CID voltage 30 V) were acquired in negative mode in the range 100–1000 m/z at a scan rate of 1.04 spectra/sec (N2, purity 99.999%). Auto-calibration was performed daily using Agilent tuning mix HP0321 (Agilent Technologies) prepared in acetonitrile.
All samples were treated with 200 μL of 0.1% Na2EDTAaq/DMF (1:1, v/v) and extracted at 60 °C for 60 min in an ultrasonic bath; the extract was filtered on PTFE (0.45 μm) prior to injection.

2.2. Surface-Enhanced Raman Spectroscopy

SERS measurements were carried out utilizing modified Lee and Meisel citrate-reduced silver colloids by the reduction of silver nitrate (Aldrich silver nitrate 99.9%) with sodium citrate (Aldrich sodium citrate dehydrate 99%) [20]. The colloid has a characteristic absorption maximum at 426 nm and FWHM of 110 nm, as measured with a Hewlett Packard 8453 photodiode array UV–Vis spectrometer (following a 1:9 dilution with ultrapure water to observe maximum absorbance within the instrumental range). SERS measurements were firstly carried out by adding a 5 μL drop of colloid aggregated with magnesium sulphate directly onto micro-samples. On drying, the same micro-samples were subsequently exposed to hydrofluoric acid vapors for 5 min in a closed Eppendorf, then dried and examined again with a 5 μL drop of aggregated colloid [18]. Spectra were recorded using a laboratory Jasco NRS#3100 spectrophotometer with an argon laser emitting at 514 nm (grating 1200 lines/mm), and spectra could be obtained between 2 and 10 min after addition of the colloid and remained constant in quality until the evaporation of the liquid. Data were collected over the range 150–1800 cm−1 with exposure times from 1–7 s and 3–10 accumulations. Laser power was maintained between 0.6 and 2 mW with an overall spectral resolution of ~4 cm−1. Polystyrene was used for instrument calibration. Raw data are shown, free from any manipulation other than being overlaid in graphs for reasons of clarity.

3. Results and Discussion

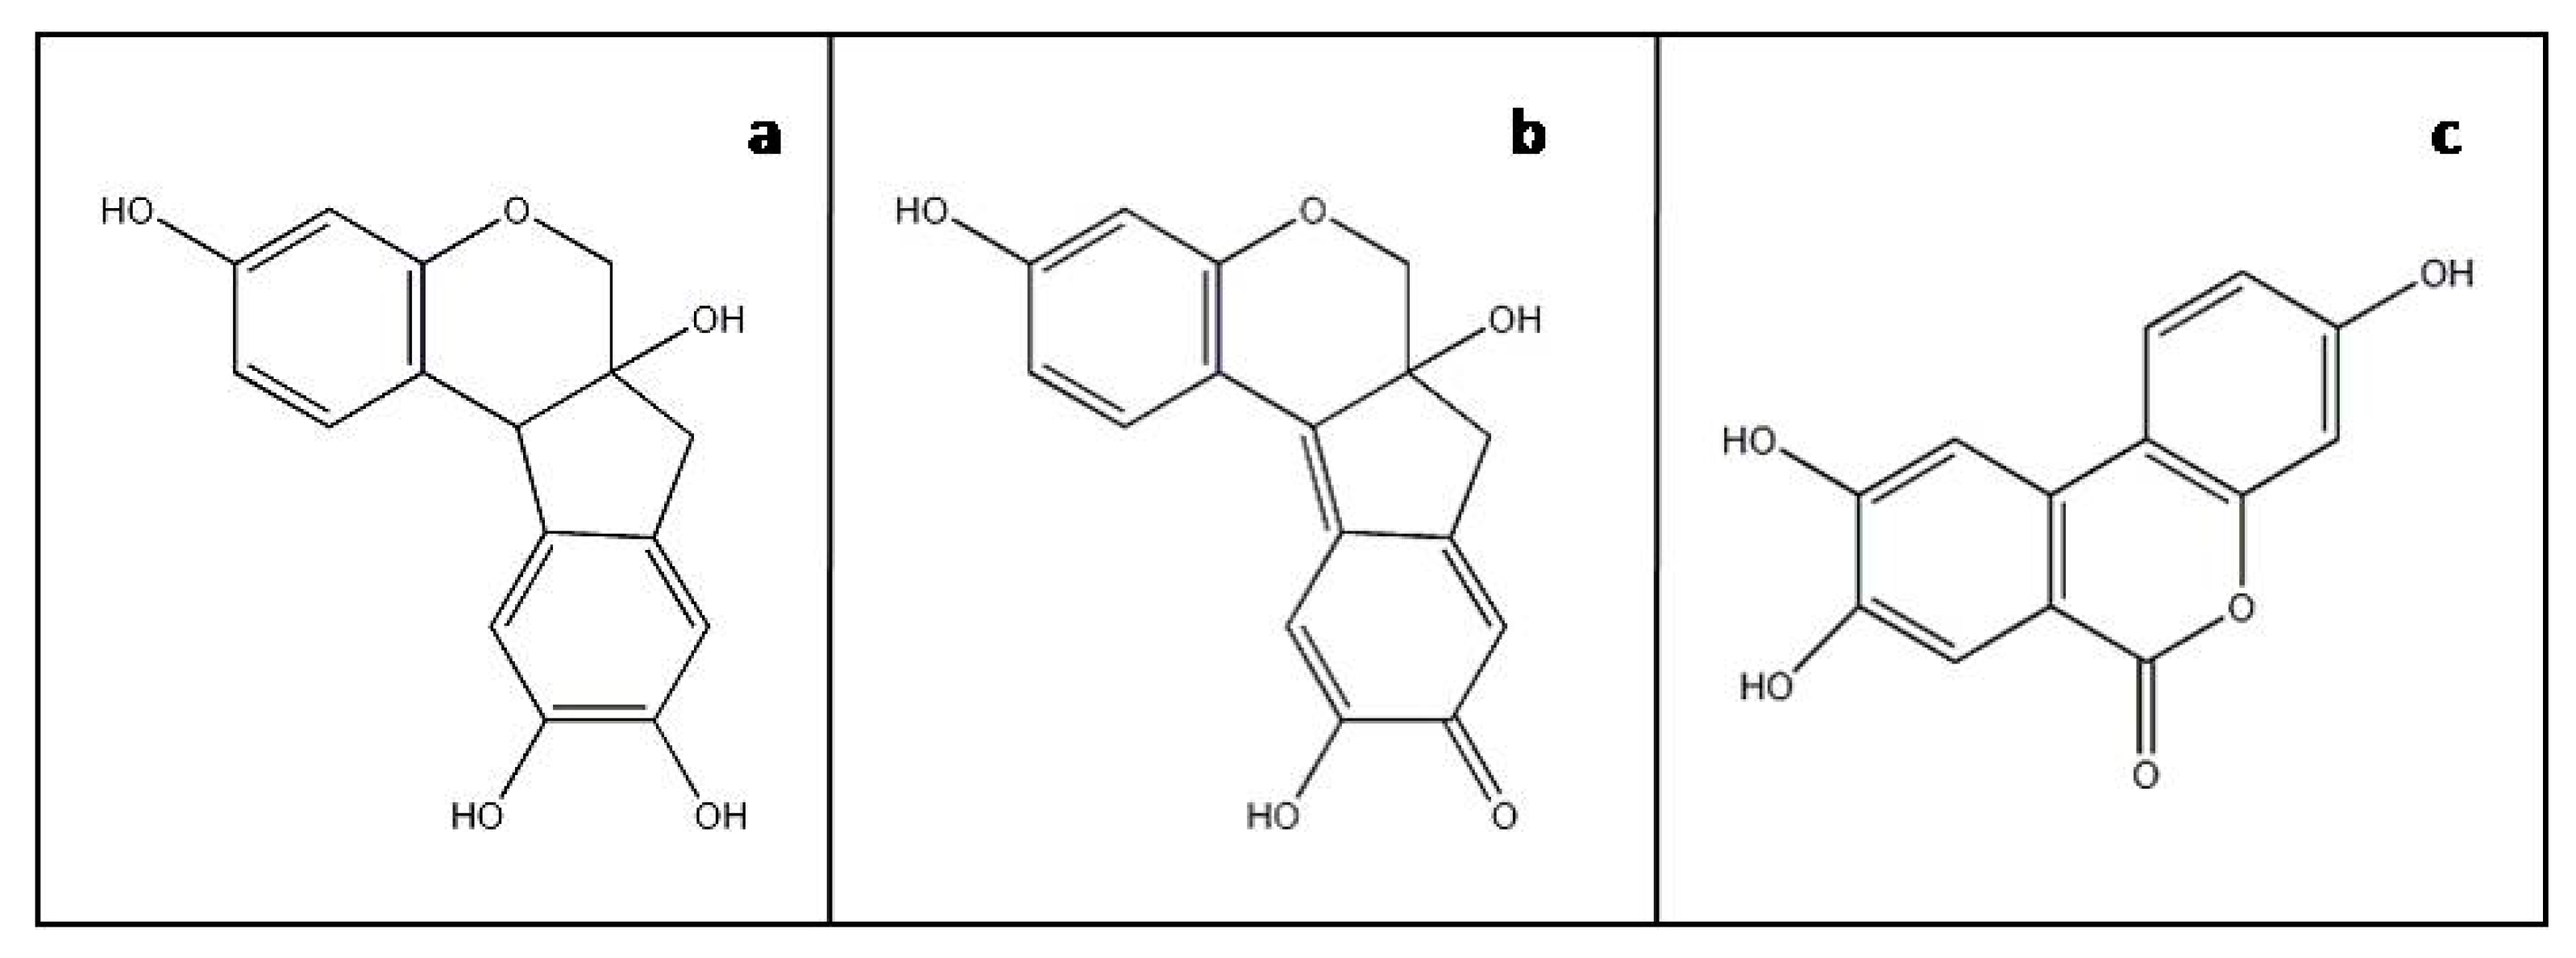
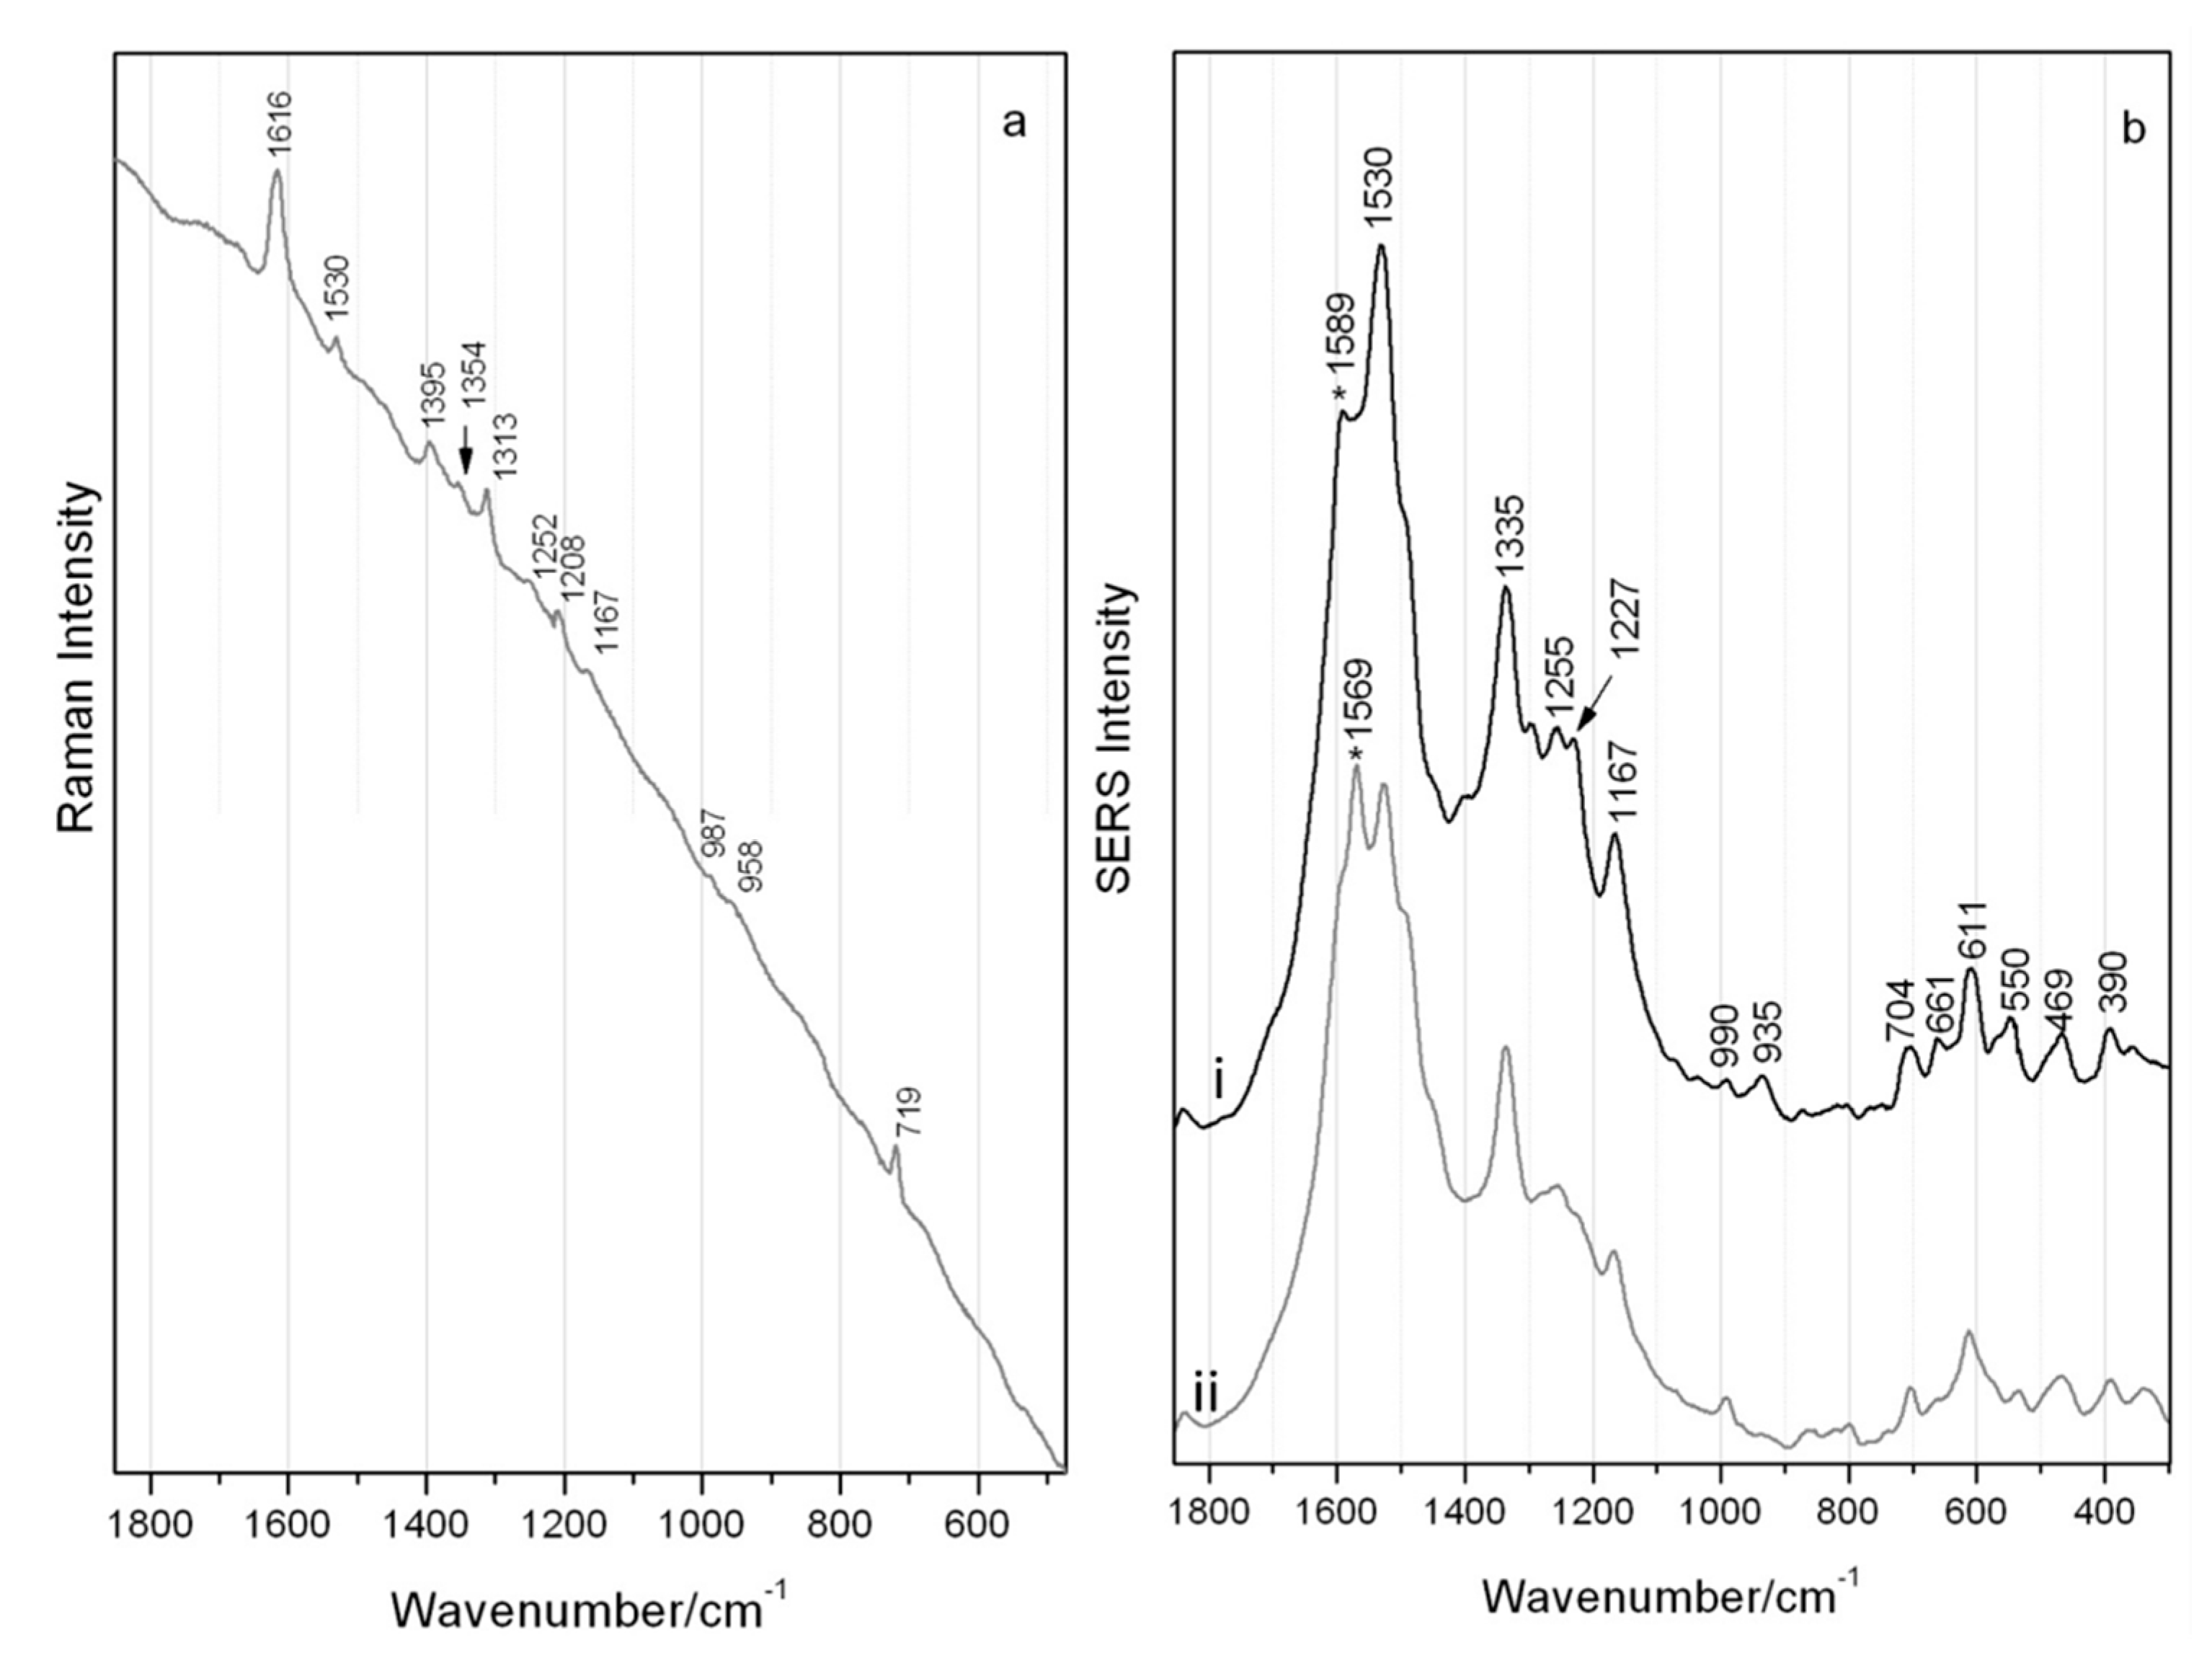
3.1. Brazilin Reference and Brazilwood Pigment

SERS spectra could be readily obtained from the brazilin reference sample, the main constituent in brazilwood dye sources, utilizing the conventional colloidal SERS approach at pH quasi neutral (Figure 2i) and reported in Table 2. In order to obtain a higher quality SERS spectrum from a reference sample of a brazilwood lake pigment, it was instead necessary to routinely pre-treat the sample with HF acid vapors to liberate the main dye constituent from its inorganic substrate, an action that allows for a greater adsorption of dye molecules onto the SERS active substrate (Figure 2ii). On comparison of these spectra, and on account of the differing SERS experimental procedures, spectral behaviors such as frequency shifts and peak intensity fluctuations can be noticed. Such behavior is due to the varied chemisorption of the dye/hydrolyzed components on the silver colloidal surfaces on formation of a complex. This can lead to a modification of the polarizability and vibrational modes and may also enable charge transfer to occur. The change in intensity of bands in the SERS spectra can be attributed to the relative orientation of the analyte with respect to the silver. A broad background remains observable in both spectra due to residual intrinsic fluorescence, impurities or the SERS continuum of undefined physical origin [21].
The intense broad band at 1562–4 cm−1 attributed to aromatic ring vibrations with δ(OH) and ν(C=C) contributions together with the ring deformations at 466–7 cm−1 are present in both spectra and represent the diagnostic SERS bands indicative of colorants in brazilwood. The ν(C=C(=O)-C=C) system located at 1377 cm−1 for the brazilwood pigment is attributed to its brazilein content, and it is unobservable for the brazilin reference which instead has a peak at 1352 cm−1 attributed to the ν(C-O), δ(OCC) and δ(CH2) modes. The peak at 1619 cm−1, apparent in the hydrolyzed lake samples, is possibly again due to brazilein and attributed to ν(C=C) and ν(C=O) and can also be seen as a weak shoulder (marked with an asterisk) in the brazilin reference. This could in fact indicate a small amount of brazilein in the brazilin reference sample due to natural oxidation. It is likely that the brazilwood constituents are attached to the silver colloidal surface via the C=O and OH groups, similar to the flavonoid class of molecules [23].
Further weak peaks (marked by asterisks in Figure 2ii), which appear at 1515 and 1497 cm−1 in the brazilin reference and which possibly relate to the ν(C=C), are replaced by a small shoulder at 1518 cm−1 in the hydrolyzed lake. The band at 549 cm−1, attributed to the δ(ring), appears less intense in the brazilwood pigment. Other spectral regions instead show pronounced frequency shifts possibly governed by changes in the polarizability of the analyte–metal complexes. The δ(CCH) and ν(C-C) bands shift from 1168 cm−1 in the brazilin reference to 1176 cm−1 for the brazilwood pigment. The weak 715 cm−1 band for the brazilin, attributed to the γ(CO) + γ(CH), is shifted to 728 cm−1 in the pigment. The bands at 1219 cm−1 (ν(C-O) + ν(C-C)), 1259 cm−1 (ν(C-O) + ν(C-C) + δ(CH2)), 1028 cm−1 (in-plane δ(CH)) and 676 cm−1 (γ(CH) + δ(CC-O)) are all instead only observed in the brazilin [13,25,26].

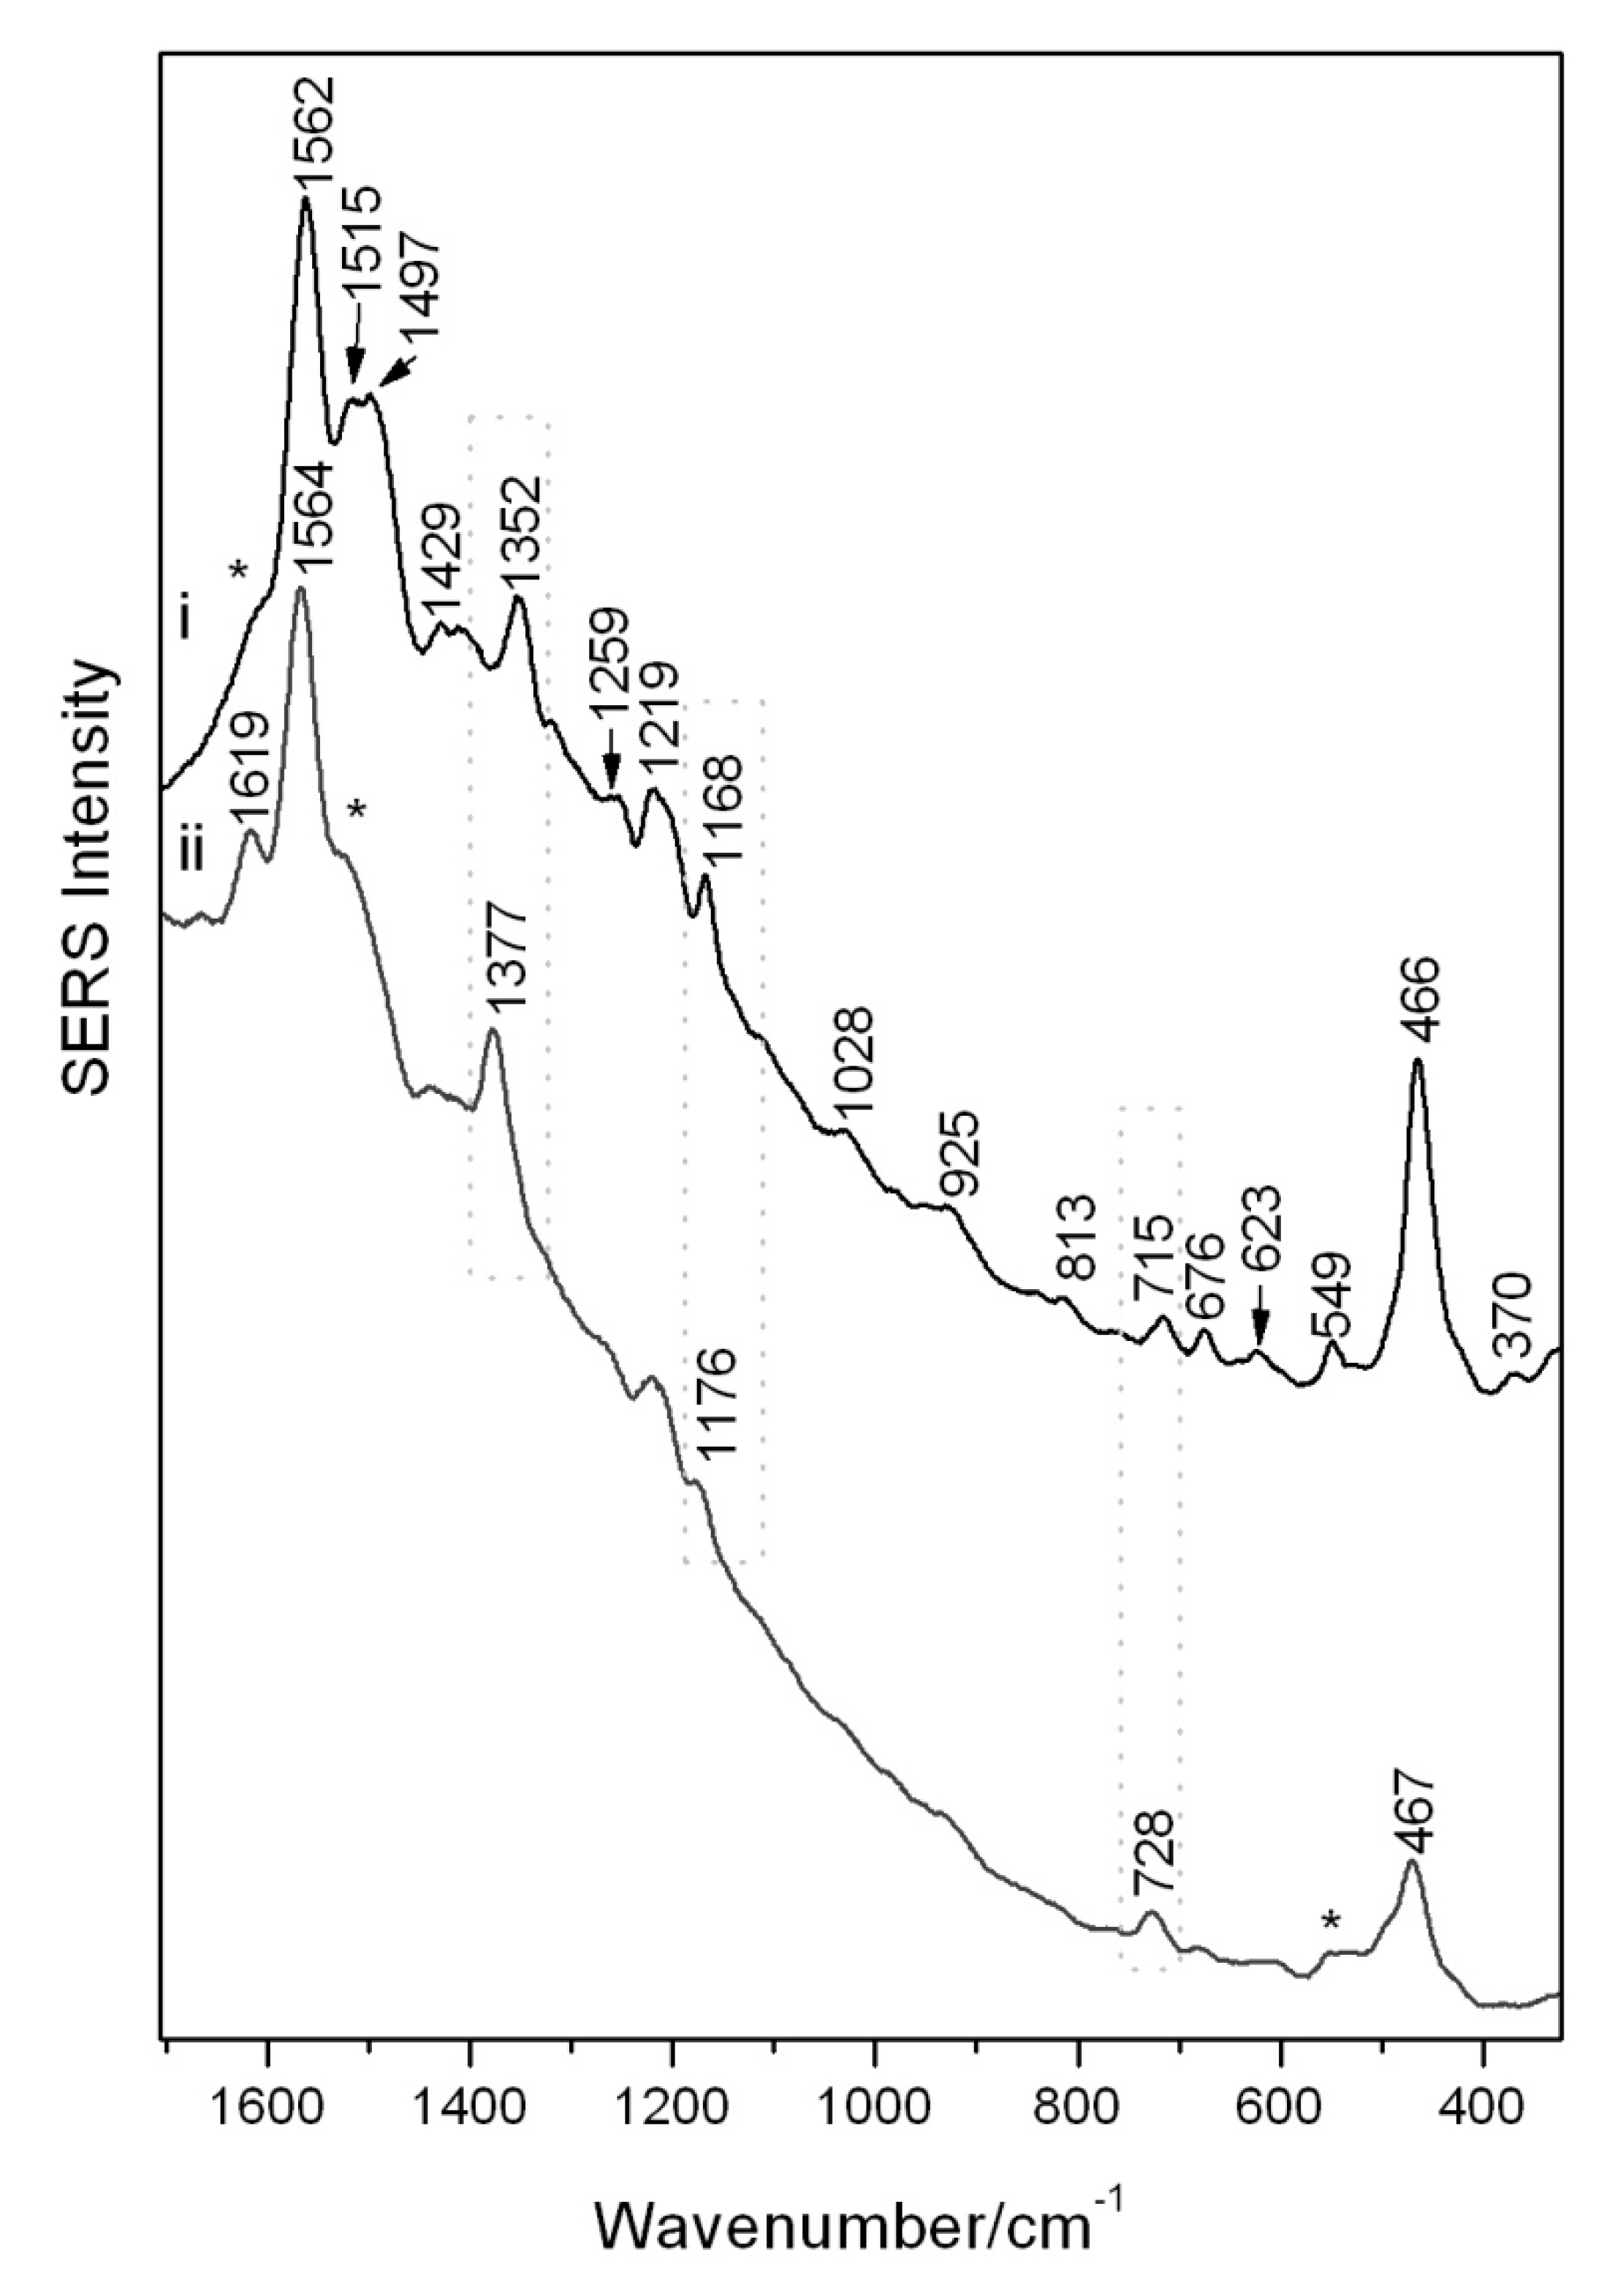
3.2. Urolithin C Standard

Although fluorescence was relatively high, adequate classical Raman scattering of the brazilwood marker component, urolithin C, could be recorded using laser excitation at 514 nm as shown in Figure 3a with main bands highlighted in Table 2. Bands resulting from the phenanthrene skeleton can be tentatively assigned to the ν(CC) and ν(CO) at 1616 cm−1 and to the ν(CC) and νass(O-C-O) at 1530 cm−1 [24]. Bands visible at ~1400 cm−1 may be due to the ν(C-C) and δ(HCC) and the out-of-plane CH modes at 719 cm−1. SERS measurements of the same micro-sample of urolithin C reveals two predominant spectra as given in Figure 3b and reported in Table 2. Fluctuations for the bands at 1589 and 1569 cm−1, related to ν(C=C) + δ(OH) modes, could be observed during spectra collection as there was a constant movement of colloidal/urolithin C particles within the examined aqueous droplet. While this can be related to the common blinking phenomenon, the reproducibility of the spectra could actually indicate a changeable interaction of the hydroxyl groups with the silver surface [27,28,29].
The bands at 1530, 1167 and very weak 990 cm−1 (ring breathing vibration) visible in the Raman spectrum are the only ones also featured in the SERS spectra without any great shift. Significant differences in the relative intensity and position of peaks can be observed when the spectra shown in Figure 3a,b are compared. These are the result of SERS surface selection rules and are due to a combination of the orientation of the analyte on the colloidal surface and specific Raman mode symmetry, and very likely in the formation of the surface complex where Raman modes in the molecule disappear on interaction with the surface and instead other modes or new modes may be activated [21].
No bands at higher wavenumber than 1600 cm−1 are visible under SERS conditions, although there is a large enhancement of the 1530 cm−1 band (ν(CC) and tentatively νassym(OCO)), accompanied by a band at 1335 cm−1, possibly attributed to the νsymm(OCO). The 1167 cm−1 SERS band results from ν(C-C) and δ(CH). Multiple strong bands at low wavenumbers are due to out-of-plane deformation modes of C=C bonds with a visible δ(C=O) in the range 600–660 cm−1. All this data collectively provides information as to the orientation of urolithin C when chemisorbed or in close interaction with the silver. It is possible that the overall behavior of urolithin C, interacting with the silver colloid via both the carbonyl and hydroxyl functional groups, may be related directly to concentration effects. Possibly at lower concentrations urolithin C can initially orient somewhat flatter, while instead at higher concentrations (near to and above monolayer coverage) it is possibly forced to adsorb end-on due to crowding, resulting in the aforementioned signal fluctuations [30].

3.3. Historical Textile Samples

The aforementioned spectral features and behaviors of both of brazilwood’s main colorant components, and the marker component, urolithin C, were used to guide the interpretation of the SERS spectra obtained from micro-samples of historic brazilwood-dyed linen, silk and wool textiles.
In order to provide a validation of the results obtained through SERS, the historical textile samples had previously been investigated by chromatographic methods (HPLC-DAD) and were all known to contain urolithin C. In some samples additional colorants, namely flavonoids, indigoids and tannins, could be identified. All HPLC results are summarized in Table 3 and are described in more detail below in relation to the SERS results.
In the chromatogram (insert Figure 4a) of the extract of the brown wool sample S#5, shown at 275 nm, the peak for urolithin C could be detected together with very low quantities of sappanol, a molecular marker of redwood-type dyes [14,31]. A component of tannin dyes but also a known degradation marker of both flavonoid compounds and protein-based threads, 4-hydroxybenzoic acid, was also detected [32].
S#5 was investigated by colloidal SERS directly on the sample, which was followed with hydrofluoric acid pre-treatment, the resulting spectra shown in Figure 4a(i,ii), respectively. The well-resolved spectrum of S#5 with direct colloidal SERS can be seen in Figure 4 ai where the bands associated with urolithin C (1530, 1340, 1167, 987 and 654 cm−1) can be observed. Following HF pre-treatment—and unlike the other samples described below—there is no improvement in the quality of the SERS response (Figure 4a(ii)), although weak bands associated with urolithin C can still be observed at 1530 and 660 cm−1. It is likely that in the spectra for this sample the 4-hydroxybenzoic acid identified by HPLC analysis can be observed. Although there is a partial overlap with the marker component, the bands at 1618, 1390, 1017 and 830 cm−1 correspond to those reported in the literature for this molecule [33]. The results obtained from this sample confirm that urolithin C can be detected by SERS in samples where little or no brazilwood colorant components survive, even in samples containing high proportions of 4-hydroxybenzoic acid as is commonly observed in historical textile samples.
In the chromatogram of the extract of the orange silk sample S#11 (insert Figure 4b) shown at 275 nm, ellagic acid is the most intense peak, followed by urolithin C, fisetin and 4-hydroxybenzoic acid. This suggests that S#11 had been dyed with brazilwood and young fustic, consistent with previous studies [34] performed on silk core fibers of golden metal threads. Ellagic acid could have been added to the dye bath to improve the final color, used as a mordant or may have been co-extracted from the bark used when dyeing with young fustic.
In Figure 4b(i,ii), a noisy spectrum was obtained for the direct colloidal SERS where the bands related to the presence of the urolithin C marker component, namely 1530 and 660 cm−1, can be observed. Following acid pre-treatment of this sample, a much more defined spectrum is obtained (Figure 4b(ii)) and the signals identifying the urolithin C constituent can be better appreciated (1530, ~1330 and ~660 cm−1). The presence of strong bands in the lower wavenumber range attributed to the ring ν(CC) perhaps indicate a more planar orientation in relation to the colloidal surface. Further bands with reasonable intensity at 1605, 1470 and 1287 cm−1 can be ascribed to the co-presence of ellagic acid in this sample [35], as highlighted by the HPLC analysis. The bands at 1567, 1370, 885 and 548 cm−1 collectively provide information regarding the presence of flavonoid materials but do not permit determination of the specific dye source [25]. No bands exclusively pertaining to 4-hydroxybenzoic acid could be identified. This result highlights the selective nature of SERS when multi-components of varying solubilities and concentrations can interact with the Ag colloid, and where some components are likely preferentially adsorbed over others. In this case, implementing a further SERS extraction step with methanol/HCl could be of some benefit.
In the chromatogram (insert Figure 4c) of the extract of the linen sample S#27 shown at 275 nm, the peak for urolithin C is the most intense, while several other dye materials are also present. These include minor components typical of brazilwood and logwood dyes (sappanol; hematein; brazilein; hematoxylin; and 4-hydroxybenzoic acid) [14,31]. This sample also contains ellagic acid, suggesting the co-presence of tannins, again either used to modify the color or as a mordant during dyeing [7].
For the linen sample S#27, acquisitions performed with the colloidal SERS directly on the sample and after the hydrofluoric acid pre-treatment gave rise to the spectra shown in Figure 4c(i,ii), respectively. By direct colloidal SERS, the main features—albeit quite noisy—of the brazilwood marker urolithin C can be seen, with a band at 1530 cm−1 accompanied by broad bands at 1589, 660 and 990 cm−1 (very weak). The band at 1350 cm−1 possibly indicates the co-presence of brazilin/brazilein or even haematin from logwood, a further neoflavonoid which would not have been taken into consideration had it not been for the HPLC results. Following HF pre-treatment, the bands at 1566, 1357 and 467 cm−1 are slightly shifted from the characteristic bands reported here for brazilin/brazilein (shown in Figure 2), and the peak at 1377 cm−1 attributed to brazilein cannot be observed. It is plausible to hypothesize the presence of logwood also given the similarity of the SERS spectral features [25]. A few further weak bands can be seen in Figure 4c(i,ii), namely those in the 1470–1490 cm−1 range, and a band at 1270 cm−1 seen only in Figure 4c(i). These bands cannot be specifically assigned, but most likely belong to the additional minor components, 4-hydroxybenzoic acid and ellagic acid, as identified by HPLC. In this sample the urolithin C component is readily available to interact with the colloid without any pre-treatment steps and despite the confirmed presence of other coloring components. Once these other components were subsequently liberated from the mordant/textile complex following acid hydrolysis, they can be preferentially observed and distinguished. This underlines the necessity of the two-step process for a fuller sample characterization.
In the chromatogram of the extract of the deeper orange silk sample S#9 (insert Figure 4d) shown at 275 nm, urolithin C is the most intense peak. In addition, sappanol and 4-hydroxybenzoic acid are identified, as are sulfuretin, a sulfuretin-glucoside and fisetin, all ascribable to the use of young fustic [36]. Luteolin was also observed, suggesting the co-presence of a second yellow flavonoid dye. The presence of indigotin suggests that indigo or woad was also used to obtain the desired hue.
The SERS spectra obtained from S#9 can be observed in Figure 4d(i,ii) for direct colloidal SERS and after HF pre-treatment, respectively. Interestingly, in both spectra the main bands of urolithin C (1530, ~1335 and ~660 cm−1) can be observed. In this case, the acid pre-treatment does not enhance the quality of the spectra. Given the delicate nature of the substrate and acid hydrolysis conditions, it is worth nothing that no bands relating to the protein content of the silk matrix are observed by SERS [37]. Furthermore, no bands attributable to brazilein are apparent either. Beyond the marker component, a number of other weaker bands can be observed relating to the flavonoid content in the sample highlighted by HPLC analysis. Specifically, in Figure 4d(i), the bands at 1573 and 1240 cm−1 relate to luteolin, the band at 844 cm−1 is suggestive of components with a flavonoid structure, while those at 587 and 620 cm−1 are features which correlate with the suggested fustic content [26]. HPLC analysis also indicates the presence of indigo, which could be observed instead by conventional Raman pre-SERS (spectrum not shown). The identification of the marker component is apparent in this sample in the presence of flavonoid and indigoid dyes and is evidence of the use of brazilwood even when the brazilwood colorants have not survived.

4. Conclusions

In this work, the spectral features of the brazilwood marker component urolithin C have been characterized by conventional and surface-enhanced Raman spectroscopy, and compared to those of the main brazilwood chromophores in the pure reference material and in a brazilwood lake pigment sample. The results obtained suggested that the SERS approach was suitable for use on historical textile samples and it was subsequently successfully applied to minute samples from four historical linen, silk and wool textiles dyed with brazilwood and showing varying degrees of fading. The SERS findings were correlated with HPLC-DAD and HPLC-ESI-Q-ToF-MS analyses which offered a full description of the major and minor components in each sample. The combined use of the direct colloidal approach followed by a HF pre-treatment was demonstrated to provide a fuller characterization protocol than using either approach alone. Using direct colloidal SERS methods, it was possible to observe the presence of the marker component, urolithin C, in each textile sample even when no brazilwood colorant survived and in the co-presence of other dyestuffs and textile degradation products such as 4-hydroxybenzoic acid. The additional acidic hydrolysis pre-treatment has been shown to promote the release of any remaining colorants from the mordant/textile fiber which allowed characterization of minor tannin (ellagic acid) and flavonoid dyestuff components (luteolin, fisetin) also present in the samples, although this treatment could make it harder to detect the brazilwood marker component. The results presented here confirmed the original use of brazilwood in each textile even when a further neoflavonoid-based dye, logwood, is hypothesized. This SERS methodology has the potential to be used as an in situ method for the examination of textiles where brazilwood colorant is potentially present at the fiber surface. Other artefacts where a brazilwood-based colorant is suspected in exposed surface layers could be examined using a similar approach.

Supplementary Materials

The following are available online at https://0-www-mdpi-com.brum.beds.ac.uk/article/10.3390/heritage4030078/s1. Figure S1: The HPLC-DAD chromatograms featured in Figure 4.

Author Contributions

Conceptualization, B.D., A.R., C.H., D.P. and C.M.; data curation, B.D. and I.D.; formal analysis, B.D. and I.D.; methodology, A.R., M.P.C. and C.M.; supervision, M.P.C. and C.M.; writing—original draft, B.D., I.D., A.R., C.H. and D.P.; writing—review and editing, B.D., I.D., A.R., C.H., D.P., M.P.C. and C.M. All authors have read and agreed to the published version of the manuscript.

Funding

This research was funded by the research activities in the IPERION HS project, funded by the European Commission, H2020-INFRAIA-2019-1 (Grant Agreement n. 871034).

Data Availability Statement

All raw and processed data are in the process of being made available to accompany this paper, please contact the corresponding author for updates.

Conflicts of Interest

The authors declare no conflict of interest.

References

  1. Cardon, D. Natural Dyes: Sources, Tradition, Technology and Science; Archetype Publications Ltd: London, UK, 2007. [Google Scholar]
  2. Kirby, J.; Saunders, D.; Spring, M. The Object in Context: Crossing Conservation Boundaries. In Proceedings of the Contributions to the Munich Congress, Munich, Germany, 28 August–1 September 2006; Studies in Conservation. Volume 51, pp. 236–243. [Google Scholar] [CrossRef]
  3. Kirby, J.; Spring, M.; Higgitt, C. The Technology of Red Lake Pigment Manufacture: Study of the Dyestuff Substrate. Natl. Gallery Tech. Bull. 2005, 26, 71–88. [Google Scholar]
  4. Bomford, D.; Kirby, J.; Roy, A.; Rüger, A.; White, R. Art in the Making: Rembrandt; National Gallery Company Ltd: London, UK, 2006; pp. 41–44. [Google Scholar]
  5. Centeno, S.A.; Hale, C.; Carò, F.; Cesaratto, A.; Shibayama, N.; Delaney, J.; Dooley, K.; van der Snickt, G.; Janssens, K.; Stein, S.A. Van Gogh’s Irises and Roses: The contribution of chemical analyses and imaging to the assessment of color changes in the red lake pigments. Herit. Sci. 2017, 5, 18. [Google Scholar] [CrossRef] [Green Version]
  6. Kirby, J.; Van Bommel, M.; Verhecken, A. Natural Colorants for Dyeing and Lake Pigments Practical Recipes and Their Historical Sources; Archtype Publications Ltd: London, UK, 2014. [Google Scholar]
  7. de Graaff, J.H.H. The Colourful Past: Origins, Chemistry and Identification of Natural Dyestuffs; Abbeg-Stiftung: Riggisberg & Archetype Publications Ltd: London, UK, 2004. [Google Scholar]
  8. De Oliveira, L.F.C.; Edwards, H.G.M.; Velozo, E.S.; Nesbitt, M. Vibrational spectroscopic study of brazilin and brazilein, the main constituents of brazilwood from Brazil. Vib. Spectrosc. 2002, 28, 243–249. [Google Scholar] [CrossRef]
  9. Edwards, H.G.M.; De Oliveira, L.F.; Nesbitt, C.M. Fourier-transform Raman characterization of brazilwood trees and substitutes. Analyst 2003, 128, 82–87. [Google Scholar] [CrossRef]
  10. Nowik, W. The Possibility of Differentiation and Identification of Red and Blue Soluble Dyewoods. Determination of Species used in Dyeing and Chemistry of their Dyestuffs. Dyes in History and Archaeology16/17. Presented at the 16th Meeting, Lyons, France, 1997 and the 17th Meeting, Greenwich, UK, 1998; Kirby, J., Ed.; Archetype Publications Ltd.: London, UK, 2001; pp. 129–144. [Google Scholar]
  11. Lluveras-Tenorio, A.; Parlanti, F.; Degano, I.; Lorenzetti, G.; Demosthenous, D.; Colombini, M.P.; Rasmussen, K.L. Spectroscopic and mass spectrometric approach to define the Cyprus Orthodox icon tradition—The first known occurrence of Indian lac in Greece/Europe. Microchem. J. 2017, 131, 112–119. [Google Scholar] [CrossRef]
  12. Peggie, D.A.; Kirby, J.; Poulin, J.; Genuit, W.; Romanuka, J.; Wills, D.F.; De Simone, A.; Hulme, A.N. Historical mystery solved: A multi-analytical approach to the identification of a key marker for the historical use of brazilwood (Caesalpinin spp.) in paintings and textiles. Anal. Methods 2018, 10, 617–662. [Google Scholar] [CrossRef] [Green Version]
  13. Nirma, N.P.; Rajput, M.S.; Prasad, R.G.S.V.; Ahmad, M. Brazilin from Caesalpinia sappan heartwood and its pharmacological activities: A review. Asian Pac. J. Trop. 2015, 8, 421–430. [Google Scholar] [CrossRef] [PubMed] [Green Version]
  14. Tamburini, D. Investigating Asian colourants in Chinese textiles from Dunhuang (7th–10th century AD) by high performance liquid chromatography tandem mass spectrometry—Towards the creation of a mass spectra database. Dye. Pigment. 2019, 163, 454–474. [Google Scholar] [CrossRef]
  15. Yin, P.; Zhang, J.; Yan, L.; Yang, L.; Sun, L.; Shi, L.; Ma, C.; Liu, Y.; Urolithin, C. A gut metabolite of ellagic acid, induces apoptosis in PC12 cells through a mitochondria-mediated pathway. RSC Adv. 2017, 7, 17254–17263. [Google Scholar] [CrossRef] [Green Version]
  16. Espín, J.C.; Larrosa, M.; García-Conesa, M.T.; Tomás-Barberán, F. Evidence-Based Complementary and Alternative Medicine; Hindawi Publishing Corporation: London, UK, 2013. [Google Scholar] [CrossRef] [Green Version]
  17. Dillmann, P.; Bellot-Gurlet, L.; Nenner, I. (Eds.) Nanoscience and Cultural Heritage; Atlantis Press: Paris, France, 2016. [Google Scholar]
  18. Leona, M.; Stenger, J.; Ferloni, E. Application of Surface-Enhanced Raman scattering techniques to the ultrasensitive identification of natural dyes in works of art. J. Raman Spectrosc. 2006, 37, 981–992. [Google Scholar] [CrossRef]
  19. Cleland, E.; Marjorie, E.; Wieseman, E. Renaissance Splendor—Catherine de’ Medici’s Valois Tapestries; With contributions by de Luca, F., Griffo, A., Perrone Da Zara, C., Beyer, C., Eds.; The Cleveland Museum of Art: Yale University Press: New Haven, CT, USA, 2019; ISBN-13: 978-0300237061. [Google Scholar]
  20. Lee, P.C.; Meisel, D. Adsorption and surface-enhanced Raman of dyes on silver and gold sols. J. Phys. Chem. 1982, 86, 3391–3395. [Google Scholar] [CrossRef]
  21. Le Ru, E.; Etchegoin, P. Principles of Surface-Enhanced Raman Spectroscopy and Related Plasmonic Effects, 1st ed.; Elsevier: Amsterdam, The Netherlands, 2008. [Google Scholar]
  22. Idone, A.; Gulmini, M.; Henry, A.I.; Casadio, F.; Chang, L.; Appolonia, L.; Van Duyne, R.P.; Shah, N.C. Silver colloidal pastes for dye analysis of reference and historical textile fibers using direct, extractionless, non-hydrolysis surface-enhanced Raman spectroscopy. Analyst 2013, 138, 5895. [Google Scholar] [CrossRef] [PubMed]
  23. Pozzi, F.; Zaleski, S.; Casadio, F.; Van Duyne, R.P. SERS Discrimination of Closely Related Molecules: A Systematic Study of Natural Red Dyes in Binary Mixtures. J. Phys. Chem. C 2016, 120, 21017–21026. [Google Scholar] [CrossRef]
  24. Alajtal, A.I.; Edwards, H.G.M.; Elbagerma, M.A.; Scowen, I.J. The effect of laser wavelength on the Raman Spectra of phenanthrene, chrysene and tetracene: Implications for extra-terrestrial detection of polyaromatic hydrocarbons. Spectrochim. Acta A 2010, 76, 1–5. [Google Scholar] [CrossRef]
  25. Bruni, S.; Guglielmi, V.; Pozzi, F. Historical organic dyes: A surface-enhanced Raman scattering (SERS) spectral database on Ag Lee–Meisel colloids aggregated by NaClO4. J. Raman Spectrosc 2011, 42, 1267–1281. [Google Scholar] [CrossRef]
  26. Fazio, E.; Neri, F.; Valenti, A.; Ossi, P.M.; Trusso, S.; Ponterio, R.C. Raman spectroscopy of organic dyes adsorbed on pulsed laser deposited silver thin films. Appl. Surf. Sci. 2013, 278, 259–264. [Google Scholar] [CrossRef]
  27. Martina, I.; Wiesinger, R.; Jembrih-Simbürger, D.; Schreiner, M. Micro-Raman characterisation of silver corrosion products: Instrumental set up and reference database. E Preserv. Sci. 2012, 9, 1–8. [Google Scholar]
  28. Arivazhagan, M.; Subhasini, V.P.; Kavitha, R. Density functional theory investigations on the conformational stability, molecular structure and vibrational spectra of 6-methyl-2-chromenone. Spectrochim. Acta 2014, 128, 527–539. [Google Scholar] [CrossRef] [PubMed]
  29. Wang, X.; Xu, Q.; Hu, X.; Han, F.; Zhu, C. Silver-nanoparticles/graphene hybrids for effective enrichment and sensitive SERS detection of polycyclic aromatic hydrocarbons. Spectrochim. Acta A 2020, 228, 117783. [Google Scholar] [CrossRef]
  30. Murray, C.A.; Bodoff, S. Depolarization effects in Raman scattering from cyanide on silver island films. Phys. Rev. B 1985, 32, 671. [Google Scholar] [CrossRef]
  31. Hulme, A.N.; McNab, H.; Peggie, D.A.; Quye, A. Negative ion electrospray mass spectrometry of neoflavonoids. Phytochemistry 2005, 66, 66–70. [Google Scholar] [CrossRef]
  32. Degano, I.; Biesaga, M.; Colombini, M.P.; Trojanowicz, M. Historical and archaeological textiles: An insight on degradation products of wool yarns. J. Chromatogr. A 2011, 1218, 5837–5847. [Google Scholar] [CrossRef]
  33. Gao, J.; Hu, Y.; Li, S.; Zhang, Y.; Chen, X. Adsorption of benzoic acid, phthalic acid on gold substrates studied by surface-enhanced Raman scattering spectroscopy and density functional theory calculations. Spectrochim. Acta A 2013, 104, 41–47. [Google Scholar] [CrossRef]
  34. Peggie, D.A. The Development and Application of Analytical Methods for the Identification of Dyes on Historical Textiles; University of Edinburgh: Edinburgh, Scotland, 2006; Available online: http://hdl.handle.net/1842/15623 (accessed on 7 December 2020).
  35. Lee, S.J.; Cheong, B.S.; Cho, H.G. Surface-enhanced Raman Spectroscopic Studies of Ellagic Acid in Silver Colloids. Bull. Korean Chem. Soc. 2015, 36, 1637–1644. [Google Scholar] [CrossRef]
  36. Valianou, L.; Stathopoulou, K.; Karapanagiotis, I.; Magiatis, P.; Pavlidou, E.; Skaltsounis, A.L. Phytochemical analysis of young fustic (Cotinuscoggygria heartwood) and identification of isolated colourants in historical textiles. Anal. Bioanal. Chem. 2009, 394, 871–882. [Google Scholar] [CrossRef]
  37. Pozzi, F.; Lombardi, J.R.; Bruni, S.; Leona, M. Sample treatment considerations in the analysis of organic colorants by surface-enhanced Raman scattering. Anal. Chem. 2012, 84, 3751–3757. [Google Scholar] [CrossRef]
Figure 1. Molecular structures of (a) brazilin, (b) brazilein and (c) marker component urolithin C.
Heritage 04 00078 g001
Figure 2. SERS spectra of (i) reference sample of brazilin reference (regular colloidal SERS) and (ii) a brazilwood pigment (pre-treated with HF). Reproducible peaks which vary widely in intensity are denoted with an asterisk.
Heritage 04 00078 g002
Figure 3. Spectra of urolithin C (λ 514 nm) by (a) classical Raman and (b) SERS (regular colloidal SERS) with reproducible yet fluctuating intensity of bands as highlighted by * in main traces i and ii.
Heritage 04 00078 g003
Figure 4. SERS spectra obtained (i) with regular colloidal interaction and (ii) following HF pre-treatment respectively for samples: (a) wool S#5, (b) silk S#11; (c) linen S#27 and (d) silk S#9. The corresponding HPLC-DAD chromatograms of the extracts of the samples @275 nm are inserted with abbreviations: pHBA = 4-hydroxybenzoic acid; EA = ellagic acid; UC = urolithin C; LUT = luteolin; and SUL = sulfuretin and are available enlarged in supporting information S1.
Heritage 04 00078 g004
Table 1. Outline of samples investigated in this work.
Sample AbbreviationProvenanceDescription
S#5Valois Tapestries, Fontainebleau, c. 1576, based on a design by Antoine Caron, woven under the direction of Master MPG, Brussels (Gallerie degli Uffizi, Florence)Brown wool
S#11Valois Tapestries, Whale, c. 1576, based on a design by Antoine Caron, woven under the direction of Master MPG, Brussels (Gallerie degli Uffizi, Florence)Pale orange silk core fiber of a golden metal thread
S#27Ecclesiastical garmentRed–brown linen tunic support
S#9Ecclesiastical garmentOrange–brown silk chenille
Table 2. Bands observed in the Raman and SERS spectra (in cm−1, excited at 532 nm) and tentative band assignments. Marker bands for the recognition of each material are given in bold.
Brazilin ReferenceBrazilwood Lake PigmentUrolithin CUrolithin CTentative Assignments [9,20,22,23,24]
SERSSERS on HydrolysisSERSRaman
1619 1616ν (C=C) + ν(C = O)
156215641589
1569
ν(C=C) + δ(OH)
15301530ν(C=C) and νas(O-C-O)
15151500
1497
1429 ν (C=C) + δ(ring) + δ(COH)
1395ν(C-C) and δ(HCC)
1377 C=C(=O)=C=C
1352 1354ν(C-O), δ(OCC) + δ(CH2)
13351313υsy(OCO)
1259 12551252ν (C-O) + ν(C-C) + δ(CH2)
1219 12271208ν (C-O) + ν(C-C)
1168117611671167δ(C-H) and ν(C-C)
1028 in-plane δ(CH)
990987ν (C=C) + ν(C=O)
958ρ (CH2)
925 935
813
715728704719γ (CO) + γ(CH)
676 661 γ (CH) + δ(CC-O)
623 611 γ (CH)
549549550 def.(ring)
466467469 def.(ring)
390
370
ν: stretching; δ: bending; γ: out-of-plane bending; as: asymmetric; and sy: symmetric.
Table 3. Description of historical samples with main components identified by HPLC-DAD and SERS (* = minor species not detected by DAD but confirmed by tandem mass spectrometric detection).
Sample AbbreviationDyestuffs and Other Components Identified
HPLC-DAD and HPLC-ESI-Q-ToFSERS
ColloidalHF Pre-Treatment
S#5Brazilwood (Urolithin C, sappanol *);
4-hydroxybenzoic acid
Urolithin C
4-hydroxybenzoic acid
Urolithin C
4-hydroxybenzoic acid
S#11Brazilwood (Urolithin C); Ellagic acid;
young fustic (sulfuretin);
4-hydroxybenzoic acid
Urolithin CUrolithin C
Ellagic acid
S#27Brazilwood (Urolithin C, sappanol *, brazilein *); logwood (hematein *, hematoxylin *);
ellagic acid;
4-hydroxybenzoic acid
Urolithin C
Neoflavonoid-Brazilein/haematin?
Urolithin C,
Logwood-Haematin?
S#9Brazilwood (Urolithin C, sappanol *); young fustic (sulfuretin, sulfuretin-glucoside *, fisetin *); flavonoid dye (luteolin); indigo or woad (indigotin);
4-hydroxybenzoic acid
Urolithin C,
Luteolin,
Flavonoid-fustic?
Urolithin C,
Luteolin,
Flavonoid-fustic?
Publisher’s Note: MDPI stays neutral with regard to jurisdictional claims in published maps and institutional affiliations.

