
Development of Predictive Geoarchaeological Models to Locate and Assess the Preservation Potential of Submerged Prehistoric Sites Using Remote Sensing, Palaeoenvironmental Analysis, and GIS


Abstract
:1. Introduction
1.1. Predictive Modelling to Locate Submerged Prehistoric Sites and Landscapes
1.2. In Situ Preservation and the Management of Underwater Cultural Heritage
- The location and extent of the site to be preserved, both on and in the seabed;
- The most significant physical, chemical, and biological threats to the site;
- The types of materials present on the site and their state of preservation;
- Strategies to mitigate deterioration and stabilise sites. Depending upon the environment and location of the sites, it may be sufficiently benign that the site can be preserved in situ or, in certain cases, it is more responsible to excavate a site in order to prevent its total loss;
- The subsequent monitoring of a site and any implemented mitigation strategies.
1.3. Tudse Hage: Holocene History of The Study Area
2. Methods
2.1. The Downscaling and Upscaling Concept
2.2. Downscaling
- The generation of seamless morphology maps in a GIS platform over the entire area, using satellite, LIDAR, and orthophoto remote sensing databases;
- Marine geophysical survey using multi- and single-beam echosounders, side-scan sonar, and a sub-bottom profiler.
2.3. Upscaling
- On the basis of the maps and profiles generated, key areas were selected for core sampling to obtain sedimentological, biostratigraphic, and chronological data;
- These three steps enabled the elucidation of the paleogeographical evolution (sedimentary conditions and water-level fluctuations) and the paleoenvironment of the area through time. This step importantly identifies the seabed areas that have survived or, conversely, that have been eroded away since the time of inundation, which would thus negate the need for further investigation;
- The production of geoarchaeological/paleogeographic maps of past coastlines and the identification of potential archaeological “hotspots”, according to Fischer’s (1993) fishing-site-location model;
- The identification of erosive and sedimentary environments for future in situ management purposes.
2.4. Downscaling to Assess Paleogeographic Evolution (Steps 1–2)
2.5. Upscaling through Paleoenvironmental Analyses and Reconstructing Relative Sea-Level Rise (Steps 3–5)
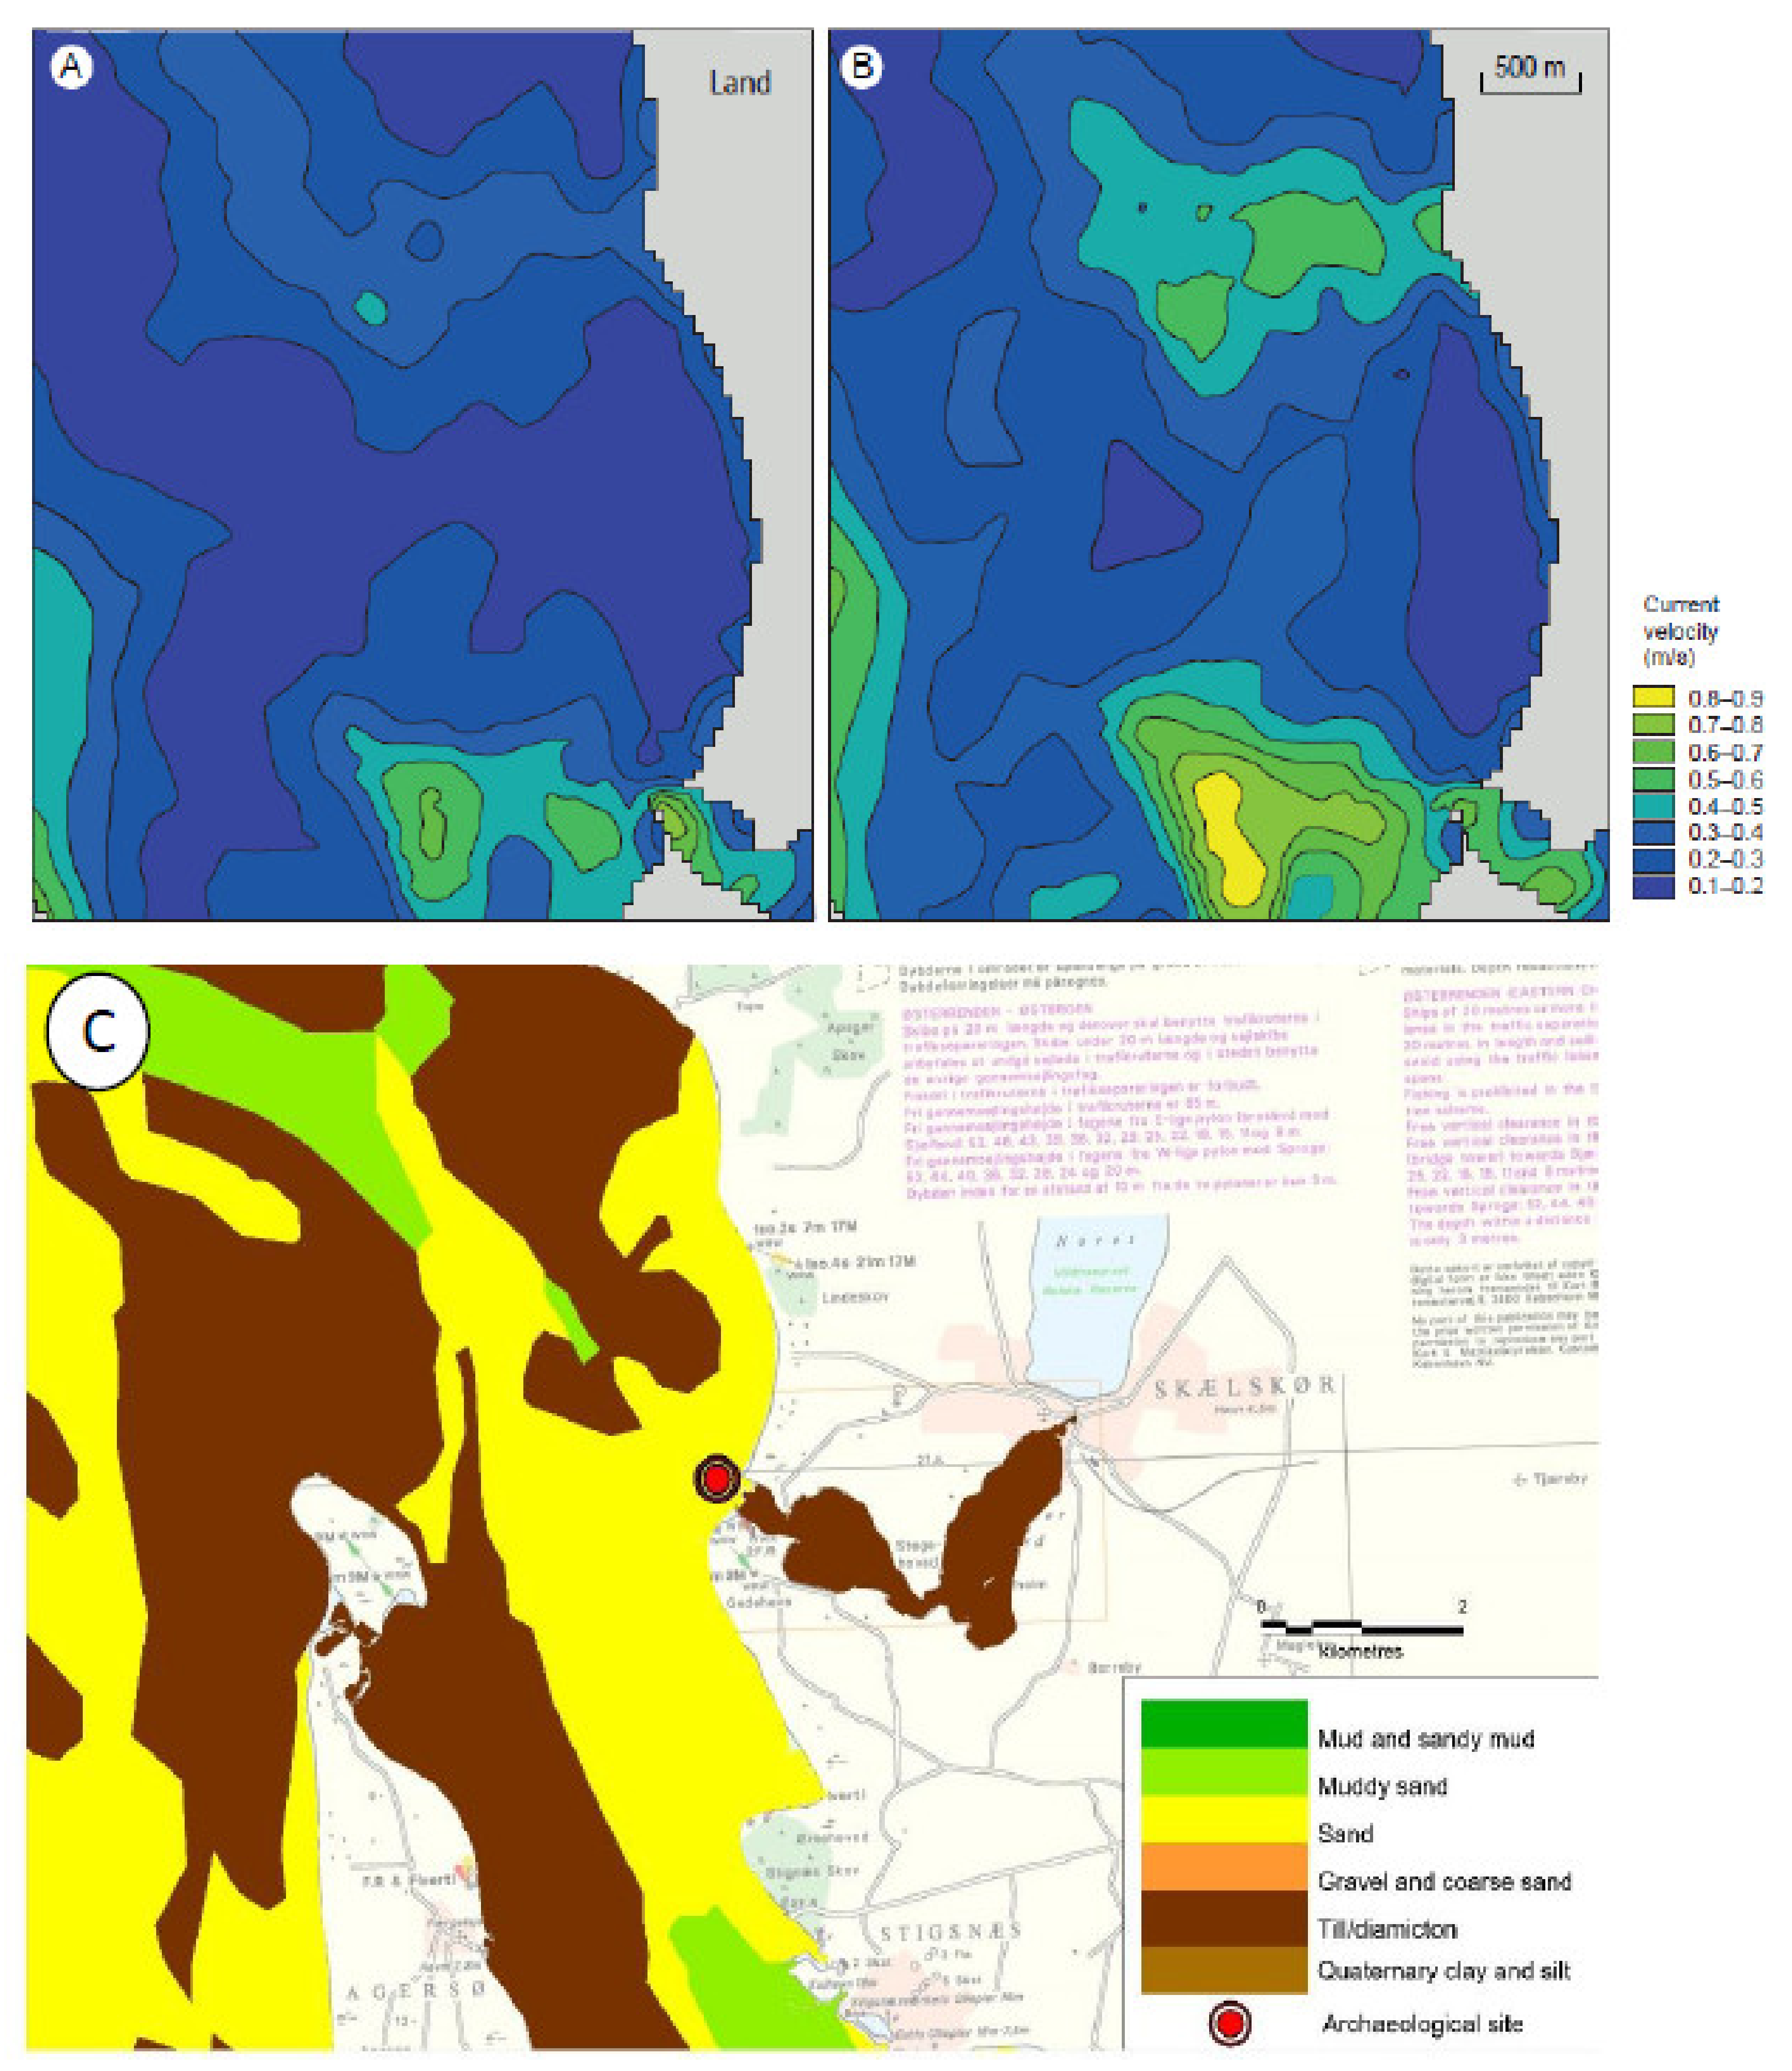
2.6. Predictive Modelling of Preservation Potential (Step 6)
3. Results
3.1. Downscaling to Assess Paleogeographic Evolution
3.2. Upscaling through Paleoenvironmental Analyses and Reconstructing Relative Sea-Level Rise
Sediments
3.3. Macrofossils and Chronology
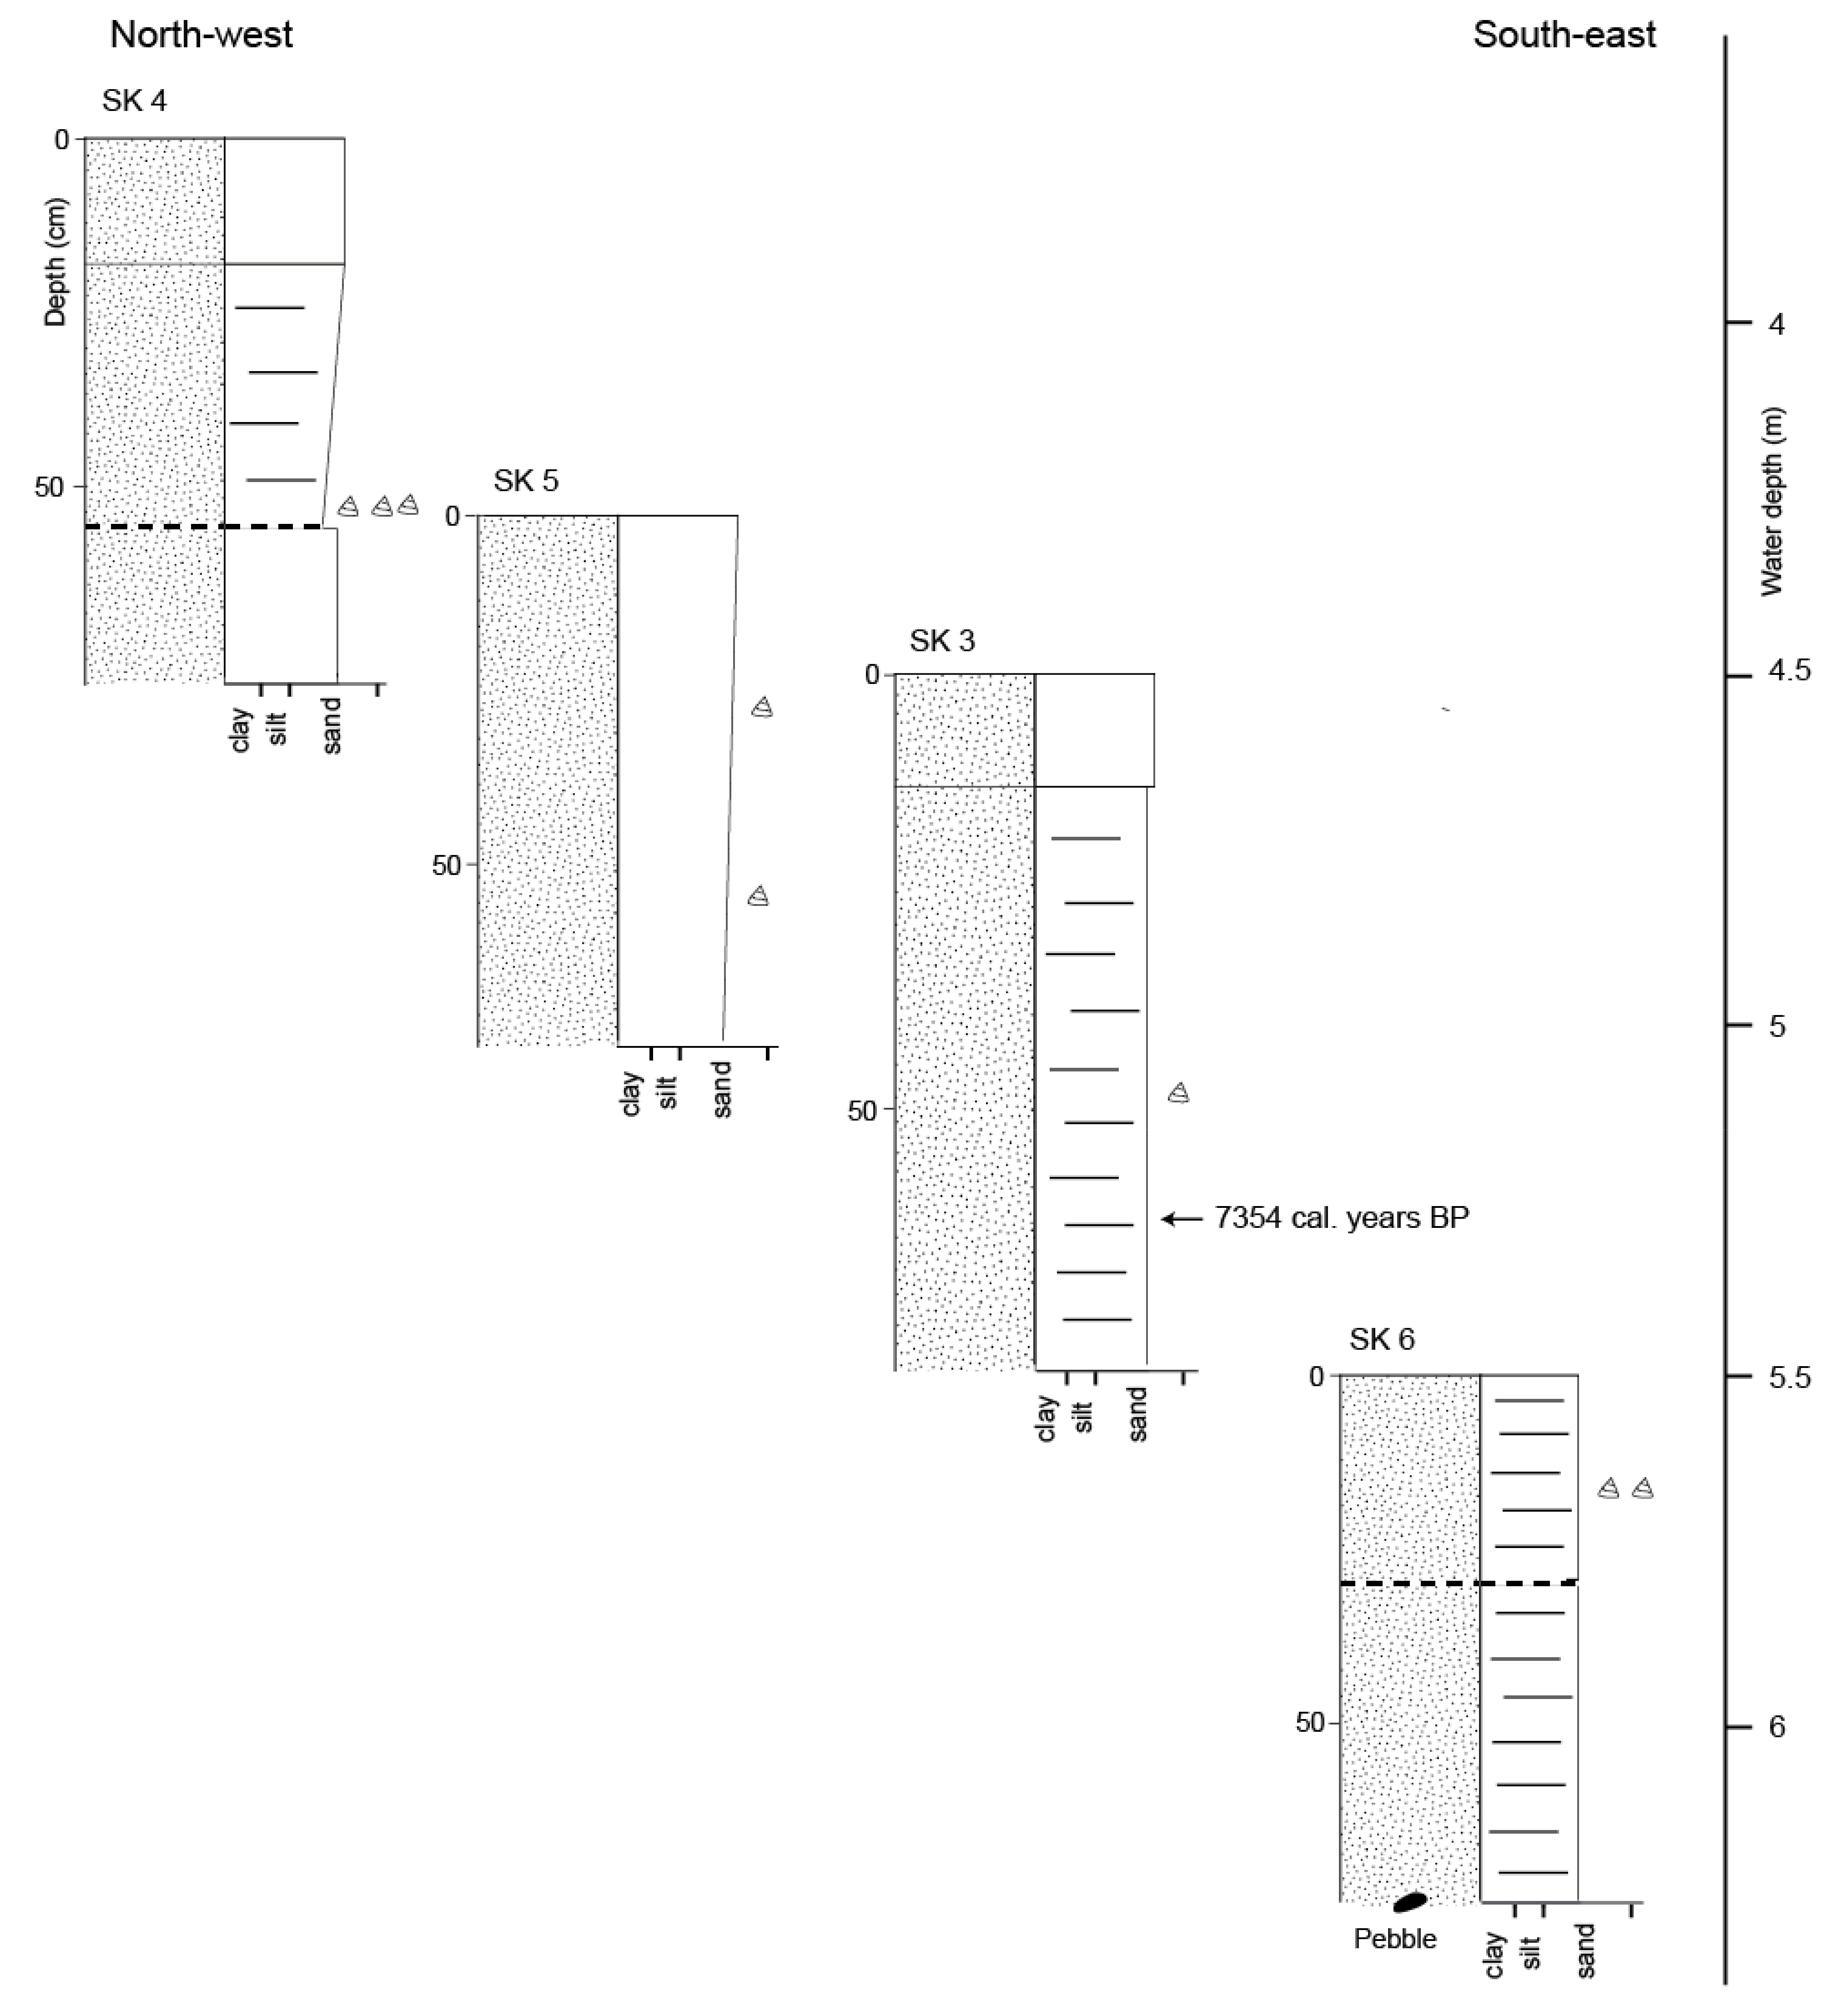
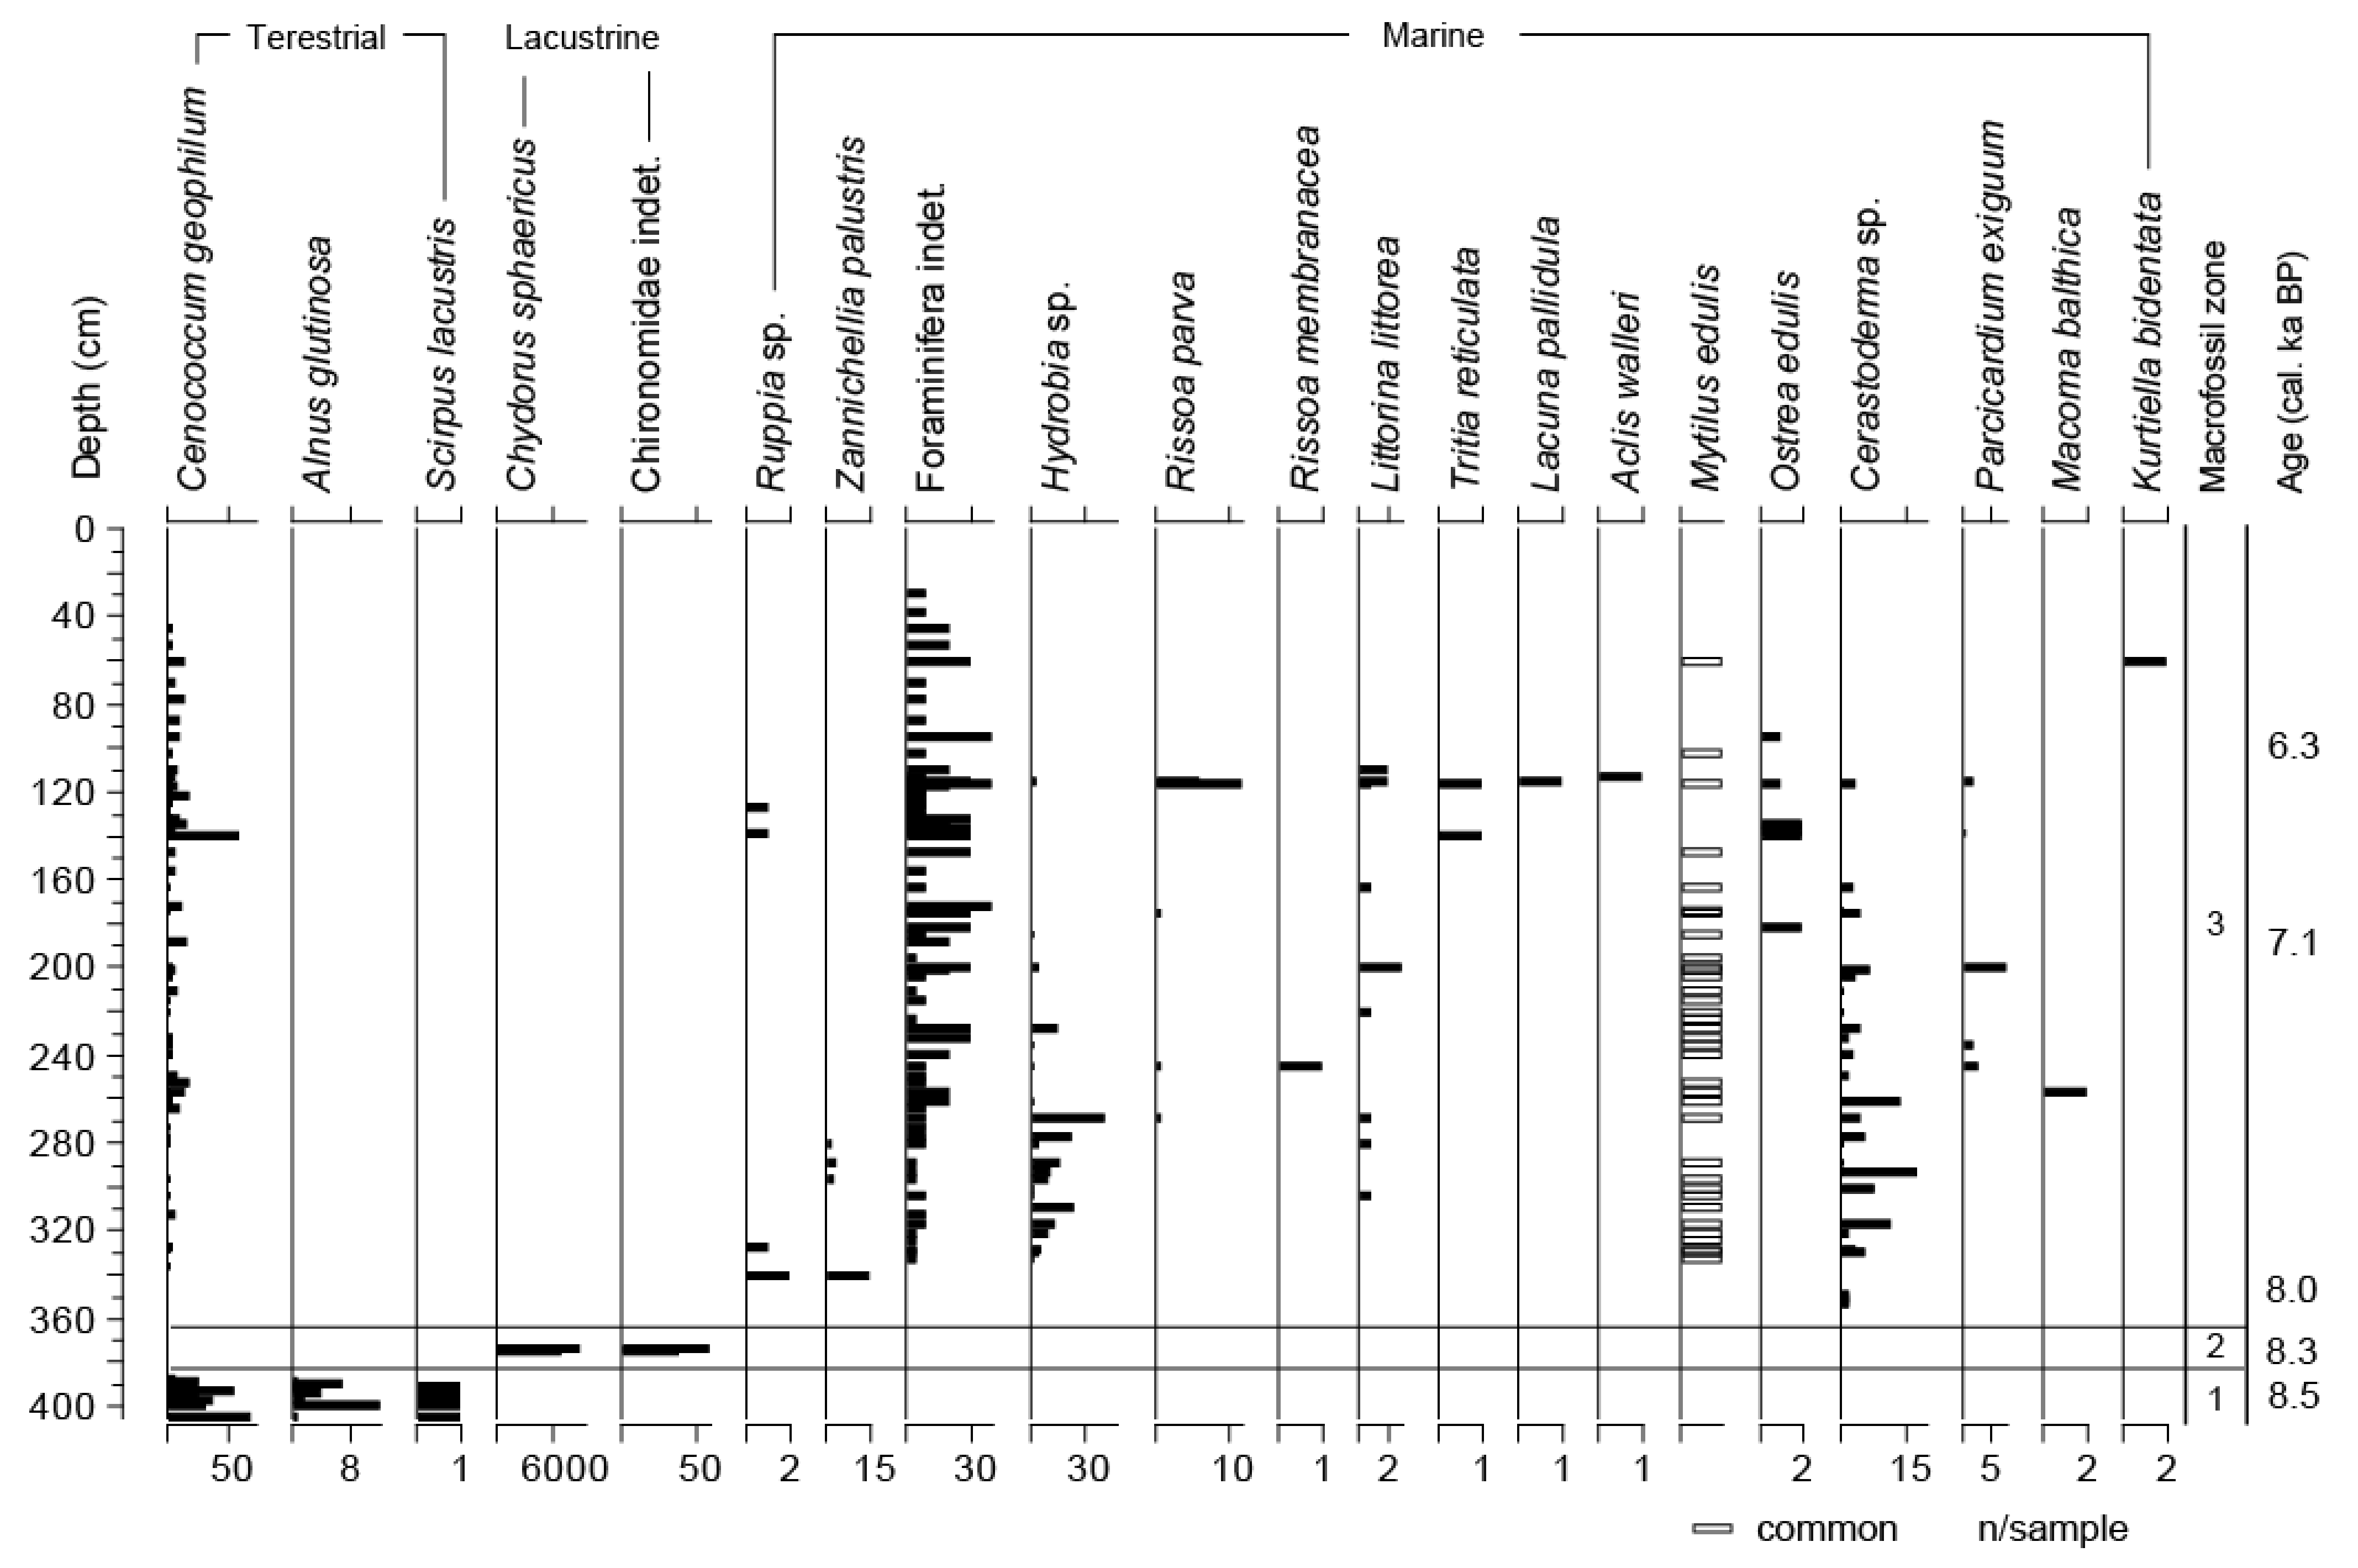
Offshore Cores

| Core | Lab. No. | Material | Depth | Age (14C) | Calibrated | Calibrated |
|---|---|---|---|---|---|---|
| bsl 1 (cm) | yrs (BP) 2 | age (BP) 3 | age (BP) 4 | |||
| Rus 3 | AAR-23210 | Ostrea edulis | 725–726 | 5890 ± 29 | 6115–6414 | 6270 |
| Rus 3 | AAR-23211 | Ostrea edulis | 812–813 | 6612 ± 31 | 6909–7236 | 7072 |
| Rus 3 | AAR-23212 | C. lamarcki | 982–983 | 7506 ± 40 | 7775–8097 | 7932 |
| Rus 3 | AAR-19918 | Leaf fragments 5 | 999–1003 | 7455 ± 50 | 8181–8371 | 8271 |
| Rus 3 | AAR-19919 | Alnus glutinosa | 1020–1021 | 7740 ± 75 | 8380–8697 | 8516 |
| Rus 10 | AAR-23213 | Leaf fragments 5 | 104–106 | 4230 ± 29 | 4649–4856 | 4811 |
| Rus 10 | AAR-23214 | C. lamarcki | 238–240 | 6543 ± 32 | 6821–7161 | 6998 |
| Rus 10 | AAR-23215 | Plant remains | 240–242 | 6538 ± 33 | 7339–7511 | 7456 |
| Rus 11 | AAR-23216 | Leaf fragments 5 | 86–87 | 5139 ± 48 | 5747–5994 | 5894 |
| Rus 11 | AAR-23217 | Leaf fragments 5 | 134–135 | 5888 ± 36 | 6632–6793 | 6709 |
| Rus 11 | AAR-23218 | C. lamarcki | 193–194 | 6381 ± 31 | 6643–6974 | 6807 |
| Rus 11 | AAR-23219 | Leaf fragments 5 | 209–210 | 6235 ± 29 | 7013–7253 | 7161 |
| Rus 11 | AAR-23220 | P. australis | 217–218 | 6225 ± 40 | 6999–7254 | 7108 |
| Rus 11 | AAR-23221 | Quercus sp. | 227–228 | 6500 ± 40 | 7318–7498 | 7382 |
| SK 1 | AAR-21895 | C. lamarcki | 573–577 | 7284 ± 50 | 7558–7876 | 7713 |
| SK 2 | AAR-21896 | C. lamarcki | 490–500 | 7262 ± 50 | 7540–7859 | 7691 |
| SK 2 | AAR-21897 | C. lamarcki | 540–550 | 7363 ± 50 | 7629–7944 | 7790 |
| SK 3 | AAR-21898 | Mytilus edulis | 480–490 | Modern | ||
| SK 3 | AAR-21899 | C. lamarcki | 510–520 | 6834 ± 50 | 7143–7454 | 7300 |
| SK 4 | AAR-21900 | Littorina littorea | 410–420 | Modern | ||
| SK 5 | AAR-21901 | Mytilus edulis | 440–450 | Modern | ||
| SK 6 | AAR-21902 | Littorina littorea | 575–585 | Modern | ||
| TH 2 | Beta-385200 | Wood | 218 | 6000 ± 30 | 6746–6936 | 6838 |
| TH 2 | Beta-385201 | Corylus wood | 223 | 6220 ± 30 | 7003–7250 | 7098 |
| TH 2 | Beta-385202 | Wood | 233 | 6110 ± 30 | 6893–7156 | 6981 |
| TH 2 | Beta-385203 | Corylus wood | 248 | 6220 ± 30 | 7003–7250 | 7098 |
| TH 2 | Beta-385204 | Corylus wood | 266 | 6430 ± 30 | 7280–7423 | 7361 |
| Artefacts | ||||||
| Oar | K-6605 | Tilia wood | c. 200 | 6230 ± 80 | 6908–7318 | 7117 |
| Ax handle | Ua-2496 | Corylus wood | c. 225 | 5305 ± 75 | 5928–6276 | 6091 |
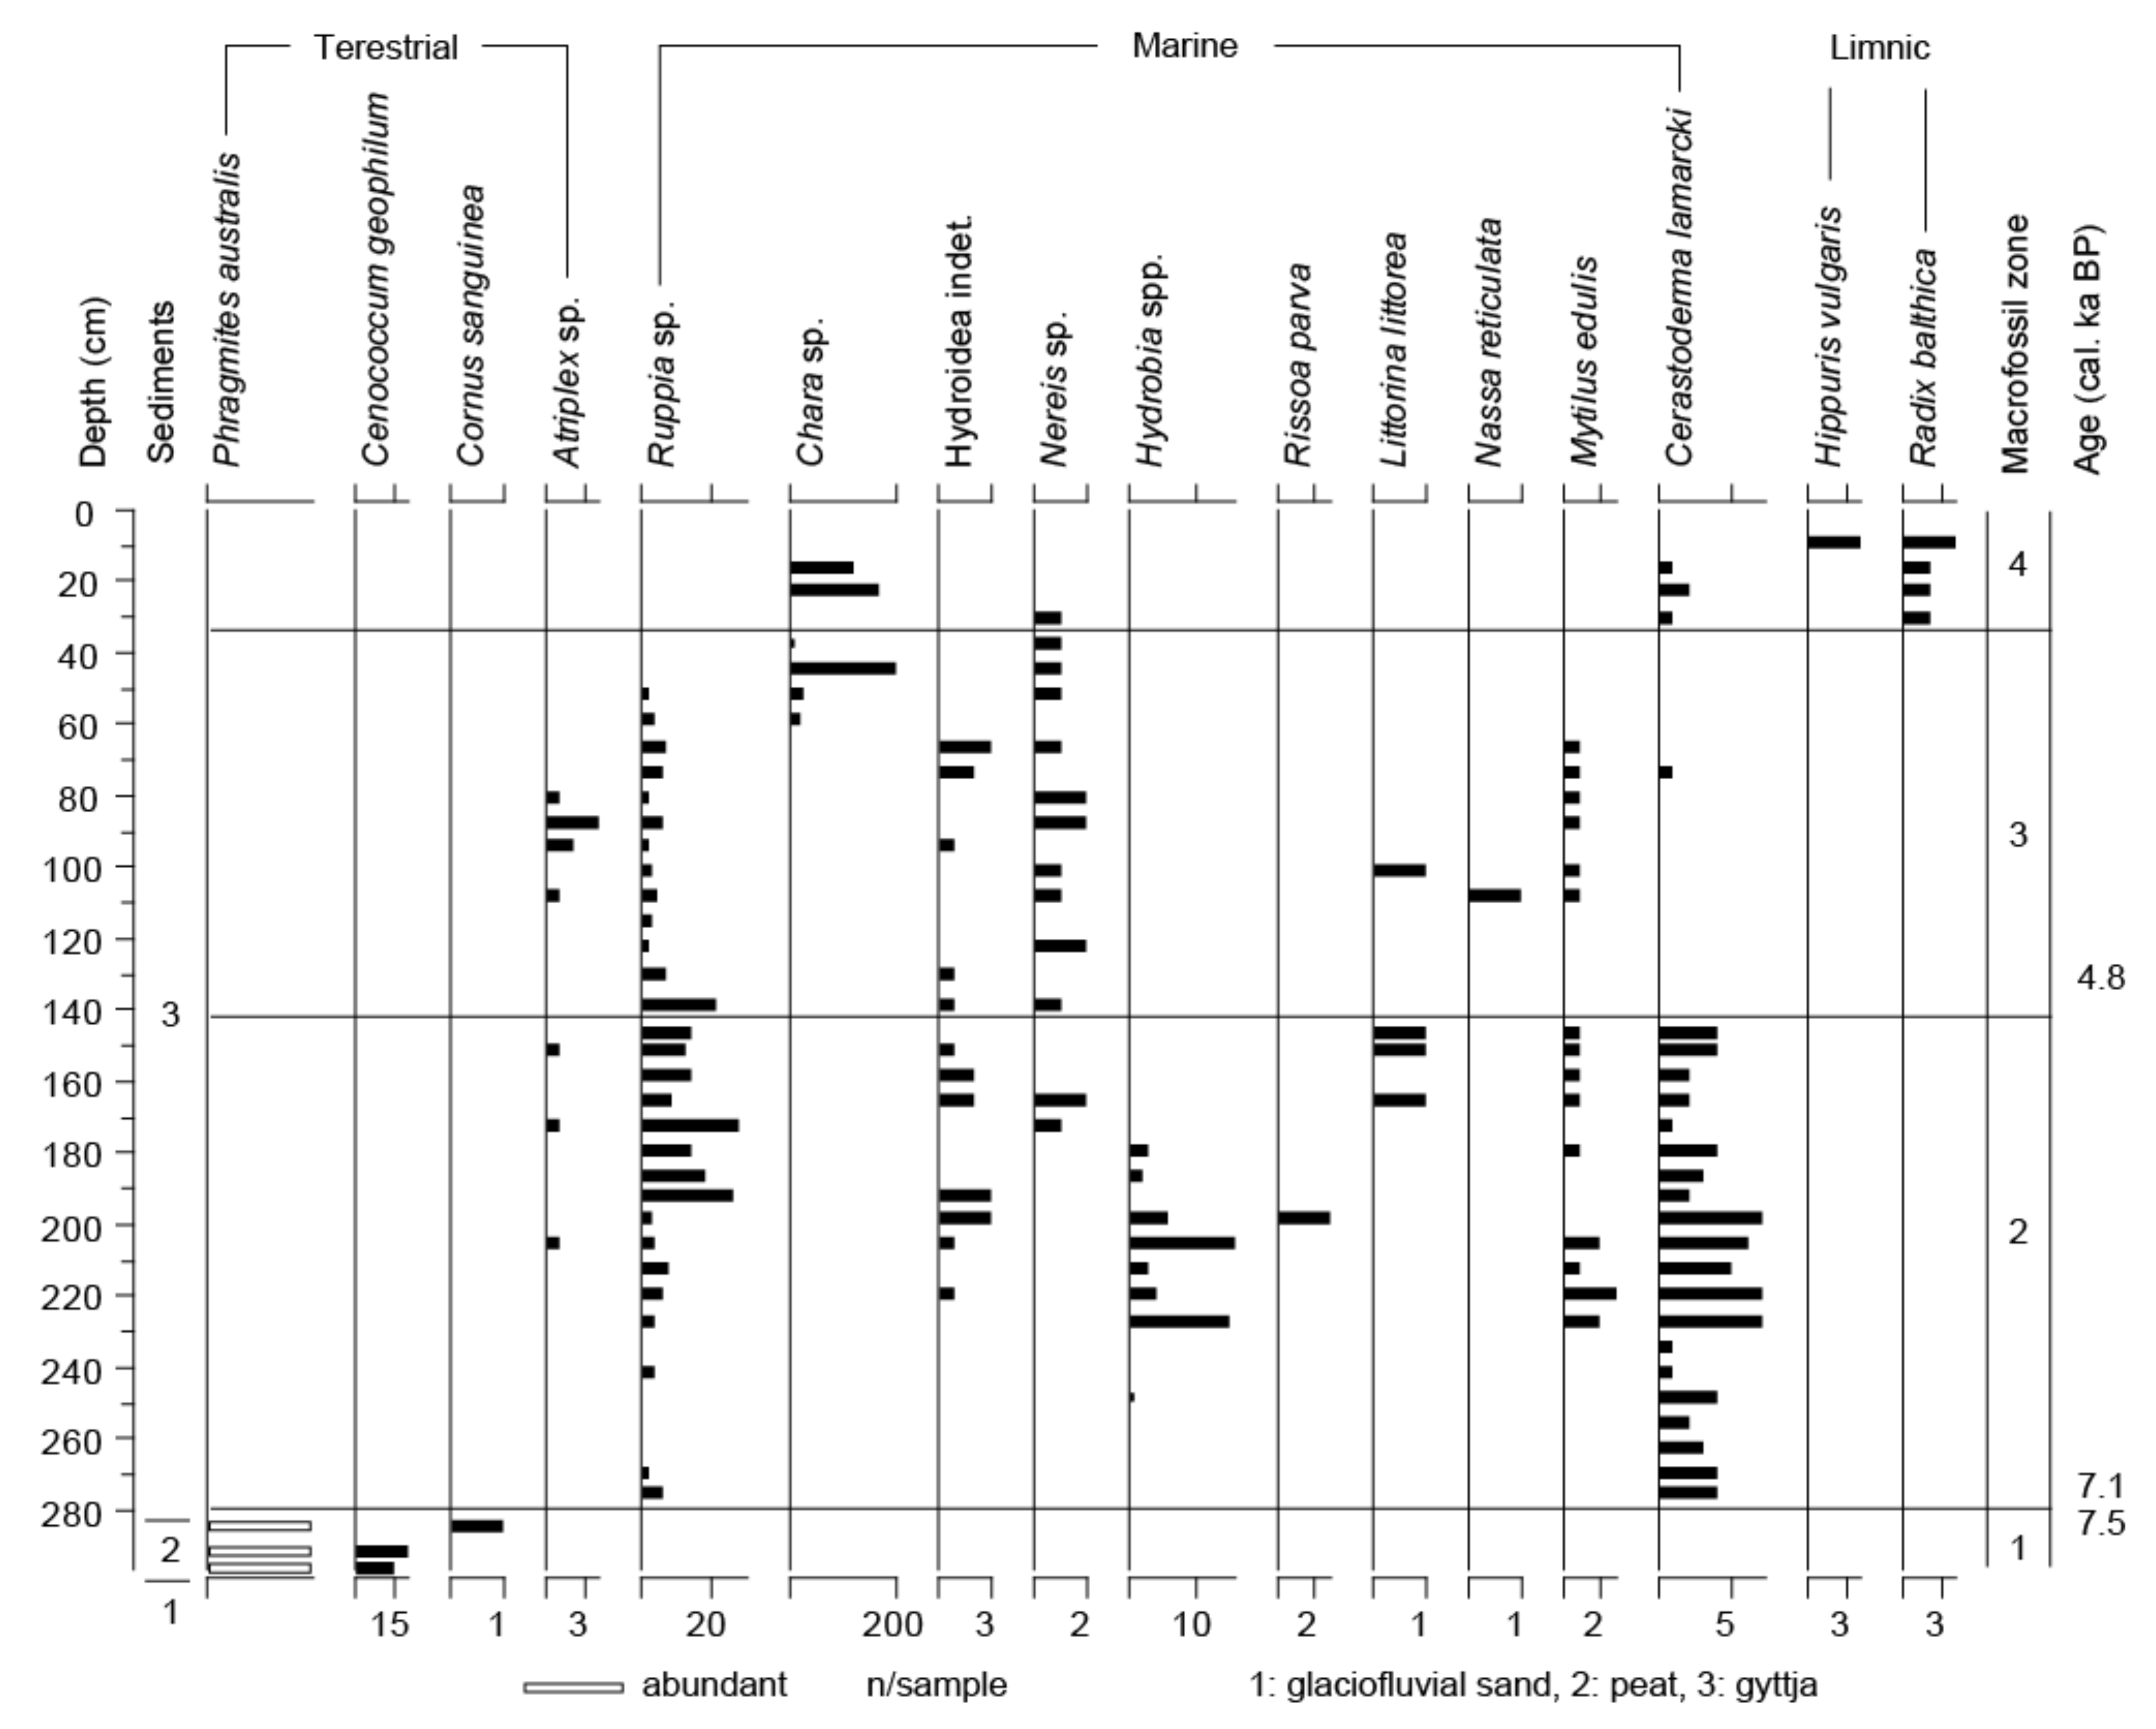
3.4. Onshore Cores
4. Discussion
4.1. Summary of the Geological Evolution
4.2. Reconstructing Relative Sea-Level History
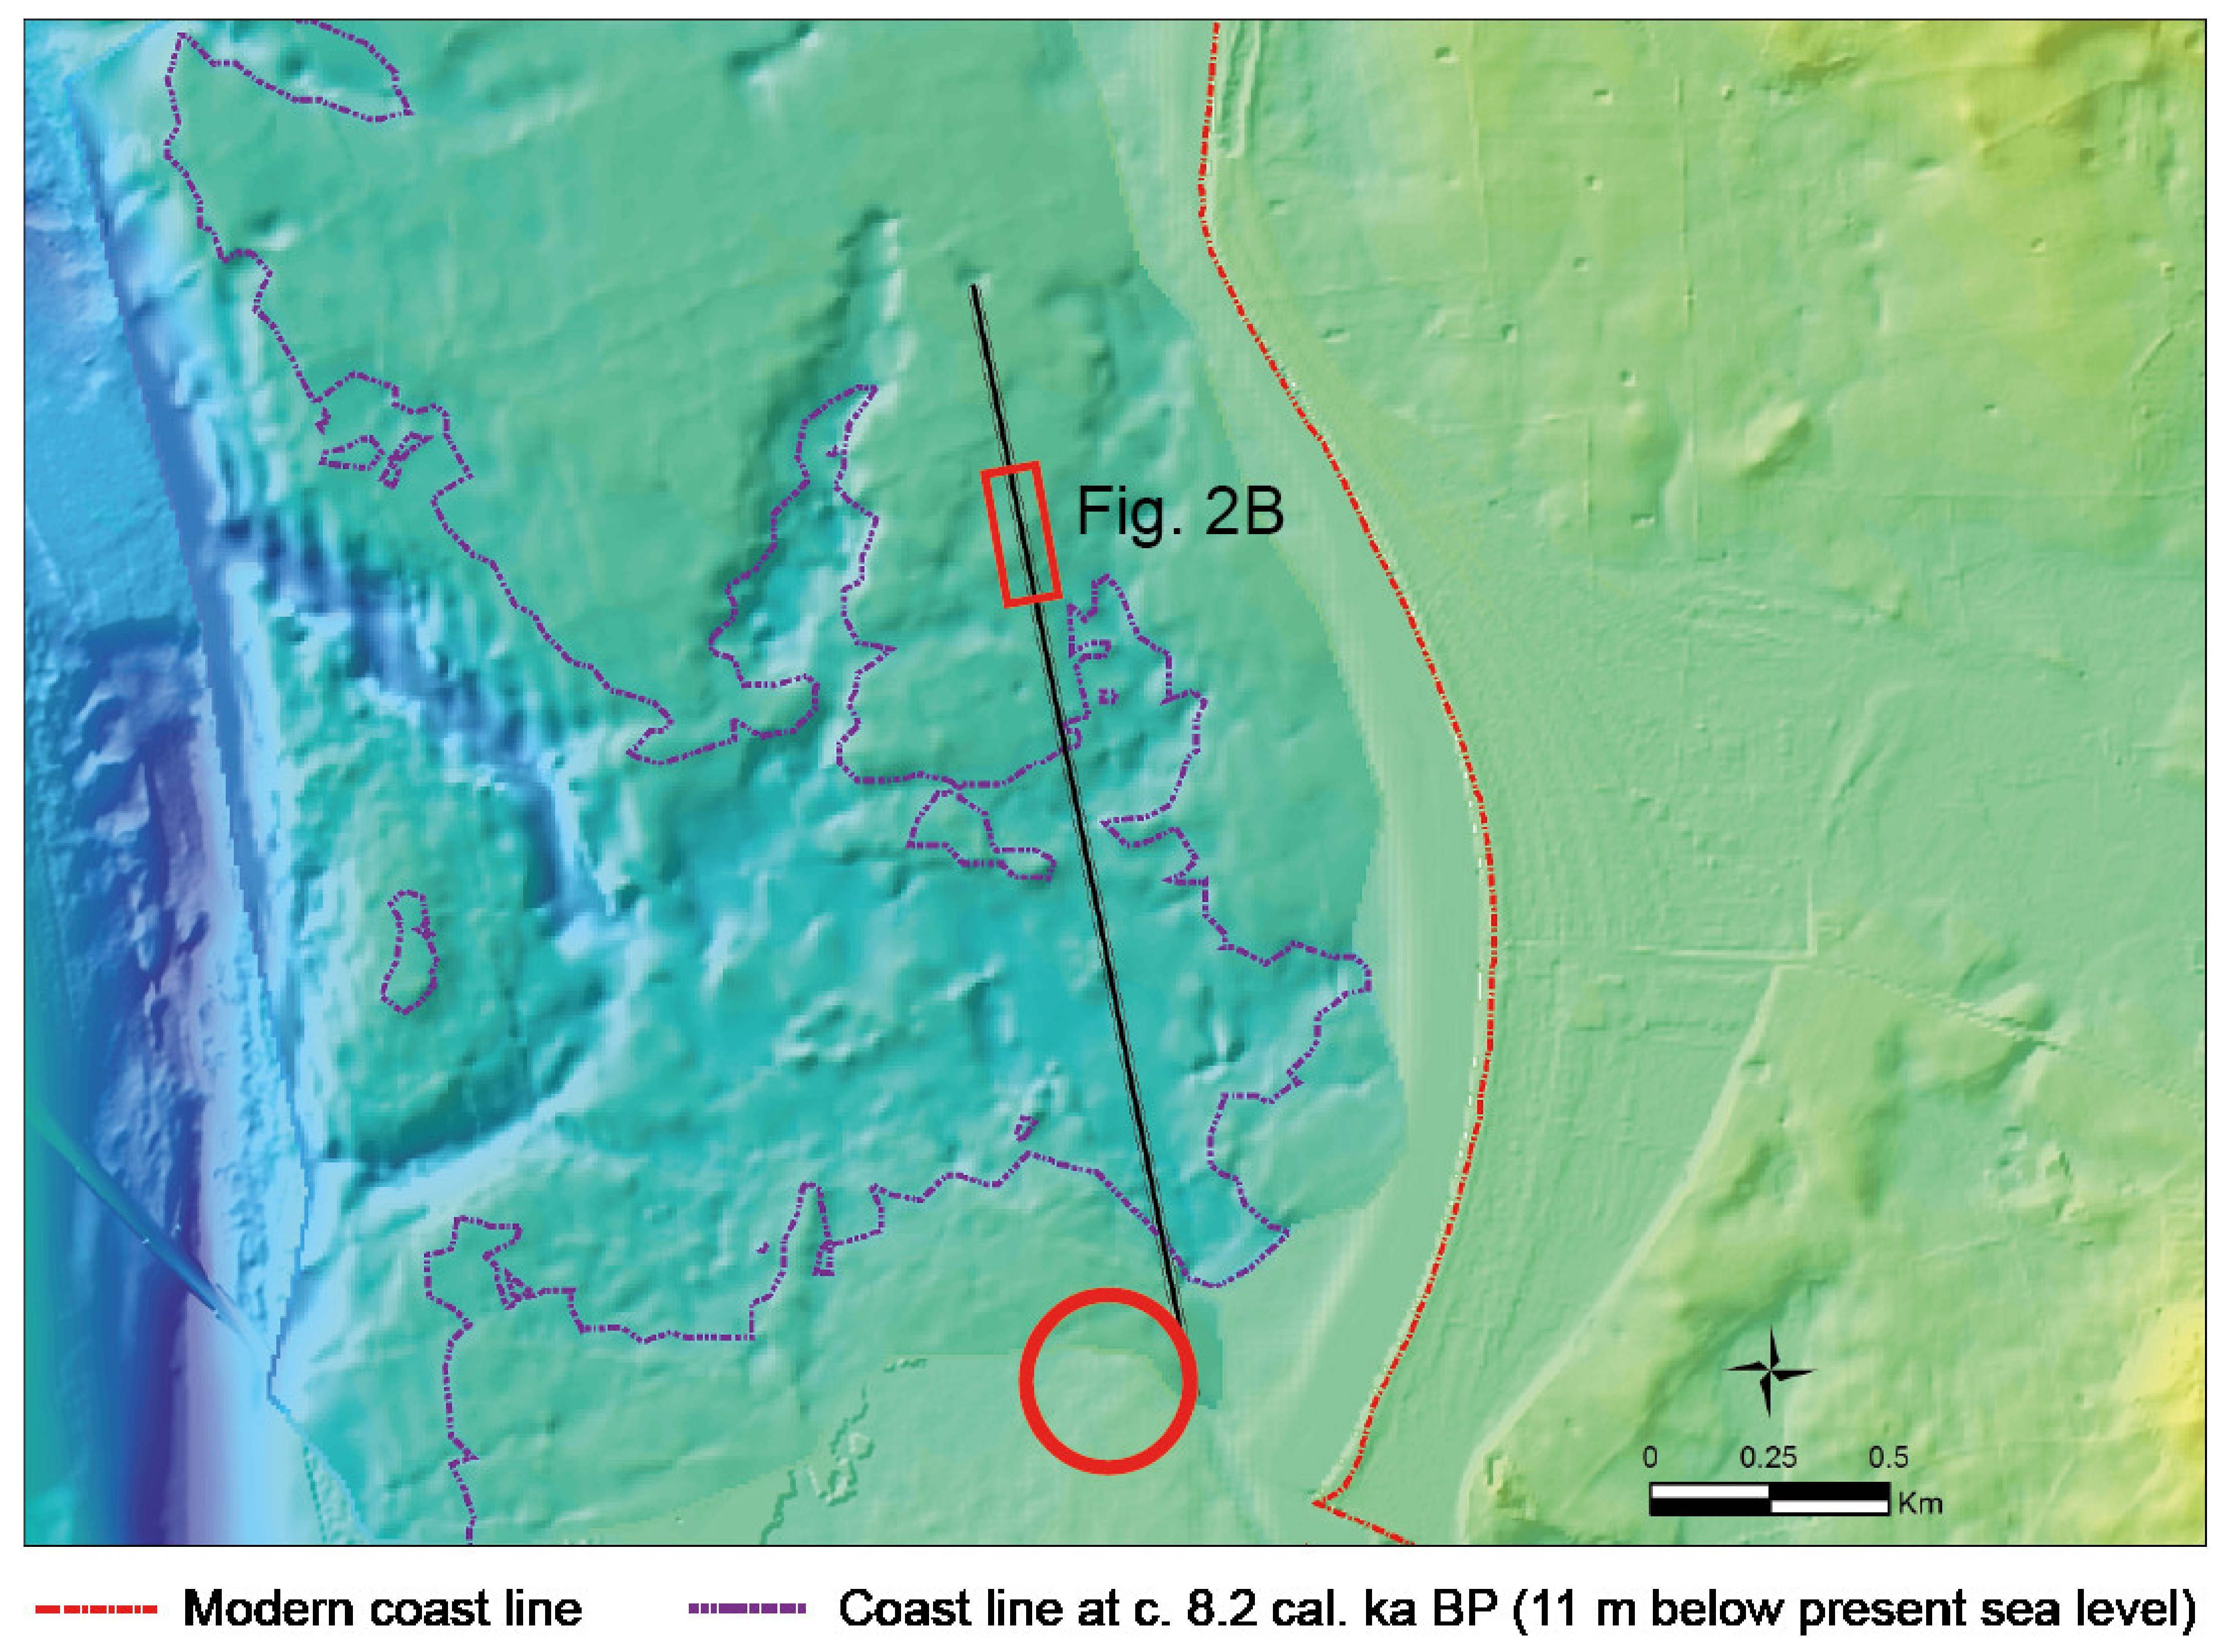
4.3. Generation of Geoarchaeological Paleogeographical Maps
4.4. Geoarchaeological Paleogeographical Scenario 8 M below Present Sea Level (~8 Cal. Ka BP)
4.5. Geoarchaeological Paleogeographical Scenario 4 M below Present Sea Level (~7.7 Cal. Ka BP)
4.6. Geoarchaeological Paleogeographical Scenario 2 M below Present Sea Level (~7.4 Cal. Ka BP and Possibly ~6.8 Cal. Ka BP)
4.7. Geoarchaeological Paleogeographical Scenario 1 M above Present Sea Level (~5.2 Cal. Ka BP)
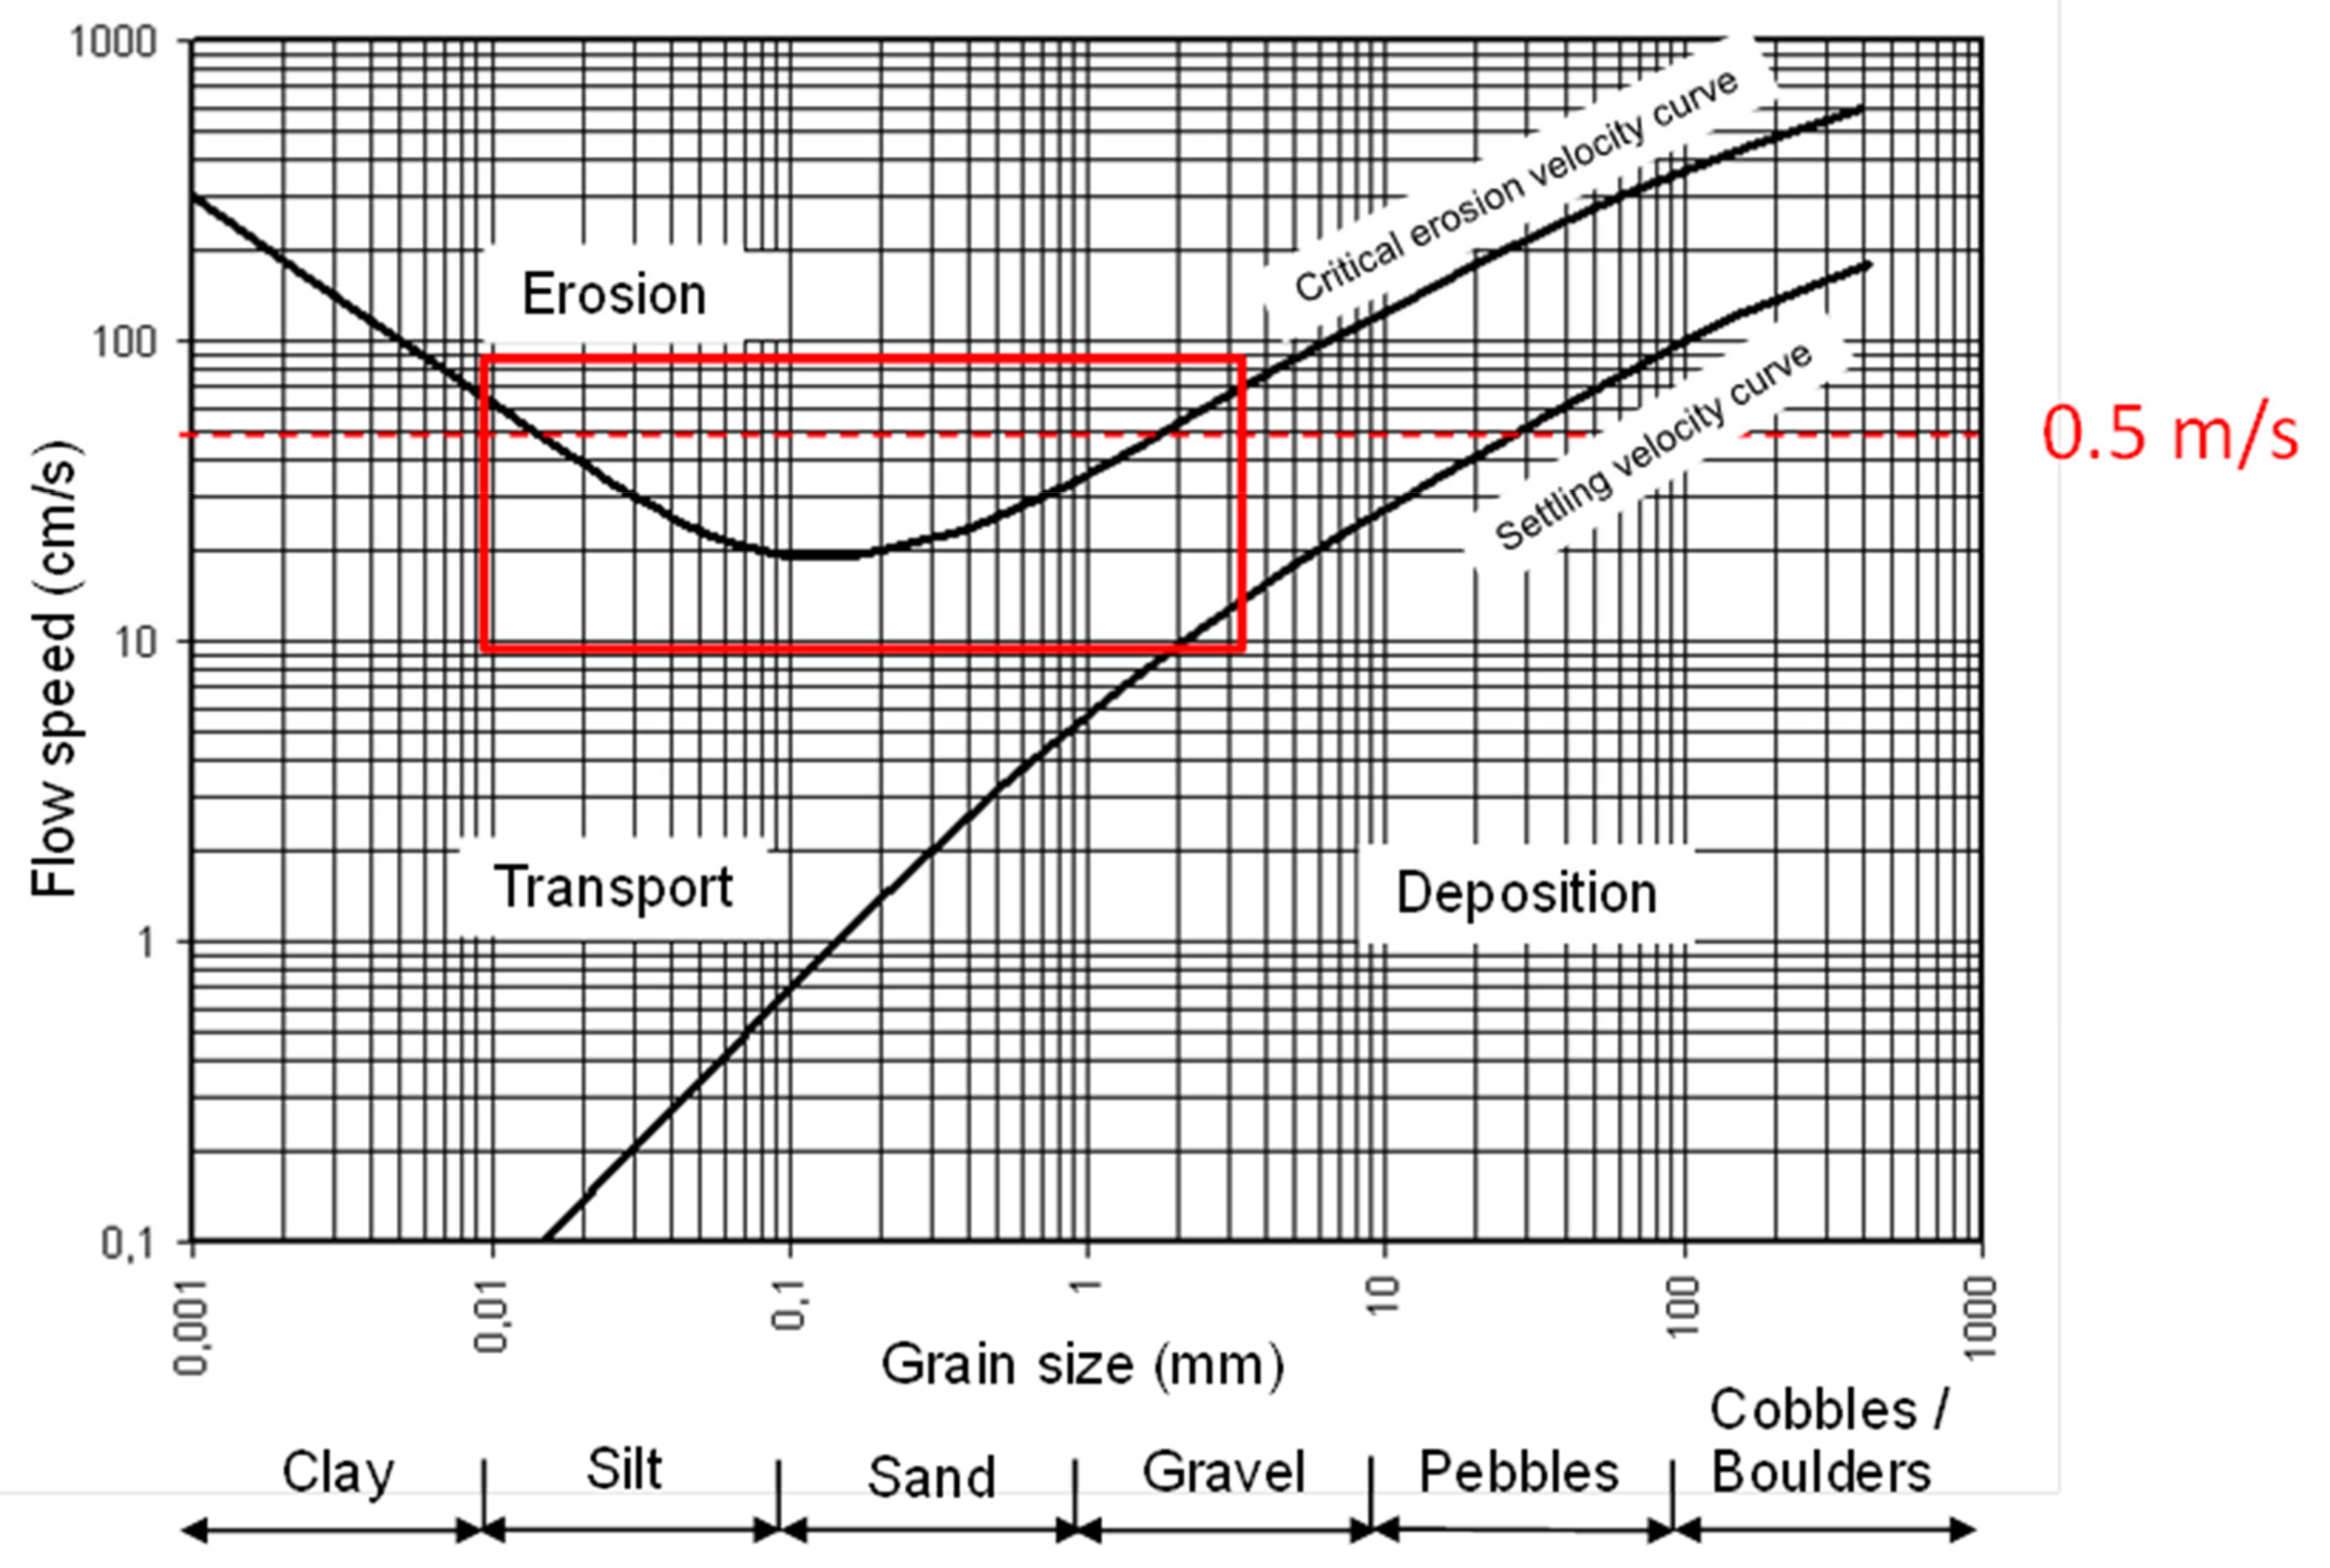
4.8. Assessing the Preservation Potential of Sites
5. Conclusions
Author Contributions
Funding
Institutional Review Board Statement
Informed Consent Statement
Acknowledgments
Conflicts of Interest
References
- Andersen, S.H. Shell middens (“Køkkenmøddinger”) in Danish Prehistory as a reflection of the marine environment. In Shell Middens in Atlantic Europe; Milner, N., Craig, O.E., Bailey, G.N., Eds.; Oxbow Books: Barnsley, UK, 2007; pp. 31–45. [Google Scholar]
- Benjamin, J. Submerged prehistoric landscapes and underwater site discovery: Reevaluating the ‘Danish model’ for international practice. J. Isl. Coast. Archaeol. 2010, 5, 253–270. [Google Scholar] [CrossRef]
- Bennike, O.; Jensen, J.B. Postglacial relative shore level changes in Lillebælt, Denmark. Geol. Surv. Den. Greenl. Bull. 2011, 23, 37–40. [Google Scholar] [CrossRef] [Green Version]
- Bennike, O.; Jensen, J.B.; Lemke, W.; Kuijpers, A.; Lomholt, S. Late and postglacial history of the Great Belt, Denmark. Boreas 2004, 33, 18–33. [Google Scholar] [CrossRef]
- Bennike, O.; Nørgaard-Pedersen, N.; Jensen, J.B. The channels in Storebælt, Denmark: Implications of new radiocarbon ages. Geol. Surv. Den. Greenl. Bull. 2019, 43, e2019430106. [Google Scholar] [CrossRef] [Green Version]
- Bierkens, P.M.F.; Finke, P.A.; Willigen, P.D. Upscaling and Downscaling Methods for Environmental Research; Kluwer Academic: Dordrecht, The Netherlands, 2000; pp. 354–355. [Google Scholar]
- Christensen, C. Kystbesættelse og Havniveauændringer i Stenalderen. In Danmarks Jægerstenalder–Status og Perspektiver; Jensen, O.L., Sørensen, S.A., Hansen, K.M., Eds.; Hørsholm Egns Museum: Hørsholm, Denmark, 2001; pp. 183–193. [Google Scholar]
- Christensen, C.; Fischer, A.; Mathiassen, D.R. Den Store havstigning i Storebælt. In The Danish Storebælt Since the Ice Age-Man, Sea and Forest; Pedersen, L., Fischer, A., Aaby, B., Eds.; A/S Storebæltsforbindelsen: Copenhagen, Denmark, 1997; pp. 45–54, 323–324. [Google Scholar]
- Danish Hydraulic Institute (DHI). Effekt af næringssaltsreduktioner på miljøtilstanden i Karrebæk Fjord, Dybsø Fjord og Smålandsfarvandet, modelopsætning og scenarier. In DHI Rapport for Landbrug og Fødevarer 05-2011; Danish Hydraulic Institute (DHI): Hørsholm, Denmark, 2011. [Google Scholar]
- Danish Hydraulic Institute (DHI). MIKE 21 and MIKE 3 FLOW MODEL FM. Hydrodynamic and Transport. Module, Scientific Documentation; Danish Hydraulic Institute (DHI): Hørsholm, Denmark, 2012. [Google Scholar]
- Danish Museums Law. LBKnr 358 af 08.04.2014. The Danish Ministry of Culture, Copenhagen Denmark. 2014. Available online: https://www.retsinformation.dk/api/pdf/162504 (accessed on 7 December 2021).
- FEHY. Fehmarnbelt Fixed Link. Marine Water–Impact Assessment. Hydrography of the Fehmarnbelt Area; DHI/IOW Consortium in association with LICengineering, Bolding and Burchard and Risø DTU. E1TR0058; Femern A/S: Copenhagen, Denmark, 2013; Volume II. [Google Scholar]
- Fischer, A. Stenalderbopladser På Bunden af Smålandsfarvandet. En Teori Afprøvet Ved Dykkerbesigtigelse [Stone Age settlements in the Småland Bight. A Theory Tested by Diving].; Skov- og Naturstyrelsen: Hørsholm, Denmark, 1993. [Google Scholar]
- Fischer, A. An entrance to the Mesolithic world below the ocean. Status of ten years’work on the Danish sea floor. In Man and Sea in the Mesolithic; Fischer, A., Ed.; Oxbow: Oxford, UK, 1995; pp. 371–384. [Google Scholar]
- Fischer, A. People and the sea-settlement and fishing along the Mesolithic coasts. In The Danish Storebælt Since the Ice Age-Man, Sea and Forest; Pedersen, L., Fischer, A., Aaby, B., Eds.; Oxbow: Oxford, UK, 1997; pp. 63–77. [Google Scholar]
- Fischer, A. Coastal fishing in Stone Age Denmark—Evidence from below and above the present sea-level and from the bones of human beings. In Shell Middens and Coastal Resources along the Atlantic Facade, Held in York September 2005; Milner, N., Craig, O.E., Bailey, G.N., Eds.; Oxbow: Oxford, UK, 2007; pp. 54–69. [Google Scholar]
- Gregory, D. In situ preservation of marine archaeological sites: Out of sight but not out of mind. In In Situ Conservation of Cultural Heritage: Public, Professionals and Preservation; Richards, V., Mckinnon, J., Eds.; Flinders University: Adelaide, SA, Australia, 2019; pp. 1–16. [Google Scholar]
- Gregory, D.; Manders, M. (Eds.) Best Practices for Locating, Surveying, Assessing, Monitoring and Preserving Underwater Archaeological Sites, SASMAP Guideline Manual 2. 2016. Available online: http://sasmap.eu/fileadmin/user_upload/temasites/sas_map/pdf/SASMAP_guideline_02_LR.pdf (accessed on 7 December 2021).
- Grøn, O. Some problems with modelling the positions of prehistoric hunter-gatherer settlements on the basis of landscape topography. J. Archaeol. Sci. Rep. 2018, 20, 192–199. [Google Scholar] [CrossRef]
- Heaton, J.T.; Köhler, P.; Butzin, M.; Bard, E.; Reimer, R.W.; Austin, W.E.N.; Ramsey, C.B.; Hughen, K.A.; Kromer, B.; Reimer, P.J.; et al. Marine20–the marine radiocarbon age calibration curve (0–55,000 cal BP). Radiocarbon 2020, 62, 779–820. [Google Scholar] [CrossRef]
- Hjulström, F. Studies of the morphological activity of rivers as illustrated by the River Fyris. Bull. Geol. Inst. Univ. Uppsalsa 1935, 25, 221–527. [Google Scholar]
- Houmark-Nielsen, M.; Linge, H.; Fabel, D.; Schnabel, C.; Xue, S.; Wilcken, K.M.; Binnie, S. Cosmogenic surface exposure dating the last deglaciation in Denmark: Discrepancies with independent age constraints suggest delayed periglacial landform stabilisation. Quat. Geochronol. 2012, 13, 1–17. [Google Scholar] [CrossRef]
- ICOMOS. 1996. Available online: http://www.international.icomos.org/charters/underwater_e.pdf (accessed on 19 May 2021).
- Jowsey, P.C. An improved peat sampler. New Phytol. 1996, 65, 245–248. [Google Scholar] [CrossRef]
- Krause-Jensen, D.; Serrano, O.; Apostolaki, E.T.; Gregory, D.J.; Quesada, C.M.D. Seagrass sedimentary deposits as security vaults and time capsules of the human past. Ambio 2019, 48, 325–335. [Google Scholar] [CrossRef] [PubMed] [Green Version]
- Kulturarvsstyrelsen. Kulturarv en Værdifuld Ressource for Kommernes Udvikling; Kulturarvsstyrelsen and Realdania: Copenhagen, Denmark, 2005. [Google Scholar]
- Lotz, P. Tudse Hage—An underwater settlement on Sjælland. Marit. Archaeol. Newsl. Rosk. Den. 2000, 14, 8–13. [Google Scholar]
- Lotz, P. Træ og træredskaber fra Tudse Hage. Fund Fortid 2011, 3, 4–8. [Google Scholar]
- Lotz, P. Stenalderredskaber af træ fra Tudse Hage del 3. Fund Fortid 2012, 1, 8–11. [Google Scholar]
- Lotz, P. Tudse Hage–Bopladsen. Redskaber og Affald af Hjortetak, Knogle og Tand, Unpublished report. 2016; p. 16.
- Mertz, L. Oversigt over de sen- og postglaciale niveauforandringer i Danmark. Dan. Geol. Undersøgelse II. Række 2016, 41, 50. [Google Scholar] [CrossRef]
- Missiaen, T.; Evangelinos, D.; Claerhout, C.; de Clercq, M.; Pieters, M.; Demerre, I. Archaeological prospection of the nearshore and intertidal area using ultra-high resolution marine acoustic techniques: Results from a test study on the Belgian coast at Ostend-Raversijde. Geoarchaeology 2018, 33, 386–400. [Google Scholar] [CrossRef]
- Olsen, J.P.; Rasmussen, P.; Heinemeier, J. Holocene temporal and spatial variation in the radiocarbon reservoir age of three Danish fjords. Boreas 2009, 38, 458–470. [Google Scholar] [CrossRef]
- Reimer, P.J.; Austin, W.E.; Bard, E.; Bayliss, A.; Blackwell, P.G.; Ramsey, C.B.; Butzin, M.; Cheng, H.; Edwards, R.L.; Friedrich, M.; et al. The IntCal20 Northern Hemisphere radiocarbon age calibration curve (0–55 cal kB). Radiocarbon 2020, 62, 725–757. [Google Scholar] [CrossRef]
- Soulsby, R.L.; Clarke, S. Bed shear-stress under combined waves and currents on smooth and rough beds. In Internal Report TR 137; HR Wallingford: Manchester, UK, 2005; p. 52. [Google Scholar]
- Stuiver, M.; Polach, H.A. Discussion of reporting 14C data. Radiocarbon 1977, 19, 355–363. [Google Scholar] [CrossRef] [Green Version]
- UNESCO Convention on the Protection of the Underwater Cultural Heritage. Available online: http://unesdoc.unesco.org/images/0012/001246/124687e.pdf#page=56 (accessed on 19 May 2021).
- Valetta Treaty, Council of Europe. 1992. Available online: https://www.coe.int/en/web/conventions/full-list/-/conventions/treaty/143 (accessed on 19 May 2021).


| Core | Latitude N | Longitude E | Water Depth (cm) | Elevation (cm) |
|---|---|---|---|---|
| Onshore | ||||
| Rus 10 | 55°15.701′ | 11°15.867′ | 24 | |
| Rus 11 | 55°15.735′ | 11°15.704′ | 19 | |
| Offshore | ||||
| Rus 3 | 55°15.484′ | 11°14.187′ | 630 | |
| SK 1 | 55°15.314′ | 11°13.956′ | 500 | |
| SK 2 | 55°15.295′ | 11°13.982′ | 450 | |
| SK 3 | 55°16.119′ | 11°14.091′ | 450 | |
| SK 4 | 55°16.170′ | 11°14.074′ | 370 | |
| SK 5 | 55°16.138′ | 11°14.082′ | 430 | |
| SK 6 | 55°16.088′ | 11°14.102′ | 550 | |
| TH2 | ~55°15′ | ~11°14.175′ |
Publisher’s Note: MDPI stays neutral with regard to jurisdictional claims in published maps and institutional affiliations. |
© 2021 by the authors. Licensee MDPI, Basel, Switzerland. This article is an open access article distributed under the terms and conditions of the Creative Commons Attribution (CC BY) license (https://creativecommons.org/licenses/by/4.0/).
Share and Cite
Gregory, D.J.; Bennike, O.; Jensen, J.B.; Rasmussen, P.; Al-Hamdani, Z. Development of Predictive Geoarchaeological Models to Locate and Assess the Preservation Potential of Submerged Prehistoric Sites Using Remote Sensing, Palaeoenvironmental Analysis, and GIS. Heritage 2021, 4, 4678-4699. https://0-doi-org.brum.beds.ac.uk/10.3390/heritage4040258
Gregory DJ, Bennike O, Jensen JB, Rasmussen P, Al-Hamdani Z. Development of Predictive Geoarchaeological Models to Locate and Assess the Preservation Potential of Submerged Prehistoric Sites Using Remote Sensing, Palaeoenvironmental Analysis, and GIS. Heritage. 2021; 4(4):4678-4699. https://0-doi-org.brum.beds.ac.uk/10.3390/heritage4040258
Chicago/Turabian StyleGregory, David John, Ole Bennike, Jørn Bo Jensen, Peter Rasmussen, and Zyad Al-Hamdani. 2021. "Development of Predictive Geoarchaeological Models to Locate and Assess the Preservation Potential of Submerged Prehistoric Sites Using Remote Sensing, Palaeoenvironmental Analysis, and GIS" Heritage 4, no. 4: 4678-4699. https://0-doi-org.brum.beds.ac.uk/10.3390/heritage4040258