
Genetic Diversity and Population Differentiation of Pinus koraiensis in China


1
State Key Laboratory of Tree Genetics and Breeding, School of Forestry, Northeast Forestry University, Harbin 150040, China
2
Southern Swedish Forest Research Centre, Swedish University of Agricultural Sciences, SE-230 53 Alnarp, Sweden
*
Author to whom correspondence should be addressed.
Horticulturae 2021, 7(5), 104; https://0-doi-org.brum.beds.ac.uk/10.3390/horticulturae7050104
Submission received: 6 April 2021
/
Revised: 30 April 2021
/
Accepted: 6 May 2021
/
Published: 9 May 2021
(This article belongs to the Special Issue Neglected and Underutilized Plant Species in Horticultural and Ornamental Systems: Perspectives for Biodiversity, Nutraceuticals and Agricultural Sustainability)
Abstract
:Pinus koraiensis is a well-known precious tree species in East Asia with high economic, ornamental and ecological value. More than fifty percent of the P. koraiensis forests in the world are distributed in northeast China, a region with abundant germplasm resources. However, these natural P. koraiensis sources are in danger of genetic erosion caused by continuous climate changes, natural disturbances such as wildfire and frequent human activity. Little work has been conducted on the population genetic structure and genetic differentiation of P. koraiensis in China because of the lack of genetic information. In this study, 480 P. koraiensis individuals from 16 natural populations were sampled and genotyped. Fifteen polymorphic expressed sequence tag-simple sequence repeat (EST-SSR) markers were used to evaluate genetic diversity, population structure and differentiation in P. koraiensis. Analysis of molecular variance (AMOVA) of the EST-SSR marker data showed that 33% of the total genetic variation was among populations and 67% was within populations. A high level of genetic diversity was found across the P. koraiensis populations, and the highest levels of genetic diversity were found in HH, ZH, LS and TL populations. Moreover, pairwise Fst values revealed significant genetic differentiation among populations (mean Fst = 0.177). According to the results of the STRUCTURE and Neighbor-joining (NJ) tree analyses and principal component analysis (PCA), the studied geographical populations cluster into two genetic clusters: cluster 1 from Xiaoxinganling Mountains and cluster 2 from Changbaishan Mountains. These results are consistent with the geographical distributions of the populations. The results provide new genetic information for future genome-wide association studies (GWAS), marker-assisted selection (MAS) and genomic selection (GS) in natural P. koraiensis breeding programs and can aid the development of conservation and management strategies for this valuable conifer species.
1. Introduction
Pinus koraiensis (Sieb. et Zucc), commonly known as Korean pine, is a perennial evergreen tree in the Pinaceae family with five needles per fascicle [1,2,3]. It is an ancient and valued forest tree in East Asia, and natural forests of this species have undergone long-term succession and are described as tertiary forest [4]. Compared with other Pinus species, P. koraiensis is long-lived and is a dominant species in mixed conifer and broadleaved forest [5,6]. Currently, P. koraiensis is distributed mainly in cool-temperate regions in northeast China, the Russian Far East, the Korea peninsula (note that information is not available from North Korea due to limited access) and Honshu, Japan. It typically occurs in mild regions with more than 70% humidity and at altitudes from 600 m to 1500 m [7,8]. However, in China, it only grows from the Changbai Mountains to Xiaoxinganling Mountains in northeast China, mainly on slopes and rolling hills and in river valleys [9]. Nearly half of the germplasm resources of P. koraiensis in the world are found in Xiaoxinganling Mountains in Yichun city, China, where the largest and most undisturbed primeval forest remaining in Asia and a natural climax community of P. koraiensis exists [10].
P. koraiensis has high economic, ornamental and ecological values in East Asia. Timber of P. koraiensis is widely used for architecture, bridges, furniture and ships because of the light, soft, fine structure and straight texture of the wood and its strong corrosion resistance [11]. Furthermore, it produces edible nuts that are nutritious and distinctly flavored, containing abundant unsaturated fatty acids, vitamins and minerals [12]. It also has high medicinal value, able to lower cholesterol levels and allay ultraviolet injury and tiredness [13]. Natural P. koraiensis forest absorbs large amounts of carbon dioxide and contributes to climate change regulation [14]. Therefore, it is a prominent conifer tree species of great value for the maintenance and protection of the environment in East Asia.
Genetic improvement of P. koraiensis began in the 1960s, which then developed slowly due to a lack of systematic breeding strategies and objectives [8]. In the early stages of selective breeding, large numbers of superior trees or natural populations were selected from natural forest to establish primary seed orchards, mainly through phenotype selection [15,16,17]. Earlier studies have mainly focused on propagation technology [18], provenance division [19], progeny determination [20] and selection of improved varieties [21], while studies of molecular plant breeding, including studies of genetic diversity, genomic selection and construction of genetic maps, are lacking [22]. Existing natural forests of this species have great significance for the conservation of breeding materials, the development of gene resources and the study of population genetic diversity [23]. However, in the past few decades, with the increasing demand for wood and cones of P. koraiensis as well as increasing wildfire, the area of natural P. koraiensis forest has decreased extensively [24]. Thus, to protect existing natural forests under the background of illegal logging and unpredictable biotic stress, such as white pine blister rust diseases, the collection and evaluation of germplasm resources of P. koraiensis are urgently needed.
Genetic diversity and population structure are key parameters of population genetics research. Analyses of genetic variation among and within populations can guide the formulation of conservation strategies. The use of molecular markers identified from whole-genome, chloroplast genome and transcriptome analysis is a primary method of revealing genetic diversity and population structure. Many DNA molecular markers are codominant and highly polymorphic, and many have been identified in the genome and transcriptome, unlike morphological and biochemical markers [25,26,27]. Simple sequence repeats (SSRs) are considered powerful and advantageous molecular tools due to their low cost, easy detection by polymerase chain reaction (PCR), high polymorphism, and codominance. Thus, they can be used for genetic diversity analysis, genome-wide association analysis, core collections and genetic linkage map construction in many plants and animals [28,29,30]. Furthermore, multiple EST-SSR markers can easily be developed from microsatellite loci of public transcriptome data. At present, there are few reports of analyses of genetic diversity in P. koraiensis based on DNA molecular markers; studies to date have employed random amplified polymorphic DNA (RAPD) analysis [31], single primer amplification reaction (SPAR) [32], intersimple sequence repeat (ISSR) analysis [33,34] and expressed sequence tag-simple sequence repeat (EST-SSR) analysis [35]. All these studies have identified high levels of genetic diversity in P. koraiensis, with the greatest levels of genetic differentiation occurring within populations. However, those previous studies focused on a limited number of populations, few molecular markers and population size. Thus, a systematic and comprehensive population genetic study, involving widespread germplasm collection and abundant polymorphic markers developed from high-throughput sequencing, is necessary to study the genetic relationships and diversity of P. koraiensis populations.
In this study, germplasm resources from 480 individuals of 16 natural populations of P. koraiensis were collected within the species’ main distribution area in northeastern China, and analyzed for genetic diversity using 15 EST-SSRs. This study is the first comprehensive study evaluating the genetic diversity and population structure of P. koraiensis in China using large samples and wider distribution as well as a sufficient number of molecular markers. The aims of the study were to (1) investigate genetic variation using polymorphic EST-SSRs, (2) evaluate the genetic diversity and structure of natural populations, (3) conduct a comprehensive, range-wide genetic diversity study of P. koraiensis in China, and (4) propose a protection conservation strategy. The hypothesis of the study was that high genetic diversity could be detected within populations and significant genetic differentiation could exist among populations due to restricted natural distribution of the species and low to moderate degree of gene flow between populations. Thus, the results will provide insights into the conservation of this species and lay a foundation for further studies of marker-assisted selection (MAS) and genomic selection (GS) in P. koraiensis for genetic improvement.
2. Results
2.1. Genetic Diversity at Different Loci among Populations
The genetic diversity analysis was performed on 480 individuals from 16 natural P. koraiensis populations using 15 EST-SSRs markers (Table 1). The allele size ranged from 151 bp at locus NEPK-65 to 301 bp at loci NEPK-168 and NEPK-184. In total, 155 alleles across all 15 loci were detected in the sampled individuals; the number of alleles per locus ranged from 4 (NEPK-67) to 21 (NEPK-145), with a mean value of 10.33. There were 58 private alleles, accounting for 37.42% of the alleles. The number of effective alleles (Ne) ranged from 1.170 at locus NEPK-40 to 6.605 at locus NEPK-145, with an average of 2.514 per locus. The observed (Ho) and expected (He) heterozygosity ranged from 0.008 to 0.984 and from 0.145 to 0.849, respectively, with mean values of 0.374 and 0.521, respectively. The polymorphic information content (PIC) varied from 0.142 (NEPK-40) to 0.833 (NEPK-145), with a mean value of 0.461. Four loci exhibited high polymorphism (PIC > 0.5) and 8 loci exhibited moderate polymorphism (0.2 < PIC < 0.5). In addition, across the 480 samples, all of the loci conformed to Hardy–Weinberg equilibrium. F-statistics were calculated to detect genetic subdivision and revealed moderate inbreeding and the mean value of Fst was 0.347, indicating moderate genetic variation. Regarding gene flow, the number of effective migrants (Nm) value ranged from 0.080 to 17.691 among populations, with an average of 2.667.
2.2. Genetic Diversity within Pinus koraiensis Populations
The levels of genetic diversity in the 16 populations are shown in Table 2. Across the sampled populations, the number of different alleles (Na) varied from 2.667 (HL) to 4.467 (TL), with a mean value of 3.271, and the number of effective alleles (Ne) ranged from 1.586 (Jiaohe) to 2.257 (Linjiang), with a mean value of 1.870. The populations with the highest levels of genetic diversity were Heihe (Ne = 1.939, Ho = 0.340 and He = 0.439), Zhanhe (Ne = 2.009, Ho = 0.356 and He = 0.413), Liangshui (Ne = 1.914, Ho = 0.470 and He = 0.370) and Tieli (Ne = 2.222, Ho = 0.373 and He = 0.414), whereas those with the lowest levels were Jiaohe (Ne = 1.586, Ho = 0.293 and He = 0.275) and Helong (Ne = 1.663, Ho = 0.390 and He = 0.310). The Zhanhe population had not only the highest genetic diversity but also the largest number of private alleles, identifying it as a unique natural P. koraiensis population. The F value ranged from -0.235 to 0.325 among the populations, with a mean value of 0.02, indicating that there existed a deficiency of heterozygosity in the natural P. koraiensis populations.
2.3. Genetic Variation among Pinus koraiensis Populations
To evaluate the genetic variation among the collected samples, AMOVA was performed, and Fst among natural populations, genetic clusters and geographical regions were calculated; the results are shown in Table 3. The AMOVA results indicate that 67% of the total genetic variation existed within populations, indicating high genetic diversity within populations. AMOVA of the two genetic clusters identified by the STRUCTURE analysis indicated that 63.79% of the total variation was attributable to differences within populations, and the overall Fst was 0.362 (Fst > 0.25), indicating high genetic differentiation between the two clusters. In addition, the AMOVA of two groups classified according to geographical location indicated low genetic variation among populations within each group (2.77%). All of these results indicated high genetic differentiation within populations and groups.
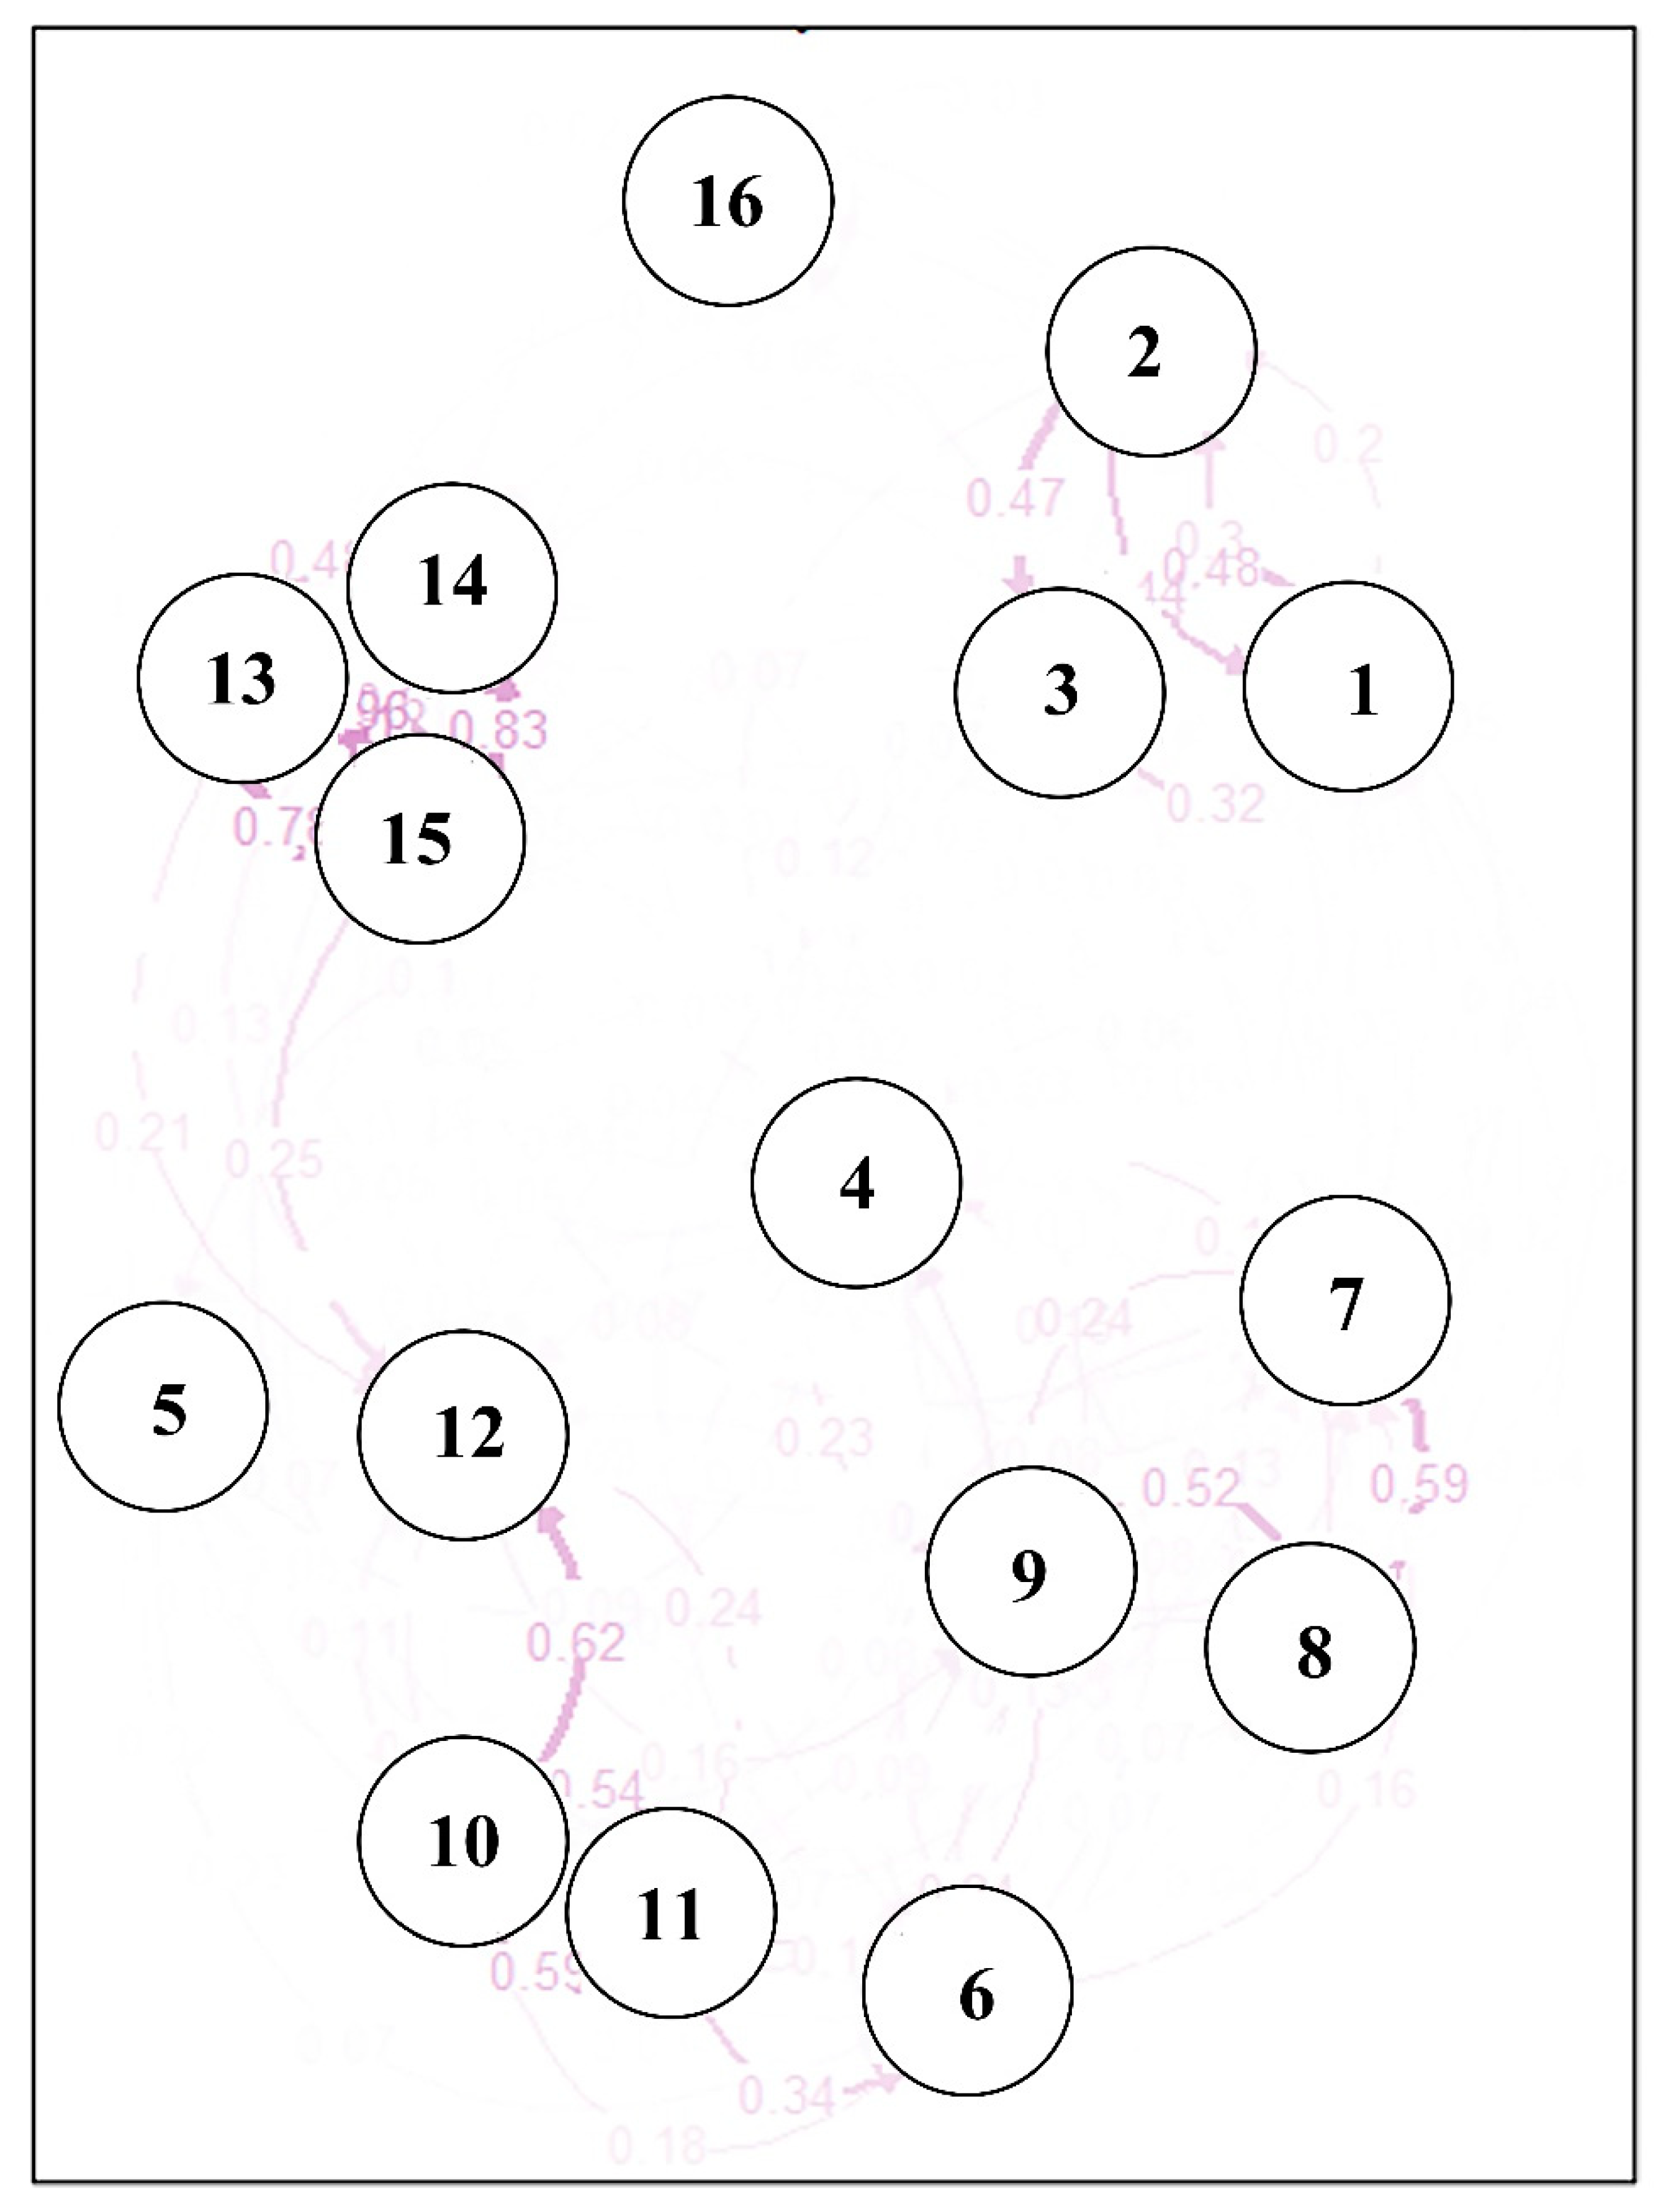
The Nei’s genetic distance and pairwise Fst values are shown in Table 4. Fst was considered the main genetic parameter for evaluating genetic differentiation among populations. In this study, the pairwise Fst values ranged from 0.014 to 0.348, and most of the P. koraiensis population pairs exhibited high values (Fst > 0.15), indicating high levels of genetic diversity. The greatest level of differentiation was observed between populations Helong and Liangshui, and the lowest was observed between Jiaohe and Hulin. The highest genetic distance was observed between populations Helong and Liangshui (0.813), consistent with the pairwise Fst values and indicating pronounced differentiation between these two populations. The relative migration network among the 16 P. koraiensis populations was constructed using relative migration rate with the divMigrate function in R software. Analysis of gene flow between populations suggested a biased geographic distribution, and gene flow was not uniform among all populations (Figure 1). A high degree of gene flow was observed among three populations located near one another (Muling, Maoershan and Fangzheng), consistent with the principal coordinate analysis and dendrogram analysis. In addition, one genetically isolated population (Boli) displayed high levels of gene flow with the three nearby populations Muling, Maoershan and Fangzheng. Moreover, a moderate level of gene flow was found among three admixed populations, and two genetically distinct populations (Zhanhe and Wangqing) exhibited distant segregation from the other populations.
2.4. Population Structure
The population structure analysis of the 16 natural P. koraiensis populations was performed based on a Bayesian approach using STRUCTURE software. The number of clusters within the range of 1 to 10 was evaluated for 10 repetitions in each run. In the structure plot (Figure 2), the maximum delta K value appeared at K = 2, with an obvious peak apparent at this value; this value was considered the optimal genetic cluster number for all EST-SSR markers (Figure 2B,C). The 480 sampled individuals of P. koraiensis were divided into two genetic groups (Group 1 and Group 2) at K = 2: Group 1 comprised 149 individuals from 5 populations (Heihe, Liangshui, Zhanhe, Tieli and Hegang), and Group 2 comprised a higher number of individuals (331) from 11 populations (Liangzihe, Helong, Lushuihe, Linjiang, Jiaohe, Hulin, Boli, Muling, Maoershan, Fangzheng and Wangqing). Group 1 comprised almost all of the P. koraiensis plant materials from Xiaoxinganling Mountains, whereas Group 2 comprised almost all of the individuals from Changbaishan Mountains, suggesting a relationship between genetic structure and geographical distribution of the populations.
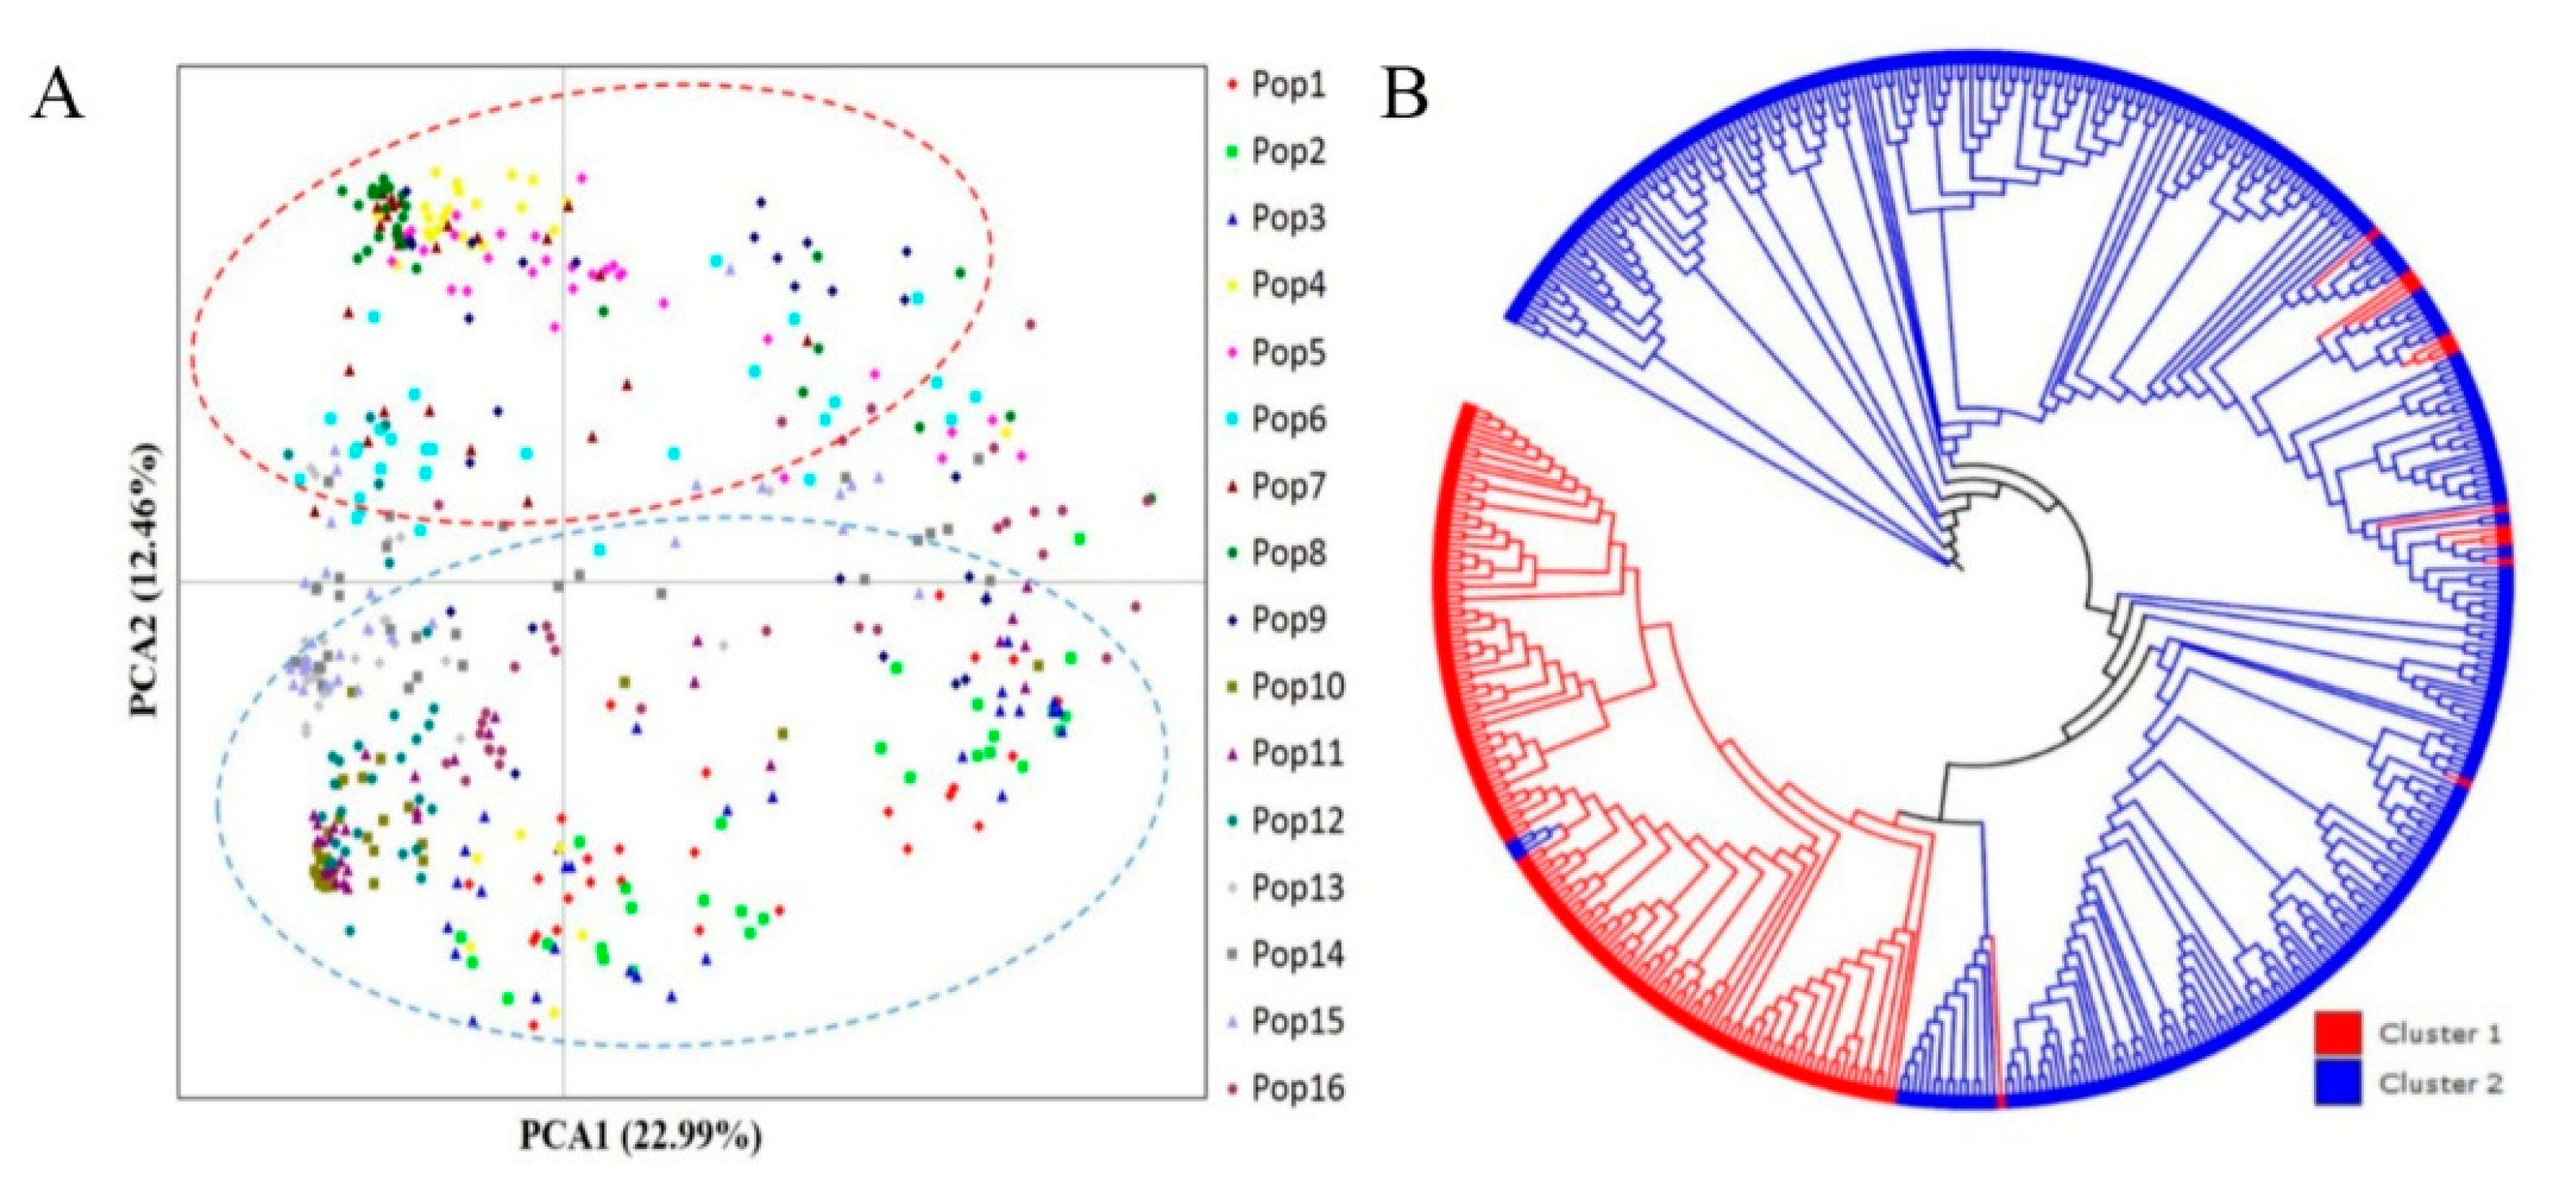
To further analyze cluster patterns, principal component analysis (PCA) based on the pairwise genetic distance matrix of 15 EST-SSRs was performed; the results are shown in Figure 3. The 480 individuals from the 16 populations were roughly divided into two clusters according to the first two axes in the PCA plot. Principal axes 1 and 2 accounted for 22.99% and 12.46%, respectively, of the total genetic variation among the individuals, together accounting for 35.45% of the total genetic variation (Figure 3A). Five populations (Heihe, Liangshui, Zhanhe, Tieli and Hegang) were grouped into cluster 1, and the remaining populations (Liangzihe, Helong, Lushuihe, Linjiang, Jiaohe, Hulin, Boli, Muling, Maoershan, Fangzheng and Wangqing) were grouped into cluster 2. The same clustering was obtained in the STRUCTURE analysis using the same dataset, indicating marked genetic differentiation. Furthermore, the Neighbor-joining (NJ) dendrogram based on Nei’s genetic distance clustered the 480 P. koraiensis individuals from the 16 populations into 2 clusters, consistent with the above results (Figure 3B and Figure 4).
2.5. Correlations between Genetic Distance and Geographic Distance
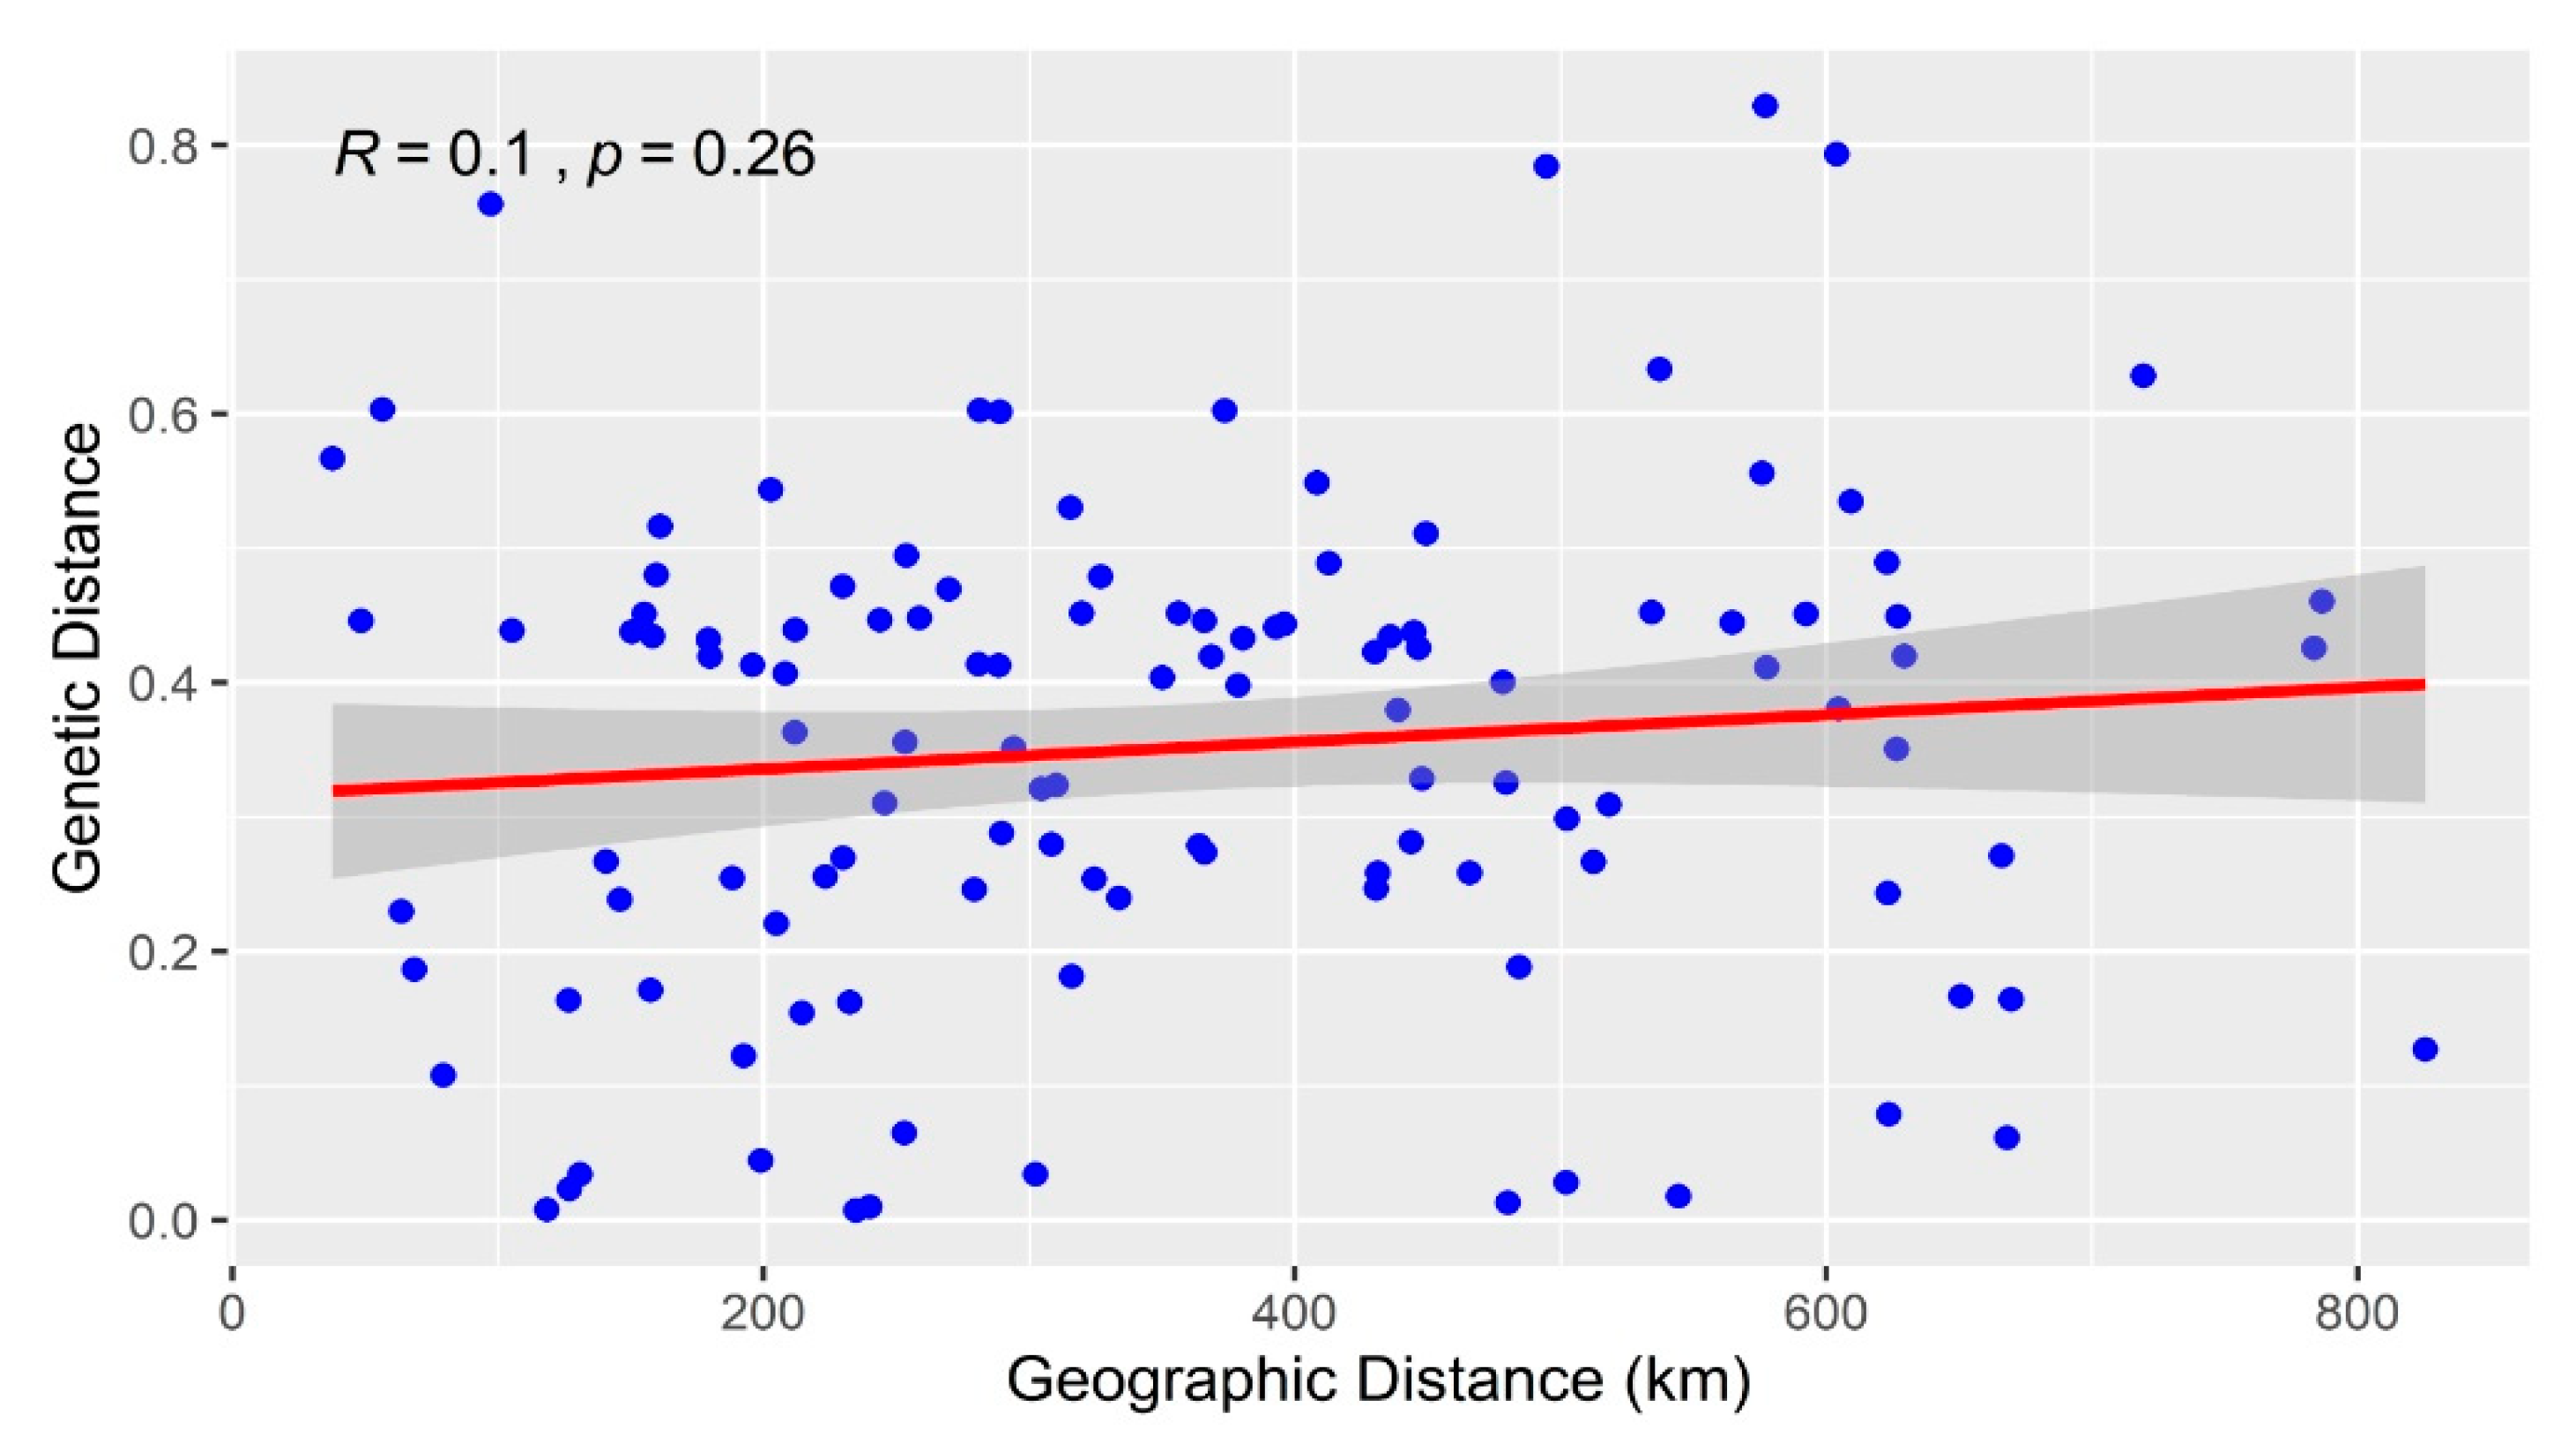
The genetic distance estimated based on molecular markers may be related to the distribution of the species under study and the geographic distance between individuals or populations. In this study, the geographic distance and genetic distance values ranged from 37.72 km to 825.45 km and from 0.02 to 0.83, respectively. To investigate the correlations between genetic distance and geographic distance, the Mantel test was carried out. The results showed that genetic distance was not significantly correlated with the geographic distance among the P. koraiensis populations (p = 0.26, R2 = 0.01), indicating a lack of association between geographical distance and the genetic differentiation of P. koraiensis (Figure 5). Liangzihe and Hegang populations exhibited the lowest geographic distance and were not grouped in the same cluster. Therefore, there was no obvious isolation by genetic and geographical distance among the sampled populations.
3. Discussion
To understand the genetic differentiation of forest tree populations and contribute to the development of effective breeding strategies, comprehensive evaluations of natural germplasm resources of individual species are essential; such evaluations can accelerate breeding strategies and industrial development [36,37]. Naturally, P. koraiensis mainly grows in the cold temperate zone, especially in northeast China, and natural forests of this species have been shown to be sensitive to climate factors. Thus, to conserve genetic resources of this species, it is important to obtain data on its genetic diversity and population structure. In present study, we conducted a population genetic analysis using codominant molecular markers, representing the first such analysis in P. koraiensis. The results can help guide the genetic improvement and resource conservation of this important gymnosperm.
3.1. Genetic Diversity
Genetic diversity has been increasingly evaluated in species lacking a reference genome, including some conifers [38], endemic species [39] and endangered plants [40]. Studies of genetic diversity can provide insight into speciation and genetic variation within and among populations and can aid the development of conservation strategies. However, transcriptome data and molecular markers remain lacking for P. koraiensis; the available genetic data provide few markers suitable for the study of population genetics in this species. Evaluating the germplasm resources of this species represents the first step towards understanding the genetics of natural P. koraiensis populations. A high level of genetic diversity in natural P. koraiensis populations was detected in this study, with mean values of 10.33 and 0.521 for Na and He, respectively. High genetic diversity was observed in the Heihe population in the northern Xiaoxinganling Mountains, possibly due to less human disturbance in this region than in other areas. According to a previous study, a PIC value equal to or more than 0.5 indicates high genetic information for genetic markers. In the present study, the PIC values obtained for the multiallelic EST-SSR markers ranged from 0.142 to 0.833, with a mean value of 0.461, indicating a high level of genetic information among the 480 P. koraiensis individuals from the 16 natural populations. The genetic diversity of P. koraiensis obtained in the present study is higher than that reported for Pinus bungeana (Na = 3.70, He = 0.36) [41], Pinus dabeshanensis (He = 0.36) [42] and Pinus yunnanensis (Na = 4.10, He = 0.43) [43] but lower than that reported for Pinus tabulaeformis (Na = 6.52, He = 0.68) [44]. The genetic diversity of a species may vary with characteristics such as adaptability, pollination mechanism and population size [45,46,47]. The observed genetic diversity in the present study might be attributable to the genetic background, life history and population dynamics of P. koraiensis. Previous studies have found that P. koraiensis has a large population size, long life cycle, strong adaptability, long pollination distance and large genome size, and it has a complex genetic background, which allows it to generate high genetic diversity [48,49,50,51,52]. Natural selection under the changing environmental conditions is likely to lead to differences in genotype frequency among populations. In addition, previous studies have suggested that evaluations of genetic diversity are limited by low numbers of populations and molecular markers [53,54]. For instance, analyses of the genetic diversity of natural P. koraiensis populations have been conducted using a variety of molecular marker techniques. Kim et al. [53] analyzed allozyme loci variation and found a moderate level of genetic diversity among natural P. koraiensis populations in Korea. The genetic diversity of natural P. koraiensis populations detected by allozyme markers (He = 0.18) in Russia [54] was much lower than that identified using EST-SSRs markers in this study. These findings indicate that P. koraiensis maintains high genetic diversity worldwide. The level of genetic diversity detected in this study is similar to that detected based on nine EST-SSR markers in seven natural populations of P. koraiensis in northeast China (He = 0.610) [35]. Xiaoxinganling Mountain of China was considered as the distribution center for P. koraiensis, possessing abundant germplasm resources and ancient founding stocks and maintaining considerable numbers of individuals. In addition, the genetic diversity of P. koraiensis populations from Xiaoxinganling Mountains was higher than that of the Changbaishan Mountains populations, with high expected heterozygosity and abundant private alleles found for the former populations (Figure 4). All these results indicate that Xiaoxinganling Mountains may be the center of genetic diversity of P. koraiensis in China.
3.2. Population Genetic Differentiation
Detection of genetic differentiation is a key process in the genetic improvement of forest trees. Regarding the estimation of genetic differentiation, past studies have considered an Fst value higher than 0.15 but lower than 0.25 to indicate significant divergence [55,56,57]. In the present study, the genetic differentiation assessed by EST-SSRs among P. koraiensis populations ranged from 0.014 to 0.348, with a mean value of 0.177, indicating significant differentiation among populations in China. However, previous studies reported low genetic differentiation among populations as assessed by allozyme loci variation in Korea (Fst = 0.06) [53] and Russia (Fst = 0.015) [54] and by EST-SSRs in China (Fst = 0.02) [35]. In addition, Kim et al. [31] studied the genetic variation of P. koraiensis in Korea, Russia and China using allozymes and RAPDs and detected small differences among the three regions. Different degrees of genetic differentiation were observed in natural P. koraiensis populations in these countries, with low Fst values. The main reason for these differences is that only limited numbers of natural populations and molecular markers were analyzed. The genetic differentiation index (Fst) is correlated with gene flow (Nm). Generally, the greater the degree of differentiation, the weaker the gene flow, i.e., a lower gene migration rate among populations [57,58,59,60]. Natural P. koraiensis forests originated in Siberia and in northeast Asia have undergone regeneration, succession and migration over millions of years [61,62]. After the Quaternary glaciation, many species died out, but the P. koraiensis forests persisted into the present and underwent a range of changes and varying degrees of differentiation. In natural P. koraiensis populations, low levels of genetic differentiation have been observed in Korea [31], whereas high genetic differentiation has occurred in northeast China, which may have contributed to the rich P. koraiensis germplasm resources (representing approximately 60% of the world’s total) and broad distribution area (more than 3000 hectares) in this country. The mean He (0.521) across all loci was greater than Ho (0.374), indicating a high heterozygosity among the sampled populations of P. koraiensis. This high heterozygosity is attributable to the fact that Pinus species exhibit cross-pollination and wind pollination. Furthermore, the AMOVA suggested that most of the genetic variation (more than 60%) in P. koraiensis exists within populations, with a small proportion occurring among populations; these findings are consistent with findings in other cross-pollinating species.
3.3. Population Structure and Gene Flow
Analyses of population structure can provide insight into population size, breeding system, extent of isolation and population migration or gene flow [63,64]. Furthermore, such analyses can help reveal the relationships between genetic variation and environmental stresses and enhance our understanding of evolution. Evaluating population structure is a key component of genome-wide association analysis (GWAS) and marker-assisted selection (MAS) [65]. P. koraiensis is mainly distributed in Xiaoxinganling and Changbaishan Mountains in northeast China, areas with a humid climate. Due to the environmental conditions, the germplasm resources of P. koraiensis from different locations display high phenotypic and genetic variation. The STRUCTURE analysis of population structure identified two groups (optimal K = 2) from the 16 natural populations, with 5 populations in one group and the remainder in another group. Similar results were obtained in the PCA and dendrogram (neighbor-joining tree) analysis, indicating genetic differentiation of P. koraiensis populations in China. Interestingly, individuals from Xiaoxinganling Mountains were clustered into one group, occupying a northern area, which makes them more like an ancestral group. Furthermore, the samples from Changbaishan Mountains and the adjacent ridge region were clustered into the other group; the populations corresponding to these samples are distributed in a southern area and exhibit different degrees of genetic differentiation and gene flow. However, some of the individuals from Xiaoxinganling Mountains were clustered into cluster 2, although the majority were clustered into cluster 1 (Figure 3A,B). The main potential reasons for this finding are as follows: (1) These two mountain regions are close to each other, and some hybridization events may occur; (2) for populations separated by a short spatial distance, the probability of gene flow is high, which will affect population genetic structure; and (3) pollen and seed dispersal occur over long distances in this species, which promote gene flow. The genetic structure of the natural P. koraiensis populations in China determined in this study is consistent with the current geographical distribution of these populations. Furthermore, the findings are consistent with previous studies showing that populations in similar geographical locations or environments tend to cluster into the same group [66,67]. In this study, although some admixture was detected by the STRUCTURE and PCA analyses, the population dendrogram also suggested two subgroups, with 5 populations in cluster 1 and 11 populations in cluster 2.
Gene flow among populations is closely related to geographical distance and effective population size and can generate new genetic combinations, potentially enhancing species resilience and persistence [68,69,70]. In plants, migration, or gene flow, is achieved via seeds, pollen and other propagules, and influences the genetic diversity and differentiation among independent evolutionary units [71,72]. We found that two genetically distinct populations (Zhanhe and Wangqing) exhibited segregation from other populations, which may be related to their geographic distance from other populations (approximately 565 km), limiting the level of gene flow between them. These independent units play an important role in maintaining the genetic diversity of this species. This interpretation is consistent with previous studies demonstrating that isolated populations of plants with long-distance pollination may have higher levels of genetic diversity than large contiguous populations [73,74,75]. Moreover, high levels of gene flow were found among Helong, Maoershan and Fangzheng populations. Thus, it can reduce the effects of artificial selection or genetic drift and promote the maintenance of genetic information. Similar results were obtained for Camelina sativa accessions [65]. Previous studies have also found that extensive gene flow can alter the gene frequencies in populations to affect genetic diversity and structure. In our study, although a strong correlation between gene flow and geographic distance between populations was observed, some degree of gene flow was also evident between geographically distant populations. In addition, geographic distance was not correlated with genetic distance in the natural P. koraiensis populations in this study, suggesting that geographic distribution may not be a determinant factor for the genetic structure of populations.
3.4. Conservation and Management Strategies
Evaluations of germplasm resources are needed to maintain abundant genetic variation and high levels of genetic diversity of some species of interest and establish sound conservation strategies. Our population genetic analysis revealed that the populations distributed in the Xiaoxinganling Mountains (Zhanhe, Heihe, Liangshui, Tieli and Hegang) exhibit high levels of genetic diversity and moderate levels of gene flow (Figure 4). These populations represent the core populations and have stronger environmental adaptability and evolutionary potential than the other populations, and they can be considered independent genetic units. Hence, measures such as in situ conservation should be implemented for conserving natural P. koraiensis resources. In addition, the marginal populations represent special germplasm resources. They are characterized by low genetic diversity but have high levels of genetic differentiation relative to the other natural populations. Habitat fragmentation can reduce gene flow among populations, leading to a loss of genetic diversity. In this study, the Helong population, which occurs in a marginal area, should be targeted for conservation measures, such as ex situ measures. In addition, the greatest level of population differentiation was observed between Helong and Liangshui populations, indicating that these populations can be considered independent units. Therefore, regulations and management strategies must be established to protect the natural habitat of this species and prohibit harvest. More importantly, a national-level core germplasm resource library of P. koraiensis should be established by the government, with the objectives of maintaining genetic variation, improving plant adaptability to environmental changes and developing new breeding materials. Under these measures, the existing natural P. koraiensis populations in China can be protected and be better used as a source of resources for genetic improvement in the future.
For forest management perspectives, efforts should be made to regulate timber harvesting in these population in order to reduce loss of genetic diversity. Particularly, the marginal populations, such as the Helong population, that are characterized by low genetic diversity should be given the highest management priority by enrichment planting of individuals from different populations to enhance the genetic diversity within this population. Forest management should also focus on suppression of wildfire in these forests as population fragmentation driven by wildfire can reduce gene flow among populations, leading to a loss of genetic diversity. In addition, these forests should be protected from pest and disease, such as the white pine blister rust diseases that affect the trees.
4. Materials and Methods
4.1. Plant Materials and Genomic DNA Extraction
In this study, 16 populations of P. koraiensis from Jilin Province (J) and Heilongjiang Province (H) were considered. A total of 480 samples were collected from these populations, which occur throughout the natural distribution areas in northeastern China (Table 5, Figure 6). The sampled populations were selected to represent the main distribution region and included the Xiaoxinanling Mountains group (G1, including populations P4, P5, P6, P7 and P8) and the Changbai Mountains group (G2, including P1, P2, P3, P9, P10, P11, P12, P13, P14, P15 and P16). The populations were distributed across the northernmost (Heihe, 49°24′47″, 126°36′47.16″), southernmost (Linjiang, 42°0′36″, 127°13′12″) and easternmost regions (Hulin, 45°46′12″, 132°58′48″) of natural P. koraiensis distribution in northeast China. The average altitude of the sampled individuals was 320 m. To obtain representative samples of populations, sampling was conducted with at least 200 m between sampled individuals. The number of sampled individuals per population ranged from 29 to 31, with an average number of 30. Fresh needle samples of P. koraiensis with no signs of pests or disease were collected from the middle portion of the crown and immediately frozen in liquid nitrogen and stored at −80 °C for subsequent genomic DNA extraction and PCR amplification. In addition, nucleic acids were extracted from needles using the improved cetyltrimethyl ammonium bromide (CTAB) method described by Li et al. [76]. DNA quality and concentration were evaluated using 1.0% agarose gel electrophoresis and the K5500 Plus microspectrophotometer (KAIAO Technology Development Co., Ltd., Beijing, China), respectively.
4.2. PCR Amplification and SSR Analysis
Fifteen highly polymorphic and reproducible EST-SSR markers of P. koraiensis developed in our laboratory were selected in this study to detect polymorphisms in the 16 sampled P. koraiensis populations. The primers of P. koraiensis were developed as described by Li et at. [23]. Eight capillary electrophoresis templates were amplified with fifteen primers synthesized by Sangon Biotech (Shanghai, China), and universal M13 sequence (5′-TGTAAAACGACGGCCAGT-3′) labeled with four fluorescent dyes (TAMRA, FAM, HEX and ROX) was added at the 5′ end of the forward primers. DNA was diluted to a working concentration of 25 ng/μL. To detect SSR loci, polymerase chain reaction (PCR) was performed in a total volume of 20 μL containing 10 μL 2× Super PCR Mix (Beijing Genomics Institute Tech Solutions (Bejing Liuhe) Co., Ltd., Beijing, China), 2 μL template DNA, 0.8 μL forward primer (1 μM), 3.2 μL reverse primer (1 μM), 1 μL M13 primer with fluorescent label and 3 μL ddH2O. The PCR amplification conditions were as follows: 94 °C for 5 min followed by 30 cycles at 94 °C for 30 s, 57 °C for 30 s, and 72 °C for 30 s; followed by 8 cycles at 94 °C for 30 s, 55 °C for 30 s, and 72 °C for 30 s; followed by final extension at 72 °C for 10 min. The PCR products were subjected to 1.0% agarose gel electrophoresis and then analyzed by high performance capillary electrophoresis (HPCE) using an ABI 3730XL DNA Sequencer (Applied Biosystems, Foster City, CA, USA) to detect fragment size. The original sequence data were analyzed using GeneMapper (version 4.1) software.
4.3. Data Analysis
GeneMapper was used to obtain the microsatellite allele data, and the Microsatellite toolkit v 3.1.14 was used to convert the data into the necessary format for analysis. The genetic diversity analysis was conducted using GENALEX software version 6.50 [77] with the following parameters: number of alleles (Na), effective number of alleles (Ne), observed (Ho) and expected (He) heterozygosity, number of rare alleles (NRA), Shannon diversity index (I), Hardy–Weinberg equilibrium (HWE), F-statistics (Fis, Fit and Fst) and Nei’s genetic distance. The TBtools software [78] was used to plot the heatmap of expected heterozygosity (He). In addition, we calculated the polymorphism information content (PIC) values of each SSR primer using the PICcalc program [79]. Gene flow (Nm) was calculated as Nm = (1 − Fst)/4 × Fst and used to measure the degree of gene exchange among or within the 16 populations. ALREQUIN software (version 3.5) [80] was used to analyze the level and sources of molecular genetic variation via AMOVA based on the evolutionary distances among and within the sampled populations and the observed genetic clusters. The total genetic variation was divided into three components: among groups, among populations within groups and within populations.
To evaluate the population genetic structure of P. koraiensis, a Bayesian clustering algorithm was performed in STRUCTURE software (version 2.3) [81] with the following settings: K-values from 1 to 10, with ten runs per K value and a burn-in period and number of Markov chain Monte Carlo (MCMC) reps after burn-in of 100,000 iterations and 100,000, respectively. The optimal K value for the number of populations was determined based on the delta-K values calculated by the Evanno method [82], using an algorithm of the online tool of STRUCTURE HARVESTER [83], where a clear peak was observed in the plot of delta K. In addition, principal component analysis (PCA) was performed to evaluate the genetic relationships among different populations using GENALEX software version 6.50. Based on the Nei’s genetic distance (1983), a Neighbor-joining (NJ) phylogenetic tree of the populations was constructed using PowerMarker software (version 3.25) [84] and annotated and visualized using the online tool interactive Tree Of Life (iTOL) [85]. Geographic distance among populations was calculated as described in Li et al.’s study [76]. Finally, to detect the gene flow among the 16 populations, a relative migration network was constructed using the ‘diveRsity’ [86] package of R software (version 3.5.0) [87].
5. Conclusions
This study investigated the genetic diversity and population structure of natural P. koraiensis populations in northeast China, and proposed some conservation strategies for this valuable conifer species. This study is the first comprehensive report of the genetic diversity of natural P. koraiensis populations in China. We found that the existing P. koraiensis populations in China maintain high levels of genetic diversity, which provide a foundation for germplasm innovation and genetic improvement of P. koraiensis. The population genetic analysis in this study identified two independent genetic units (Liangshui and Helong populations) that exhibit high degrees of genetic differentiation. The populations distributed in the Xiaoxinganling Mountains are highly genetically diverse and may represent the central population of natural P. koraiensis in China. Furthermore, the genetic structure of P. koraiensis populations identified in this study is consistent with the geographical distribution of these populations in China. These results have significance for the protection of natural P. koraiensis germplasm resources in China as well as for developing improved genotypes through breeding. Our findings provide genetic information useful for future genome-wide association studies (GWAS) and marker-assisted selection (MAS) and genomic selection (GS) studies. It is, therefore, recommended to further conduct research on genetic improvement for timber and cone production using marker-assisted selection and/or genomic selection as well as genotype by environment interaction studies should be carried out to identify suitable site-specific genotypes.
Author Contributions
Conceptualization, X.Z. and X.L.; methodology, X.L., Y.L. and M.Z.; validation, X.L., Y.X. and M.T.; resources, X.L.; writing—original draft preparation, X.L.; writing—review and editing, X.L., M.T., and X.Z.; supervision, X.Z.; project administration, X.Z.; funding acquisition, X.Z. All authors have read and agreed to the published version of the manuscript.
Funding
This research study was supported by the Fundamental Research Funds for the Central Universities (Northeast Forestry University) (No. 2572017DA02).
Institutional Review Board Statement
Not applicable.
Informed Consent Statement
Not applicable.
Data Availability Statement
Data for this study can be made available with reasonable request to the authors.
Conflicts of Interest
The authors declare that the research was conducted in the absence of any commercial or financial relationships that could be construed as a potential conflict of interest.
References
- Choi, D.-S.; Jin, H.-O.; Lee, C.-H.; Kim, Y.-C.; Kayama, M. Effect of soil acidification on the growth of Korean pine (Pinus koraiensis) seedlings in a granite-derived forest soil. Environ. Sci. Int. J. Environ. Physiol. Toxicol. 2005, 12, 33–47. [Google Scholar]
- Jia, Y.; Zhu, J.; Wu, Y.; Fan, W.-B.; Zhao, G.-F.; Li, Z.-H. Effects of Geological and Environmental Events on the Diversity and Genetic Divergence of Four Closely Related Pines: Pinus koraiensis, P. armandii, P. griffithii, and P. pumila. Front. Plant Sci. 2018, 9, 1264. [Google Scholar] [CrossRef]
- Wang, F.; Chen, S.; Liang, D.; Qu, G.-Z.; Chen, S.; Zhao, X. Transcriptomic analyses of Pinus koraiensis under different cold stresses. BMC Genom. 2020, 21, 1–14. [Google Scholar] [CrossRef] [Green Version]
- Ma, J.L. The evolution of Korea Pine forest. J. Northeast. For. Univ. 1997, 25, 67–71. [Google Scholar]
- Wang, H.; Shao, X.-M.; Jiang, Y.; Fang, X.-Q.; Wu, S.-H. The impacts of climate change on the radial growth of Pinus koraiensis along elevations of Changbai Mountain in northeastern China. For. Ecol. Manag. 2013, 289, 333–340. [Google Scholar] [CrossRef]
- Zhu, J.; Wang, K.; Sun, Y.; Yan, Q. Response of Pinus koraiensis seedling growth to different light conditions based on the assessment of photosynthesis in current and one-year-old needles. J. For. Res. 2014, 25, 53–62. [Google Scholar] [CrossRef]
- Fan, Y.; Moser, W.K.; Cheng, Y. Growth and Needle Properties of Young Pinus koraiensis Sieb. et Zucc. Trees across an Elevational Gradient. Forests 2019, 10, 54. [Google Scholar] [CrossRef] [Green Version]
- Li, X.; Liu, X.T.; Wei, J.T.; Li, Y.; Tigabu, M.; Zhao, X.Y. Genetic improvement of Pinus koraiensis in China: Current situation and ffuture prospects. Forests 2020, 11, 148. [Google Scholar] [CrossRef] [Green Version]
- Zhang, J.; Zhou, Y.; Zhou, G.; Xiao, C. Composition and Structure of Pinus koraiensis Mixed Forest Respond to Spatial Climatic Changes. PLoS ONE 2014, 9, e97192. [Google Scholar] [CrossRef]
- Wang, X.C.; Zhang, M.H.; Ying, J.; Li, Z.S.; Zhang, Y.D. Temperature signals in tree-ring width and divergent growth of Ko-rean pine response to recent climate warming in northeast Asia. Trees 2016, 31, 1–13. [Google Scholar]
- Seo, Y.-W.; Balekoglu, S.; Choi, J.-K. Growth pattern analysis by stem analysis of Korean white pine (Pinus koraiensis) in the central northern region of Korea. For. Sci. Technol. 2014, 10, 220–226. [Google Scholar] [CrossRef] [Green Version]
- Zhang, S.T.; Zhang, L.G.; Wang, L.; Zhao, Y.H. Total phenols, flavonoids, and procyanidins levels and total antioxidant activity of different Korean pine (Pinus koraiensis) varieties. J. For. Res. 2018, 30, 1743–1754. [Google Scholar] [CrossRef]
- Lai, F.; Xie, H.; Wang, J. Functions of biology and disease control with Pycnogonid from pine bark extract. Chin. Tradit. Herb. Drugs 2005, 36, 127–131. [Google Scholar]
- Liu, M.; Mao, Z.J.; Li, Y.; Sun, T.; Li, X.H.; Huang, W.; Liu, R.P.; Li, Y.H. Response of radial growth of Pinus koraiensis in broad-leaved Korean pine forests with different latitudes to climatical factors. Ying Yong Sheng Tai Xue Bao J. Appl. Ecol. 2016, 27, 1341–1352. [Google Scholar]
- Kang, K.; Harju, A.; Lindgren, D.; Nikkanen, T.; Almqvist, C.; Suh, G. Variation in effective number of clones in seed orchards. New For. 2001, 21, 17–33. [Google Scholar] [CrossRef]
- Han, S.U.; Kang, K.S.; Kim, C.S.; Kim, T.S.; Song, J.H. Effect of top-pruning in a clonal seed orchard of Pinus koraiensis. Ann. For. Res. 2008, 51, 155–156. [Google Scholar]
- Park, J.M.; Kwon, S.H.; Lee, H.J.; Na, S.J.; El-Kassaby, Y.A.; Kang, K.S. Integrating fecundity variation and genetic related-ness in estimating the gene diversity of seed crops: Pinus koraiensis seed orchard as an example. Can. J. Forest. Res. 2016, 47, 366–370. [Google Scholar] [CrossRef] [Green Version]
- Guan, G.Y. Effects of different scion types on grafting survival rate and growth potential of Pinus koraiensis. Prot. For. Sci. Technol. 2019, 000, 44–45. [Google Scholar]
- Xia, D.; Yang, S.W.; Yang, C.P.; Lv, Q.Y.; Liu, G.F.; Zhang, P.G. Study of Pinus koraiensis provenance test (1): Provenance re-gionalization. J. Northeast. Univ. 1991, 19, 122–128. [Google Scholar]
- Wang, Y.X.; Dong, Y.H.; Yang, H.; Wang, H.Z.; Xu, J.M.; Shan, M.G.; Zhang, G.L. Open pollination progeny test of clonal seed orchard of Pinus koraiensis. For. Sci. Technol. 2005, 34, 20–21. [Google Scholar]
- Liang, D.; Ding, C.; Zhao, G.; Leng, W.; Zhang, M.; Zhao, X.; Qu, G. Variation and selection analysis of Pinus koraiensis clones in northeast China. J. For. Res. 2017, 29, 611–622. [Google Scholar] [CrossRef]
- Chen, M.-M.; Feng, F.; Sui, X.; Li, M.-H.; Zhao, D.; Han, S. Construction of a framework map for Pinus koraiensis Sieb. et Zucc. using SRAP, SSR and ISSR markers. Trees 2010, 24, 685–693. [Google Scholar] [CrossRef]
- Li, X.; Liu, X.; Wei, J.; Li, Y.; Tigabu, M.; Zhao, X. Development and Transferability of EST-SSR Markers for Pinus koraiensis from Cold-Stressed Transcriptome through Illumina Sequencing. Genes 2020, 11, 500. [Google Scholar] [CrossRef]
- Kwon, S.; Kim, S.; Kim, J.; Kang, W.; Park, K.-H.; Kim, C.-B.; Girona, M.M. Predicting Post-Fire Tree Mortality in a Temperate Pine Forest, Korea. Sustainability 2021, 13, 569. [Google Scholar] [CrossRef]
- Li, J.Q.; Wang, L.H.; Zhan, Q.W.; Liu, Y.L.; Yang, X.C. Transcriptome characterization and functional marker development in Sorghum sudanense. PLoS ONE 2016, 11, e0154947. [Google Scholar] [CrossRef] [PubMed] [Green Version]
- Zhu, H.; Song, P.; Koo, D.-H.; Guo, L.; Li, Y.; Sun, S.; Weng, Y.; Yang, L. Genome wide characterization of simple sequence repeats in watermelon genome and their application in comparative mapping and genetic diversity analysis. BMC Genom. 2016, 17, 1–17. [Google Scholar] [CrossRef] [Green Version]
- Zhao, X.; Li, C.; Wan, S.; Zhang, T.; Yan, C.; Shan, S. Transcriptomic analysis and discovery of genes in the response of Arachis hypogaea to drought stress. Mol. Biol. Rep. 2018, 45, 119–131. [Google Scholar] [CrossRef] [PubMed]
- Liu, Y.; Geng, Y.; Song, M.; Zhang, P.; Hou, J.; Wang, W. Genetic Structure and Diversity of Glycyrrhiza Populations Based on Transcriptome SSR Markers. Plant Mol. Biol. Rep. 2019, 37, 401–412. [Google Scholar] [CrossRef]
- Gouy, M.; Rousselle, Y.; Chane, A.T.; Anglade, A.; Royaert, S.; Nibouche, S.; Costet, L. Genome wide association mapping of agro-morphological and disease resistance traits in sugarcane. Euphytica 2014, 202, 269–284. [Google Scholar] [CrossRef]
- Huang, Z.; Zhao, N.; Qin, M.; Xu, A. Mapping of quantitative trait loci related to cold resistance in Brassica napus L. J. Plant Physiol. 2018, 231, 147–154. [Google Scholar] [CrossRef]
- Kim, Z.S.; Hwang, J.W.; Lee, S.W.; Yang, C.; Gorovoy, P.G. Genetic Variation of Korean Pine (Pinus koraiensis Sieb. et Zucc.) at Allozyme and RAPD Markers in Korea, China and Russia. Silvae Genet. 2005, 54, 235–246. [Google Scholar] [CrossRef] [Green Version]
- Acheampong, A.; Leveque, N.; Tchapla, A.; Heron, S. Application of SRAP in the genetic diversity of Pinus koraiensis of different provenances. Afr. J. Biotechnol. 2010, 8, 1000–1008. [Google Scholar]
- Chen, J.Y. Analysis of Genetic Diversity of Pinus koraiensis Plantation in CaoHekou Forest Farm by ISSR Marker. Bull. Bot. Res. 2009, 29, 633–636. [Google Scholar]
- Feng, F.-J.; Han, S.-J.; Wang, H.-M. Genetic diversity and genetic differentiation of natural Pinus koraiensis population. J. For. Res. 2006, 17, 21–24. [Google Scholar] [CrossRef]
- Tong, Y.W.; Lewis, B.J.; Zhou, W.M.; Mao, C.R.; Wang, Y.; Zhou, L.; Yu, D.P.; Dai, L.M.; Qi, L. Genetic Diversity and Population Structure of Natural Pinus koraiensis Populations. Forests 2020, 11, 39. [Google Scholar] [CrossRef] [Green Version]
- Halbauer, E.-M.; Bohinec, V.; Wittenberger, M.; Hansel-Hohl, K.; Gaubitzer, S.; Sehr, E.M. Genetic diversity of flax accessions originating in the Alpine region: A case study for an ex situ germplasm evaluation based on molecular marker. Euphytica 2017, 213, 120. [Google Scholar] [CrossRef]
- Krishnan, A.G.; John, R.; Cyriac, A.; Sible, G. Estimation of genetic diversity in nutmeg (Myristica fragrans Houtt.) selections using RAPD markers. Int. J. Plant Sci. 2017, 12, 102–107. [Google Scholar] [CrossRef]
- Thomas, L. Genetic variation in Turkish Red Pine (Pinus brutia Ten.) seed stands as determined by RAPD markers. Silvae Genet. 2017, 53, 169–175. [Google Scholar]
- Chung, M.Y.; Moon, M.O.; López-Pujol, J.; Chung, J.M.; Chung, M.G. Genetic diversity in the two endangered endemic species Kirengeshoma koreana (Hydrangeaceae) and Parasenecio pseudotaimingasa (Asteraceae) from Korea: Insights into population history and implications for conservation. Biochem. Syst. Ecol. 2013, 51, 60–69. [Google Scholar] [CrossRef]
- Sanaa, A.; Boulila, A.; Boussaid, M.; Ben Fadhel, N. Genetic diversity, population structure and linkage disequilibrium analysis in the endangered Tunisian Pancratium maritimum Linnaeus (Amaryllidaceae) populations. Afr. J. Ecol. 2016, 54, 379–382. [Google Scholar] [CrossRef]
- Duan, D.; Jia, Y.; Yang, J.; Li, Z.H. Comparative transcriptome analysis of male and female conelets and development of mi-crosatellite markers in Pinus bungeana, an Endemic Conifer in China. Genes 2017, 8, 393. [Google Scholar] [CrossRef] [Green Version]
- Zhang, Z.; Wang, H.; Chen, W.; Pang, X.; Li, Y. Genetic diversity and structure of native and non-native populations of the endangered plant Pinus dabeshanensis. Genet. Mol. Res. 2016, 15, 15027937. [Google Scholar] [CrossRef]
- Xu, Y.L.; Cai, N.H.; Woeste, K.; Kang, X.Y.; He, C.Z.; Li, G.Q.; Chen, S.; Duan, A.A. Genetic diversity and population structure of Pinus yunnanensis by simple sequence repeat markers. Forest. Sci. 2016, 62, 38–47. [Google Scholar] [CrossRef]
- Wang, M.B.; Hao, Z.Z. Rangewide Genetic Diversity in Natural Populations of Chinese Pine (Pinus tabulaeformis). Biochem. Genet. 2010, 48, 590–602. [Google Scholar] [CrossRef]
- Ferrer, M.M.; Eguiarte, L.E.; Montaña, C. Genetic structure and outcrossing rates in Flourensia cernua (Asteraceae) growing at different densities in the South-western Chihuahuan Desert. Ann. Bot. 2004, 94, 419–426. [Google Scholar] [CrossRef] [Green Version]
- Hellmann, J.J.; Pineda-Krch, M. Constraints and reinforcement on adaptation under climate change: Selection of genetically correlated traits. Biol. Conserv. 2007, 137, 599–609. [Google Scholar] [CrossRef]
- Wang, Z.; Kang, M.; Liu, H.; Gao, J.; Zhang, Z.; Li, Y.; Wu, R.; Pang, X. High-Level Genetic Diversity and Complex Population Structure of Siberian Apricot (Prunus sibirica L.) in China as Revealed by Nuclear SSR Markers. PLoS ONE 2014, 9, e87381. [Google Scholar] [CrossRef] [Green Version]
- Zu, Y.; Yu, J.; Wang, A. Study on pollination characteristics of natural population of Pinus koraiensis. Acta Ecol. Sin. 2000, 20, 430–433. [Google Scholar]
- Zhang, Z.; Zhang, H.G.; Mo, C.; Zhang, L. Transcriptome sequencing analysis and development of EST-SSR markers for Pinus koraiensis. Sci. Silvae Sin. 2015, 51, 114–120. [Google Scholar]
- Omelko, A.; Ukhvatkina, O.; Zhmerenetsky, A. Disturbance history and natural regeneration of an old-growth Korean pine-broadleaved forest in the Sikhote-Alin mountain range, Southeastern Russia. For. Ecol. Manag. 2016, 360, 221–234. [Google Scholar] [CrossRef]
- Parsons, B.J.; Newbury, H.J.; Jackson, M.T.; Ford-Lloyd, B.V. Contrasting genetic diversity relationships are revealed in rice (Oryza sativa L.) using different marker types. Mol. Breed. 1997, 3, 115–125. [Google Scholar] [CrossRef]
- Chen, W.; Hou, L.; Zhang, Z.; Pang, X.; Li, Y. Genetic Diversity, Population Structure, and Linkage Disequilibrium of a Core Collection of Ziziphus jujuba Assessed with Genome-wide SNPs Developed by Genotyping-by-sequencing and SSR Markers. Front. Plant Sci. 2017, 8, 575. [Google Scholar] [CrossRef] [PubMed] [Green Version]
- Kim, Z.S.; Lee, S.W.; Lim, J.H.; Hwang, J.W.; Kwon, W. Genetic diversity and structure of natural populations of Pinus koraiensis (Sieb. et Zucc.) in Korea. For. Genet. 1994, 1, 41–49. [Google Scholar]
- Potenko, V.V.; Velikov, A.V. Allozyme Variation and mating system of coastal populations of Pinus koraiensis sieb. et Zucc. in Russia. Silvae Genet. 2001, 50, 117–122. [Google Scholar]
- Wright, S. The interpretation of population structure by F-Statistics with special regard to systems of mating. Evolution 1965, 19, 395–420. [Google Scholar] [CrossRef]
- Holsinger, K.E.; Weir, B.S. Genetics in geographically structured populations: Defining, estimating and interpreting FST. Nat. Rev. Genet. 2009, 10, 639–650. [Google Scholar] [CrossRef] [PubMed] [Green Version]
- Gerlach, G.; Jueterbock, A.; Kraemer, P.; Deppermann, J.; Harmand, P. Calculations of population differentiation based on GST and D: Forget GST but not all of statistics! Mol. Ecol. 2010, 19, 3845–3852. [Google Scholar] [CrossRef]
- Waples, R.S. Separating the wheat from the chaff: Patterns of genetic differentiation in high gene flow species. J. Hered. 1998, 89, 438–450. [Google Scholar] [CrossRef]
- Raaijeveld-Smit, F.J.L.K.; Eebee, T.J.C.B.; Riffiths, R.A.G.; Oore, R.D.M.; Schley, L. Low gene flow but high genetic diversity in the threatened Mallorcan midwife toad Alytes muletensis. Mol. Ecol. 2005, 14, 3307–3315. [Google Scholar] [CrossRef] [PubMed]
- Schmidt, A.M.; Jacklyn, P.; Korb, J. Isolated in an ocean of grass: Low levels of gene flow between termite subpopulations. Mol. Ecol. 2013, 22, 2096–2105. [Google Scholar] [CrossRef]
- Zhao, F.; Yang, J.; He, H.S.; Dai, L. Effects of Natural and Human-Assisted Regeneration on Landscape Dynamics in a Korean Pine Forest in Northeast China. PLoS ONE 2013, 8, e82414. [Google Scholar] [CrossRef] [PubMed] [Green Version]
- Bao, L.; Kudureti, A.; Bai, W.; Chen, R.; Wang, T.; Wang, H.; Ge, J. Contributions of multiple refugia during the last glacial period to current mainland populations of Korean pine (Pinus koraiensis). Sci. Rep. 2015, 5, 18608. [Google Scholar] [CrossRef] [Green Version]
- Schoettle, A.W.; Goodrich, B.A.; Hipkins, V.D.; Richards, C.; Kray, J. Geographic patterns of genetic variation and population structure in Pinus aristata, Rocky Mountain bristlecone pine. Can. J. For. Res. 2011, 42, 23–37. [Google Scholar] [CrossRef]
- Shamseldeen, E.; Sallam, A.; Belamkar, V.; Emara, H.A.; Nower, A.A.; Salem, K.F.; Poland, J.; Baenziger, P.S. Genetic diversity and population structure of F3:6 nebraska winter wheat genotypes using genotyping-by-sequencing. Front. Genet. 2018, 9, 76. [Google Scholar]
- Luo, Z.N.; Brock, J.; Dyer, J.M.; Kutchan, T.; Schachtman, D.; Augustin, M.; Ge, Y.F.; Fahlgren, N.; Abdel-Haleem, H. Genetic diversity and population structure of a camelina sativa spring panel. Front. Plant Sci. 2019, 10, 184. [Google Scholar] [CrossRef] [PubMed] [Green Version]
- Wang, H.; Vieira, F.G.; Crawford, J.E.; Chu, C.; Nielsen, R. Asian wild rice is a hybrid swarm with extensive gene flow and feralization from domesticated rice. Genome Res. 2017, 27, 1029–1038. [Google Scholar] [CrossRef] [Green Version]
- Peng, L.P.; Cai, C.F.; Zhong, Y.; Xu, X.X.; Xian, H.L.; Cheng, F.Y.; Mao, J.F. Genetic analyses reveal independent domestication origins of the emerging oil crop Paeonia ostii, a tree peony with a long-term cultivation history. Sci. Rep. 2017, 7, 5340. [Google Scholar] [CrossRef] [Green Version]
- Chung, M.Y.; Chung, M.G. Large effective population sizes and high levels of gene flow between subpopulations of Lilium cernuum (Liliaceae). Biochem. Syst. Ecol. 2014, 54, 354–361. [Google Scholar] [CrossRef]
- Bartkowska, M.P.; Wong, A.Y.C.; Sagar, S.P.; Zeng, L.; Eckert, C.G. Lack of spatial structure for phenotypic and genetic variation despite high self-fertilization in Aquilegia canadensis (Ranunculaceae). Heredity 2018, 121, 605–615. [Google Scholar] [CrossRef]
- Herman, A.; Brandvain, Y.; Weagley, J.; Jeffery, W.R.; Keene, A.C.; Kono, T.J.Y.; Bilandžija, H.; Borowsky, R.; Espinasa, L.; O’Quin, K.; et al. The role of gene flow in rapid and repeated evolution of cave-related traits in Mexican tetra, Astyanax mexcanus. Mol. Ecol. 2018, 27, 4397–4416. [Google Scholar] [CrossRef]
- Yerka, M.K.; De Leon, N.; Stoltenberg, D.E. Pollen-Mediated Gene Flow in Common Lambsquarters (Chenopodium album). Weed Sci. 2012, 60, 600–606. [Google Scholar] [CrossRef]
- Hernando, R.C.; Ken, O.; Mauricio, Q.; Fuchs, E.J.; Antonio, G.R. Contrasting patterns of population history and seed-mediated gene flow in two endemic costa rican oak species. J. Hered. 2018, 109, 530–542. [Google Scholar]
- Aegisdóttir, H.H.; Patrick, K.; Jürg, S. Isolated populations of a rare alpine plant show high genetic diversity and considerable population differentiation. Ann. Bot. 2009, 104, 1313–1322. [Google Scholar] [CrossRef] [Green Version]
- Kaljund, K.; Jaaska, V. No loss of genetic diversity in small and isolated populations of Medicago sativa subsp. falcata. Biochem. Syst. Ecol. 2010, 38, 510–520. [Google Scholar] [CrossRef]
- Dostálek, T.; Münzbergová, Z.; Plačková, I. High genetic diversity in isolated populations of Thesium ebracteatum at the edge of its distribution range. Conserv. Genet. 2013, 15, 75–86. [Google Scholar] [CrossRef]
- Li, X.; Li, M.; Hou, L.; Zhang, Z.; Pang, X.; Li, Y. De Novo Transcriptome Assembly and Population Genetic Analyses for an Endangered Chinese Endemic Acer miaotaiense (Aceraceae). Genes 2018, 9, 378. [Google Scholar] [CrossRef] [Green Version]
- Peakall, R.; Smouse, P.E. GenAlEx 6.5: Genetic analysis in Excel. Population genetic software for teaching and research—An update. Bioinformatics 2012, 28, 2537–2539. [Google Scholar] [CrossRef] [PubMed] [Green Version]
- Chen, C.J.; Xia, R.; Chen, H.; He, Y.H. TBtools, a Toolkit for Biologists integrating various HTS-data handling tools with a user-friendly interface. Mol. Plant 2020, 13, 1194–1202. [Google Scholar] [CrossRef]
- Sándor, N.; Péter, P.; István, C.; Mousapour, G.A.; Géza, H.; János, T. PICcalc: An online program to calculate polymorphic information content for molecular genetic studies. Biochem. Genet. 2012, 50, 670–672. [Google Scholar]
- Hamrick, J.L.; Godt, M.J.W. Effects of life history traits on genetic diversity in plant species. Philos. Trans. R. Soc. B Biol. Sci. 1996, 351, 1291–1298. [Google Scholar] [CrossRef]
- Falush, D.; Stephens, M.; Pritchard, J.K. Inference of Population Structure Using Multilocus Genotype Data: Linked Loci and Correlated Allele Frequencies. Genetics 2003, 164, 1567–1587. [Google Scholar] [CrossRef]
- Evanno, G.; Regnaut, S.; Goudet, J. Detecting the number of clusters of individuals using the software structure: A simulation study. Mol. Ecol. 2005, 14, 2611–2620. [Google Scholar] [CrossRef] [Green Version]
- Earl, D.A.; Vonholdt, B.M. Structure harvester: A website and program for visualizing STRUCTURE output and implementing the Evanno method. Conserv. Genet. Resour. 2011, 4, 359–361. [Google Scholar] [CrossRef]
- Liu, K.; Muse, S.V. PowerMarker: An integrated analysis environment for genetic marker analysis. Bioinformatics 2005, 21, 2128–2129. [Google Scholar] [CrossRef] [PubMed] [Green Version]
- Letunic, I.; Bork, P. Interactive Tree Of Life (iTOL): An online tool for phylogenetic tree display and annotation. Bioinformatics 2007, 23, 127–128. [Google Scholar] [CrossRef] [Green Version]
- Keenan, K.; Mcginnity, P.; Cross, T.F.; Crozier, W.W.; Prodöhl, P.A. DiveRsity: An R package for the estimation and exploration of population genetics parameters and their associated errors. Methods Ecol. Evol. 2013, 4, 782–788. [Google Scholar] [CrossRef] [Green Version]
- Ihaka, R.; Gentleman, R. R: A Language for Data Analysis and Graphics. J. Comput. Graph. Stat. 1996, 5, 299–314. [Google Scholar]
Figure 1.
The relative migration network of 16 populations generated via divMigrates. The width of the line and the number shown next to the arrows indicate the migration rate.
Figure 1.
The relative migration network of 16 populations generated via divMigrates. The width of the line and the number shown next to the arrows indicate the migration rate.

Figure 2.
Population structure determined from 480 Pinus koraiensis individuals based on microsatellite data. (A) Estimation of population structure using mean lnP (D) with ten repetitions for K ranging from 1 to 10. (B) Estimation of population structure using delta K (ΔK) with the number of clusters (K) ranging from 1 to 10. (C) Estimation of population structure of 16 populations based on structure analysis.

Figure 3.
Genetic variation and relationships among the 16 sampled natural Pinus koraiensis populations in northeast China. (A) Principal coordinate analysis (PCA) based on pairwise genetic distance. (B) NJ dendrogram of 480 individuals based on Nei’s (1983) genetic distance.
Figure 3.
Genetic variation and relationships among the 16 sampled natural Pinus koraiensis populations in northeast China. (A) Principal coordinate analysis (PCA) based on pairwise genetic distance. (B) NJ dendrogram of 480 individuals based on Nei’s (1983) genetic distance.

Figure 4.
NJ dendrogram of 16 populations based on Nei’s (1983) genetic distance and a heatmap of expected heterozygosity (He) of 16 populations.
Figure 4.
NJ dendrogram of 16 populations based on Nei’s (1983) genetic distance and a heatmap of expected heterozygosity (He) of 16 populations.

Figure 5.
Correlation between genetic distance and geographic distance in P. koraiensis populations determined using the Mantel test.
Figure 5.
Correlation between genetic distance and geographic distance in P. koraiensis populations determined using the Mantel test.

Figure 6.
Distribution of Pinus koraiensis populations sampled in northeast China. G1 represents Xiaoxinganling Mountains geographical groups. G2 represents Changbaishan Mountains geographical groups.
Figure 6.
Distribution of Pinus koraiensis populations sampled in northeast China. G1 represents Xiaoxinganling Mountains geographical groups. G2 represents Changbaishan Mountains geographical groups.


Table 1.
Characteristics of the 15 polymorphic EST-SSR markers used in this study.
| Locus | Allele Size Range (bp) | Na | Ne | I | Ho | He | PIC | HWE | NRA | Fis | Fit | Fst | Nm |
|---|---|---|---|---|---|---|---|---|---|---|---|---|---|
| NEPK-218 | 196–230 | 12 | 2.080 | 0.949 | 0.056 | 0.519 | 0.443 | *** | 6 | 0.647 | 0.893 | 0.695 | 0.109 |
| NEPK-40 | 196–238 | 13 | 1.170 | 0.399 | 0.063 | 0.145 | 0.142 | *** | 3 | 0.327 | 0.593 | 0.396 | 0.382 |
| NEPK-32 | 206–224 | 5 | 2.431 | 0.979 | 0.618 | 0.589 | 0.503 | *** | 1 | −0.236 | −0.053 | 0.148 | 1.438 |
| NEPK-53 | 197–218 | 5 | 1.902 | 0.697 | 0.008 | 0.474 | 0.367 | *** | 3 | 0.923 | 0.981 | 0.757 | 0.080 |
| NEPK-65 | 151–259 | 12 | 2.257 | 1.068 | 0.195 | 0.557 | 0.488 | *** | 5 | 0.259 | 0.649 | 0.526 | 0.225 |
| NEPK-71 | 215–239 | 7 | 2.013 | 0.772 | 0.635 | 0.503 | 0.392 | *** | 3 | −0.275 | −0.254 | 0.016 | 15.141 |
| NEPK-117 | 205–217 | 9 | 3.995 | 1.601 | 0.984 | 0.750 | 0.714 | *** | 2 | −0.594 | −0.290 | 0.191 | 1.058 |
| NEPK-72 | 222–234 | 7 | 1.649 | 0.637 | 0.043 | 0.394 | 0.324 | *** | 4 | 0.346 | 0.894 | 0.838 | 0.048 |
| NEPK-67 | 226–232 | 4 | 2.802 | 1.067 | 0.479 | 0.643 | 0.567 | *** | 1 | 0.034 | 0.259 | 0.233 | 0.822 |
| NEPK-38 | 229–255 | 15 | 1.211 | 0.498 | 0.096 | 0.174 | 0.172 | *** | 6 | 0.396 | 0.477 | 0.134 | 1.622 |
| NEPK-145 | 251–289 | 21 | 6.605 | 2.243 | 0.637 | 0.849 | 0.833 | *** | 6 | 0.229 | 0.309 | 0.104 | 2.154 |
| NEPK-168 | 241–301 | 18 | 3.550 | 1.602 | 0.279 | 0.718 | 0.674 | *** | 9 | 0.265 | 0.602 | 0.459 | 0.295 |
| NEPK-181 | 275–289 | 10 | 2.039 | 0.884 | 0.165 | 0.509 | 0.426 | *** | 5 | 0.375 | 0.667 | 0.467 | 0.285 |
| NEPK-213 | 276–298 | 12 | 1.846 | 1.039 | 0.421 | 0.458 | 0.435 | *** | 4 | −0.151 | 0.109 | 0.226 | 0.856 |
| NEPK-184 | 291–301 | 5 | 2.152 | 0.856 | 0.937 | 0.535 | 0.430 | *** | 0 | −0.743 | −0.719 | 0.014 | 17.691 |
| Average | 10.33 | 2.514 | 1.019 | 0.374 | 0.521 | 0.461 | 3.867 | 0.12 | 0.341 | 0.347 | 2.667 |
Note: Na, number of different alleles; Ne, number of effective alleles; I, Shannon’s diversity index; Ho, observed heterozygosity; He, expected heterozygosity; PIC, polymorphic information content; HWE, deviation from Hardy–Weinberg equilibrium (*** p < 0.001); NRA, number private allele; Fis, inbreeding coefficient; Fit, over inbreeding coefficient; Fst, genetic differentiation index; Nm, number of effective migrants.
Table 2.
Genetic diversity estimates for the 16 P. koraiensis populations based on 15 EST-SRRs markers.
Table 2.
Genetic diversity estimates for the 16 P. koraiensis populations based on 15 EST-SRRs markers.
| Population | Size | Na | Ne | I | Ho | He | uHe | F (Null) | NRA |
|---|---|---|---|---|---|---|---|---|---|
| Liangzihe | 30 | 3.267 | 1.713 | 0.639 | 0.415 | 0.374 | 0.388 | −0.054 | 7 |
| Helong | 30 | 2.667 | 1.663 | 0.529 | 0.390 | 0.310 | 0.321 | −0.195 | 2 |
| Lushuihe | 30 | 3.133 | 1.829 | 0.628 | 0.394 | 0.350 | 0.359 | 0.015 | 1 |
| Heihe | 30 | 3.133 | 1.939 | 0.746 | 0.340 | 0.439 | 0.449 | 0.325 | 3 |
| Liangshui | 10 | 3.333 | 1.914 | 0.664 | 0.470 | 0.370 | 0.380 | −0.235 | 6 |
| Zhanhe | 30 | 4.133 | 2.009 | 0.782 | 0.356 | 0.413 | 0.422 | 0.156 | 12 |
| Tieli | 30 | 4.467 | 2.222 | 0.806 | 0.373 | 0.414 | 0.422 | 0.178 | 8 |
| Hegang | 30 | 3.533 | 1.702 | 0.634 | 0.401 | 0.354 | 0.361 | −0.088 | 7 |
| Linjiang | 28 | 3.667 | 2.257 | 0.860 | 0.470 | 0.488 | 0.502 | 0.018 | 4 |
| Jiaohe | 30 | 3.067 | 1.586 | 0.497 | 0.293 | 0.275 | 0.280 | 0.127 | 1 |
| Hulin | 29 | 2.733 | 1.877 | 0.523 | 0.324 | 0.294 | 0.300 | −0.025 | 0 |
| Boli | 30 | 3.400 | 1.970 | 0.666 | 0.328 | 0.361 | 0.367 | 0.116 | 2 |
| Muling | 30 | 3.000 | 1.840 | 0.525 | 0.335 | 0.285 | 0.290 | −0.013 | 3 |
| Maoershan | 30 | 3.000 | 1.784 | 0.539 | 0.368 | 0.293 | 0.300 | −0.186 | 2 |
| Fangzheng | 30 | 3.000 | 1.711 | 0.531 | 0.341 | 0.286 | 0.292 | 0.033 | 1 |
| Wangqing | 30 | 2.800 | 1.913 | 0.579 | 0.327 | 0.328 | 0.337 | 0.148 | 2 |
| Mean | 3.271 | 1.870 | 0.634 | 0.370 | 0.352 | 0.361 | 0.020 | 3.813 |
Note: Na, number of different alleles; Ne, number of effective alleles; I, Shannon’s diversity index; Ho, observed heterozygosity; He, expected heterozygosity; uHe, unbiased expected heterozygosity; F (null), null allele frequencies; NRA, number private allele.
Table 3.
Analysis of molecular variance (AMOVA) results for 16 populations of Pinus koraiensis in China.
Table 3.
Analysis of molecular variance (AMOVA) results for 16 populations of Pinus koraiensis in China.
| Type | Source of Variation | d.f. | Sum of Squares | Variance Component | Percentage of Variation | Fixation Index |
|---|---|---|---|---|---|---|
| Variance partition a | Among populations | 15 | 2191.019 | 4.559 | 33.00 | FST = 0.516 |
| Within populations | 464 | 4311.567 | 9.292 | 67.00 | ||
| Total | 479 | 6502.585 | 13.851 | |||
| Variance partition b | Among groups | 1 | 115.322 | 0.266 | 26.67 | FST = 0.362 |
| Among populations within groups | 14 | 88.917 | 0.095 | 9.55 | FSC = 0.130 | |
| Within populations | 942 | 600.429 | 0.637 | 63.79 | FCT = 0.267 | |
| Total | 957 | 804.668 | 0.999 | |||
| Variance partition c | Among groups | 1 | 23.753 | 0.024 | 2.77 | FST = 0.264 |
| Among populations within groups | 14 | 180.487 | 0.205 | 23.64 | FSC = 0.243 | |
| Within populations | 942 | 600.429 | 0.637 | 73.59 | FCT = 0.028 | |
| Total | 957 | 804.668 | 0.866 |
Note: a The analysis included all collected populations as one hierarchical group. b The analysis included two geographical groups (G1 and G2). c The analysis included two genetic clusters (Clusters 1 and Clusters 2).
Table 4.
Pairwise genetic differentiation index values (below the diagonal) and Nei’s genetic distance values (above the diagonal). **** indicates the diagonal division of the pairwise genetic differentiation index values and Nei’s genetic distance values.
Table 4.
Pairwise genetic differentiation index values (below the diagonal) and Nei’s genetic distance values (above the diagonal). **** indicates the diagonal division of the pairwise genetic differentiation index values and Nei’s genetic distance values.
| P1 | P2 | P3 | P4 | P5 | P6 | P7 | P8 | P9 | P10 | P11 | P12 | P13 | P14 | P15 | P16 | |
|---|---|---|---|---|---|---|---|---|---|---|---|---|---|---|---|---|
| P1 | **** | 0.008 | 0.002 | 0.383 | 0.737 | 0.452 | 0.498 | 0.550 | 0.426 | 0.418 | 0.397 | 0.418 | 0.437 | 0.432 | 0.422 | 0.471 |
| P2 | 0.029 | **** | 0.007 | 0.443 | 0.813 | 0.403 | 0.520 | 0.619 | 0.458 | 0.395 | 0.388 | 0.406 | 0.439 | 0.466 | 0.434 | 0.423 |
| P3 | 0.017 | 0.021 | **** | 0.410 | 0.778 | 0.434 | 0.475 | 0.543 | 0.425 | 0.421 | 0.400 | 0.422 | 0.436 | 0.440 | 0.432 | 0.425 |
| P4 | 0.188 | 0.233 | 0.208 | **** | 0.048 | 0.154 | 0.106 | 0.167 | 0.104 | 0.368 | 0.337 | 0.285 | 0.258 | 0.244 | 0.245 | 0.612 |
| P5 | 0.298 | 0.348 | 0.322 | 0.054 | **** | 0.222 | 0.172 | 0.216 | 0.145 | 0.411 | 0.385 | 0.342 | 0.368 | 0.338 | 0.351 | 0.769 |
| P6 | 0.202 | 0.203 | 0.202 | 0.091 | 0.124 | **** | 0.093 | 0.207 | 0.143 | 0.317 | 0.297 | 0.260 | 0.255 | 0.266 | 0.234 | 0.430 |
| P7 | 0.221 | 0.245 | 0.220 | 0.070 | 0.104 | 0.051 | **** | 0.022 | 0.041 | 0.427 | 0.414 | 0.312 | 0.315 | 0.309 | 0.299 | 0.439 |
| P8 | 0.239 | 0.271 | 0.239 | 0.098 | 0.124 | 0.104 | 0.025 | **** | 0.059 | 0.540 | 0.520 | 0.402 | 0.432 | 0.403 | 0.410 | 0.498 |
| P9 | 0.183 | 0.213 | 0.193 | 0.058 | 0.092 | 0.071 | 0.036 | 0.051 | **** | 0.2387 | 0.225 | 0.170 | 0.271 | 0.260 | 0.264 | 0.474 |
| P10 | 0.219 | 0.240 | 0.224 | 0.212 | 0.228 | 0.169 | 0.218 | 0.257 | 0.140 | **** | 0.005 | 0.025 | 0.248 | 0.258 | 0.262 | 0.533 |
| P11 | 0.211 | 0.233 | 0.218 | 0.202 | 0.222 | 0.164 | 0.213 | 0.251 | 0.134 | 0.014 | **** | 0.035 | 0.232 | 0.237 | 0.245 | 0.591 |
| P12 | 0.210 | 0.236 | 0.217 | 0.151 | 0.183 | 0.134 | 0.160 | 0.195 | 0.099 | 0.030 | 0.038 | **** | 0.146 | 0.152 | 0.155 | 0.457 |
| P13 | 0.229 | 0.258 | 0.232 | 0.161 | 0.206 | 0.142 | 0.171 | 0.216 | 0.147 | 0.156 | 0.147 | 0.097 | **** | 0.002 | 0.001 | 0.593 |
| P14 | 0.228 | 0.260 | 0.237 | 0.154 | 0.188 | 0.145 | 0.165 | 0.203 | 0.143 | 0.158 | 0.151 | 0.102 | 0.015 | **** | 0.001 | 0.591 |
| P15 | 0.229 | 0.247 | 0.237 | 0.158 | 0.196 | 0.134 | 0.163 | 0.208 | 0.145 | 0.155 | 0.155 | 0.097 | 0.014 | 0.014 | **** | 0.590 |
| P16 | 0.230 | 0.244 | 0.228 | 0.275 | 0.347 | 0.196 | 0.217 | 0.241 | 0.229 | 0.286 | 0.306 | 0.238 | 0.300 | 0.299 | 0.318 | **** |
Table 5.
Summary of Pinus koraiensis sampled populations in NE China.
| Population | Population Codes | Group | Sample Size | Latitude (N) | Longitude (E) | Average Altitude (m) | Province |
|---|---|---|---|---|---|---|---|
| Zhanhe | P6 | G1 | 30 | 48°1′23″ | 127°0′56.16″ | 358 | Heilongjiang |
| Heihe | P4 | G1 | 30 | 49°24′47″ | 126°36′47.16″ | 131 | Heilongjiang |
| Liangshui | P5 | G1 | 30 | 47°43′48″ | 128°55′12″ | 231 | Heilongjiang |
| Tieli | P7 | G1 | 29 | 47°58′48″ | 128°4′48″ | 213 | Heilongjiang |
| Hegang | P8 | G1 | 30 | 47°21′29″ | 129°33′50.03″ | 63 | Heilongjiang |
| Liangzihe | P1 | G2 | 30 | 47°1′54″ | 129°41′49.92″ | 500 | Heilongjiang |
| Lushuihe | P3 | G2 | 30 | 42°24′00″ | 127°28′59.88″ | 732 | Jilin |
| Linjiang | P9 | G2 | 30 | 42°0′36″ | 127°13′12″ | 342 | Jilin |
| Helong | P2 | G2 | 30 | 42°32′47″ | 129°1′3.72″ | 452 | Jilin |
| Wangqing | P16 | G2 | 31 | 43°19′26″ | 129°45′14.04″ | 232 | Jilin |
| Muling | P13 | G2 | 30 | 43°49′54″ | 129°45′19.08″ | 410 | Jilin |
| Jiaohe | P10 | G2 | 30 | 44°0′36″ | 127°25′12″ | 196 | Jilin |
| Maoershan | P14 | G2 | 30 | 45°16′22″ | 127°30′14.40″ | 536 | Heilongjiang |
| Hulin | P11 | G2 | 30 | 45°46′12″ | 132°58′48″ | 84 | Heilongjiang |
| Boli | P12 | G2 | 30 | 45°42′00″ | 130°25′12″ | 525 | Heilongjiang |
| Fangzheng | P15 | G2 | 30 | 45°49′48″ | 128°48′00″ | 111 | Heilongjiang |
Publisher’s Note: MDPI stays neutral with regard to jurisdictional claims in published maps and institutional affiliations. |
© 2021 by the authors. Licensee MDPI, Basel, Switzerland. This article is an open access article distributed under the terms and conditions of the Creative Commons Attribution (CC BY) license (https://creativecommons.org/licenses/by/4.0/).
Share and Cite
MDPI and ACS Style
Li, X.; Zhao, M.; Xu, Y.; Li, Y.; Tigabu, M.; Zhao, X. Genetic Diversity and Population Differentiation of Pinus koraiensis in China. Horticulturae 2021, 7, 104. https://0-doi-org.brum.beds.ac.uk/10.3390/horticulturae7050104
AMA Style
Li X, Zhao M, Xu Y, Li Y, Tigabu M, Zhao X. Genetic Diversity and Population Differentiation of Pinus koraiensis in China. Horticulturae. 2021; 7(5):104. https://0-doi-org.brum.beds.ac.uk/10.3390/horticulturae7050104
Chicago/Turabian StyleLi, Xiang, Minghui Zhao, Yujin Xu, Yan Li, Mulualem Tigabu, and Xiyang Zhao. 2021. "Genetic Diversity and Population Differentiation of Pinus koraiensis in China" Horticulturae 7, no. 5: 104. https://0-doi-org.brum.beds.ac.uk/10.3390/horticulturae7050104
Note that from the first issue of 2016, this journal uses article numbers instead of page numbers. See further details here.