Article

Assessing the Effects of Vineyard Soil Management on Downy and Powdery Mildew Development

1
AGRIS, Agricultural Research Agency of Sardinia, Loc. Bonassai S.S. 291 Sassari-Fertilia—Km. 18,600, 07100 Sassari, Italy
2
Department of Agricultural Sciences, University of Sassari, Viale Italia 39, 07100 Sassari, Italy
*
Author to whom correspondence should be addressed.
Submission received: 23 June 2021 / Revised: 16 July 2021 / Accepted: 20 July 2021 / Published: 22 July 2021
(This article belongs to the Special Issue Grape Responses to Abiotic and Biotic Stresses)

Abstract

:
Advantages of vineyard cover crops include soil conservation, nutrient and water cycling, and a better growth–yield balance. They naturally promote agro-system biological multifunctionality, soil biocenosis, and biological pest control. However, for the role of cover crops on disease control, there is still a lack of information. We performed a systematic evaluation of the soil management effects on the development of two main pathogens: Plasmopara viticola and Erysiphe necator. Conventional soil tillage was compared to grass and legume cover crops during a three-season trial in the Nurra wine region (Sardinia, Italy). Disease and grapevine development were assessed in relation to the weather, leaf area growth, leaf nitrogen, canopy density, and favorable microclimatic conditions for each disease, to weight their importance on disease susceptibility in each treatment. Higher infection percentages were observed in plots subjected to soil tillage. Disease development was better understood in relation to leaf area, leaf nitrogen, and canopy density. The main role of weather conditions on downy mildew infections was ascertained, yet high canopy sunlight levels reduced disease spread under grass cover. For powdery mildew, leaf nitrogen had a crucial role in disease development under soil tillage, and canopy light and hygrothermal conditions had the most relevant function on disease development in cover-cropped vineyards.

1. Introduction

Cover crops represent a valid soil cultivation strategy for vineyard management from both an agronomic and ecosystemic perspective [1,2,3,4]. Compared to classical tillage, these techniques greatly favor soil fertility and structure conservation while improving water infiltration and preserving the groundwater reservoir [5,6,7,8]. Intercropping is frequently applied in both temperate-humid and semi-arid regions, where it can be combined with mowing and/or green-manure operations and regulated or sustained deficit irrigation strategies, to meet the high yield and quality standards [9,10,11,12]. The interactions between vineyards and herbaceous species influence the vegetative growth and root development of the vines [13,14], as well as the water relations and nutritional status [15,16]. Consequently, the vine nitrogen balance and canopy light and hygrothermal microclimate may be deeply altered, with direct implications on grape production and quality [17,18].
Under Mediterranean climate conditions, the presence of a cover crop in the vineyard may lead to reductions in vine vigor and canopy density [19,20], due to water and nutrient competition [5,7,10,11], without a significant reduction in berry production and composition, compared to conventional tillage [16]. Some authors have observed a beneficial effect on the microclimatic conditions for bunch ripening [6,18,20] and, in some cases, also a reduction in the incidence of cryptogamic diseases [12,21].
Grapevine is subject to the attack of several cryptogamic diseases caused by fungi. Vineyard disease control is mainly directed against downy mildew, caused by Plasmopara viticola, and powdery mildew, caused by Erysiphe necator, and cannot disregard the use of chemical means. If the environmental conditions are favorable for epidemic development, the number of treatments required can be quite high, and in such conditions, it becomes essential to promote an environment less favorable to disease development through practices such as cover cropping and/or canopy trimming and leaf removal. However, the size and characteristics of vine canopy wall (i.e., leaf age, canopy density, and architecture) may influence the epidemic progression of a disease by varying the density of susceptible tissue [22], which, in turn, modifies the pathogen reproduction rate and the dispersion of the inoculum. For the same reasons, canopy microclimate can be more or less favorable to the completion of the pathogen cycle [23]. Therefore, all agronomic practices that influence vine vegetative growth affect the epidemic progression of the disease [24] and may assume a fundamental role in integrated disease management, ultimately aiming to reduce the use of chemical means while increasing their effectiveness. Few studies on vineyard soil management have taken into deep consideration the effect of cover cropping on grapevine diseases [25,26]. In general, less attack is found under cover-cropped vineyards than under conventional tillage, but only in a few cases the complex relationships between disease development, canopy growth, and microclimate have been explored [21,27]. Nevertheless, effects of soil tillage and cover crops on downy mildew development are still poorly elucidated [28]. In this study, we investigated the development of downy and powdery mildew because they are the most widespread and dangerous diseases, requiring the highest number of fungicide treatments under Mediterranean climate conditions. The aim of this research was to evaluate the effects of different soil management strategies on the development of both diseases, and to weight the relative influence of weather, canopy microclimate, growth, and nitrogen content on disease spread, particularly during the periods with favorable infection conditions and grapevine susceptibility. We performed a systematic assessment of the canopy development and structure, weather and canopy microclimate, leaf nitrogen content, and disease development, subjected to soil tillage versus completely grass or legume soil cover, in a commercial vineyard located in the Nurra wine area (Sardinia, Italy), in order to evaluate the role of each factor and the interactions among them on the dynamics of disease spread and pressure. Along the three consecutive seasons, we examined how different cover crops may alter these dynamics and the interaction among the main factors affecting the epidemiology of both diseases.

2. Materials and Methods

2.1. Experimental Site

The experiment was conducted in a commercial vineyard of cv. Carignano grafted on 779 P. The vineyard is located in a flat area of Santa Maria La Palma, Northwest Sardinia, Italy (40°39′56″ N 8°16′40″ E, at 40 m a.s.l.), in a calcareous alluvial, subalkaline soil with sandy clay loam texture of about 100 cm in depth (data not shown). The vineyard had a north–south orientation, with a 2.70 × 1.00 vine spacing, and was planted in 2000. Vines were drip irrigated and spur-pruned to a single cordon and trained, with a vertical shoot position, to a single curtain. From November 2012 until December 2015, three different soil management treatments were compared: a sowed grass mixture (GRA) and sowed legume mixture (LEG), covering both the row and interrow spaces, and soil tillage combined with natural vegetation residues incorporation (ST). The experimental design was a complete randomized block with 4 replications, each covering 3 contiguous rows and a plot area of 20 m × 5.40 m, which corresponded to 2 inter-rows and 20 vines per plot.
A summer semi-dormant perennial grass, Dactylis glomerata cv Currie (80%), mixed with an annual self-reseeding grass, Lolium rigidum cv Nurra (20%), was used for the GRA treatment and an annual self-reseeding mixture of Medicago polymorpha cv Anglona (50%) and Trifolium yanninicum cv Gosse (50%) was over-seeded by hand for the LEG treatment. The specific treatment plots were already present in the vineyard inter-rows since the previous experiment started in 2005. In each mixture, the selected species proportion took into consideration the evolution and contribution to dry matter yield along the past 5 years [19], in order to favor rapid and complete covering and cover-crop duration. The grass and legume mixtures are well adapted to the local weather and soil conditions, highly competitive with weeds, show good re-establishment and dry matter yields, and low competition towards the vines during the periods of lower soil moisture availability [29]. Yet, the LEG treatment re-establishment in autumn 2013 was unsatisfactory; thus, in mid-February 2014, an over-sowing (20 kg ha−1) was performed. The row spaces of the GRA and LEG were seeded during November 2012 (30 kg ha−1) and the plots were rolled afterwards. Non-residual herbicide was sprayed (2.5 L ha−1 of glyphosate, Roundup Power 2.0, Monsanto, Milano, Italy) in late October 2012 to remove an infestation of annual and perennial grasses before sowing the LEG plots. Thereafter, no herbicides or fertilizers were applied. All intercropped plots were mowed once in 2013 and 2014 and three times in 2015.

2.2. Weather and Canopy Microclimate

Weather data for the entire duration of the experiment were collected from an automatic station very closely located to the vineyard (40°39′54.018″ N; 8°16′40.116″ E) and included hourly values of maximum and minimum temperature (°C), wind speed (km h−1), maximum and minimum relative humidity (%), and precipitation (mm) for the entire trial duration.
Canopy microclimate was monitored in the 4 blocks and all treatments during the three vineyard vegetative cycles, from bud-break until ripening. Hygrothermal conditions inside the canopy were continuously recorded (at 15 min intervals) using a temperature and relative humidity datalogger (A-series Watchdog, Spectrum technologies, Inc., Aurora, IL, USA), positioned inside a radiation shield and at the center of the canopy.
Photosynthetically active radiation (PAR) interception was measured at different grapevine growth stages, before and after reaching maximum canopy development in the days of the year (DOY) 163 and 184, in 2013; DOY 163 and 191, in 2014, and DOY 184 and 210, in 2015, using a ceptometer (Sunscan SS1, Delta T Devices Ltd., Cambridge, UK) to depict the transverse PAR profiles (400–700 nm) inside the canopy, both at the cluster level and at an upper vegetative level (60 cm from shoot base). A total solar radiation sensor (sunshine sensor BF3, Delta T Devices Ltd., Cambridge, UK) was used for simultaneously recording the reference PAR outside the canopy. The measurements were carried out at solar noon, under clear sky conditions. The values of photosynthetic photon flux density, collected in 6 replicates per plot and canopy height, were expressed as a percentage of the reference PAR (%) measured outside the canopy [30]. To distinguish the canopy layers directly exposed to solar radiation from those inside the canopy, the PAR data were also averaged into 2 different groups, according to the canopy width: those at 0–20 cm from the canopy center, the internal layers (PAR_int); and the externals, at 20–40 cm from the canopy center (PAR_ext).

2.3. Canopy Growth, Density and Nitrogen Content

In order to evaluate the effects of canopy development on disease development, canopy growth was estimated with empirical models for estimating both the main and lateral leaf area (LA) per shoot, as proposed by Lopes and Pinto [31]. Since the modelling efficiency had been established for primary and secondary LA estimation for several other varieties [32,33], the calibration and validated procedures for both the main and lateral LA estimations in cv. Carignano were performed in 2012 (in DOY 180 and 261), and required the measurement of a few variables for each shoot and leaf type (main and lateral): sum of LA, number of leaves, area of the largest leaf, and area of the smallest leaf. For model calibration purposes, destructive shoot measurements were performed using a leaf area meter (LI-3100C, LI-COR Biosciences, Lincoln, NE, USA). Then, new variables were derived: number of leaves per shoot (NL); LA of the single leaf; and the minimum, maximum, and average LA of the main and lateral shoots.
The calibration indicated a high correlation between single LA and the length of the main veins L2, left (L2s), and right (L2d) (Figure 1).
Furthermore, the linear regression analysis showed that both the main and lateral shoot LA models were highly significant (regression significance < 0.001) and presented good agreement of the observed versus predicted LA values, with high determination coefficients (0.904 and 0.986 for main and lateral shoot LA, respectively) and a very good modelling efficiency. The mean absolute percentage error was also lower than 10% and the MAE, MA%E, and RMSE indicate a good fit of the residuals of the linear regression analysis to the 1:1 line (Table 1; Figure 1).
The measurements of LA development during the 3 grapevine growing seasons were performed in all treatment plots (in 2 vines per plots and 2 shoots per vine) on DOY: in 2013—dates (1) 162 and (2) 197; in 2014—dates (1) 163 and (2) 204; in 2015—dates (1) 180 and (2) 207, close to the dates of downy and powdery mildew field observations in the main and lateral shoot leaves. Total LA per vine was estimated from the summation of the main and lateral LA per shoot multiplied by the number of shoots per vine.
Furthermore, to describe the grapevine canopy density and structure, and to estimate the exposed LA, both the height and width of the vegetation wall were also measured in different DOY: in 2013—dates (1) 168 and (2) 196; in 2014—dates (1) 167 and (2) 205; in 2015—dates (1) 183 and (2) 209. The canopy density measurements were carried out in all treatment plots, based on “Point Quadrat Analysis” [34]. Using a grid guide structure with an area of 1 m2, placed adjacently to the canopy wall, in a vertical position and with the help of a metal needle inserted transversally to the grid guide, the number of gaps, contacts with leaves, and clusters through the canopy, at 6 levels of vegetation height (0, 20, 40, 60, 80, and 100 cm from the base), were recorded. These measurements were replicated horizontally, at 20 cm intervals, along the length of the grid guide in 2 vines per treatment plot. Based on these measurements, leaf layer number (LLN), percentage of inner leaves (PIL), percentage of exposed clusters (PEC), and percentage of gaps (Porosity) per vine were computed.
Leaf nitrogen content (N) was estimated in the main leaves by Muscas et al. [35], in their study on mealybug conducted in the same vineyard with the same experimental design, using a portable instrument (SPAD 502 Chlorophyll Meter, Minolta, Osaka, Japan) for chlorophyll content estimation. The SPAD values are also closely related to N and a calibration curve for the Carignano leaves was performed previously [36]. In each experimental plot, the SPAD measurements were carried out in main leaves opposite to the clusters, in all treatment plots (N = 12), in 5 dates along the 3 seasons of trial. In this work we report the data collected close to the dates of disease monitoring: (1) DOY 163 and (2) 191, in 2013; (1) DOY 155 and (2) 197 in 2014; (1) DOY 156 and (2) 219, in 2015).

2.4. Downy and Powdery Mildew Assessment

The measurements concerning downy and powdery mildew development were performed on 3 vines for each disease, per treatment plot. During the days of fungicide sprays performed by the farmer, the entire canopy and trunk of the selected vines were covered with black plastic sheet to allow for undisturbed development of both diseases. The onset of downy and powdery mildew infections was promoted artificially by inoculating the first fully extended leaf of two shoots equally spaced within groups of 3 plants. For P. viticola, an aqueous suspension of zoospores was sprayed on the adaxial blade of the selected leaf. The suspension was prepared in the laboratory by diluting portions of sporulated leaves in distilled water until a concentration of about 105 sporangia mL−1. After one hour, needed for the release of the zoospores, the suspension was sprayed (approximately 0.8 mL per leaf) and the shoot apex with the inoculated leaf was covered with a bag to create a moisture-saturated environment favorable to the onset of infection. For E. necator, a fragment of infected leaf tissue of about 0.5 to 1.0 cm2 was placed in close contact with the upper blade of the selected leaf.
The development of downy and powdery mildew was monitored on the selected vines at different time steps, from the onset of symptoms until the cluster closure stage. The first measurements were carried out on single shoots with at least one symptomatic leaf (from 8 to 6 shoots, including the inoculated ones), recording the intensity of the attack on the main and lateral shoot leaves. Thereafter, measurements were carried out on the entire canopy, observing for each replication 75 leaves, randomly chosen. Symptoms were expressed in 8 intensity classes: 0 = healthy; 1 = 1–5%; 2 = 6–10%; 3 = 11–15%; 4 = 16–25%; 5 = 26–50%; 6 = 51–75%; and 7 = 76–100% infected area. Based on the collected data, the infection index (I%I) was calculated, according to the formula of Townsend and Heuberger [37], expressed as the average percentage of infected leaf.
Downy mildew development on the leaves of the main and lateral shoots was monitored in the following DOY: in 2013—dates (1) 158, (2) 165, and (3) 177; 2014—dates (1) 155, (2) 167, and (3) 181; in 2015—dates (1) 176 and (3) 189; while the observations on the canopy wall were made in: 2013—dates (4) 170, (5) 182, and (6) 193; 2014—dates (4) 170, (5) 182, and (6) 199; 2015—dates (4) 182, (5) 194, and (6) 203. Powdery mildew field observations on main and lateral shoots were performed in the following DOY: in 2013—dates (1) 164, (2) 178, and (3) 191; in 2014—dates (1) 160, (2) 177, and (3) 191; in 2015—dates (1) 170 and (2) 184; and the monitoring on canopy leaves was carried out in the same dates as downy mildew.
The infected LA of the main and lateral shoots was estimated by multiplying the infection index recorded in each shoot type, respectively, by the estimated main and lateral LA per shoot in each monitored period. Finally, for the disease indexes monitored on the canopy wall, data were multiplied by the estimated total LA per plant during each period of disease observation.

2.5. Infection Conditions and Disease Risk Assessment

Taking into consideration that in the Mediterranean regions the weather conditions during the first grapevine growing stages are frequently ideal for the development of downy or powdery mildew infections, the frequency of the days with conditions for infection of each disease were computed. For infections of P. viticola, the number of days with favorable temperature (T), relative humidity (RH), and humectation conditions (i.e., number of days with minimum T > 13 °C, RH > 92%, and humectacion hours >4) were calculated following the Muller–Sleumer [38] model. For E. necator, the number of days with conditions for disease development were calculated based on the risk assessment index (RAI) proposed by Gubler et al. [39], computing the daily and cumulated RAI. To weight the influence of different canopy microclimate conditions among soil management treatments, favorable infection conditions (IC) and RAI were computed separately for each treatment plot, along the 3 seasons, based on canopy temperature and relative humidity data. Moreover, the number of days with favorable conditions for each disease infection, accumulated until each date of field monitoring in the grapevine shoots, was computed. Then, for each treatment plot, the frequency of days with low, moderate, and high RAI values (respectively, 0–30, 40–50, and ≥60) was calculated, from the beginning of leaf development (BBCH stage 15) until the first date of disease assessment on shoots, and then between dates of infection monitoring.

2.6. Statistical Analysis

Data were subjected to analysis of variance and the Tukey test (HSD), to compare the means and to investigate any significant differences (p-value ≤ 0.05), using the software package SPSS statistics 25 (SPSS, IBM, Chicago, IL, USA). Regarding disease development, percentage data were previously arcsin-square root transformed. Two-way ANOVA was performed to evaluate the main influences of the atmospheric conditions for the development of each disease, cover-crop treatment, and interannual variability, as well as to detect the interaction effects among these main factors. In the figures and tables, the mean values ± standard errors are shown, and values followed by the same letter and in the same table column do not differ significantly in the Tukey test (HSD) (p ≤ 0.05).
Finally, for every treatment and experimental season, multi-factor analysis (MFA), followed by a Fisher’s least-significant difference (LSD) test (p ≤ 0.05), was performed after scaling and normalizing the data of each variable: the total and infected LA per plant, leaf N and light microclimate, and the IC and RAI classes’ frequency, reached at 2 different stages of grapevine and disease development. The resulting loading plots highlighted the common variations and made it possible to summarize the relationships among the variables, and to identify the main factors influencing the disease incidence.

3. Results and Discussion

3.1. Disease Development

3.1.1. Downy Mildew in Shoots and Canopy Wall

The artificial infections carried out at the beginning of the season have always been successful in creating uniform outbreaks on all treatment. However, in 2013, numerous natural outbreaks, due to the very favorable weather conditions at the beginning of the season, somewhat offset this initial uniformity. In contrast, in 2014 and 2015, natural outbreaks were more contained, and the start of the epidemic was much more uniform across all replications. The higher I%I in 2014 (Figure 2) were mainly due to an advance in artificial infections and an increase in the number of leaves inoculated per replicate, due to the wind during inoculation. In all three seasons of study, the development of downy mildew, when estimated based on the infection indexes, was similar in the three soil management treatments, except for a minor attack on shoots and canopy wall in LEG in 2015, although not statistically significant.

3.1.2. Powdery Mildew in Shoots and Canopy Wall

The artificial infections carried out at the beginning of the season to standardize the first stages of the epidemic in the different soil management treatments were not successful, and the surveys began following the appearance of natural infections. They appeared later in 2013, due to the high rainfall of April and May, which hindered the establishment of the epidemic. In addition, the initial outbreaks were not evenly distributed in all treatment plots, conversely to what happened in the other two study seasons, particularly in 2014.
Regarding the measurements on individual shoots, in 2013 the I%I mean values were close in all treatments, particularly for the main leaves (Figure 3). However, in date 3 of 2014 and 2015, the I%I values observed for the GRA leaves were lower than those of the other treatments. Besides, a more intense attack was observed on ST compared to LEG, but limited to the main shoot in 2014, while in 2015 it also regarded the lateral leaves of shoot. Nevertheless, the differences were only statistically significant in 2014.
The results of the disease monitoring at the canopy wall confirmed those observed for the individual shoots (Figure 3). In 2013, no relevant differences were found among treatments, while in both 2014 and 2015 the values of the I%Is observed under soil tillage were significantly higher than those of the cover-cropped treatments; also for these measurements, the differences were only partially statistically significant.

3.2. Canopy Growth, Light Microclimate and Disease Development

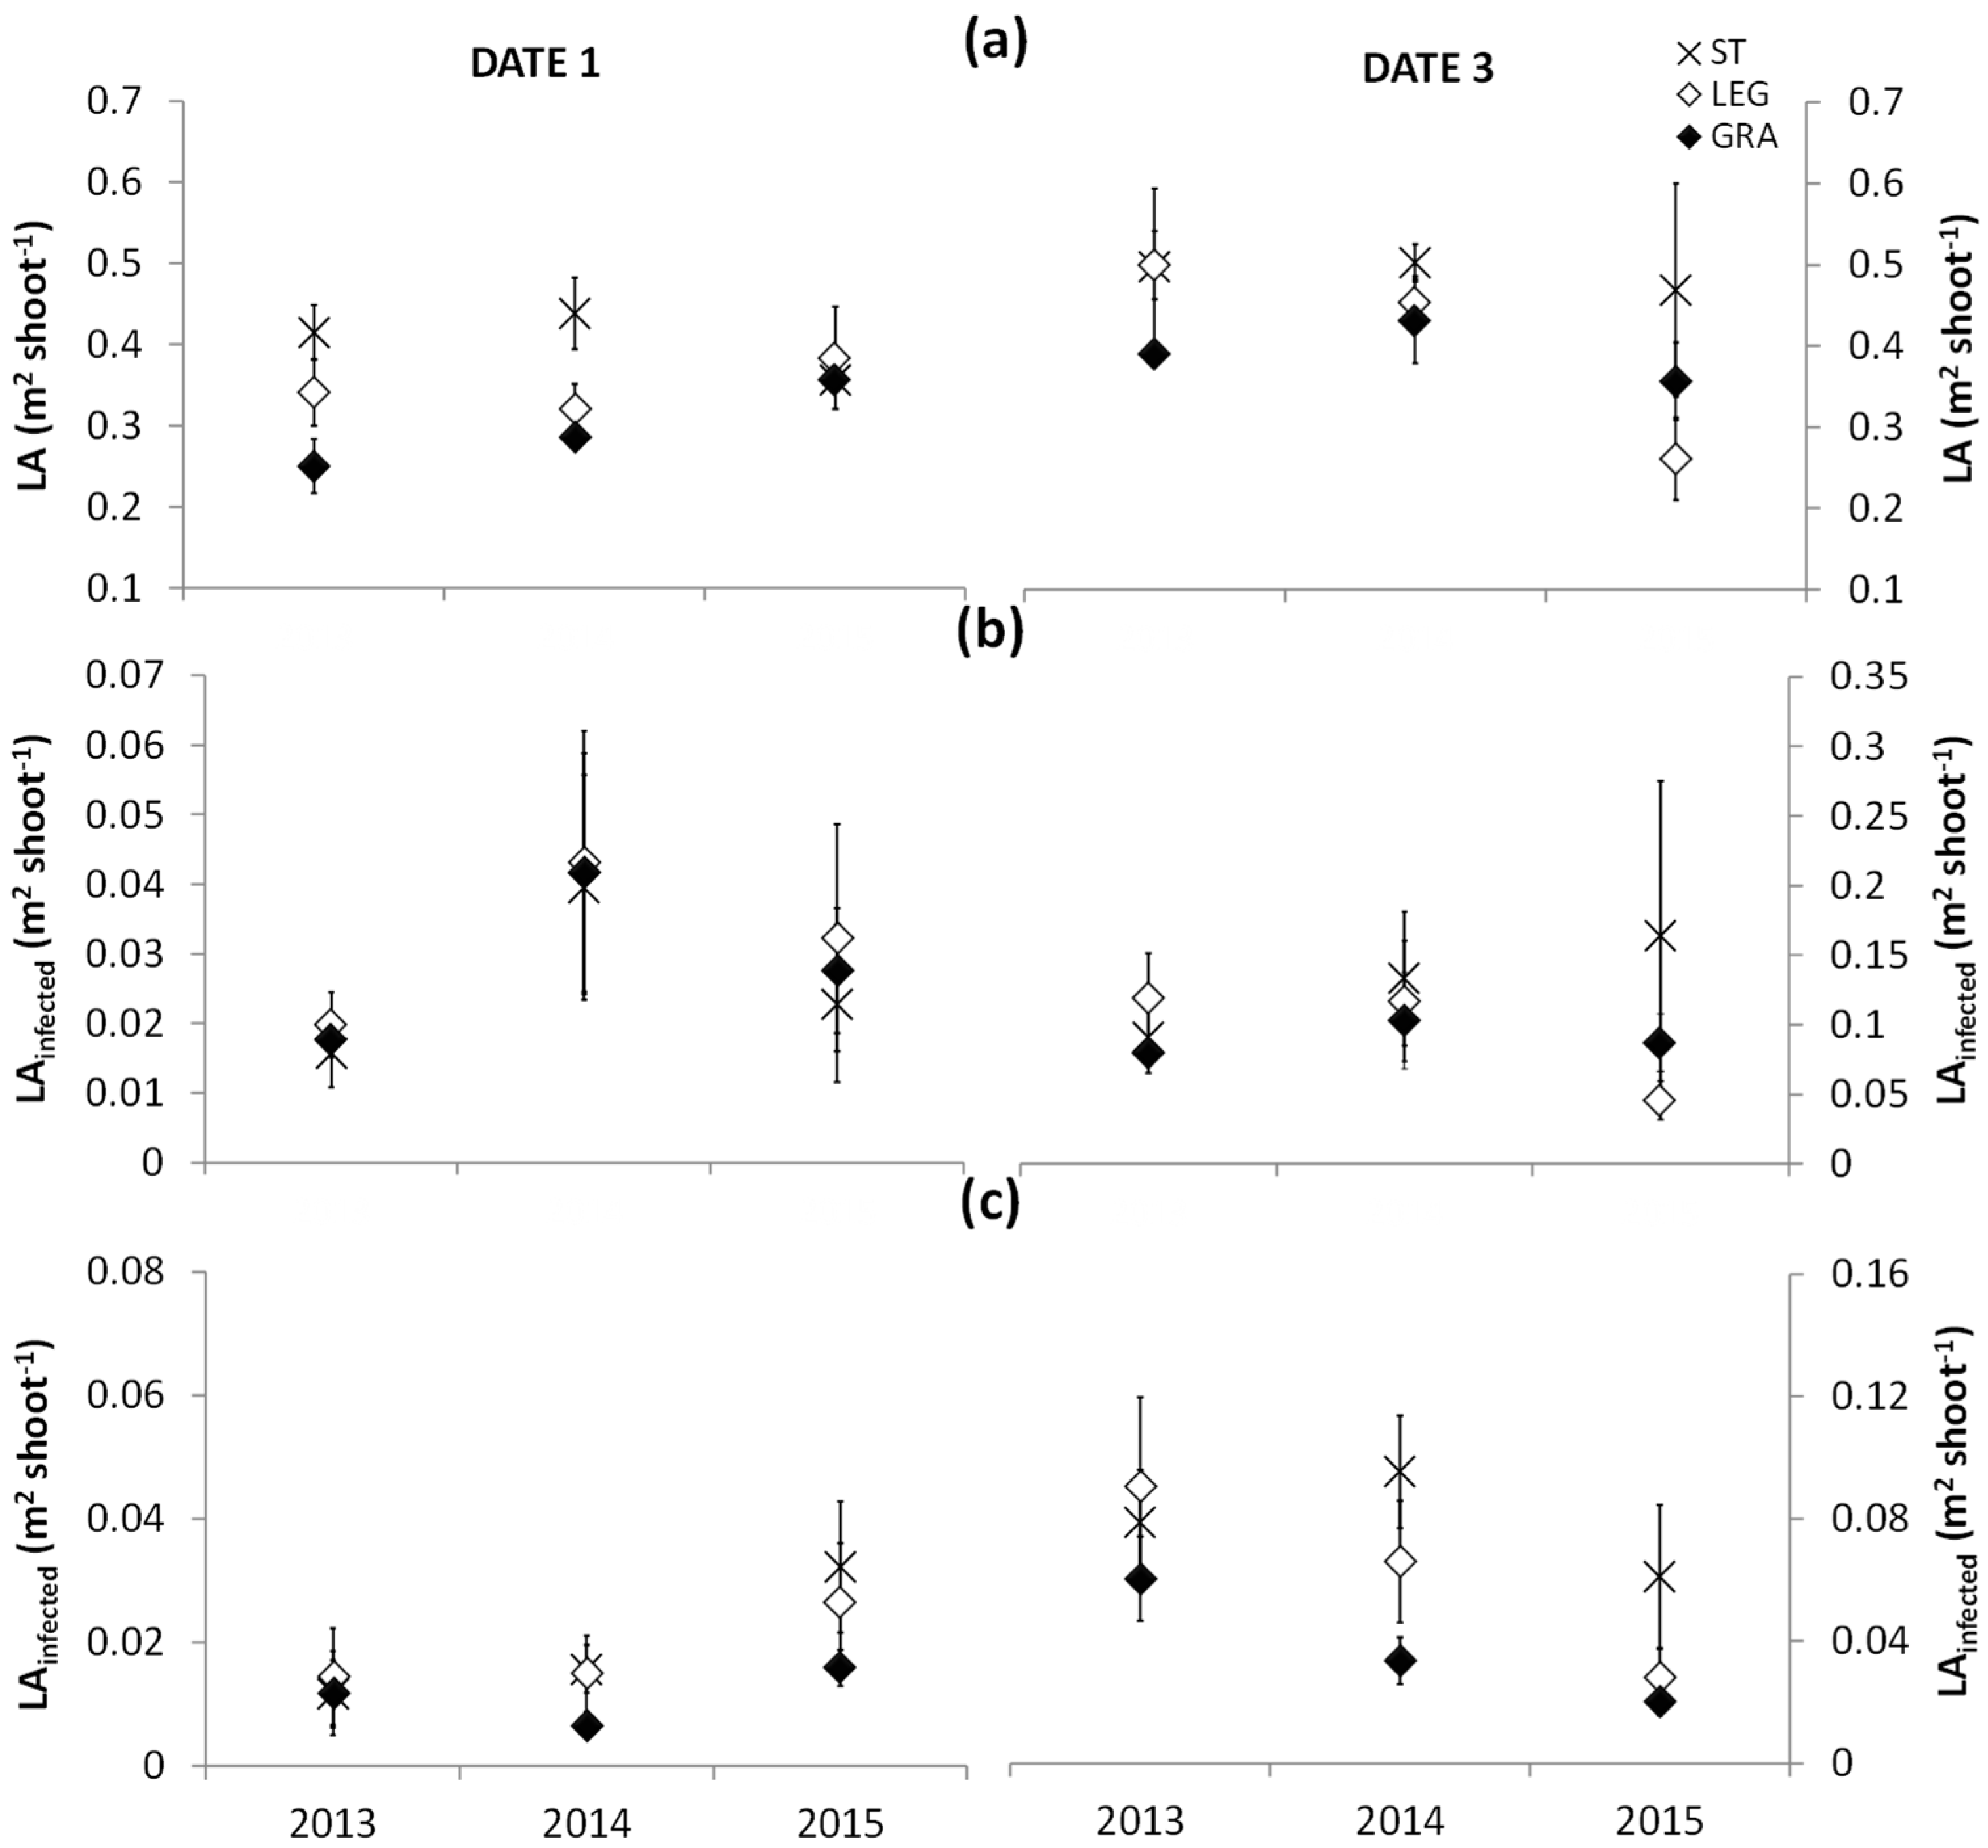
The estimation of LA growth in dates 1 and 3 showed statistically significant differences between the soil tillage and cover-crop treatments in the three study seasons (Figure 4a). During the first period of disease monitoring, which also corresponded to intense LA development, the grapevines grown in tilled soil presented higher values of total LA compared to those managed with cover crops, mostly due to a higher leaf size both for main and lateral leaves, since the number of leaves per shoot was not statistically different among treatments (Appendix A Table A1). The LA composed of lateral shoots, in 2013–2014–2015, represented, respectively, 40–40–30% of the total LA, while the LEG and GRA plants presented, respectively, 30–40–30% and 20–20–40% of the LA composed of lateral shoots. When the last disease development observations were performed (date 3), the differences in total LA among treatments were reduced and became statistically insignificant. However, an increase in the development of lateral shoots in the cover-crop plots, particularly with legumes, promoted canopy growth. In the cover-crop treatments, total LA reached similar values than those observed under soil tillage and the LA composed by lateral shoots in 2013–2014–2015 was, respectively, 50–40–50% in ST, 40–30–20% in LEG, and 30–40–40% in GRA. No significant differences in the main and lateral LA infected by downy mildew were detected among treatments (Figure 4b). Yet, it is important to highlight that the differences in LA per shoot between ST, LEG, and GRA resulted in significant differences and increases in the powdery mildew-infected LA when maximum canopy development was reached (Figure 4c). In fact, the ST canopies presented significantly higher average values of LA infected by powdery mildew than GRA in date 3 (Table 2). Among the two cover crops, higher values were recorded in LEG (Figure 4c), though not statistically significant. These results confirmed those obtained by Valdés-Gómez et al. [40], who observed a major explanatory role of the number of leaves per shoot, and thus of canopy vigor on powdery mildew development in early season.
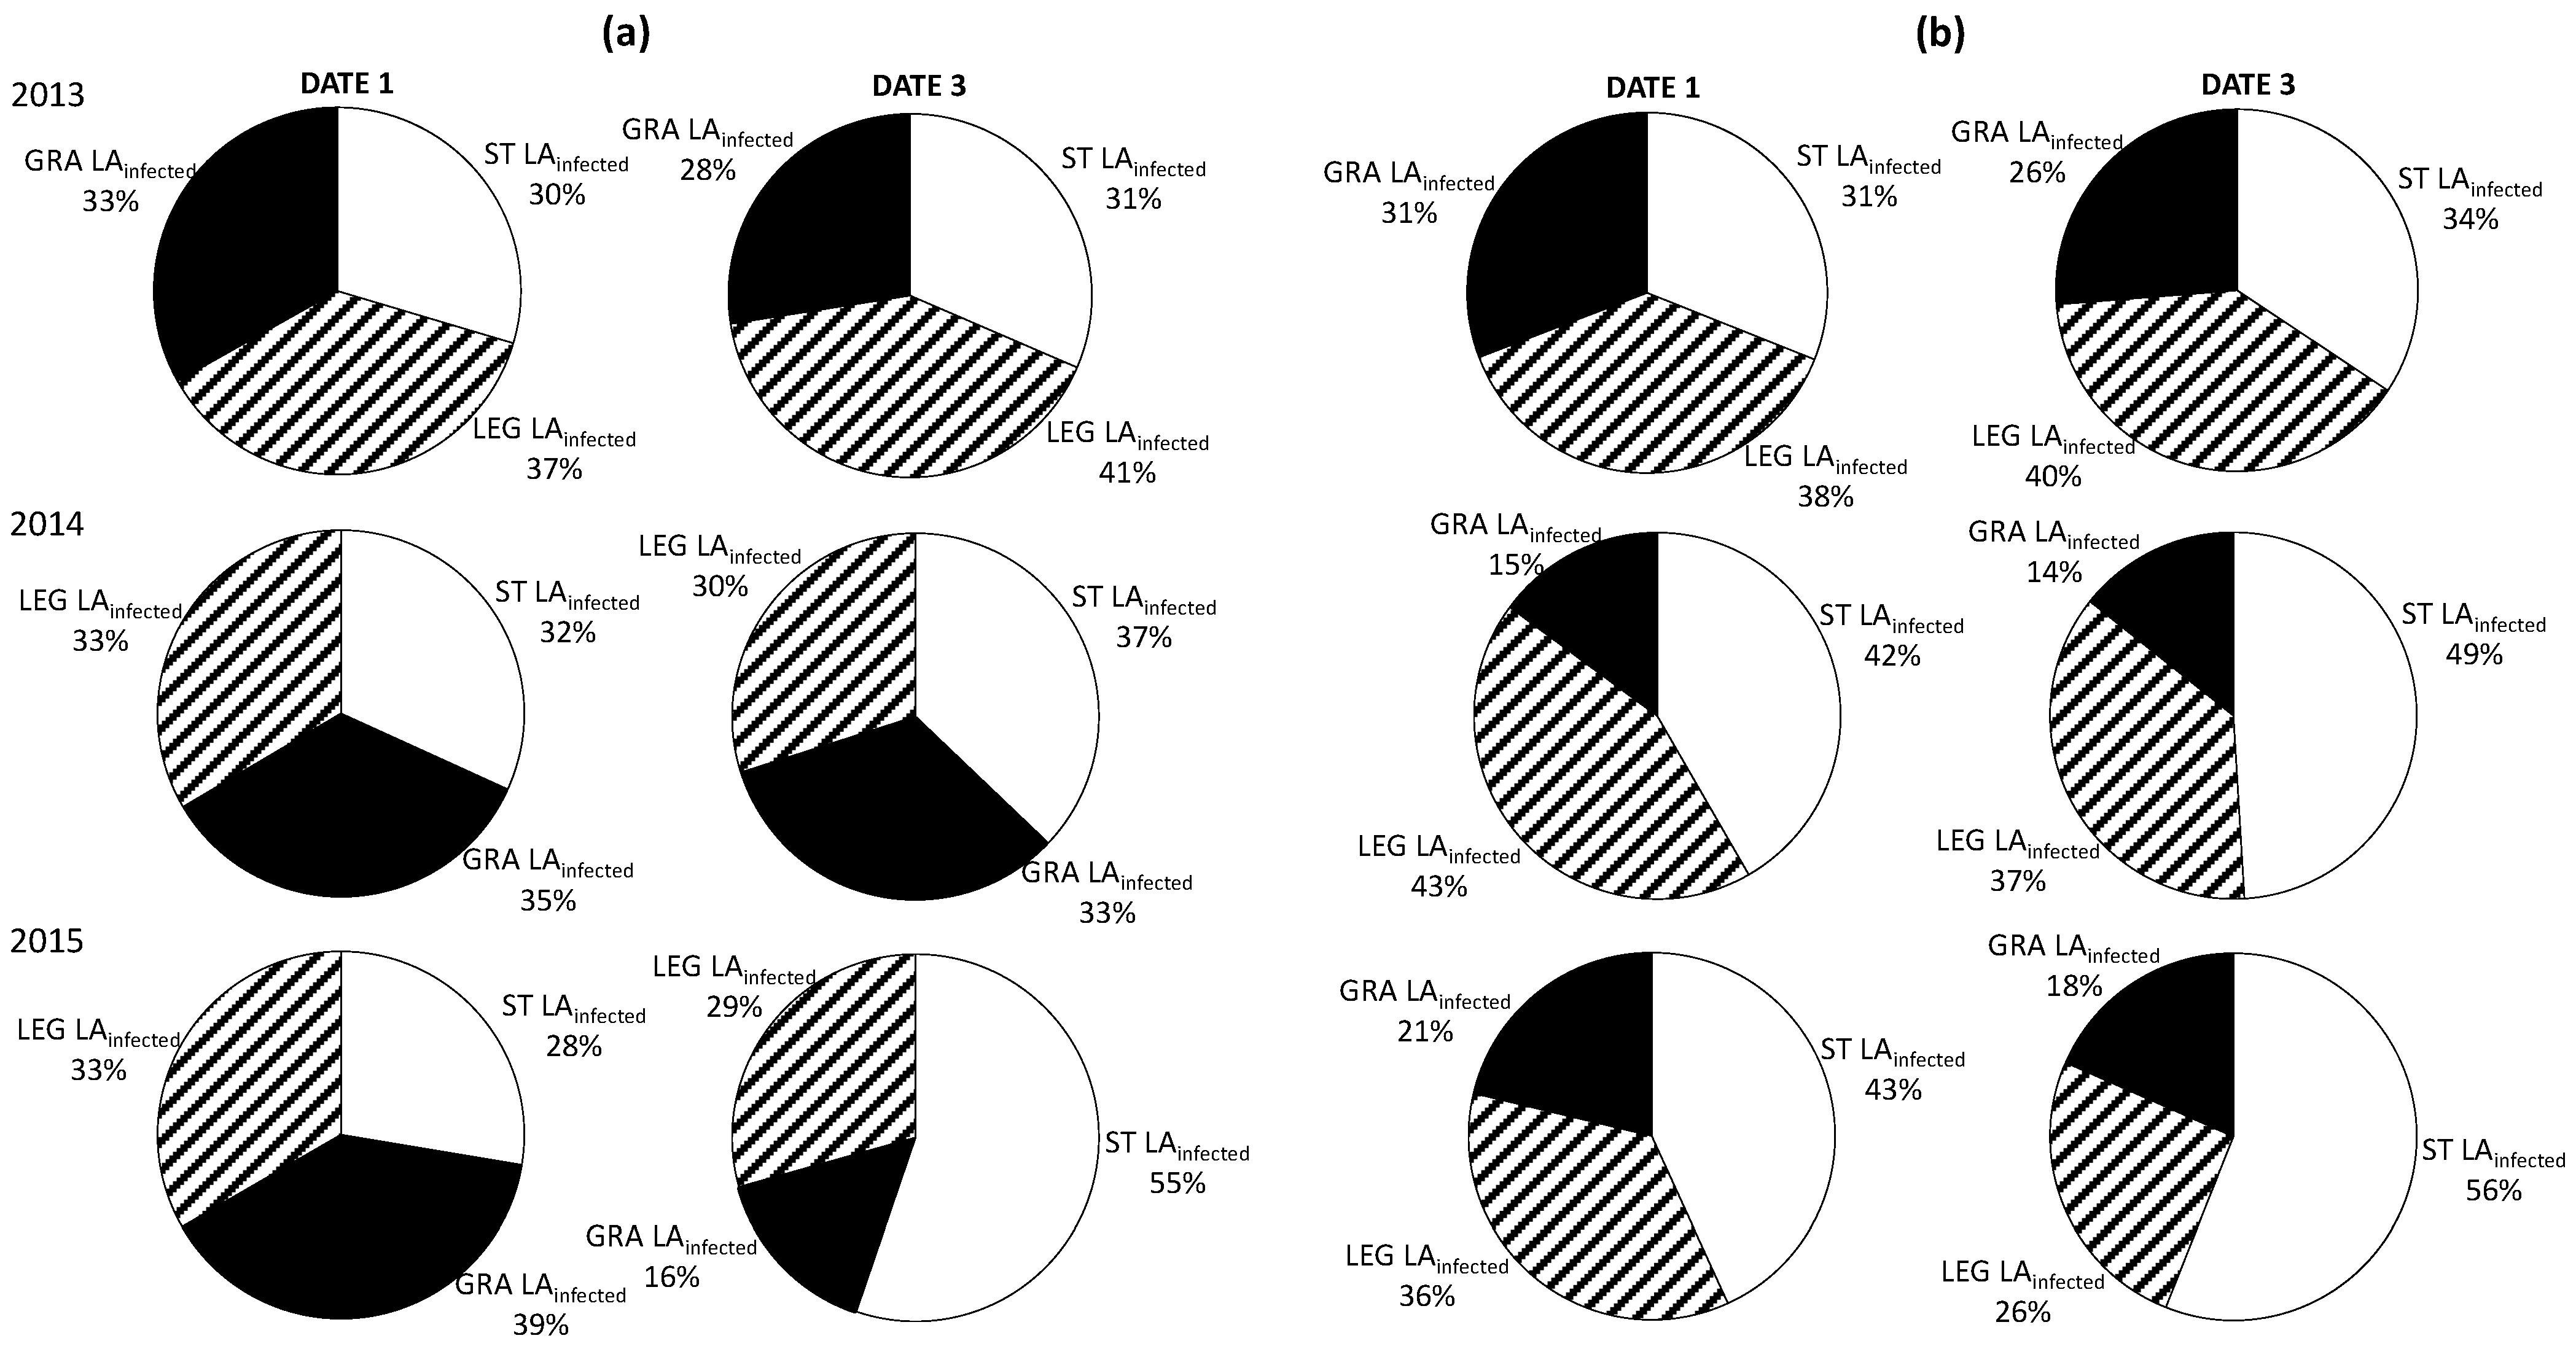
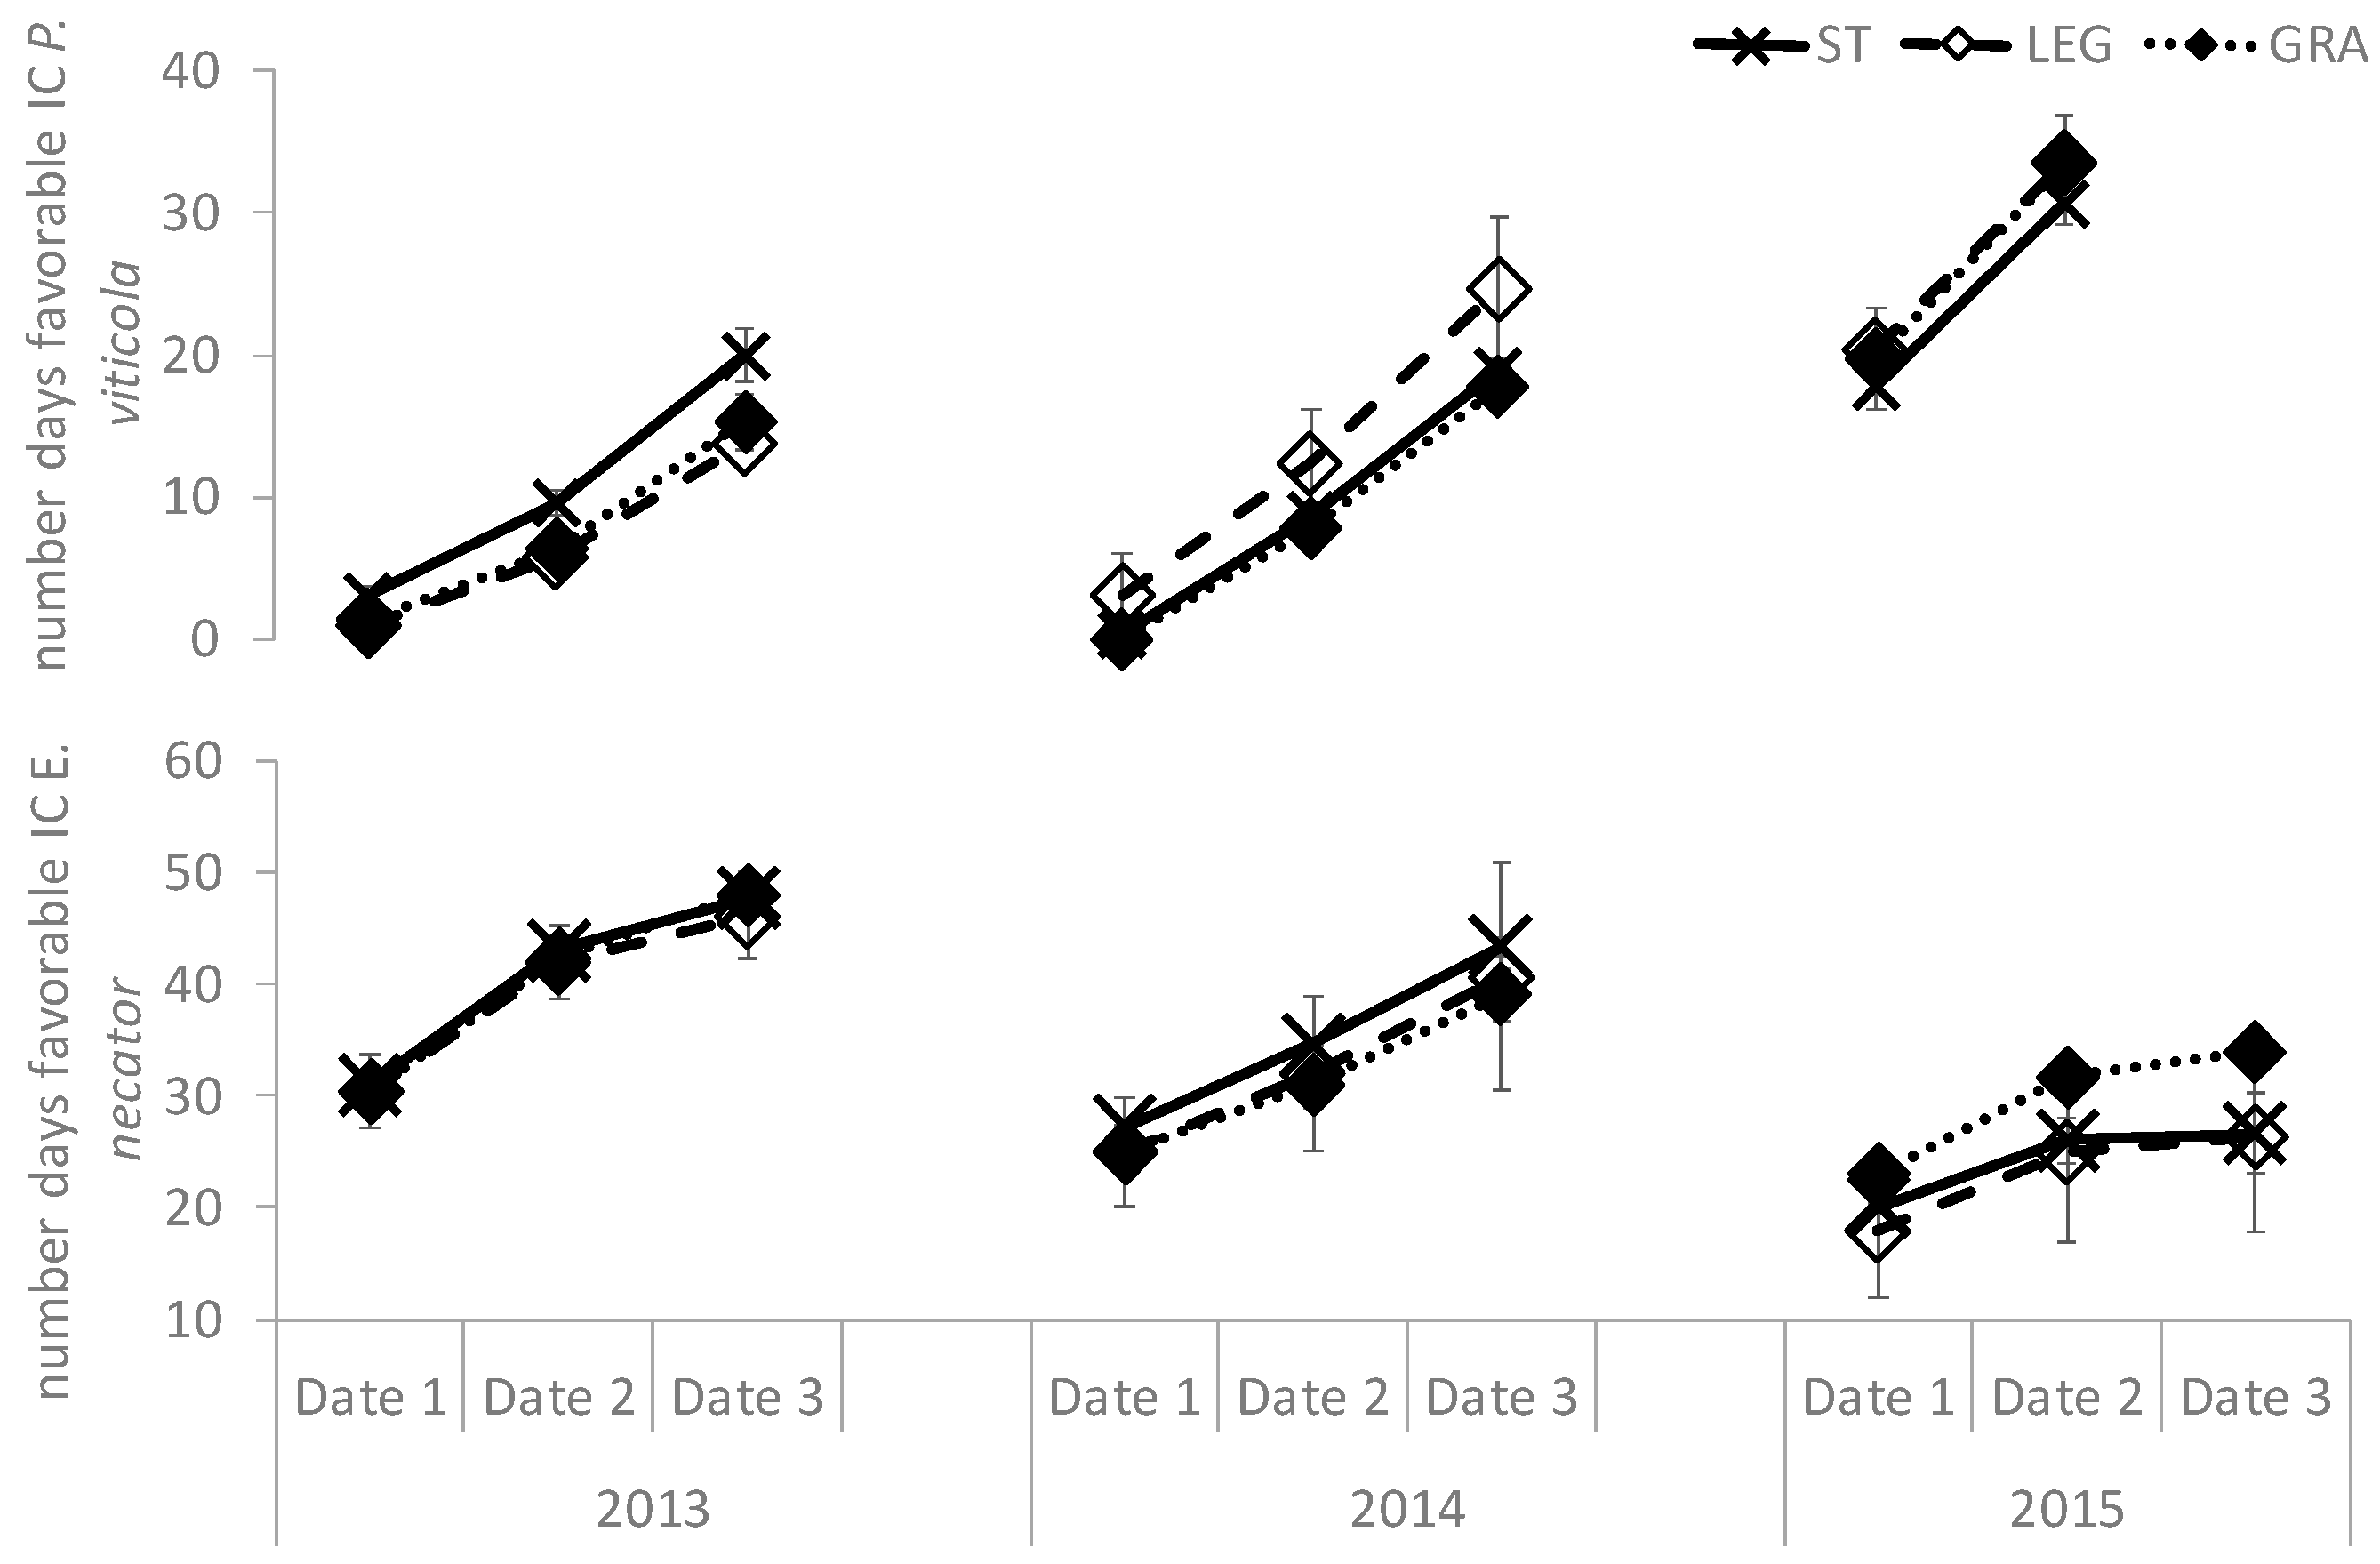
However, soil management treatments influenced the development of both diseases in the long term. In 2013, the proportion of infected LA was similar in the three treatments for both diseases (Figure 5) while it increased significantly in ST as compared to the cover-cropped plots in the subsequent years. During the first season, higher proportions of both downy and powdery mildew-infected LA were detected in LEG grapevines. In 2014, the proportion of LA infected by E. necator was significantly lower in GRA-treated vines, right from the first dates of disease observation, while the differences in total LA affected by P. viticola were not significant between the cover-crop treatments. Finally, in 2015, the spread of downy mildew in GRA plants was significantly lower in date 3 and the differences between the two cover crops increased, while for powdery mildew the differences between LEG and GRA were flattened.
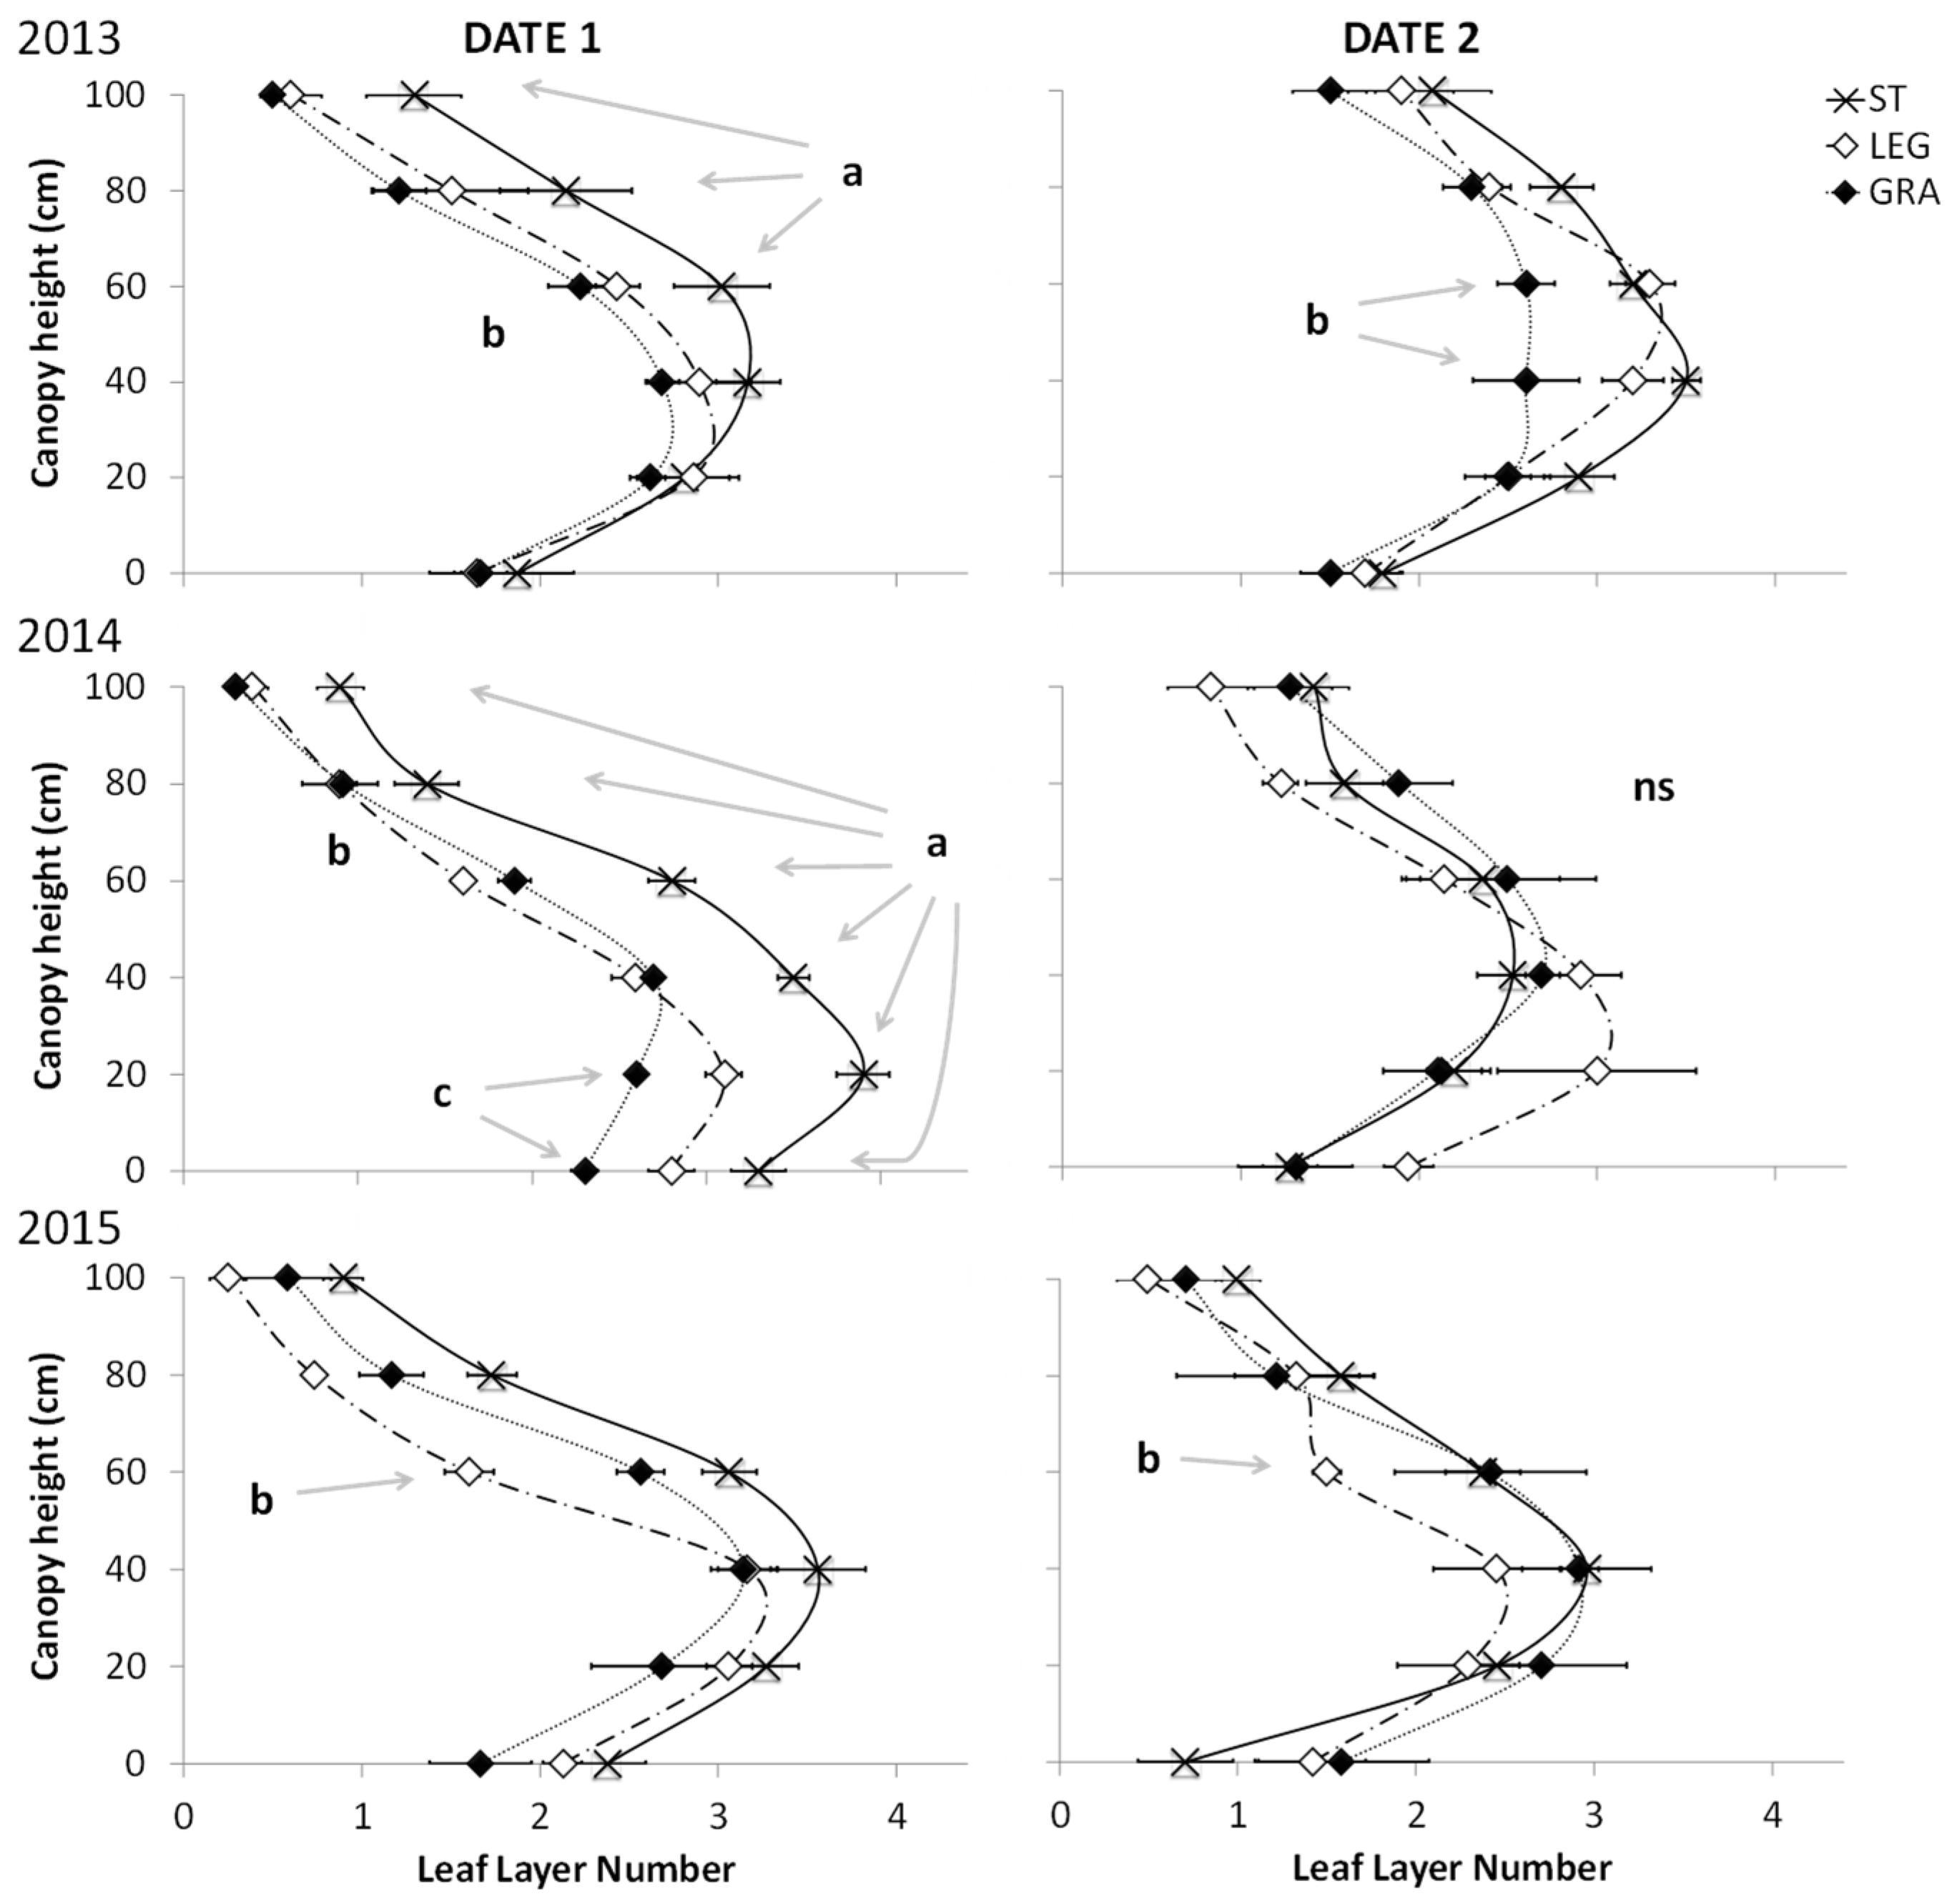
During the period of intense canopy growth and up to fruit set (date 1), soil tillage induced a higher canopy density, both at the cluster level and in the above parts of the canopy (Figure 6). The higher density was characterized by a higher LLN, lower porosity (particularly in the top 80–100 cm), and a higher PIL (Table 3, Figure 6).
When the last disease monitoring observations were performed (date 6), differences among treatments concerning canopy density were only statistically significant at the mid canopy height in 2013, when lower values were recorded in GRA. Furthermore, the two-way ANOVA showed the significant effects of season on the mean canopy density variables in the last date of disease monitoring, and a significant effect of soil management in the first date of disease observation (Table 3), with a lower porosity, as well as higher LLN and PIL in ST plants compared to those under cover crops. The percentage of exposed clusters was not statistically different between treatments and years.
The measurements of canopy wall size also showed a higher and wider structure and a larger exposed LA in the vines with soil tillage than in the cover-cropped ones. The highest values were measured in date 2, in ST canopies (about 2.8 and 3.3 m2 per vine of exposed LA and 40 and 43 cm of average width, in 2013 and 2014, respectively), and the lowest values were measured in GRA (about 2.9 and 3.1 m2 exposed LA and 39 and 37 cm of average width, in the first two seasons). However, both the exposed LA and leaf wall width measured in LEG were not statistically different from that observed in the GRA or ST plants (respectively, about 2.9 m2 and 42 cm in 2013 and 3.2 m2 and 38 cm in 2014) (data not shown).
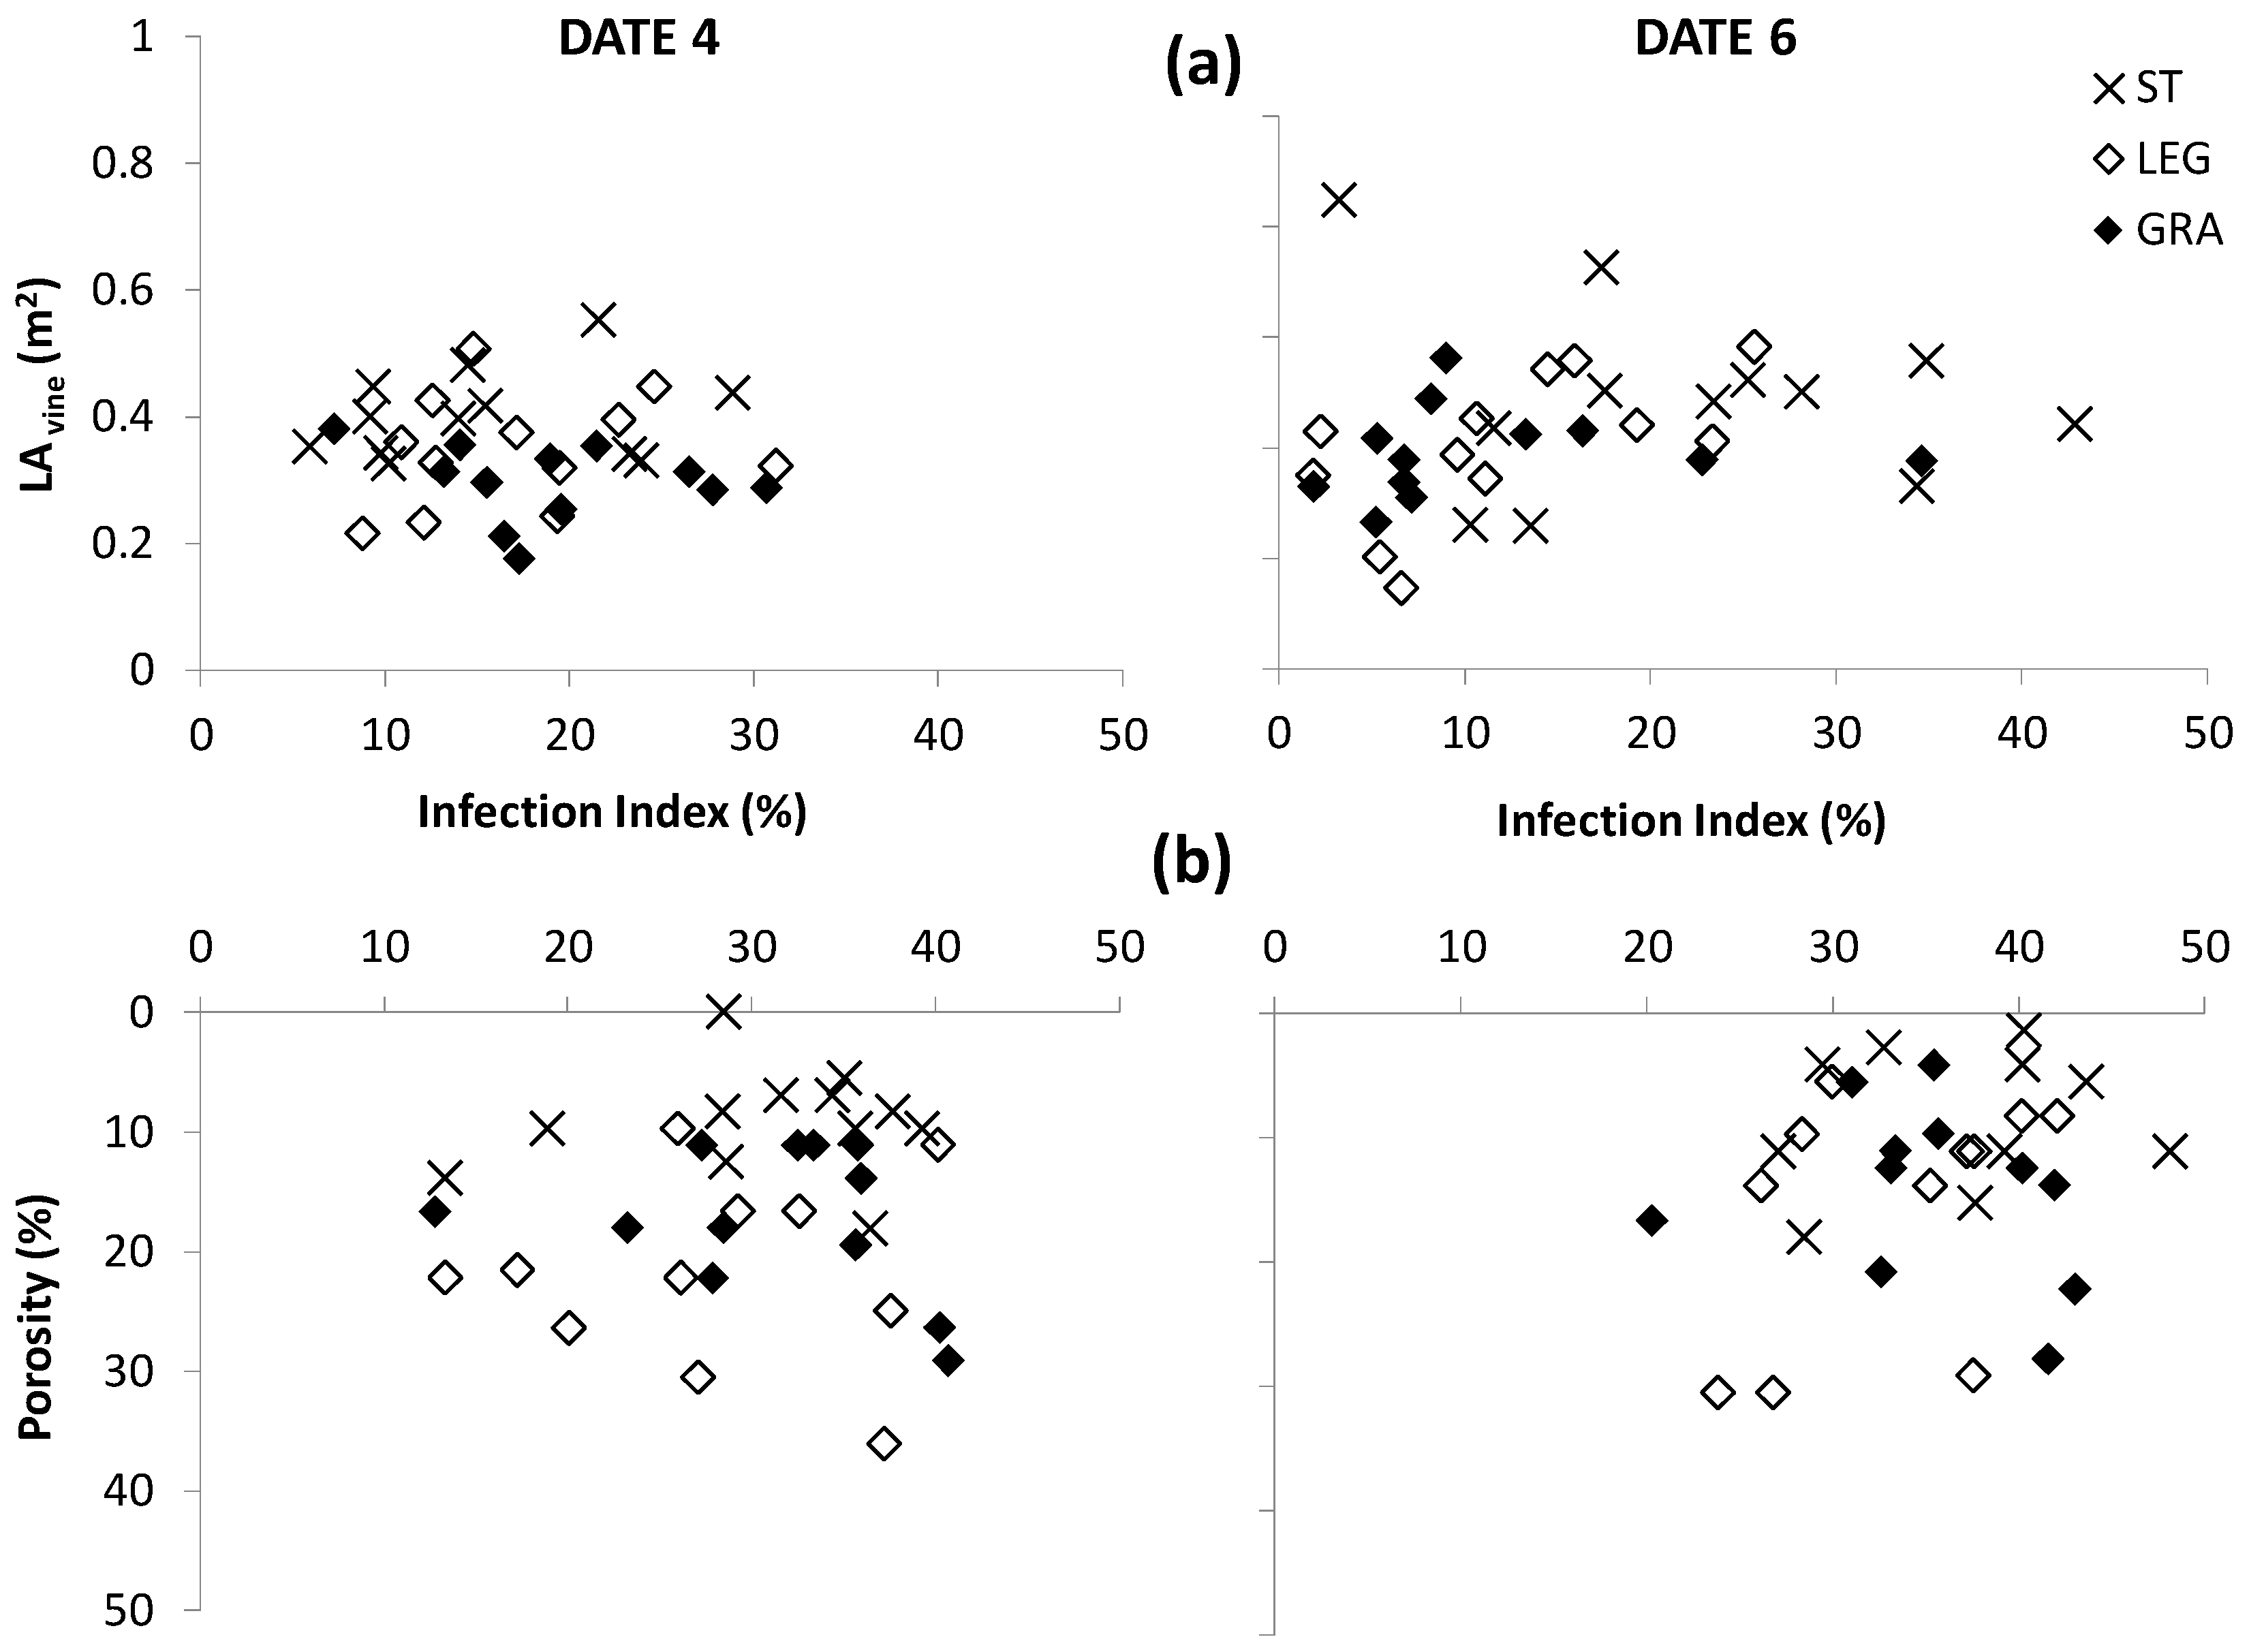
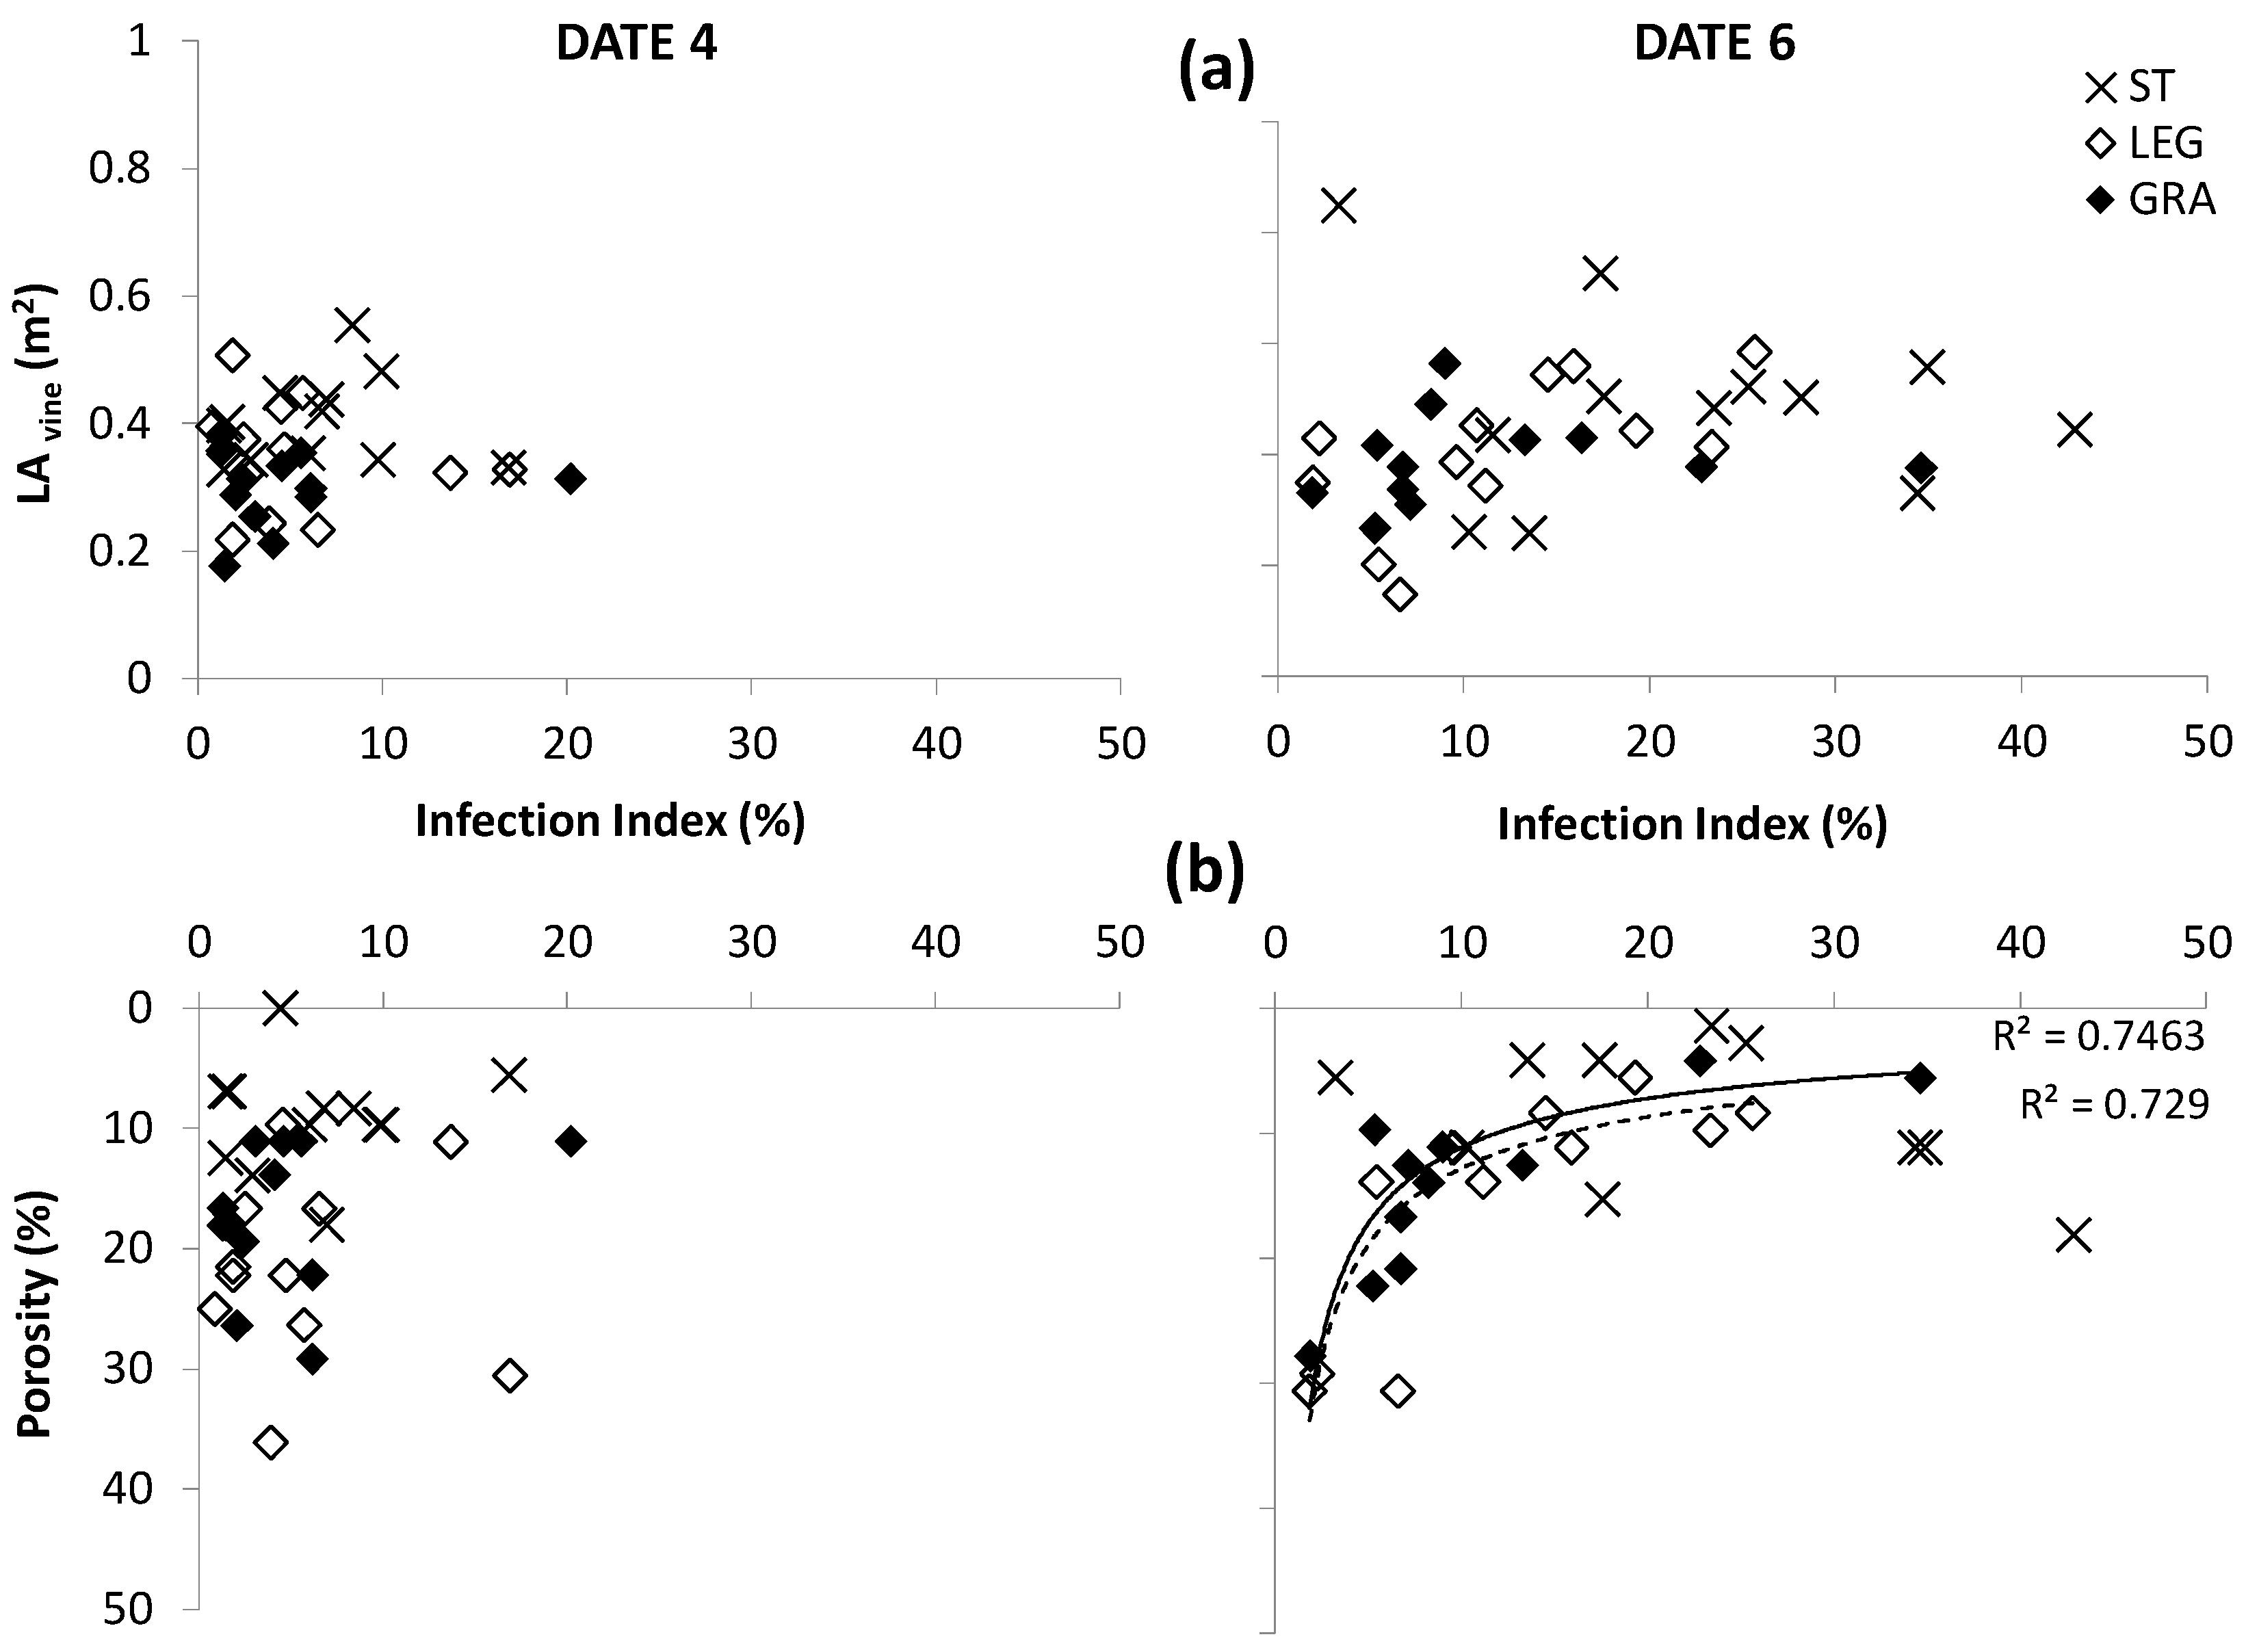
Besides LA growth, also the differences in canopy porosity among treatments had a significant effect on the spread of powdery mildew on the canopy wall after the first observation date but the relation between canopy density and disease spread was not clearly evident for downy mildew (Figure 7 and Figure 8). In fact, taking into account the average data of the three-year study period, no simple regression between the total LA and infection index was observed in all treatments (Figure 7a and Figure 8a).
However, the cover crops resulted in a lower canopy density and this played an important role in reducing the spread of E. necator in the canopy wall (Figure 8b). By observation date 6, for the vines subjected to cover-crop treatments, it was possible to represent the development of powdery mildew infection on the canopies with a similar logistic curve, which is the typical model of micro-organism population growth whenever it is strongly dependent upon the available biomass [41].
When the biomass was evaluated as a function of leaf N, expressed by the mean SPAD values (Table A2), significantly higher N were found on the grapevine leaves of ST and LEG compared to GRA, in seasons 2013 and 2015 [35]. Besides, for the first period of disease development in all three years of the trial, the GRA leaves showed lower values than the other two treatments. Moreover, in 2014, leaf N was significantly different among all treatments in date 1—lower in GRA and higher in ST—as compared to the data collected in date 2. When the last observations of disease symptoms were performed (date 3), the differences in SPAD values between GRA and LEG had already increased, due to both the increased N values in LEG and decreased N in GRA. These differences in leaf N among grapevines under soil tillage and cover crops were probably fostered by the complete soil cover. In most studies conducted in Mediterranean climate conditions, mineral balance differences are evident in soil samples and slight in grapevine leaves and petioles [42]. Besides, legume cover tends to induce higher N contents than soil tillage under cover-cropped inter-rows [43,44,45].
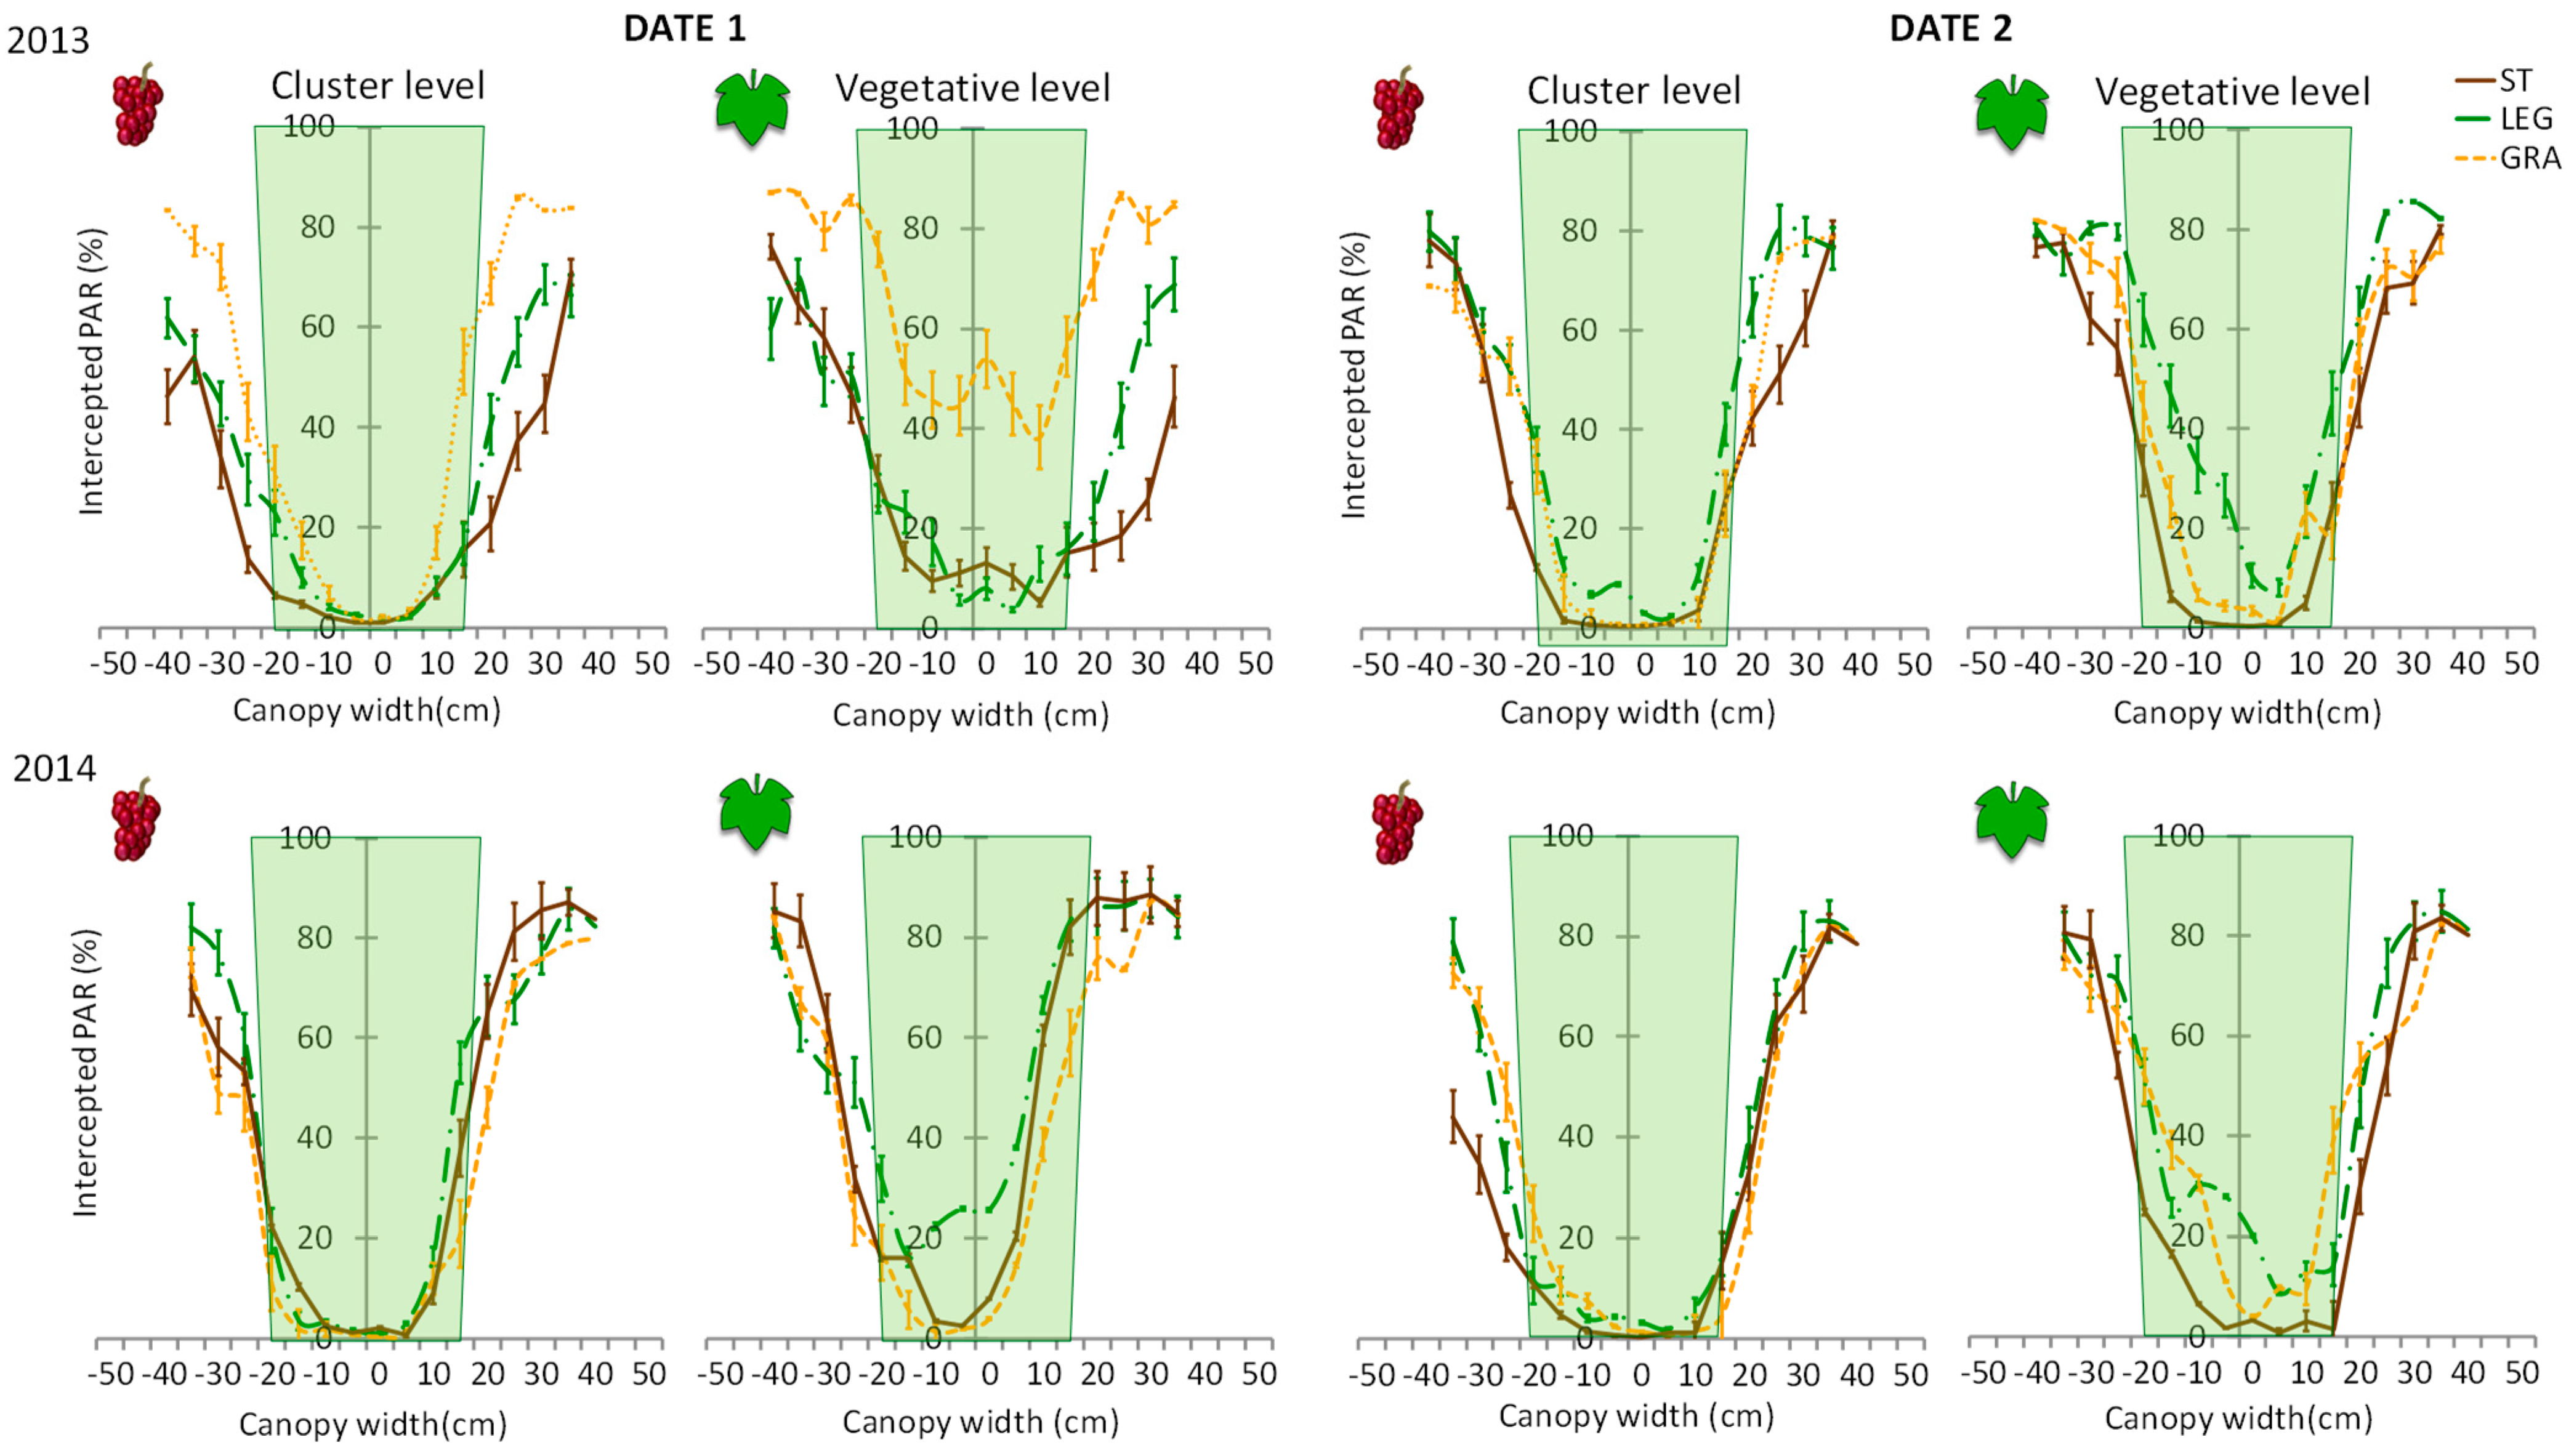
The PAR measurements carried out close to date 1 of the disease observations in shoots showed greater light interception in the inner canopy layers of GRA. Statistically more significant differences were observed at the middle canopy height rather than at the cluster level, and in the tilled plots, significantly less sunlight penetration occurred (Figure 9). Taking into consideration that the PAR measurements were performed at the solar zenith, the magnitude of the differences among treatments in sunlight penetration into the inner canopy layers was considerably different across the day [30].
Overall, these results are in accordance with those of Guerra and Steenwerth [12], who observed a higher canopy efficiency and better growth balance, leading to less favorable conditions for disease development in cover-cropped vineyards. The competition for water and nutrients among grapevine and cover crops, which may lead to yield reductions [5,35], also determines a better light microclimate and canopy balance for improving berry composition [46,47].
The greater development of powdery mildew on the plots managed with soil tillage is related to the effects of the higher vigor and shade on the canopy light microclimate. In fact, throughout its life cycle, E. necator develops on the outer surfaces of the leaves and berries and thus can be exposed to the negative effect of direct sunlight incidence on the external canopy layer and/or of a sun-fleck on the inner canopy layers of a sparse canopy. Similarly, Austin et al. [48] reported the important role played by both canopy density and sunlight levels in the canopy on reducing the development of powdery mildew at the cluster zone.

3.3. Weather and Canopy Microclimate

The meteorological patterns during the grapevine growing cycle were quite different among the three seasons (Figure 10). Season 2013 was the wettest and rainiest, particularly in April and May, while 2015 was the driest, with a higher frequency of days without rain and with the lowest frequency of rain events of more than 10 or 20 mm. In 2013, lower average temperatures were recorded during the summer, yet the air temperatures were frequently close to the 26 °C class than in the other seasons. In contrast, in 2015 the air temperature was higher throughout the season, with a much higher frequency of maximum temperatures close to 32 °C. Such differences among seasons had a major influence on the development of both diseases as stated above.
The influence of canopy microclimate conditions on disease development for both downy and powdery mildew was demonstrated when comparing the patterns of the infection index monitored in grapevine shoots (Figure 2 and Figure 3) with the accumulated number of days with a favorable IC along each season (Figure 11). The IC patterns for downy mildew matched closely those of I%I in each treatment yet the differences among treatment concerning powdery mildew I%I values did not correspond to a significantly different number of days with favorable IC.
The differences among treatments concerning micrometeorological conditions for the development of downy mildew infections were evident in the three dates of shoot monitoring of 2013 and 2014 (Table A3). In 2013, ST presented the most favorable conditions for infection and a less favorable microclimate was found in both cover crops. In 2014, a higher number of days with good conditions for infection were recorded in LEG and ST, while in GRA the number of days was much lower. In 2015, the differences among treatment were not statistically significant. Regarding powdery mildew, the differences found in canopy temperature and relative humidity inside the canopy did not induce significant differences among treatments concerning the microclimate conditions for infection and the RAI class along the season.

3.4. Weight and Interaction among the Epidemiology Factors for Disease Development

In the three-year period, cover crops induced a lower canopy development and density than soil tillage. The differences in canopy structure and density induced in the ST grapevines a lower radiation interception at the cluster zone and in the inner canopy during the stages of intense canopy growth. However, the development of lateral shoots after fruit set allowed to reach, in the cover-crop plots, LA values similar to those of the tilled plots, especially in the LEG treatment. Nevertheless, light penetration into the canopy of the GRA plants was greater. For this reason, under high grapevine vigor conditions, the use of grass cover crops may also be an effective means to guarantee good canopy microclimate conditions and therefore reduce the need for leaf or lateral shoot removal operations during berry growth and ripening stages.
In addition, to assess the influence of soil management on plant diseases, other than the infection index, it is important to consider the infected LA and the differences in canopy density among treatments, in order to evaluate the actual spread of diseases in the vineyard. As observed in this study, differences in average leaf size, LA, or leaf age can exert significant effects on both tissue attractiveness and the overall extent of the attack, which may foster the differences in infection among treatments to become significant [44].
Taking into account the strong inter-annual variability that can be found in the vineyard, due to both the duration of the weather conditions favorable for the development of diseases and the evolution of the cover-crop composition and settlement, it is essential to identify and weight the relationships between the set of explanatory variables that show correlations with disease incidence under the different soil management regimes.
As far as downy mildew is concerned, it is likely that the main effect of the meteorological pattern was the most influential factor regulating the development of P. viticola, since no significant differences among treatments concerning disease development were observed in the fields during the whole study period. A similar result, as well as the major dependence of disease development upon weather conditions, have been previously reported [28,49]. Furthermore, the role played by direct sunlight exposure is probably less influential on the development of this disease, in contrast to E. necator, as the downy mildew infections take place in the dark and develop inside the leaf and berry tissues without any exposure to direct sunlight, as is the case for powdery mildew. To better elucidate this issue and in order to weight the relative importance of the variables affecting disease development and the relation among them in each soil management treatment, a multifactor analysis was performed for dates 1 and 3 of both diseases development in shoots for the whole study period (Figure 12 and Figure 13).
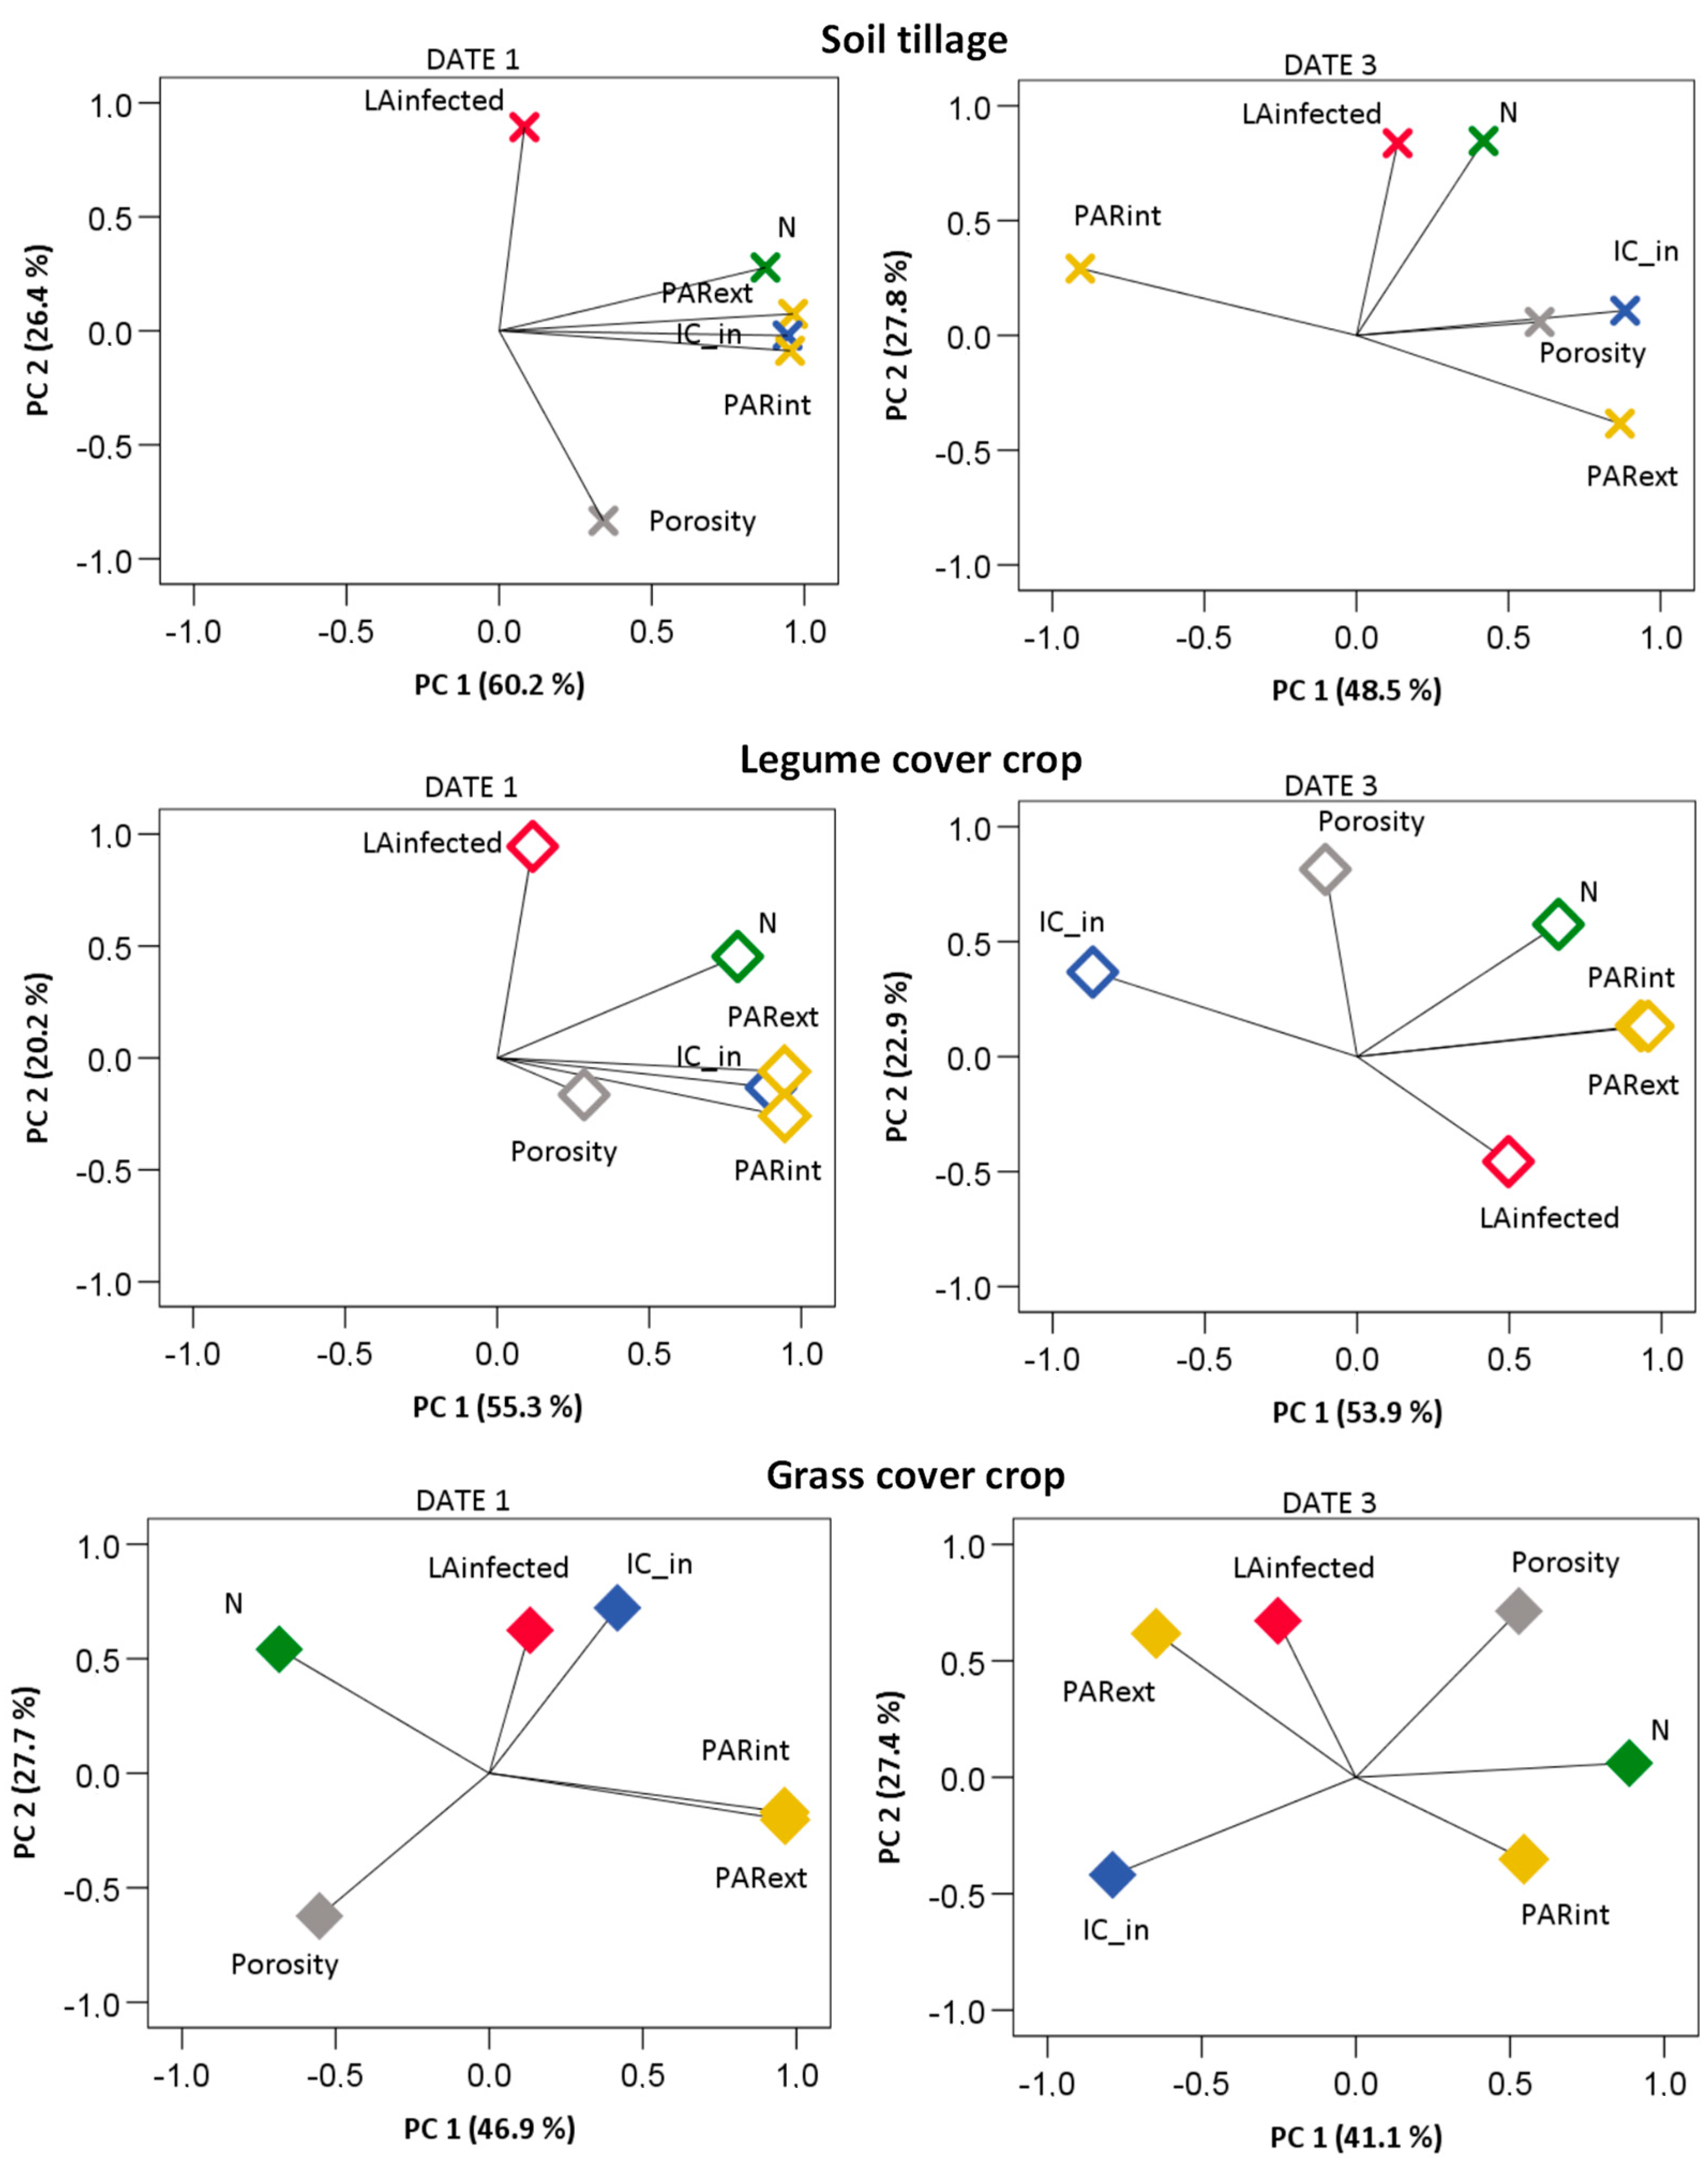
The multifactor analysis confirmed a weaker influence of the hygrothermal conditions inside the canopy compared to the growth, N, and canopy density factors on downy mildew development than that observed for powdery mildew. The variation in these variables was mostly explained by two principal components (PC), which represented, respectively, about 87, 80, and 75% of the whole variance in ST, LEG, and GRA in date 1 of the disease observations, and about 76, 77, and 69% by the last date of disease monitoring in grapevine shoots (Figure 12, Table A4). During the first observations of disease symptoms in ST, infected LA and porosity evolved along PC 2, while a favorable IC, canopy PAR levels, and N variations were explained by PC 1. In LEG plants, the infected LA variation was mostly related to N, along PC 2, while the other variables varied along PC 1. The infected LA of GRA varied with N along PC 2. Yet, also porosity and the weather conditions for infection inside the canopy were related with the infected LA in PC 2.
By the time the last disease symptoms were observed in the shoots, N variation had already assumed a strong relation with infected LA along PC 2 in ST, while the other factors varied along PC 1. Meanwhile, in LEG plants, the variation in LA infected by downy mildew was partially related to the light and hygrothermal conditions for infection inside the canopy, in PC 1, and with porosity and N along PC2. During last disease observations, the infected LA of GRA varied along PC 2 with porosity and high PAR levels at the external leaf layers, and also with the PAR levels inside the canopy along PC 3.
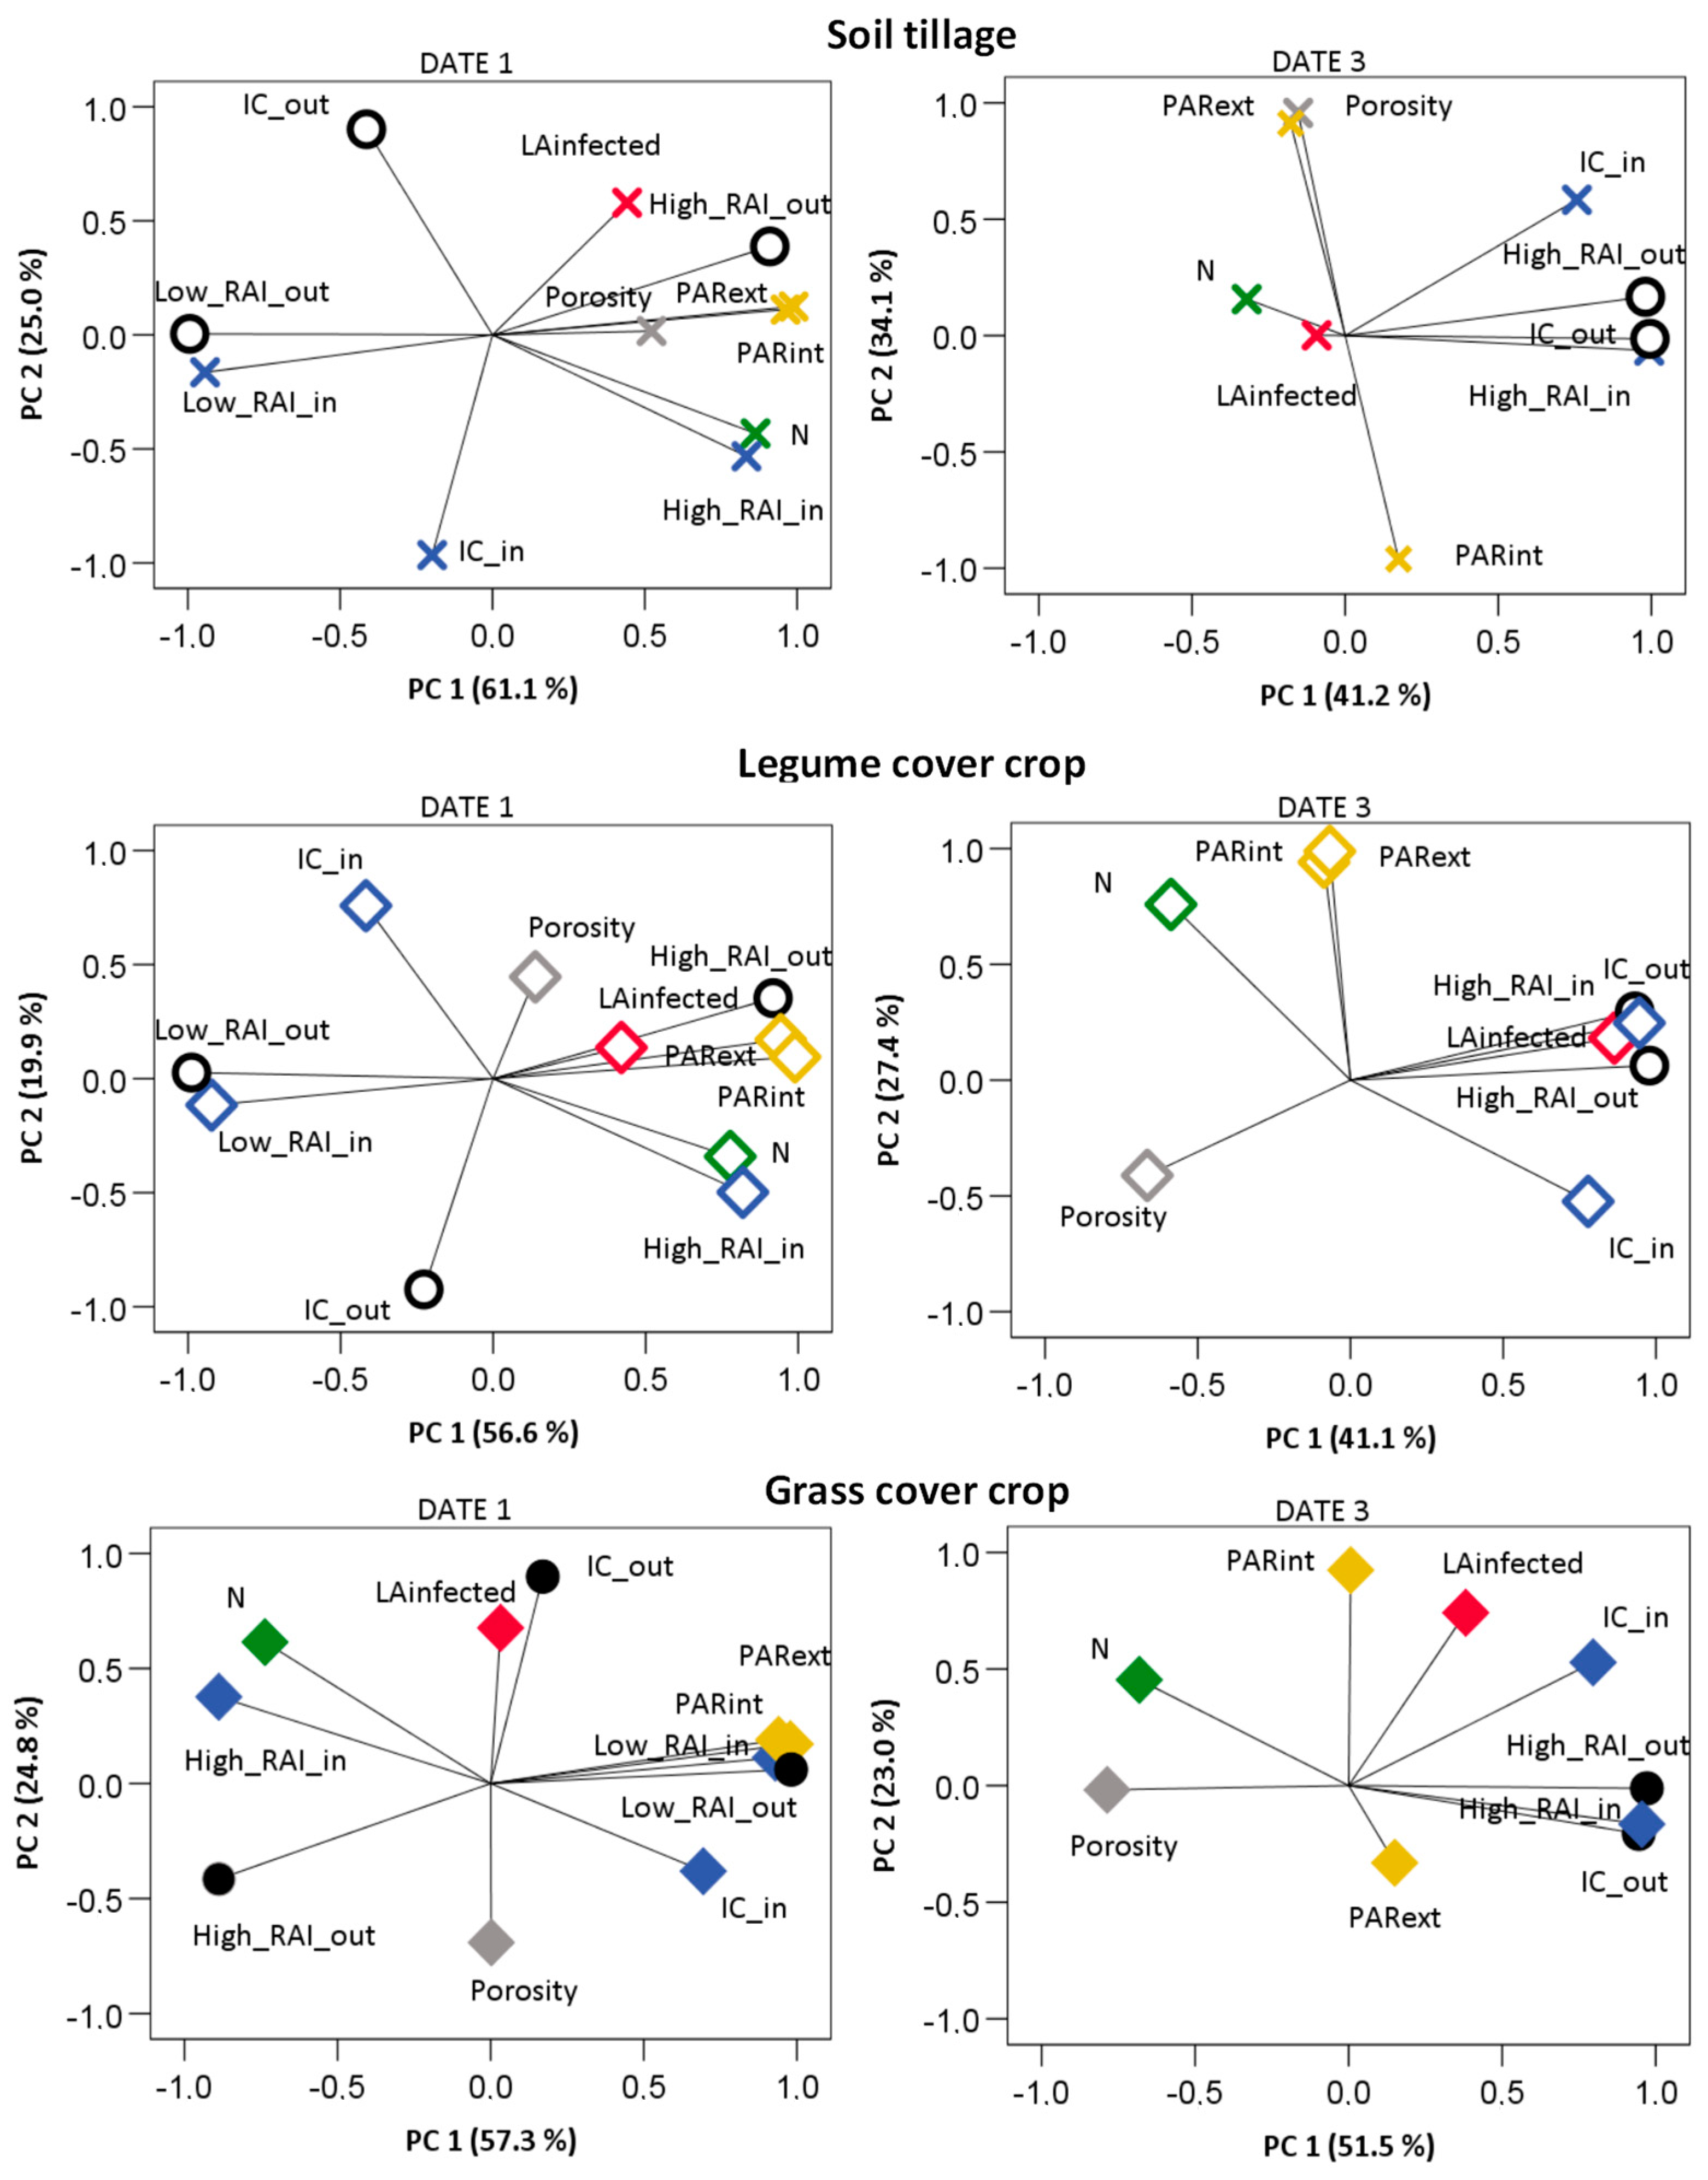
With regard to powdery mildew development, the canopy growth, leaf N, and microclimate variables showed a different relative importance on disease development in the three treatments, on the first and third monitoring dates (Figure 13, Table A5).
Overall, for the first observations of powdery mildew, about 86, 77, and 82 % of the variation in the treatments ST, LEG, and GRA were explained by two PCs. For ST, PC1 correlated the variation of infected LA with N, PAR, and the RAI classes both inside and outside the canopy, while PC 2 mostly grouped infected LA with IC inside and outside the canopy. Similar relationships were observed in LEG, but the infected LA also correlated with IC_out along the PC 2 and a third component related the infected LA with porosity and N. The importance of PAR interception in the disease pressure for ST canopies is consistent with an increase in disease severity in shaded canopies, as reported by Austin and Wilcox [50], thus confirming the important role of light microclimate on the development of powdery mildew. In GRA plants, the infected LA correlated well with IC_out and porosity along PC2, but IC_in and all the outer weather and microclimate variables correlated poorly with the infected LA in the first stages of disease development. These results highlight the major role of the canopy temperature and humidity in the first steps of disease development in ST and LEG, while in GRA canopies the air atmospheric condition and low canopy density were the main factors affecting infections and disease pressure at its first stages of development, along the three years of the trial. As the disease evolved, the weight of the two principal components decreased slightly to 75% in ST, 69% in LEG, and 75% in GRA. The decreases were not caused by a weaker influence of canopy light, weather, or hygrothermal conditions for disease development, but were rather due to an increase in the relationship among the infected LA and N in ST (along a PC 3; Table A5) and, conversely, in LEG, with a lower correlation of the PAR levels and N with disease development. Date 3 corresponds to an advanced stage of the cover-crop growth cycle, and it is probable that the nitrogen fixation activity had already decayed in the LEG cover crop. This result is consistent with those of Patrick et al. [13], who observed the higher potential of a legume cover crop to supply N to the grapevine during the stages of intense canopy growth and until fruit set. Celette et al. [51] also observed a stronger linkage between the cover crop and mild nitrogen stress in the vineyard during the early canopy growth stages. Regarding GRA, the infected LA correlated the most with the high levels of PAR at the inner canopy layers and also correlated with PAR in the outer canopy along PC3. Still, porosity and N correlated with infected LA along PC1, as well as with the hygrothermal conditions for disease development and pressure. It is likely that a decrease in pathogen activity occurred due to the higher exposure of the canopy to high solar radiation intensity, both in the inner and outer canopy layers of GRA, as observed also by Austin et al. [48] in cluster layers. Our results also suggest that in GRA grapevines, both the leaf N decrease and higher canopy exposure may have led to higher dryness and hardness of leaf tissues (typical of older leaves), which are less attractive to the pathogen. In fact, in date 3, PC3 of the GRA treatment concerned mostly the PAR levels, evolving in a different direction from both canopy growth and disease development. Conversely, in ST at this stage, a strong relationship between the high leaf infection and N resulted in a third discriminant component, which brought the explained variability to 91%. Meanwhile, the affected LA of GRA was still highly correlated with the conditions for infections, to RAI and porosity along PC 1, and inversely correlated with the internal levels of PAR in PC 2.
Therefore, the low density of the GRA canopies allowed for the positive effect of higher sunlight levels, reducing both diseases’ incidence and pressure in the vines managed with a grass cover crop, while the impact of the legume’s nitrogen fixation on disease development in grapevine leaves of LEG was less important than the effect of nitrogen availability in the ST on grapevine susceptibility to both downy and powdery mildew.
Among the benefits of a grass cover crop in vineyard observed in this trial, the better canopy growth balance and microclimate had a positive effect on limiting downy and powdery mildew diseases. However, under arid environments and during hot and dry seasons, the use of permanent or total grass cover crops for long periods may lead to greater grapevine vigor reductions and an increased frequency of severe water-stress conditions, especially in sandy and/or low-fertility soils. In similar conditions, an efficient irrigation system that allows for appropriate irrigation supply, to counterbalance the competition for water and nutrients among the herbaceous cover and the vines, must be used [11,52].

4. Conclusions

In this work, the effects of different soil management techniques—conventional tillage versus grass or legume cover crops—on downy and powdery mildew development in vineyards were evaluated under Mediterranean climate conditions, during a three-season study period. As expected, disease development varied across the seasons, since precipitation, air temperature, and humidity during spring are the main climatic factors affecting P. viticola and E. necator infection processes and a great interannual variability in the pattern of this variables characterizes Mediterranean climate conditions. Higher infection percentages were observed in the vineyard plots subjected to soil tillage as compared to those of the two cover crops. Moreover, by weighting the effects of canopy development, light, and hygrothermal microclimate on the infection conditions and disease pressure, for each soil management treatment, the main role of weather conditions on infections of downy mildew was ascertained, regardless of the soil management treatment and canopy microclimate. Meanwhile, leaf N has a crucial role in disease development, particularly for powdery mildew infections. Yet, for this disease, also the canopy light and hygrothermal conditions for infections have a relevant function on disease development and pressure. A lower N on cover-cropped vineyard plots and thinner canopies in GRA promoted a less favorable light microclimate for both diseases’ spread and pressure, while in ST and LEG, the temperature and humidity conditions in the canopy promoted powdery mildew spread. The findings of this study help to improve our understanding of these diseases’ epidemiology in field conditions. By assessing the patterns of plant growth, infected LA, canopy density, and sunlight exposure, it was possible to clarify the influence that a specific cover crop may have on vineyard susceptibility to downy and powdery mildew, and how it may naturally help controlling these diseases, according to local climate and soil fertility.

Author Contributions

Conceptualization, A.F.d.O., S.S. and G.N.; data curation, A.F.d.O., S.S. and V.L.; investigation, A.F.d.O. and S.S.; methodology, A.F.d.O. and S.S.; data and statistical analysis, A.F.d.O., S.S. and V.L.; supervision, G.N., S.S. and D.S.; writing—original draft preparation, A.F.d.O.; writing—review and editing, A.F.d.O., S.S., D.S. and G.N. All authors have read and agreed to the published version of the manuscript.

Funding

This research was funded by Regione Autonoma della Sardegna, (L.R.7/2007– Promozione della ricerca scientifica e dell’innovazione, projects “Gestione del suolo in viticoltura: effetti sulla fisiologia della pianta e sulle principali avversità biotiche”, CUP-J81J11001590007; University of Sassari—“Fondo di Ateneo per la ricerca 2019”; and AGRIS, Agricultural Research Agency of Sardinia—project fundings.

Acknowledgments

The authors thank the winery Cantina Santa Maria La Palma and the farmer Arcangelo Lamon. We also thank Angelo Demontis for support in data collection.

Conflicts of Interest

The authors declare no conflict of interest.

Appendix A

Table A1. Number of main and lateral leaves and single leaf size of the main and lateral per shoot at dates 1 and 2 of the LA measurements. Values are the mean ± standard error and different letters indicate significant differences among treatments at p < 0.05, ns—not significant.
DateTreatmentMain LeavesLateral Leaves
201320142015201320142014
Number of leaves1ST16.6 ± 0.614.7 ± 0.717.4 ± 0.921.1 ± 4.4 a20.7 ± 4.8 a18.6 ± 3.7
LEG15.4 ± 0.614.6 ± 0.817.3 ± 0.616.3 ± 3.1 a16.5 ± 3.7 a,b18.9 ± 4.7
GRA15.3 ± 0.814.5 ± 0.617.6 ± 1.07.6 ± 1.5 b9.9 ± 2.4 b21.9 ± 3.8
Sig.nsnsns0.050.05ns
2ST14.9 ± 1.213.3 ± 1.815.5 ± 3.227.8 ± 7.7 25.3 ± 5.934.1 ± 8.3 a
LEG17.0 ± 1.715.8 ± 2.313.6 ± 1.827.8 ± 6.623.5 ± 3.012.0 ± 3.2 b
GRA17.5 ± 2.014.0 ± 1.415.1 ± 2.320.1 ± 3.520.0 ± 4.022.4 ± 3.4 a,b
Sig.ns nsnsnsns0.05
Single leaf size (cm2)1ST158.5 ± 8.9 181.0 ± 12.4 a137.8 ± 9.180.1 ± 8.9 a91.3 ± 11.1 a70.6 ± 11.1
LEG150.6 ± 11.1 138.5 ± 11.2 b140.3 ± 5.768.1 ± 12.4 b67.0 ± 11.2 b77.1 ± 12.4
GRA137.2 ± 11.1 150.9 ± 12.4 b122.8 ± 9.851.6 ± 9.1 c69.6 ± 5.7 b66.8 ± 9.8
>Sig.>ns>0.05>ns>0.05>0.05>ns
2ST171.0 ± 19.7243.6 ± 27.4 a157.5 ± 21.665.3 ± 19.7 b85.2 ± 20.173.4 ± 18.7 a
LEG197.3 ± 20.1215.7 ± 10.0 b 149.3 ± 15.678.9 ± 27.4 a74.3 ± 20.047.6 ± 26.2 b
GRA187.9 ± 18.7209.1 ± 26.2 b148.3 ± 19.777.4 ± 21.6 a80.2 ± 15.674.0 ± 19.7 a
Sig.ns0.05ns0.05ns0.05
Table A2. SPAD average values ± standard error in the main leaves, collected close to dates 1 and 3 of downy and powdery mildew observation in shoots, different letters indicate significant differences among treatments at p < 0.05.
DateTreatment201320142015
1ST43 ± 0.4 a48 ± 0.7 a 48 ± 0.7 a
LEG42 ± 1.2 a46 ± 0.5 b 46 ± 1.0 a
GRA38 ± 0.2 b43 ± 1.5 c44 ± 1.0 b
Sig.0.050.050.05
2ST44 ± 1.4 b46 ± 1.4 a47 ± 1.0 a
LEG48 ± 0.3 a45 ± 0.2 a48 ± 0.3 a
GRA38 ± 1.3 c40 ± 1.4 b43 ± 0.9 b
Sig.0.050.050.05
Table A3. Accumulated number of days with favorable microclimatic conditions (temperature, relative humidity, and humectation) for the development of P. viticola, from the beginning of the grapevine growing season until the first date of downy mildew monitoring on shoots (date 1) and from date 1 to dates 2 and 3. Values are the mean ± standard error and different letters in each column indicate significant differences among treatments at p-values < 0.05, ns—not significant.
DateTreatment201320142015
1ST3 ± 0.6 a0.3 ± 0.3 b17.7 ± 1.5
LEG1 ± 0 b3 ± 3 a20.3 ± 3.0
GRA1.3 ± 0.3 b0 ± 0 b19.7 ± 1.5
Sig.0.0000.05ns
2ST6.5 ± 0.3 a8.3 ± 0.3 ab13 ± 0
LEG4.7 ± 0.3 b9.3 ± 0.9 a13.3 ± 0.2
GRA5 ± 0.6 b7.7 ± 0.3 b13.7 ± 0.3
Sig.0.000 0.05ns
3ST10.5 ± 0.9 a10.3 ± 0.3 b-
LEG8 ± 0 b12.3 ± 1.3 a-
GRA9 ± 1 b10 ± 0 b-
Sig.0.0000.05-
Table A4. Correlations between the principal components and the original variables in the multifactor analysis, showing significant differences among soil management treatment during the dates 1 and 3 of grapevine and downy mildew development.
DATE 1DATE 3
Variables/PCSTLEGGRASTLEGGRA
1212121212123
PC explained variance (%)60.226.455.320.246.927.748.527.853.922.941.127.717.4
LAinfected0.0820.8930.1170.9450.1330.6240.1350.8370.497−0.457−0.2530.6720.672
Porosity0.341−0.8330.286−0.164−0.553−0.6240.6020.058−0.1040.8140.5280.714−0.130
N0.8720.2780.7910.453−0.6840.5410.4180.8470.6620.5750.8860.061−0.116
PARext0.9630.0740.945−0.0610.961−0.1700.866−0.3840.9560.132−0.6480.617−0.064
PARint0.953−0.0870.946−0.2600.963−0.203−0.9080.2910.9320.1340.545−0.3520.736
IC_in0.945−0.0210.900−0.1320.4170.7220.8840.108−0.8680.368−0.789−0.4190.128
Table A5. Correlations between the principal components and the original variables in the multifactor analysis, showing significant differences among soil management treatment during dates 1 and 3 of grapevine and powdery mildew development.
DATE 1DATE 3
Variables/PCSTLEGGRASTLEGGRA
121231212312123
PC explained variance (%)61.125.056.619.910.857.324.841.234.116.541.127.451.523.014.7
LAinfected0.4420.5800.4200.1370.8180.0320.677−0.0930.0010.8860.8640.1820.3810.7410.497
Porosity0.5220.0170.1380.4460.3560.002−0.691−0.1780.912−0.253−0.665−0.412−0.787−0.018−0.374
N0.863−0.4320.777−0.3410.446−0.7370.615−0.3210.1570.777−0.5880.759−0.6820.454−0.088
PARext0.9880.1240.9900.095−0.0130.9400.190−0.1540.957−0.041−0.0680.9880.150−0.3310.888
PARint0.9620.1110.9430.171−0.0450.9780.1710.174−0.960−0.067−0.0870.9410.0070.9240.001
IC_in−0.198−0.965−0.4170.758−0.0260.694−0.3810.7570.5840.1260.778−0.5240.7960.528−0.202
IC_out−0.4140.901−0.227−0.9240.1520.1700.8990.993−0.0640.0550.9310.2970.945−0.207−0.163
Low_RAI_in−0.944−0.164−0.923−0.1160.2760.9290.112
High_RAI_in0.833−0.5320.819−0.498−0.254−0.8880.3770.995−0.0140.0620.9460.2470.955−0.165−0.172
Low_RAI_out−0.9940.005−0.9890.0260.0810.9810.060
High_RAI_out0.9100.3880.9180.353−0.130−0.888−0.4150.9800.1670.0830.9790.0630.971−0.012−0.204

References

  1. López-Vicente, M.; Calvo-Seas, E.; Álvarez, S.; Cerdà, A. Effectiveness of Cover Crops to Reduce Loss of Soil Organic Matter in a Rainfed Vineyard. Land 2020, 9, 230. [Google Scholar] [CrossRef]
  2. Cataldo, E.; Salvi, L.; Sbraci, S.; Storchi, P.; Mattii, G.B. Sustainable Viticulture: Effects of Soil Management in Vitis vinifera. Agronomy 2020, 10, 1949. [Google Scholar] [CrossRef]
  3. Gattullo, C.E.; Mezzapesa, G.N.; Stellacci, A.M.; Ferrara, G.; Occhiogrosso, G.; Petrelli, G.; Castellini, M.; Spagnuolo, M. Cover Crop for a Sustainable Viticulture: Effects on Soil Properties and Table Grape Production. Agronomy 2020, 10, 1334. [Google Scholar] [CrossRef]
  4. Winkler, K.J.; Viers, J.H.; Nicholas, K.A. Assessing Ecosystem Services and Multifunctionality for Vineyard Systems. Front. Environ. Sci. 2017, 5, 15. [Google Scholar] [CrossRef] [Green Version]
  5. Prichard, T.L. Water use and infiltration. In Cover Cropping in Vineyards. A Grower’s Handbook; Ingels, C.A., Bugg, R.L., McGourty, G.T., Christensen, L.P., Eds.; University of California: Oakland, CA, USA, 1998; pp. 85–90. [Google Scholar]
  6. Morlat, R.; Jacquet, A. Grapevine root system and soil characteristics in a vineyard maintained long-term with or without interrow sward. Am. J. Enol. Vitic. 2003, 54, 1–7. [Google Scholar]
  7. Monteiro, A.; Lopes, C.M. Influence of cover crop on water use and performance of vineyard in Mediterranean Portugal. Agric. Ecosyst. Environ. 2007, 121, 336–342. [Google Scholar] [CrossRef]
  8. Guzmán, G.; Cabezas, J.; Sánchez-Cuesta, R.; Lora, Á.; Bauer, T.; Strauss, P.; Winter, S.; Zaller, J.; Gómez, J. A field evaluation of the impact of temporary cover crops on soil properties and vegetation communities in southern Spain vineyards. Agric. Ecosyst. Environ. 2019, 272, 135–145. [Google Scholar] [CrossRef]
  9. Tesic, D.; Keller, M.; Hutton, R.J. Influence of vineyard floor management practices on grapevine vegetative growth, yield, and fruit composition. Am. J. Enol. Vitic. 2007, 58, 1–11. [Google Scholar]
  10. Celette, F.; Findeling, A.; Gary, C. Competition for nitrogen in an unfertilized intercropping system: The case of an association of grapevine and grass cover in a Mediterranean climate. Eur. J. Agron. 2009, 30, 41–51. [Google Scholar] [CrossRef]
  11. Lopes, C.M.; Santos, T.P.; Monteiro, A.; Rodrigues, M.L.; Costa, J.M.; Chaves, M.M. Combining cover cropping with deficit irrigation in a Mediterranean low vigor vineyard. Sci. Hortic. 2011, 129, 603–661. [Google Scholar] [CrossRef] [Green Version]
  12. Guerra, B.; Steenwerth, K. Influence of floor management technique on grapevine growth, disease pressure, and juice and wine composition: A review. Am. J. Enol. Vitic. 2012, 63, 149–164. [Google Scholar] [CrossRef]
  13. Cheng, X.; Baumgartner, K. Overlap of grapevine and cover-crop roots enhances interactions among grapevines, cover crops, and arbuscular mycorrhizal fungi. In Proceeding of the Soil Environment and Vine Mineral Nutrition: Symposium Proceedings and Related Papers, San Diego, CA, USA, 29–30 July 2004; American Society of Enology and Viticulture Ed.: Davis, CA, USA, 2005; pp. 171–174. [Google Scholar]
  14. Celette, F.; Gaudin, R.; Gary, C. Spatial and temporal changes to the water regime of a Mediterranean vineyard due to the adoption of cover cropping. Eur. J. Agron. 2008, 29, 153–162. [Google Scholar] [CrossRef]
  15. Patrick, A.E.; Smith, R.; Keck, K.; Berry, A.M. Grapevine uptake of 15N-labeled nitrogen derived from a winter-annual leguminous cover-crop mix. Am. J. Enol. Vitic. 2004, 55, 187–190. [Google Scholar]
  16. Ingels, C.A.; Scow, K.M.; Whisson, D.A.; Drenovsky, R.E. Effects of cover crops on grapevines, yield, juice composition, soil microbial ecology, and gopher activity. Am. J. Enol. Vitic. 2005, 56, 19–29. [Google Scholar]
  17. Uliarte, E.M.; Del Monte, R.F.; Prieto, J.A.; Sari, S.E. Soil management with cover crops in irrigated vineyards: Effects in vine microclimate ± cv. Malbec grown in a terroir of Agrelo ± Luján de Cuyo. In Proceedings of the 28th International Conference on Viticultural Zoning, Cape Town, South Africa, 11–14 November 2004; pp. 354–363. [Google Scholar]
  18. Xi, Z.-m.; Zhang, Z.-w.; Cheng, Y.-f.; Li, H. The effect of vineyard cover crop on main monomeric phenols of grape berry and wine in Vitis vinifera L. cv. Cabernet Sauvignon. Agric. Sci. China 2010, 9, 440–448. [Google Scholar] [CrossRef]
  19. Mercenaro, L.; Nieddu, G.; Pulina, P.; Porqueddu, C. Sustainable management of an intercropped Mediterranean vineyard. Agric. Ecosyst. Environ. 2014, 192, 95–104. [Google Scholar] [CrossRef]
  20. Lopes, C.M.; Monteiro, A.; Machado, J.P.; Fernandes, N.; Araújo, A. Cover cropping in a sloping non-irrigated vineyard: II—Effects on vegetative growth, yield, berry and wine quality of ‘Cabernet Sauvignon’ grapevines. Ciência. Téc. Vitiv. 2008, 23, 37–43. [Google Scholar]
  21. Valdéz-Gómez, H.; Fermaud, M.; Roudet, J.; Calonnec, A.; Gary, C. Grey mould incidence is reduced on grapevines with lower vegetative and reproductive growth. Crop. Prot. 2008, 27, 1174–1186. [Google Scholar] [CrossRef]
  22. Merry, A.M.; Evans, K.J.; Corkrey, R.; Wilson, S.J. Coincidence of maximum severity of powdery mildew on grape leaves and the carbohydrate sink-to-source transition. Plant Pathol. 2013, 62, 842–850. [Google Scholar] [CrossRef]
  23. Ferrandino, F.J. Effect of crop growth and canopy filtration on the dynamics of plant disease epidemics spread by aerially dispersed spores. Phytopathology 2008, 98, 492–503. [Google Scholar] [CrossRef] [PubMed] [Green Version]
  24. Tivoli, B.; Calonnec, A.; Richard, B.; Ney, B.; Andrivon, D. Current knowledge on plant/canopy architectural traits that reduce the expression and development of epidemics. Eur. J. Plant Pathol. 2013, 135, 471–478. [Google Scholar] [CrossRef] [Green Version]
  25. Borgo, M.; Egger, E.; Giulivo, C.; Lavezzi, A. Confronto tra tecniche colturali del terreno applicate al vigneto. Riv. Vitic. Enol. 1989, 2, 25–38. [Google Scholar]
  26. Marangoni, B.; Toselli, M.; Venturi, A.; Fontana, M.; Scudellari, D. Effects of vineyard soil management and fertilization on grape diseases and wine quality. In Proceeding of the International Conference on Integrated Fruit Protection, Lleida, Spain, 22–26 October 2000; Avilla, J., Polesny, F., Eds.; IOBC/WPRS Bulletin: Darmstadt, Germany, 2001; Volume 24, pp. 353–358. [Google Scholar]
  27. Valdés, H.; Celette, F.; Fermaud, M.; Cartolaro, P.; Clerjeau, M.; Gary, C. Comment évaluer l’influence de la vigueur végétative sur la sensibilité de la vigne aux maladies cryptogamiques? Progrès Agric. Vitic. 2006, 123, 243–247. [Google Scholar]
  28. Vogelweith, F.; Thiéry, D. Cover crop differentially affects arthropods, but not diseases, occurring on grape leaves in vineyards. Aust. J. Grape Wine Res. 2017, 23, 426–431. [Google Scholar] [CrossRef]
  29. Nieddu, G.; Graviano, O.; Lostia, M.; Porqueddu, C. Effects of Medicago polymorpha L. cover cropping in Sardinian vineyards. Cah. Opt. Mediterr. 2000, 45, 449–452. [Google Scholar]
  30. Fernandes de Oliveira, A.; Nieddu, G. Vine growth and physiological performance of two red grape cultivars under natural and reduced UV solar radiation. Aust. J. Grape Wine Res. 2016, 22, 105–113. [Google Scholar] [CrossRef]
  31. Lopes, C.M.; Pinto, P.A. Easy and accurate estimation of grapevine leaf area with simple mathematical models. Vitis 2005, 44, 55–61. [Google Scholar] [CrossRef]
  32. Fernandes de Oliveira, A.; Nieddu, G.; Lopes, C.M. Validation of an empirical model for grapevine leaf area estimation with data from the varieties ‘Cannonau’ and ‘Vermentino’ grown in Sardinia. In Proceedings of the Unbottled—1st International Dão Wine Congress—Innovation and Development. Session III—Viticulture Technology—Vineyard Conduction, Viseu, Portugal, 3–6 June 2009; p. 10. [Google Scholar]
  33. Sánchez-De-Miguel, P.; Junquera, P.; De La Fuente, M.; Jimenez, L.; Linares, R.; Baeza, P.; Lissarrague, J.R. Estimation of vineyard leaf area by linear regression. Span. J. Agric. Res. 2011, 9, 202–212. [Google Scholar] [CrossRef] [Green Version]
  34. Smart, R.E.; Robinson, M. Sunlight into Wine. A Handbook for Winegrape Canopy Management; Winetitles: Adelaide, Australia, 1991; p. 88. [Google Scholar]
  35. Muscas, E.; Cocco, A.; Mercenaro, L.; Cabras, M.; Lentini, A.; Porqueddu, C.; Nieddu, G. Effects of vineyard floor cover crops on grapevine vigor, yield, and fruit quality, and the development of the vine mealybug under a Mediterranean climate. Agric. Ecosyst. Environ. 2017, 237, 203–212. [Google Scholar] [CrossRef]
  36. Cocco, A.; Marras, P.M.; Muscas, E.; Mura, A.; Lentini, A. Variation of life-history parameters of Planococcus ficus ± Hemiptera: Pseudococcidae in response to grapevine nitrogen fertilization. J. Appl. Entomol. 2015, 139, 519–528. [Google Scholar] [CrossRef]
  37. Townsend, G.R.; Heuberger, I.W. Methods for estimating losses caused by disease in fungicide experiments. Plant Dis. Rep. 1947, 27, 340–343. [Google Scholar]
  38. Muller, K.; Sleumer, H. Biologische Unterschungen über die Peronosorakrankheit des Weinstokes mit besonderer Breücksichtingung threr Bekämpfung nach der Inkhationskalendermethode. Z Wiss Landwirtsch 1934, 79, 509–576. [Google Scholar]
  39. Gubler, W.D.; Rademacher, M.R.; Vasquez, S.J.; Thomas, C.S. Control of Powdery Mildew Using the UC Davis Powdery Mildew Risk Index. 1999. APSnet. Available online: http://www.apsnet.org/publications/apsnetfeatures/Pages/UCDavisRisk.aspx. (accessed on 19 March 2021).
  40. Valdes-Gomez, H.; Gary, C.; Cartolaro, P.; Lolas-Caneo, M.; Calonnec, A. Powdery mildew development is positively influenced by grapevine vegetative growth induced by different soil management strategies. Crop Prot. 2011, 30, 1168–1177. [Google Scholar] [CrossRef]
  41. Bove, F.; Savary, S.; Willocquet, L.; Rossi, V. Designing a modelling structure for the grapevine downy mildew pathosystem. Eur. J. Plant Pathol. 2020, 157, 251–268. [Google Scholar] [CrossRef]
  42. Pérez-Bermúdez, P.; Olmo, M.; Gil, J.; Garcia-Férriz, L.; Olmo, C.; Boluda, R.; Gavidia, I. Cover crops and pruning in Bobal and Tempranillo vineyards have little influence on grapevine nutrition. Sci. Agric. 2015, 73, 260–265. [Google Scholar] [CrossRef] [Green Version]
  43. Pérez-Álvarez, E.P.; García-Escudero, E.; Peregrina, F. Soil nutrient availability under cover crops and its delayed effects on vine, must, and wine in a Tempranillo vineyard. Am. J. Enol. Vitic. 2015, 66, 311–320. [Google Scholar] [CrossRef] [Green Version]
  44. Ferrara, G.; Malerba, A.D.; Matarrese, A.M.S.; Mondelli, D.; Mazzeo, A. Nitrogen Distribution in Annual Growth of ‘Italia’ Table Grape Vines. Front. Plant Sci. 2018, 9, 871. [Google Scholar] [CrossRef] [Green Version]
  45. Ferrara, G.; Nigro, D.; Torres, R.; Gadaleta, A.; Fidelibus, M.W.; Mazzeo, A. Cover crops in the inter-row of a table grape vineyard managed with irrigation sensors: Effects on yield, quality and glutamine synthetase activity in leaves. Sci. Hortic. 2021, 281. [Google Scholar] [CrossRef]
  46. Hirschfelt, D.J. Soil fertility and vine nutrition. In Cover Cropping in Vineyards; Ingels, C.A., Bugg, R.L., McGourty, G.T., Christensen, L.P., Eds.; University of California: Okland, CA, USA, 1998; pp. 61–68. [Google Scholar]
  47. Pou, A.; Gulías, J.; Moreno, M.; Tomàs, M.; Medrano, H.; Cifre, J. Cover cropping in Vitis vinifera L. cv. Manto Negro vineyards under Mediterranean conditions: Effects on plant vigour, yield and grape quality. Oeno One 2011, 45, 223–234. [Google Scholar] [CrossRef] [Green Version]
  48. Austin, C.N.; Gove, G.G.; Meyers, J.M.; Wilcox, W.F. Powdery mildew severity as a function of canopy density: Associated impacts on sunlight penetration and spray coverage. Am. J. Enol. Vitic. 2011, 62, 23–31. [Google Scholar] [CrossRef]
  49. Willocquet, L.; Clerjeau, M. An analysis of the effects of environmental factors on conidial dispersal of Uncinula necator ± grape powdery mildew in vineyards. Plant Phatol. 1998, 47, 227–233. [Google Scholar] [CrossRef]
  50. Austin, C.N.; Wilcox, W.F. Effects of sunlight exposure on grapevine powdery mildew development. Phytopathology 2012, 102, 857–866. [Google Scholar] [CrossRef] [PubMed] [Green Version]
  51. Celette, F.; Gary, C. Dynamics of water and nitrogen stress along the grapevine cycle as affected by cover cropping. Eur. J. Agron. 2013, 45, 142–152. [Google Scholar] [CrossRef]
  52. Guilpart, N.; Roux, S.; Gary, C.; Metay, A. The trade-off between grape yield and grapevine susceptibility to powdery mildew and grey mould depends on inter-annual variations in water stress. Agric. For. Meteorol. 2017, 234, 203–211. [Google Scholar] [CrossRef]
Figure 1. Correlations between the observed and estimated values of the single LA (red dots), main LA (green dots), and lateral (blue dots) LA models for Carignano.
Horticulturae 07 00209 g001
Figure 2. Development of the downy mildew infection index detected on the main shoot leaves, on lateral shoots, and on the canopy wall, in the three soil management treatments. Values are the mean ± standard error.
Horticulturae 07 00209 g002
Figure 3. Development of the powdery mildew infection index detected on the main shoot leaves, on lateral shoots, and on the canopy wall, in the three soil management treatments. Values are the mean ± standard error.
Horticulturae 07 00209 g003
Figure 4. Total LA per vine (a), downy mildew-infected LA/shoot (b), and powdery mildew-infected LA/shoot (c), detected during dates 1 and 3 of disease monitoring of the three soil management treatments, during the three study seasons. Values are the mean ± standard error.
Horticulturae 07 00209 g004
Figure 5. Proportion of total downy mildew-infected (a) and powdery mildew-infected (b) LA per shoot detected in the cover crop and soil tillage treatments (respectively, GRA, LEG, and ST LAinfected) on disease field monitoring dates 1 and 3, in the three study seasons.
Horticulturae 07 00209 g005
Figure 6. Leaf layer number, from the base to the top of the canopy wall at dates 1 and 2 of the canopy density measurements. Values are the mean ± standard error and different letters indicate significant differences among treatments at p < 0.05, ns—not significant.
Horticulturae 07 00209 g006
Figure 7. Relationship between the downy mildew infection index and total LA per vine (a) and canopy porosity (b) during disease observation dates 4 and 6 in the canopy wall, for the three-season study period.
Horticulturae 07 00209 g007
Figure 8. Relationship between the powdery mildew infection index and total LA per vine (a) and canopy porosity (b) during disease observation dates 4 and 6 in the canopy wall, for the three-season study period.
Horticulturae 07 00209 g008
Figure 9. Transversal profiles of the intercepted PAR during mid-day, at the cluster level and at an upper vegetation level, measured in the three soil management treatments close to date 1 and 3 of the disease observations in shoots in seasons 2013 and 2014. Values are the mean ± standard error.
Horticulturae 07 00209 g009
Figure 10. Cumulated precipitation (PP), average air temperature (T), and relative humidity (RH) during the study seasons (a); frequency of days of absence, low and high precipitation (respectively, 0.10 and 20 mm), and ranges of air temperature, optimal (26 °C) and non-optimal (<5 °C and ≥32 °C) for disease development (b).
Horticulturae 07 00209 g010
Figure 11. Accumulated number of days with a favorable IC for the development of downy and powdery mildew at each date of disease monitoring on the shoots, in the three soil management treatments. Values are the mean ± standard error.
Horticulturae 07 00209 g011
Figure 12. Multifactor analysis score plots of the infected LA per shoot, leaf N, canopy porosity, PAR levels in the external and internal layers, and IC inside the canopy, in each soil management treatment (ST—dark cross, LEG—white rhombus; GRA—dark rhombus) during the grapevine downy mildew observation dates 1 and 3.
Horticulturae 07 00209 g012
Figure 13. Multifactor analysis score plots of the infected LA per shoot, leaf N, canopy porosity, PAR levels in the external and internal layers, and IC and RAI classes (low and high), inside (in) and outside (out) the canopy, in each soil management treatment (ST—dark cross, LEG—empty rhombus; GRA—full rhombus) during the grapevine powdery mildew observation dates 1 and 3.
Horticulturae 07 00209 g013
Table 1. Validation of the linear regression models for the primary and lateral shoot LA (ln (total LA] = α + ß × ln (average LA × NL)) estimation.
Data Setdf1df2Deviance MeasuresLinear RegressionModeling Efficiency
MAEMA%ER2InterceptSlopeRMSE
Primary shoot LA136123.845.70.904169.7 0.91 195.280.99
Lateral shoot LA135137.258.950.98624.9 0.81 202.990.99
df—degrees of freedom; MAE—mean absolute error; MA%E—mean absolute percentage error; RMSE—root mean square error; p-value < 0.001.
Table 2. F-statistics and p-value of the two-way ANOVA on the average total, main, and lateral infected LA per shoot during dates 1 and 3 of disease monitoring. Significance of the season and soil management treatment effects.
DiseaseDateFactor Total Infected LA/ShootMain Infected LA/ShootLateral Infected LA/Shoot
F-Statisticp-ValueF-Statisticp-ValueF-Statisticp-Value
P. viticola1Season16.630.00143.120.0016.370.005
Treatment0.080.9270.020.9760.540.588
3Season7.030.0037.350.0030.2710.765
Treatment0.750.4800.180.8362.090.144
E. necator1Season2.920.0737.610.0030.780.472
Treatment1.320.2860.280.7602.120.142
3Season4.020.0311.130.3394.100.029
Treatment3.680.0402.140.1403.510.046
Table 3. F-statistics and p-value of the two-way ANOVA on average porosity, LLN, and PIL during dates 1 and 2 of field monitoring. Significance of the season and soil management treatment effects and of the interaction between main factors.
Main factorTreatmentDate 1Date 2
PorosityLLNPILPorosityLLNPIL
SeasonF-statistic1.7240.0590.1936.01916.21814.562
p-value0.1980.9430.8260.0080.0000.000
Soil ManagementF-statistic11.66823.77116.7160.3960.8201.306
p-value0.0000.0000.0000.6770.4530.289
InteractionF-statistic0.4020.9621.1170.3511.2400.996
p-value0.8050.4450.3700.8410.3210.429
Publisher’s Note: MDPI stays neutral with regard to jurisdictional claims in published maps and institutional affiliations.

