Evaluation of Water Quality Parameters in Shatt AL-Arab, Southern Iraq, Using Spatial Analysis


1
Department of Environmental Engineering, College of Engineering, Mustansiriyah University, Baghdad 10047, Iraq
2
Department of Water Resources Engineering, College of Engineering, Mustansiriyah University, Baghdad 10047, Iraq
3
Department of Environmental Engineering, Mustansiriyah University, Baghdad 10047, Iraq
*
Author to whom correspondence should be addressed.
Hydrology 2020, 7(4), 79; https://0-doi-org.brum.beds.ac.uk/10.3390/hydrology7040079
Submission received: 6 September 2020
/
Revised: 10 October 2020
/
Accepted: 10 October 2020
/
Published: 15 October 2020
Abstract
:The present work illustrates the potential application of techniques of spatial analysis via geographic information systems (GIS) to categorize the distribution of temporal and spatial of water prediction characteristics to determine the water quality parameters of the Shatt Al-Arab River (SAA), southern Iraq. Eight main water quality parameters and three heavy metals were measured from December 2018 to October 2019. The total dissolved solids, chloride, sulfate, and total hardness were compared with previous data that were measured from 2014 to 2018 based on data availability. The geochemical characteristics were also investigated to analyze water quality parameters. The study was performed by selecting eleven stations according to the nature areas of SAA. Water samples were acquired from the eleven stations for four seasons (winter of 2018 through autumn of 2019). Results revealed that total dissolved solids ranged between 950 to 8500 mg/L, total hardness varied from 400 to 2394 mg/L as calcium carbonate (CaCO3), the sulfate ranged from 149 to 1602 mg/L, and chloride ranged from 330 to 3687 mg/L. The results showed that SAA had high salinity with a low hazard of sodicity. The SAA waters mainly fall below the Dolomite-Magnesite tie-lines which indicated the dissolution of carbonate rocks. This research also found that the study area confined from Al-Maqal station to Abu Flus port station where the salty marine water coming from the Arabian Gulf remains for longer periods. The SAA is not suitable for drinking and irrigation water according to Iraqi and World Health Organization (WHO) standards. This study suggested building a blocking dam downstream of the SAA to prevent salty water from coming back from Arabian Gulf.
1. Introduction
The rapid growth of the population accompanies significant industrial and agricultural development that impacts the environment with all its components, and thus it impacts the surface water. About 90% of the polluted water discharged into rivers and streams, especially in developing countries [1,2,3,4,5]. Moreover, one-third of the world suffers from a severe shortage of safe drinking water [6]. The stressed in global water resources for drinking, food protection, and environmental protection increased due to world population growth [6,7,8]. Iraq is considered an arid and semi-arid country. Therefore, water shortage problems are even more challenging in this country. Due to the decreasing recharge of the Euphrates River, Tigris River, and Shatt Al-Arab River (SAA), Iraq is facing forthcoming water shortage problems [6,7,8]. Therefore, investigated the water quality for drinking or/and agriculture usage in SAA is needed to ensure drinking and agriculture water shortly.
The Tigris and Euphrates rivers are forming the SAA in the town of Qurna, located in the north part of the Basra city, Iraq. River branches extend into Basra center city. Branches extension of the rivers to the Basra center city conveys rivers to other parts for sanitary sewage disposal and waste of solid nature that cause pollution. The water quality of the river has been investigated extensively [9,10,11,12,13,14,15]. In contrast, some studies deemed the SAA branches of water quality, where they confirmed the existence water of heavy metals [16] that proved heavy elements distribution in Khandek and Ashar branches either in sediments or water itself. Khafaji [17] reported the heavy metals pollution in the branch of Jubyla in SAA. In Rubat, Jubylah, Khora, Shatt Turek, Khandek, and Ashar Branches, Imarah et al. [18] determined trace metals levels of zinc, nickel, cadmium, and cobber for water particulate and dissolved phases for the summer and spring seasons of 2006.
Due to the enormous development in various fields of science, it may become necessary to adopt a familiar technique to study water environments. Researchers have used different methods to express water resource quality such as; water quality indices, triangular plots, bar diagrams, and others. One of the most beneficial techniques is a spatial distribution via the Geographical Information System (GIS) [19]. GIS has become an integral part of the aquatic sciences [20]. Burrough [21] defined GIS as a systematic gathering of software, hardware, geographical information, and personnel devoted to capturing efficiency, update, store, analyze, manipulate, and display whole forms of information related to the references geographically. Fazal [22] explained GIS as a capturing system for checking, storing, integrating, displaying, manipulating, and analyzing data that are of earth reference spatially. GIS users allowed visualizing view, interpreting, question, and understanding data in methods that detect patterns, trends, and relationships in the forms of reports, charts, globes, and maps. It has been proposed that GIS is able to investigate rivers water quality, a refuge for assessing environment suitability, international and national areas of protection, and management of river basin [23,24]. Kumar et al. [25] declared that, for river water assessment, to restore and manage resources of water, including spatial and temporal data of an all water body, and provide significant database for a computer to store, manipulate, and analyze data, GIS is needed. Internationally, GIS for the past 30 years was exploited to collect needed information for monitoring different bodies of water worldwide [26].
Numerous studies were performed for GIS applications in order to water quality evaluation at various ecosystems including rivers, groundwater, streams, and lakes [26,27,28,29]. The GIS was applied in several investigations for water evaluating quality in Iraq. Salih et al. [30] reported on Dam Lake of Haditha water quality where they applied techniques of GIS and remote sensing. Sail et al. [31] investigated the quality of water of Habania. Abbas and Ziboon [32] used the technique of GIS and remote sensing to determine Al-Hammar marsh physical characteristics of the soil. Jaber [33] constructed in Iraq a map using facilities of GIS for resources of water. Monte Carlo simulation was used by Sachit and Azawi [34] to predict the travel time of the ground water flow in the Iraqi western desert. Hassan et al. [35] declared that for river water assessment, should suggest if the real water quality refers to the needed water quality of the Canal of SAA according to the World Health Organization (WHO) specifications. Al-Adhab et al. [36] reported analyzing the temporal and spatial variations of water quality by assessing the primary pollution sources in the SAA in Basra province, Iraq.
Furthermore, the analysis of geochemical and hydrogeological properties for water quality parameters was investigated by several researchers [37,38,39]. Vespasiano et al. [37] investigated the aquifer pollution phenomena and the influence of salt concentrations in the Sant’Eufemia plain, Italy. They investigated four main geochemical parameters and analyzed them by collecting 42 samples of streams and groundwater. Vespasiano et al. [37] found that high concentrations of calcium and sulfate suggested mixing processes among the thermal waters. The results also found that a high concentration of potassium and nitrate can be attributed to anthropogenic activities. In 2019, Vespasiano et al. [38] integrated hydrogeological and geochemical approaches using spatial analysis to investigate the conceptualization of plain groundwater systems in Sibari coastal plain, Calabria, southern Italy. They found that the sodium, magnesium, chloride, and sulfate can be ascribed to seawater intrusion, while the potassium is considered the major pollutant of the shallow aquifer. Apollaro et al. [39] investigated chemical and isotopic features of two different types of waters: cold shallow and hypothermal waters, in the Lucane thermal area, southern Italy. They studied geochemical data to determine a geothermal reservoir temperature. They found that the rock deformation can increase the output of some geochemical that produced in minerals and rocks.
Recently in SAA, the quality of water has declined due to a significant reduction in discharge of water which in turn had a huge effect on rivers of Iraq [40,41]. In 2011, it was recorded that the level of electrical conductivity increased to about 15.65 mS/cm in the SAA at Fao city, which is located in the southern point of Iraq [42]. In 2015, it was recorded that the level of electrical conductivity increased to about 55.6 mS/cm in the same location [43]. Due to the huge damage to the water quality which could occur as a result of the salt level increase, wide concern has been raised about this issue among Iraqi people, especially, those who are living in the south of Iraq [44]. Shatt Al-Arab River in Basra city is an example of salinity problems in southern Iraq due to saline water coming back from Arabian Gulf and due to low flowrates from both Tigris and Euphrates Rivers. Besides, pollutants in this river were increased due to wastewater discharge from pollution resources located along the riverbank of SAA. There is no study until now that applied spatial analysis using the Kriging interpolation method and adopted a geochemical analysis to analyze water quality parameters of SAA. The Kriging interpolation method via GIS was selected because it obtained an easy and more suitable technique to describe the water quality parameters.
Therefore, this study aims to (1) highlight the need for a comparative study of the water quality of Shatt Al-Arab River using methods of interpolation (Kriging) via a GIS technique to describe the spatial distribution of some important parameters of water quality including total dissolved solids (TDS), total hardness (TH), sulfate (SO4), chloride (Cl), turbidity, sodium (Na), phosphate (PO4), and total organic carbon (TOC), and some other heavy metals including cadmium (Cd2+), chromium (Cr3+), and selenium (Se); from December 2018 to October 2019, (2) compare the TDS, TH, SO4, and Cl with previously available data in the period of 2014 to 2018, and (3) analyze the geochemical characteristics of SAA water samples. The focus of this study was on these parameters due to their relation to the increasing salinity rate of SAA, in addition to the focus on heavy elements. One of the difficulties in this research was that part of SAA fall within Iran. The geopolitics that prevailing in the region make this part of the river not accessible for the needed investigations.
2. Materials and Methods
2.1. Area of Study
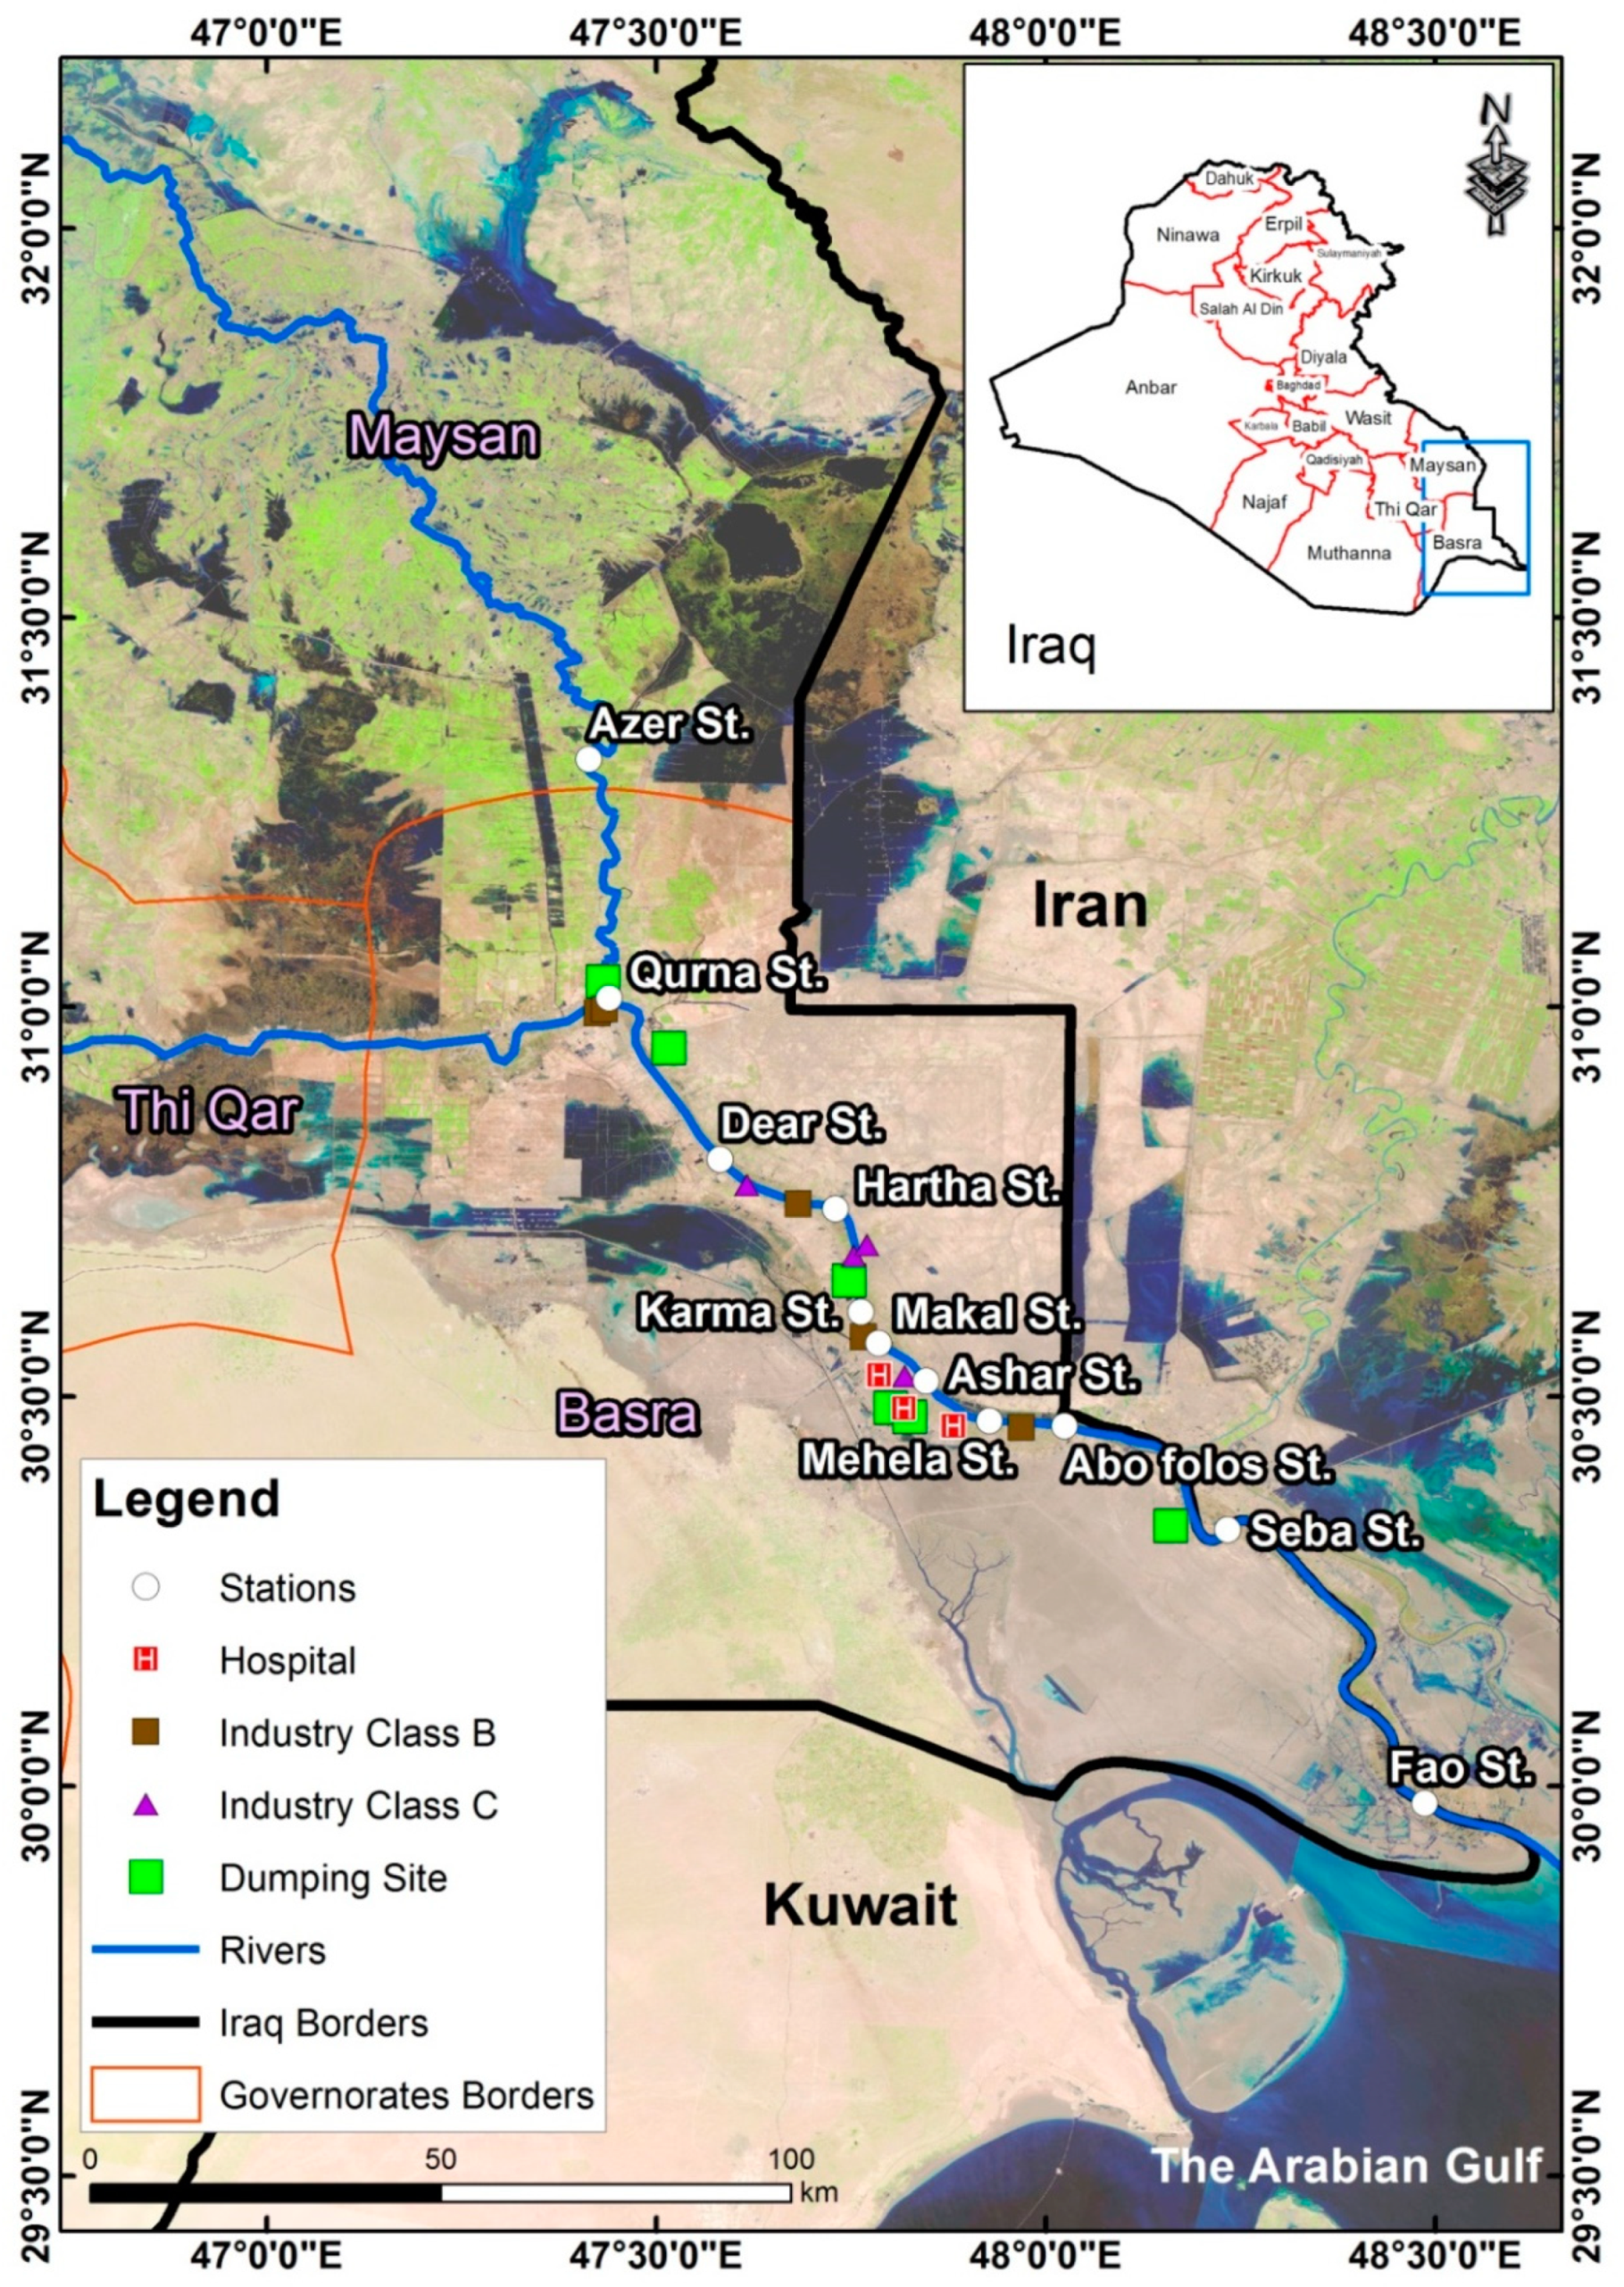
Shatt Al-Arab River is considered as of Euphrates and Tigris combines in the south of Iraq. This is the main freshwater source in the south of Iraq (Figure 1). The SAA extends about 190 km before its water pours into the Arabian Gulf [45,46]. The river width ranges from 250 m at the center of Basra city, to about 1500 m at the endpoint in Al-Fao city before entering the Arabian Gulf. The maximum depth of this river is between 5 to 12 m [45,46]. Its water discharge depends primarily on the Euphrates and Tigris discharge and other important tributaries such as Al-Karun and Al-Sweeb Streams [46]. Industrial development and agricultural sectors in Iraq attributed to the significant role of this river as well as other aspects (i.e., irrigation, transportation, and the drinking water provision) [47].
As the SAA is part of the Iraqi rivers system, which includes the Euphrates and Tigris Rivers, it is valid to look at some important factors which have a direct or indirect impact on this river water quality and quantity. The physical, chemical, and hydrological aspects of water have been modified by the water quality and quantity coming from its tributaries, which in turn, depend on the amount of rainfall, the effects of groundwater, and the water storage circumstances in the upstream areas. At its mouth, the river is significantly affected by saline water tides which come from the Arabian Gulf [47,48,49].
2.2. Geological Formations
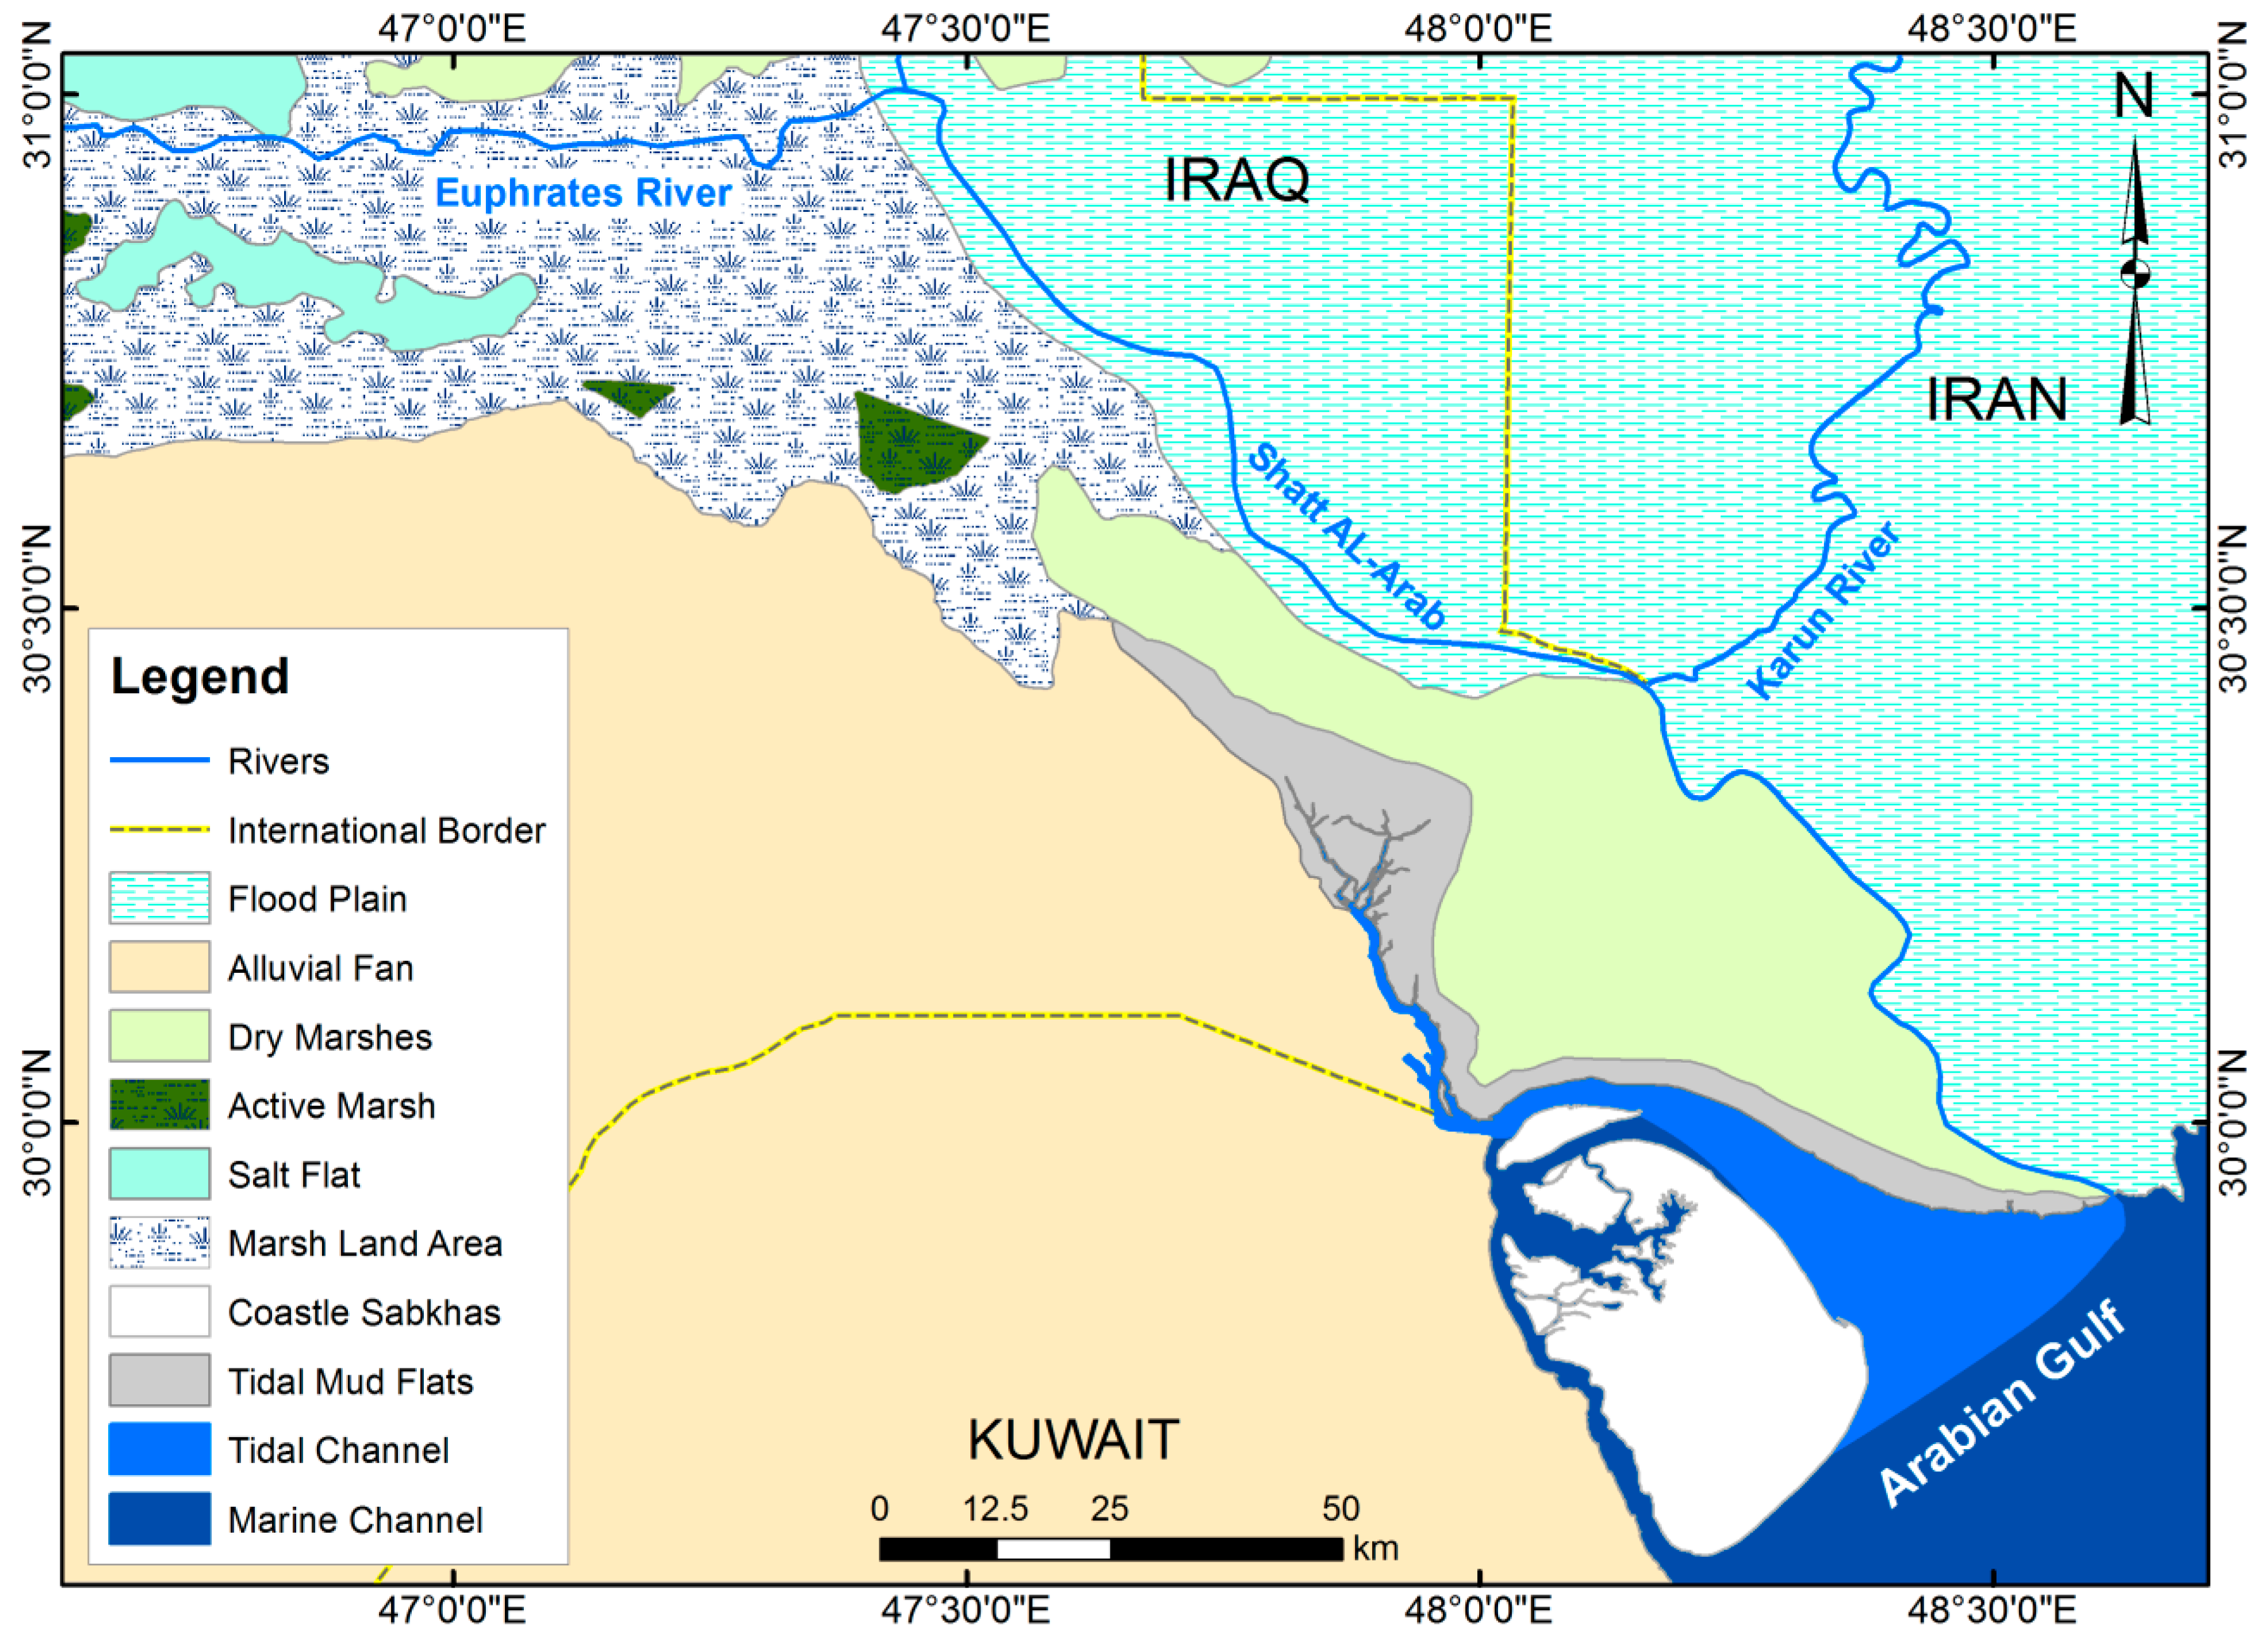
The study area is characterized by the fact that it is located within the Mesopotamian plain, which belongs to the quaternary model area with very large thickness in stony terms. Those sediments that represent the Mesopotamian plain are usually filled with gravel and sand. The upper part of the sequence is usually very stony monotonous and is composed of flowing silt with a strong iolite mixture. The quaternary sediments are divided into Holocene and Pleistocene sediments over 100 m thick, while those of Pleistocene rivers consist mainly of fine sand, clay, and silt [50].
The facial changes and vertical lithological variation are quite frequent in such fluvial deposits. The origin of these deposits is the Tigris and Euphrates flood plain system. The upper contact with the Holocene deposits was taken at the top of yellowish-brown clay or silty clay bed. This clay bed contains large gypsum crystals (Figure 2). It has often sharp contact with the overlying deposits. The Holocene deposits from horizontal diversity of surface sedimentary environments mainly consist of fluviatile, lacustrine, Sabkhas, and marine [51]. The fluviatile deposits were derived from the Tigris, Euphrates, and Karun Rivers. These sediments are deposited in the floodplain and natural levees of SAA channels in both sides and consist dominantly of silty mud in the region that extends from Qurna to the south of Basra, whereas it changes into brown muddy sand from Siba up to the mouth of SAA at Arabian Gulf that reflecting the role of Karun River [50]. Lacustrine sediments represented by marshes and lakes that flanked the SAA from the north and northwest and consist of fine texture, light grey color, and darker organic intercalation. The lacustrine system of the lower Mesopotamian Plain is classified as active marshes, open lakes, and dry marshes [51]. The deposits of Sabkhas are situated between SAA and Khor Al-Zubair. They form super-tidal surfaces produced mostly by seaward progradation of the coastline [51].
2.3. Pollution Sources of SAA
The household and sewage wastes are one of the most important sources of pollution in SAA. This polluted water throws into the river microbes and organic matter that are harmful to public health when decomposed. The most prominent of these germs are dysentery and typhoid germs. The increase in household waste leads to an increase in salts that in turn leads to the growth of phytoplankton. This caused an increase in aquatic algae. This aquatic alga requires the consumption of a large amount of dissolved oxygen in the river. Many materials from household waste settle and form the sludge bed, which covers most of the bottom of streams that flow into the SAA (Figure 1). Additionally, industrial waste from the paper mill in northern Basra city and the fertilizer plant in southern Basra city are another source of pollution to SAA [45,48]. Without any treatment, the southern region power station has a negative impact on the pollution of SAA by throwing hot water into the river. This hot water leads to a decrease in the amount of dissolved oxygen in SAA. In addition, the effect of chemical and organic fertilizers in the south of SAA led to an increase in aquatic algae. This also decreases the amount of oxygen dissolved in the river. Pesticide toxins are other pollutants that seep from agricultural lands into irrigation water, and then into drainage water and into the river water. This influences also on river water quality system. This leads to the death of aquatic organisms, especially fish and birds [48].
2.4. Data Sampling
Eleven sampling stations were selected through the SAA described previously within the area of study. The coordinates and locations of these stations are abstracted in Figure 1. The sampling station of Azer is located upstream of the river which can be considered as a reference station for other stations because it is far from the outfall of wastewater as shown in Figure 1. Samples were acquired periodically from the stations at the study site during the period from December 2018 to October 2019. The sampling was performed using the small boats belonging to the river police in Basra city and the boats for the fishermen. The samples were acquired from the central area of the river about 35 m away from the right or left bank of the river and at a depth of 9.0 m below the surface of the water. Using the Manual Pull Plastic Manual Pump device, a water hose (15 m long), and a weight of iron of 2.0 kg installed at the end of the plastic hose, it is easy to examine into the depth mentioned and it’s floating on the river’s surface.
Water samples were collected in sealed plastic containers bottles of 1.5 L capacity in sterile conditions. The sample was stabilized and analyzed within 24 h to avoid potential changes due to the environmental degradation of water. The data analyses were performed by considering all recommendations of standard methods of analysis in the collection, acquiring, transferring, and conservation of aquatic samples. A 500 mL of the sample for metallurgical analysis added to 5 mL of concertation HNO3 to be analyzed within one hour after sealing. This treatment was used to reduce the absorption of minerals on the walls of the container. This process was carried out four times each season. To measure the tidal movement of water in the river, about 55 × 1.5 L of river water is packed in special and sealed in plastic containers. At the end of each day, the samples were sent to the laboratory for testing and measurements. The water quality parameters of TDS, TH, SO4, Cl, turbidity, Na, PO4, TOC, Cd2+, Cr3+, and Se were analyzed in the laboratory during the period commenced in December 2018 through October 2019. The Aqua Read of Global Positioning System, GPS (Aqua meter, model: AM-200, Broadstairs, Kent, UK) was conducted to measure the TDS, pH, EC, turbidity, temperature, and salinity concentrations. The TDS concentrations were measured according to the Association of Official Agricultural Chemists (AOAC) standards, by evaporating the size of 50 mL of the measured sample and calculating the weight difference. The spectrophotometer (Model: U-1500, Granger, IN, USA) was used to measure the SO4, PO4, and NO3. The SO4 was determined using the turbidity method. The turbidity method was estimated based on AOAC Standards. The PO4 was also determined by the spectrophotometer to measure optical absorption at a wavelength of 885 nm. This method was applicable in 0.03–5.00 µg/L range. The Atomic absorption (AA-7000/AAC, Dual Atomizer System, Tokyo, Japan) was conducted to measure heavy metals elements. Air-acetylene flame was used to measure Cd2+, Cr3+, and Se. The sample range and wavelength were 0.0 to 1.0 ppm and 228.8 nm, respectively, for Cd2+.
2.5. Analysis of Water Quality Parameters Using Spatial Distributions
GIS was considered as a very efficient and economical choice for planners to develop an instrument that is spatially area-wide with inbuilt water quality protection programs. The application of this technique permits users to cover overlaying, determine and analyze rates of pollutant load, and provide temporal and spatial information characteristics of water surface [52]. The pollution path in SAA was formulated utilizing Excel and GIS ArcView 10.4.2 (Esri, Redlands, CA, USA). Global references and coordinates for each location were recorded by mobile GPS. Google Earth was used as a support tool to provide the required input data for adopted chemical parameters in the stations described above for operating the GIS model. Integration for the locations of sampling along with the data of water performed to yield the maps of spatial distribution. Analysis of spatial tools and interpolating a raster surface were used along with the Kriging technique for interpolation of the spatiality of water quality parameters. Methods of interpolation of Kriging are mostly applied to determine the quality of water parameter values in stations where not determined in the area of study for analysis comparison among the year seasons.
2.6. Kriging Method
There are several methods to obtain the interpolation of water quality data such as; inverse distance weighted (IDW), Kriging technique, minimum curvature method, natural neighbor technique, nearest neighbor method, and others. The Kriging interpolation method via GIS was selected in this study because it obtained a suitable technique and provided reasonable results to describe the water quality parameters. Krige, a mining geologist from South Africa, developed the Kriging technique [53]. The techniques used models based on statistics and incorporate auto correlation and presented prediction surfaces [54]. They have given weights and measured points in view of distance and quantified the auto correlation, so that weight of spatial arrangement provides sampling location [54]. By accounting for statistical distance with a variogram model, as opposed to Euclidean distance utilized in deterministic interpolation, customization of the estimation method to a specific analysis is possible. Isaaks et al. [55] described that if the variogram model is used to explain the pattern of spatial continuity, the improvement in estimation is hard to describe by the process of kriging.
Given the statistical properties of this method, measures of certainty or accuracy of the predictions can be produced using a cross-validation process. Ordinary Kriging is one of the most basic of Kriging methods. It provides an estimate at an unobserved location of variable z, based on the weighted average of adjacent observed sites within a given area. The theory is derived from that of regionalized variables [56] and can be briefly described by considering an intrinsic random function denoted by z(si), where si represents all sample locations, i = 1, 2, ..., n.
An estimate of the weighted average given by the ordinary Kriging predictor at an un-sampled site z(s0) is defined by:
where λ is the weights assigned to each of the observed samples. These weights sum to unity so that the predictor provides an unbiased estimation:
z(s0) = ∑ni = 1 λi z(si)
∑ni = 1 λi = 1
The weights are calculated from the matrix equation:
where A is a matrix of semi ariances between the data points; b is a vector of estimated semi-variances between the data points and the points at which the variable z is to be predicted; and C is the resulting weights.
C = A − 1 × b
Hooshmand et al. [57] investigated groundwater quality parameters using both kriging and co-kriging methods in spatial estimation to determine the quality of groundwater. The results of the study showed that excessive usage of aquifers may result in reduced quality. It’s pointed out the most important standards of water quality were chloride content and sodium absorption ratio (SAR). They were very useful in this study. The content of chloride and SAR is determined from groundwater in the Boukan area by irrigation water salinity. A comparison of the results obtained indicated that, for both the SAR and Cl parameters, the co-kriging method was more accurate than the kriging method. However, they vary slightly, and in general, both methods have an appropriate accuracy for estimating SAR and chlorine based on the salinity coefficient of water.
3. Results
3.1. Total Dissolved Solids
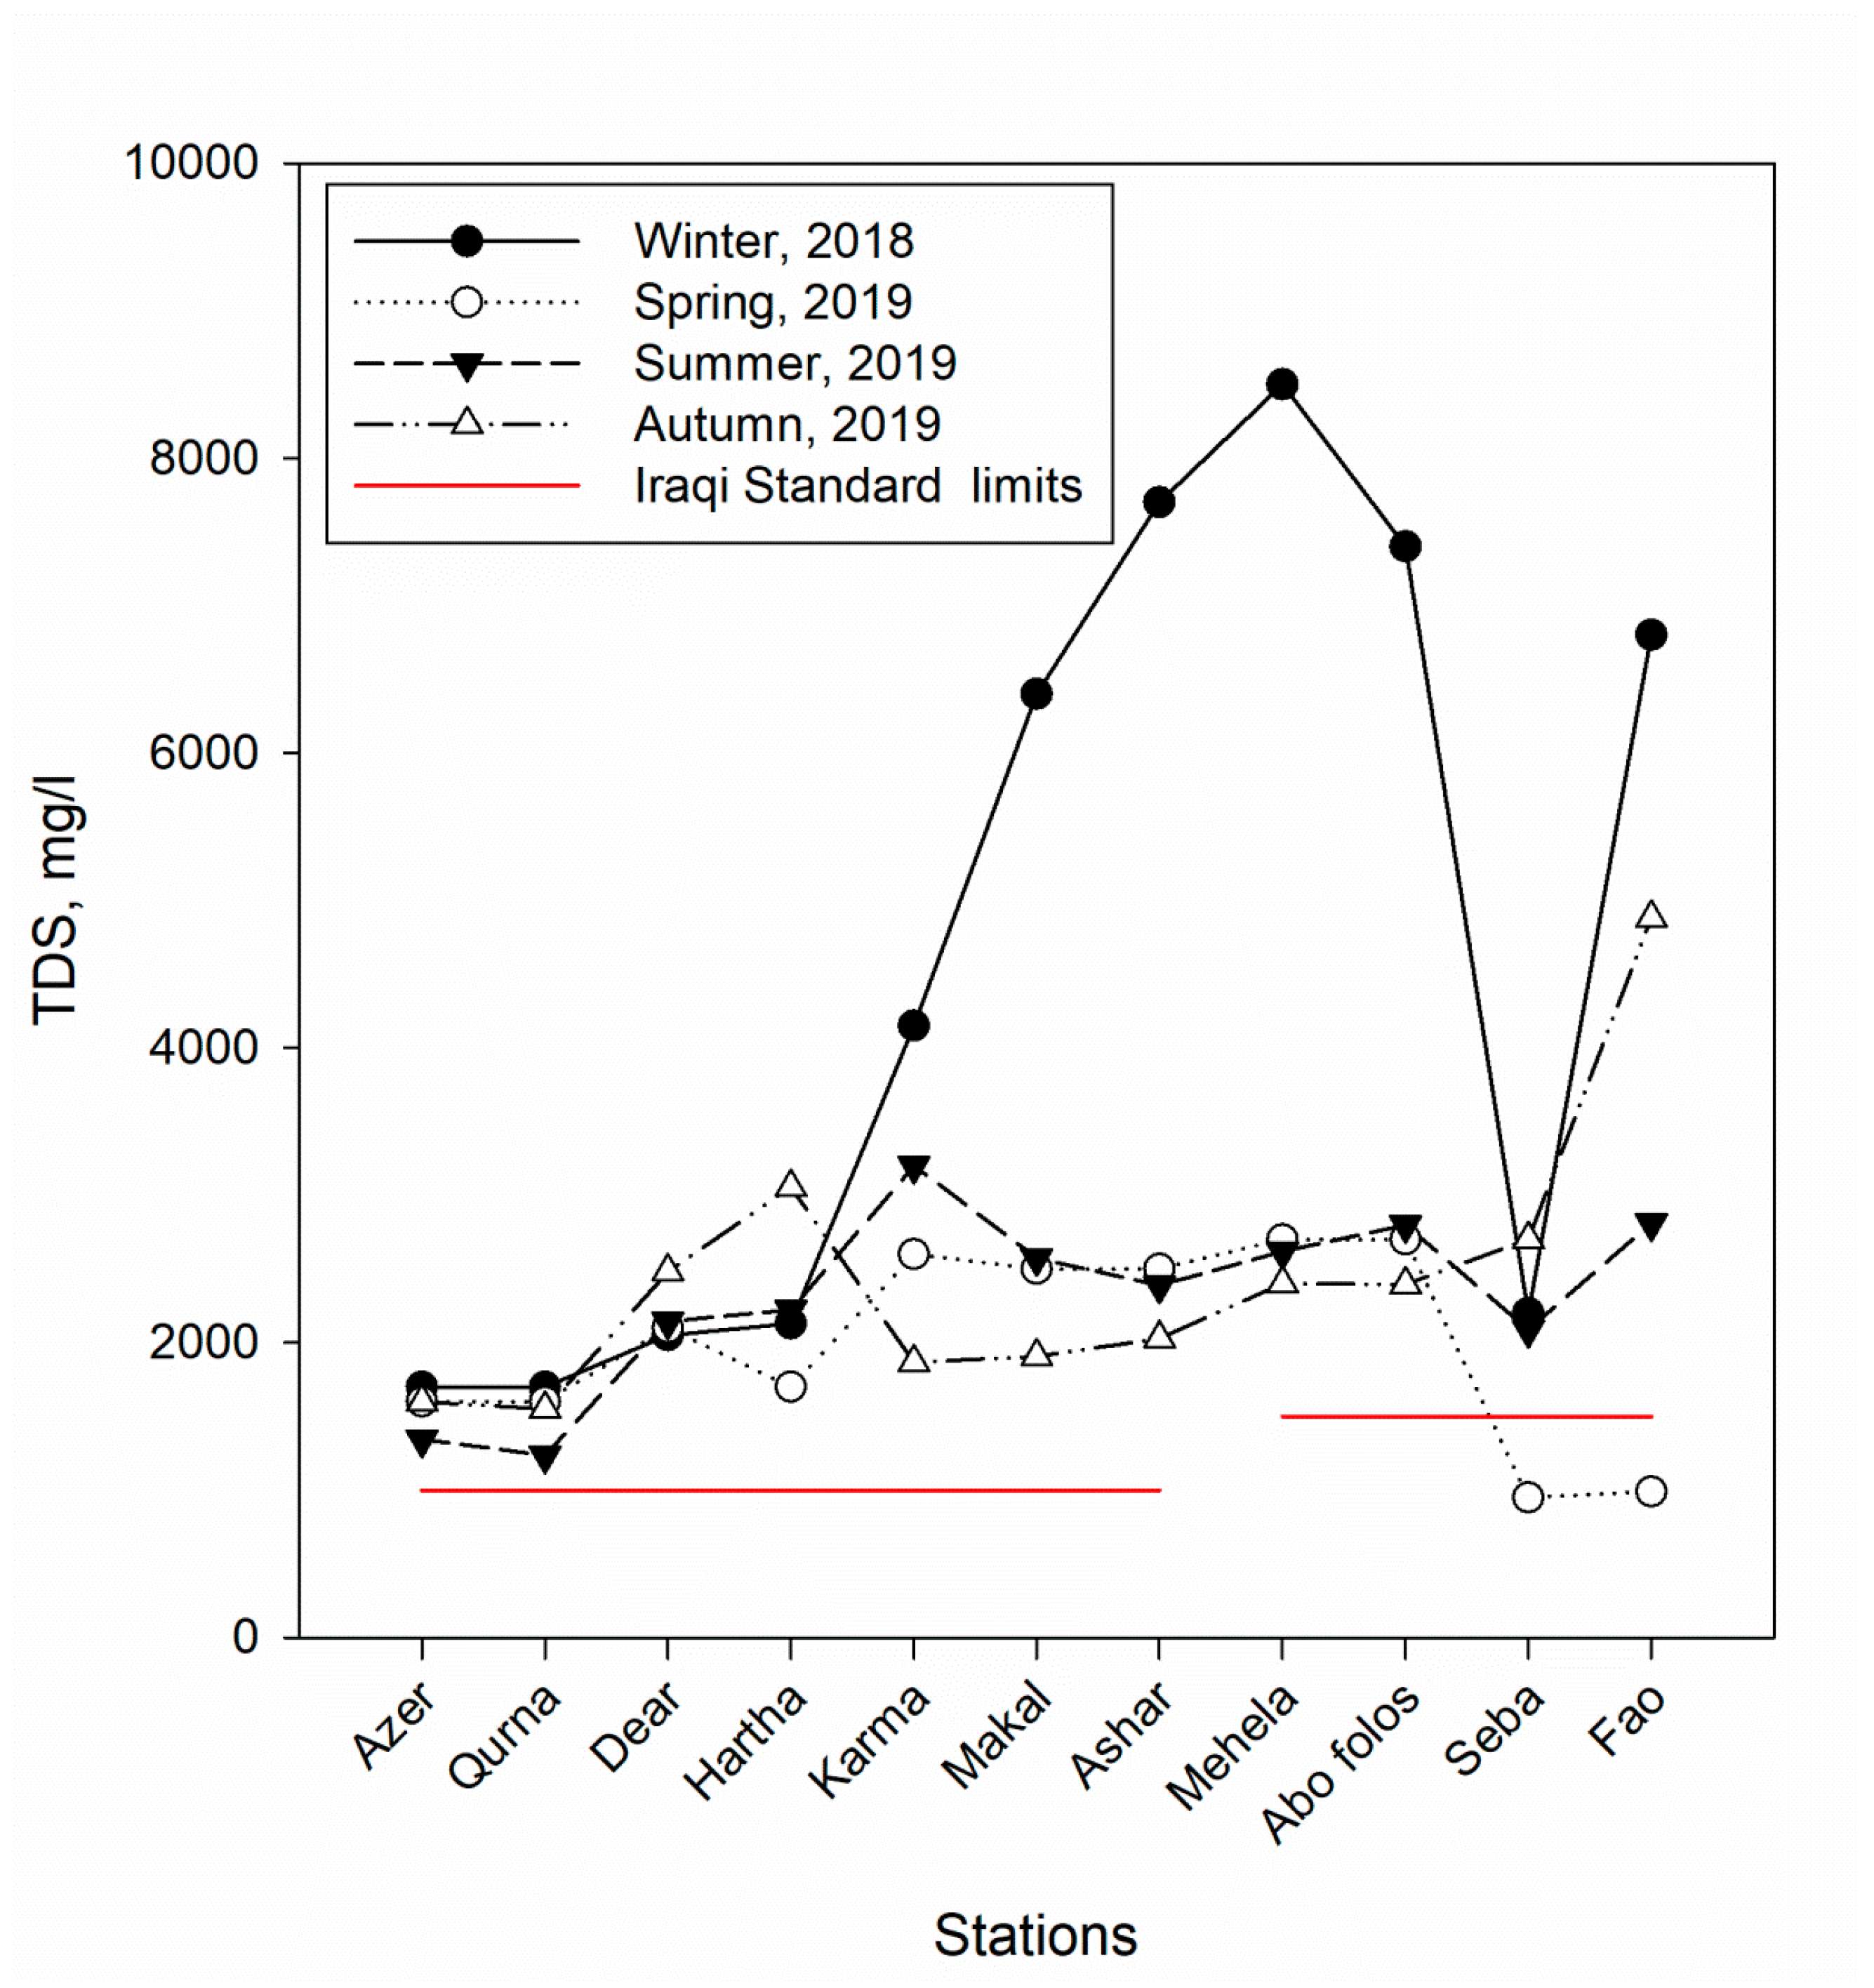
The newest Iraqi standards divided SAA into two sections which include areas from the north of Basra to the city center with a TDS value of 1000 mg/L and areas from Mehela to Fao with a TDS value of 1500 mg/L (Figure 1). Results proved that extent of variance between the highest and lowest value of this variable exceeded the parameters determined by the Iraqi standards. The value of 7700 mg/L was the highest in Al-Ashar area which is within the first section of Shatt Al-Arab and 8500 mg/L in the Mehela area within the second section during the winter season (December 2018), as shown in Figure 3. The lowest value of TDS reached 1235.2 mg/L in the Qurna area during the summer (July 2019) within the first section of SAA while the second section of it had the lowest value of TDS which was 950 mg/L in Al-Seba during the spring (March 2019). Throughout many previous studies that have measured the TDS levels in the SAA, it can be noticed that the TDS concentration generally increased towards the mouth of the river [58]. Also, there was a positive correlation between temperature increases and the TDS concentrations in SAA River as a result of high rates of evaporation leading to increased salt concentration [59].
Moreover, a negative correlation between TDS and the water amount discharge at the river has been found. For example, when river discharge declines, the TDS values increase [60]. The TDS level is also affected by tidal movement, and a measurable increase in the TDS concentration has been linked to the ebb tide at the River [48]. Furthermore, in winter, high TDS concentrations of 2018 in comparison with season summer attributed to the solids addition from effluents of sewage and runoff water that elevates the values of TDS. The obtained results agreed with the results found by Hassan et al. [49], who concluded that values of TDS in Euphrates River elevated in months of winter and declined in months of summer. According to Reid [61] classification, water is oligohaline (0.5–5 PSU) to mesohaline (5–18 PSU) in the current study. The results also revealed that all of the TDS concentrations exceeded the Iraqi standards and WHO standards (1000 mg/L) except the two readings in Al-Seba and Al-Fao stations which were 950 and 990 mg/L, respectively, during spring 2019. For example, during winter 2018, the TDS concentration in Mehela station was 8500 mg/L which is way higher than the two standards.
Figure 4 illustrates the seasonality values changes in TDS concentrations through four seasons of 2014 to 2019. The results showed that all the readings of the TDS concentrations exceeded the Iraqi Standards, except for three readings during winter, spring, and summer of 2017 (320 mg/L in the station of Al-Karma, 22.2 mg/L in Al-Mehela station, and 916 mg/L in Al-Karma station), respectively. The highest autumn values were registered in 2018 in the station of Al-Fao. On the other hand, the values as the lowest ones were registered in spring 2017 at Al-Mehela station.
The results showed a gradual increase in the values of TDS concentrations from winter 2014 to attain its lowest value in winter 2017. Then, the values of the TDS concentrations rise again to attain its highest value in winter 2018. It is noticed through the spatial distribution of the values of the concentrations of dissolved solids during the comparative study period for the winter season, that they were rising gradually during the years from 2014 to 2016, while fluctuations in the values appear between high and low in the years 2017 to 2019, to record the lowest reading of 320 mg/L during 2017 and the highest reading of 25,304 mg/L in 2018 at the Karma and Fao stations, respectively.
In general, relatively low concentrations from 2017 to 2019 indicated high levels of water provided by the Euphrates and Tigris rivers. Various conclusions have been proposed by Hussein et al. [62] and Hammadi [63]. The concentrations of the dissolved solids increased gradually towards the mouth of the river, which coincides with the increase in salinity. This is consistent with the results obtained by AL-Lami [64]. It was also noticed, through the spatial distribution of the concentrations of TDS during the comparative study period for the autumn season that they were significantly high during 2018 compared to the results of the year 2019.
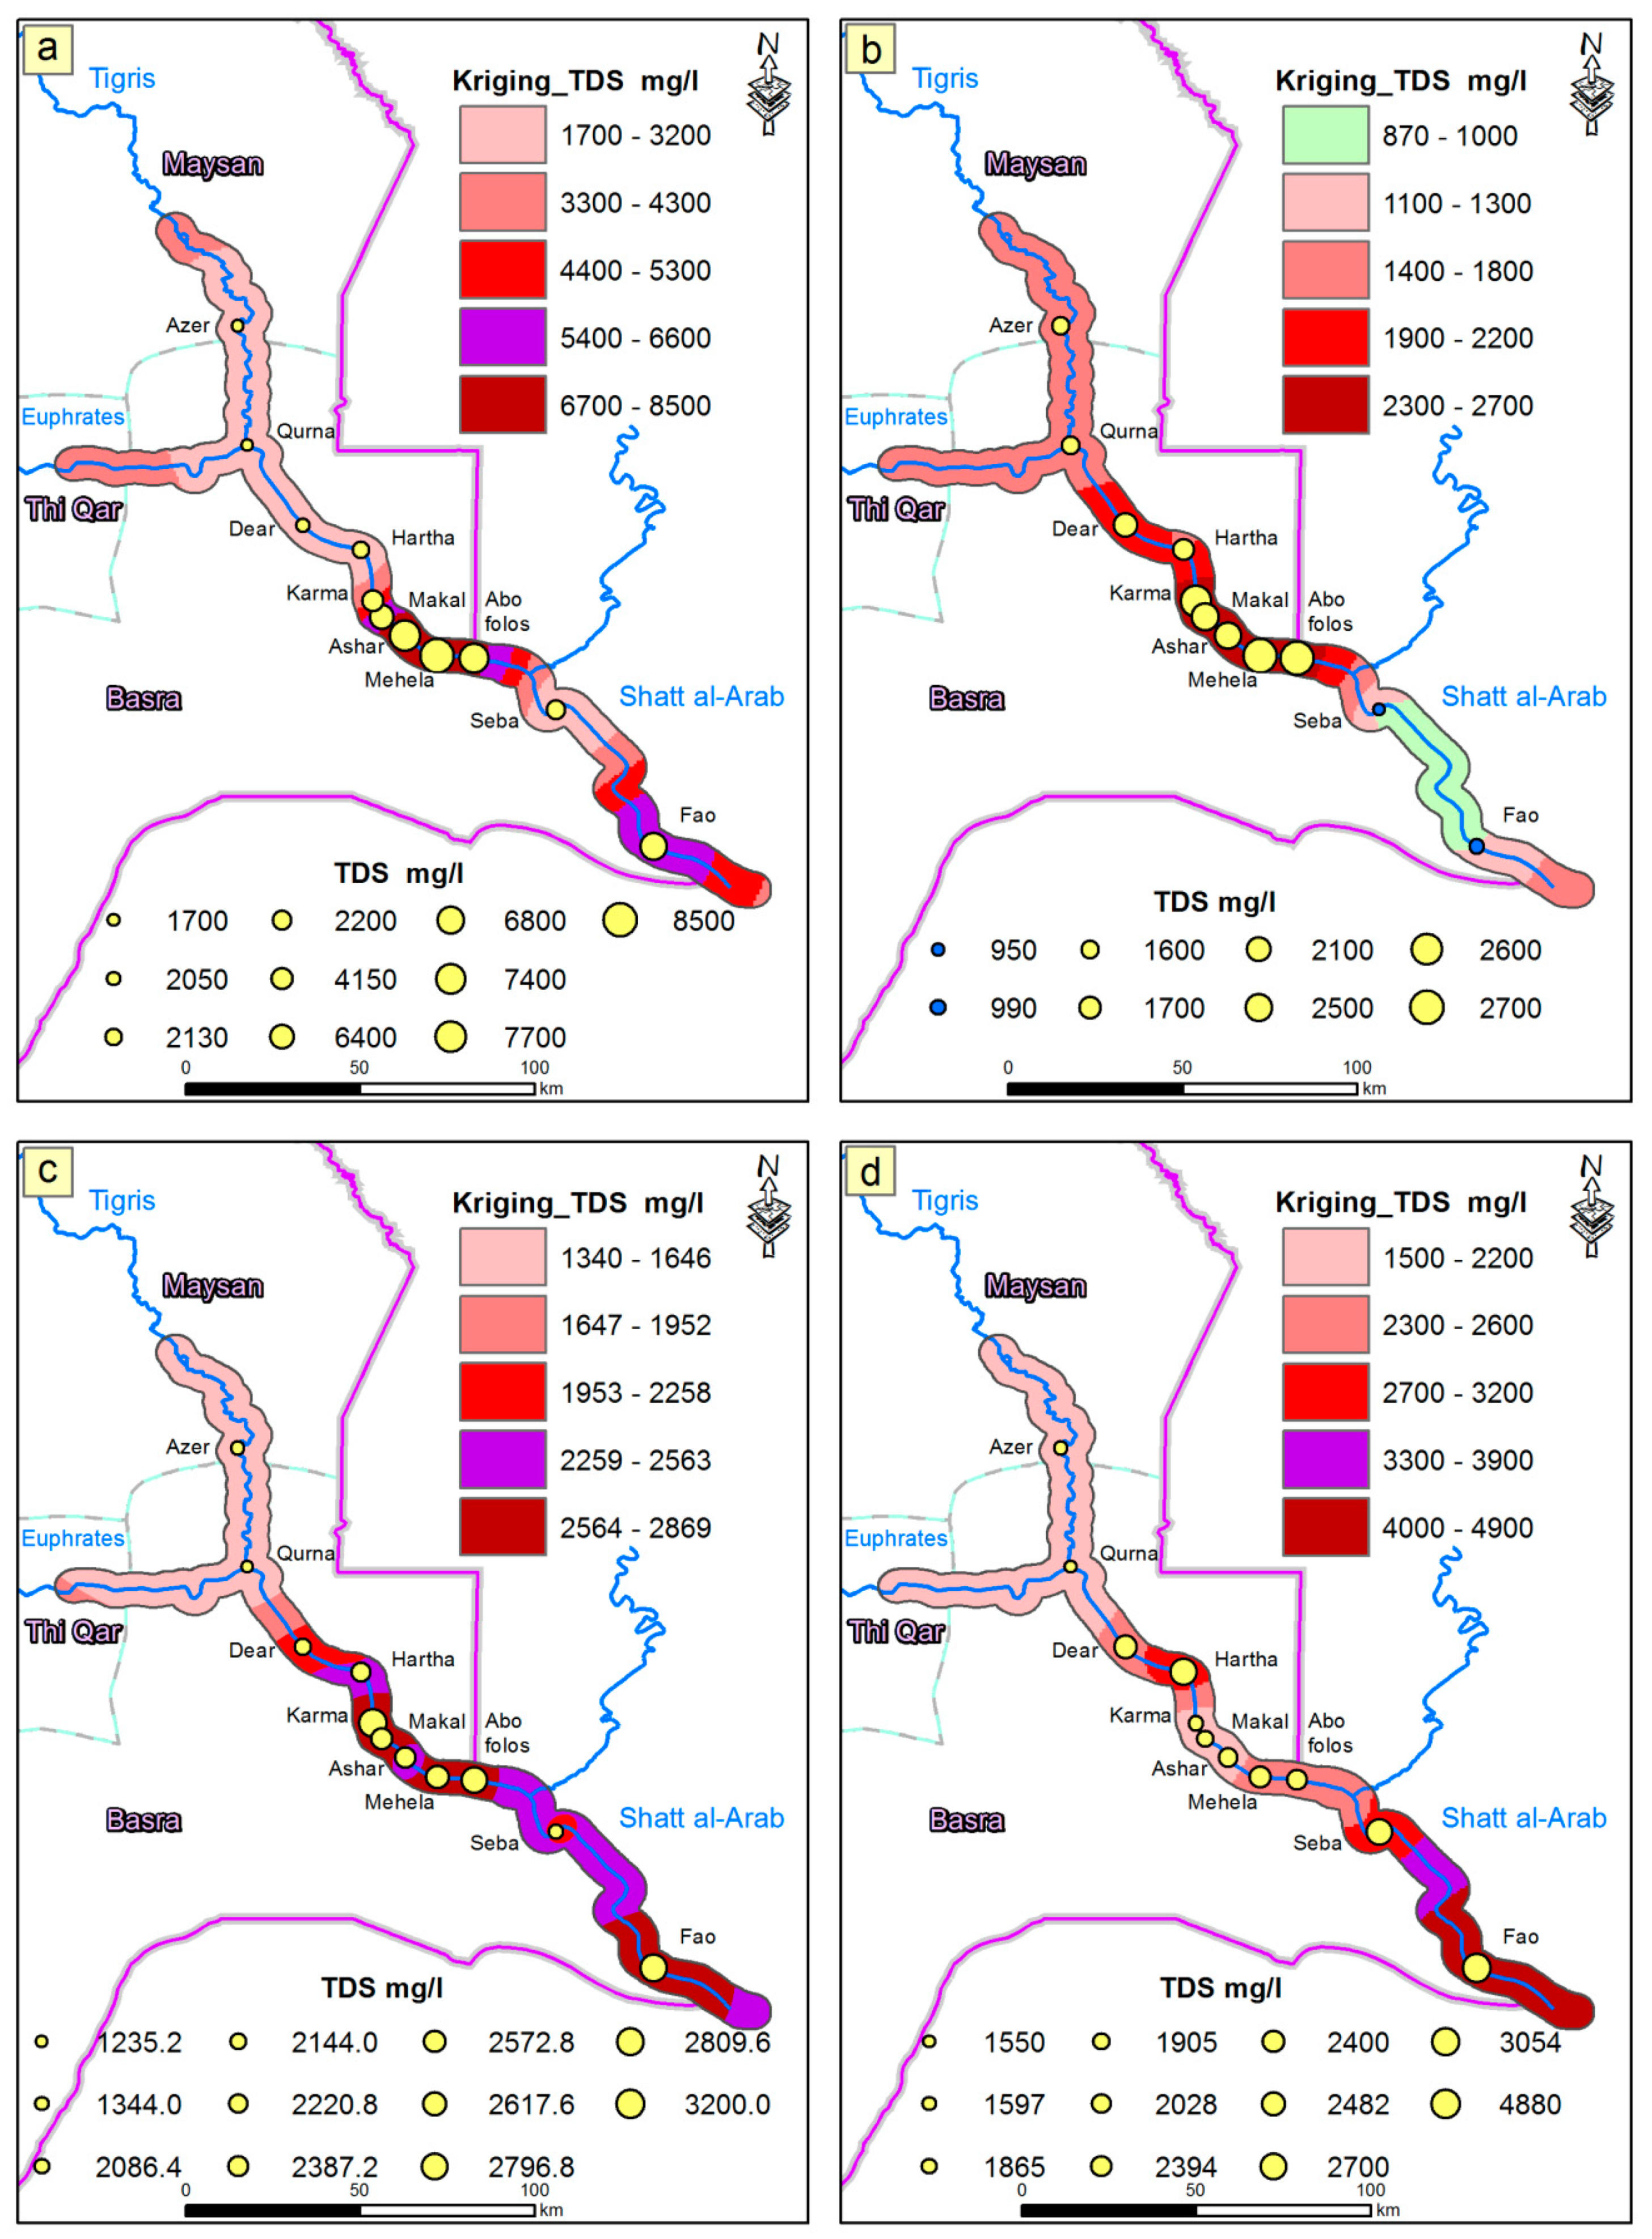
According to Figure 5, high TDS concentration has been noticed in the middle portion of SAA during winter. However, a decrease in the TDS concentration towards the south downstream of the river was noticeably observed at Seba station. Then, it increases to the very south of the river before the entrance of the Arabian Gulf. Furthermore, TDS concentrations in the spring season of 2019 had the same trend as that of the previous season up and down the river. It decreased significantly in the far south of the river, recording the lowest value at 950 mg/L. This metric also displayed a gradual increase from 1235.2 mg/L to 3200 mg/L in the summer of 2019. A significant rise in the far south of the river which had varied values between high and low along the riverbed was observed (Figure 5).
3.2. Chloride
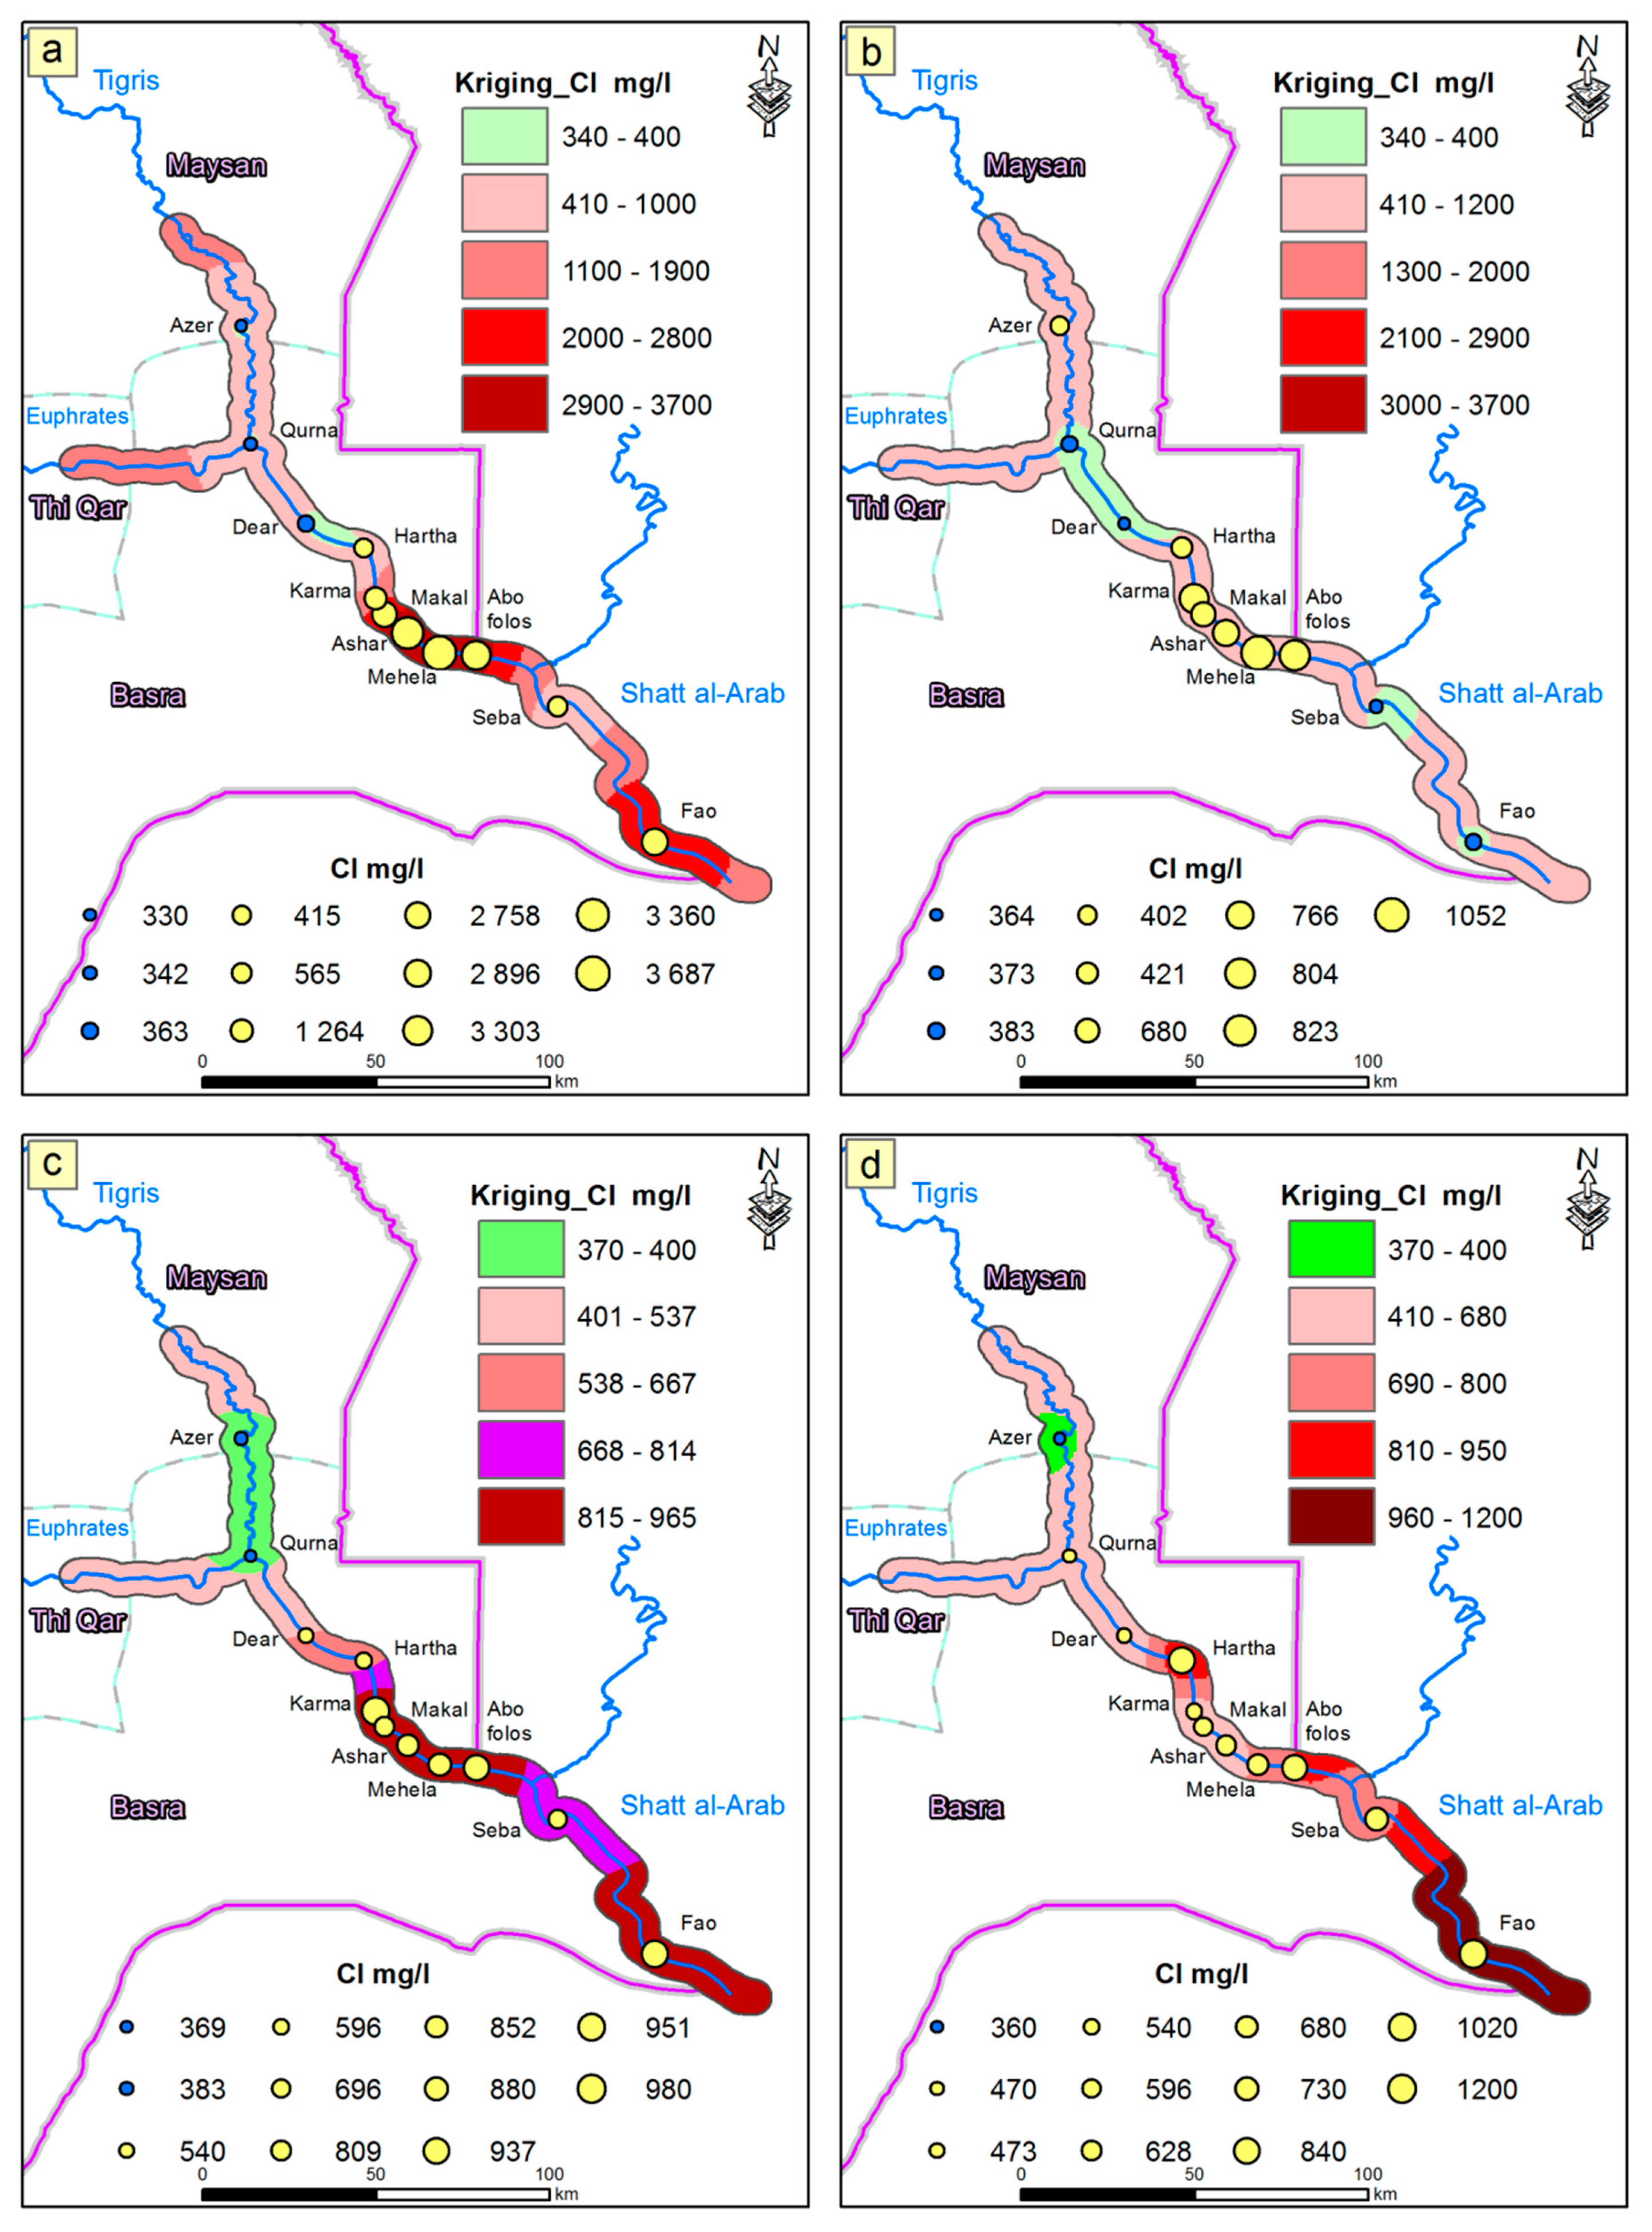
Modern Iraqi Standards have divided the SAA into two sections; the first section includes areas from the north of Basra to the city center with an acceptable chloride limit of 400 mg/L. The second section is from Mehela to Fao with an acceptable chloride limit of 500 mg/L. The results showed a significant variation between the highest and lowest values of the chloride which exceeded the limits as shown in Figure 6. For example, the highest value was 3360 mg/L in Al-Ashar area which is within the first section of Shatt Al-Arab, and 3687 mg/L in Mehela area within the second section during the winter season (December of 2018). However, the lowest chloride value was 330 mg/L in Al-Azer area during winter (December of 2018) which is within the first section of Shatt Al-Arab, while the smallest value of the chloride in the second section was 373 mg/L in Al-Seba during the spring (March 2019). The results revealed that most of the chloride concentrations exceeded the Iraqi and international standards. For example, during winter 2018, the chloride concentration in Al-Karma station was 1264 mg/L which is way higher than the Iraqi standards, WHO standards (250 mg/L), and European Union standards (200 mg/L).
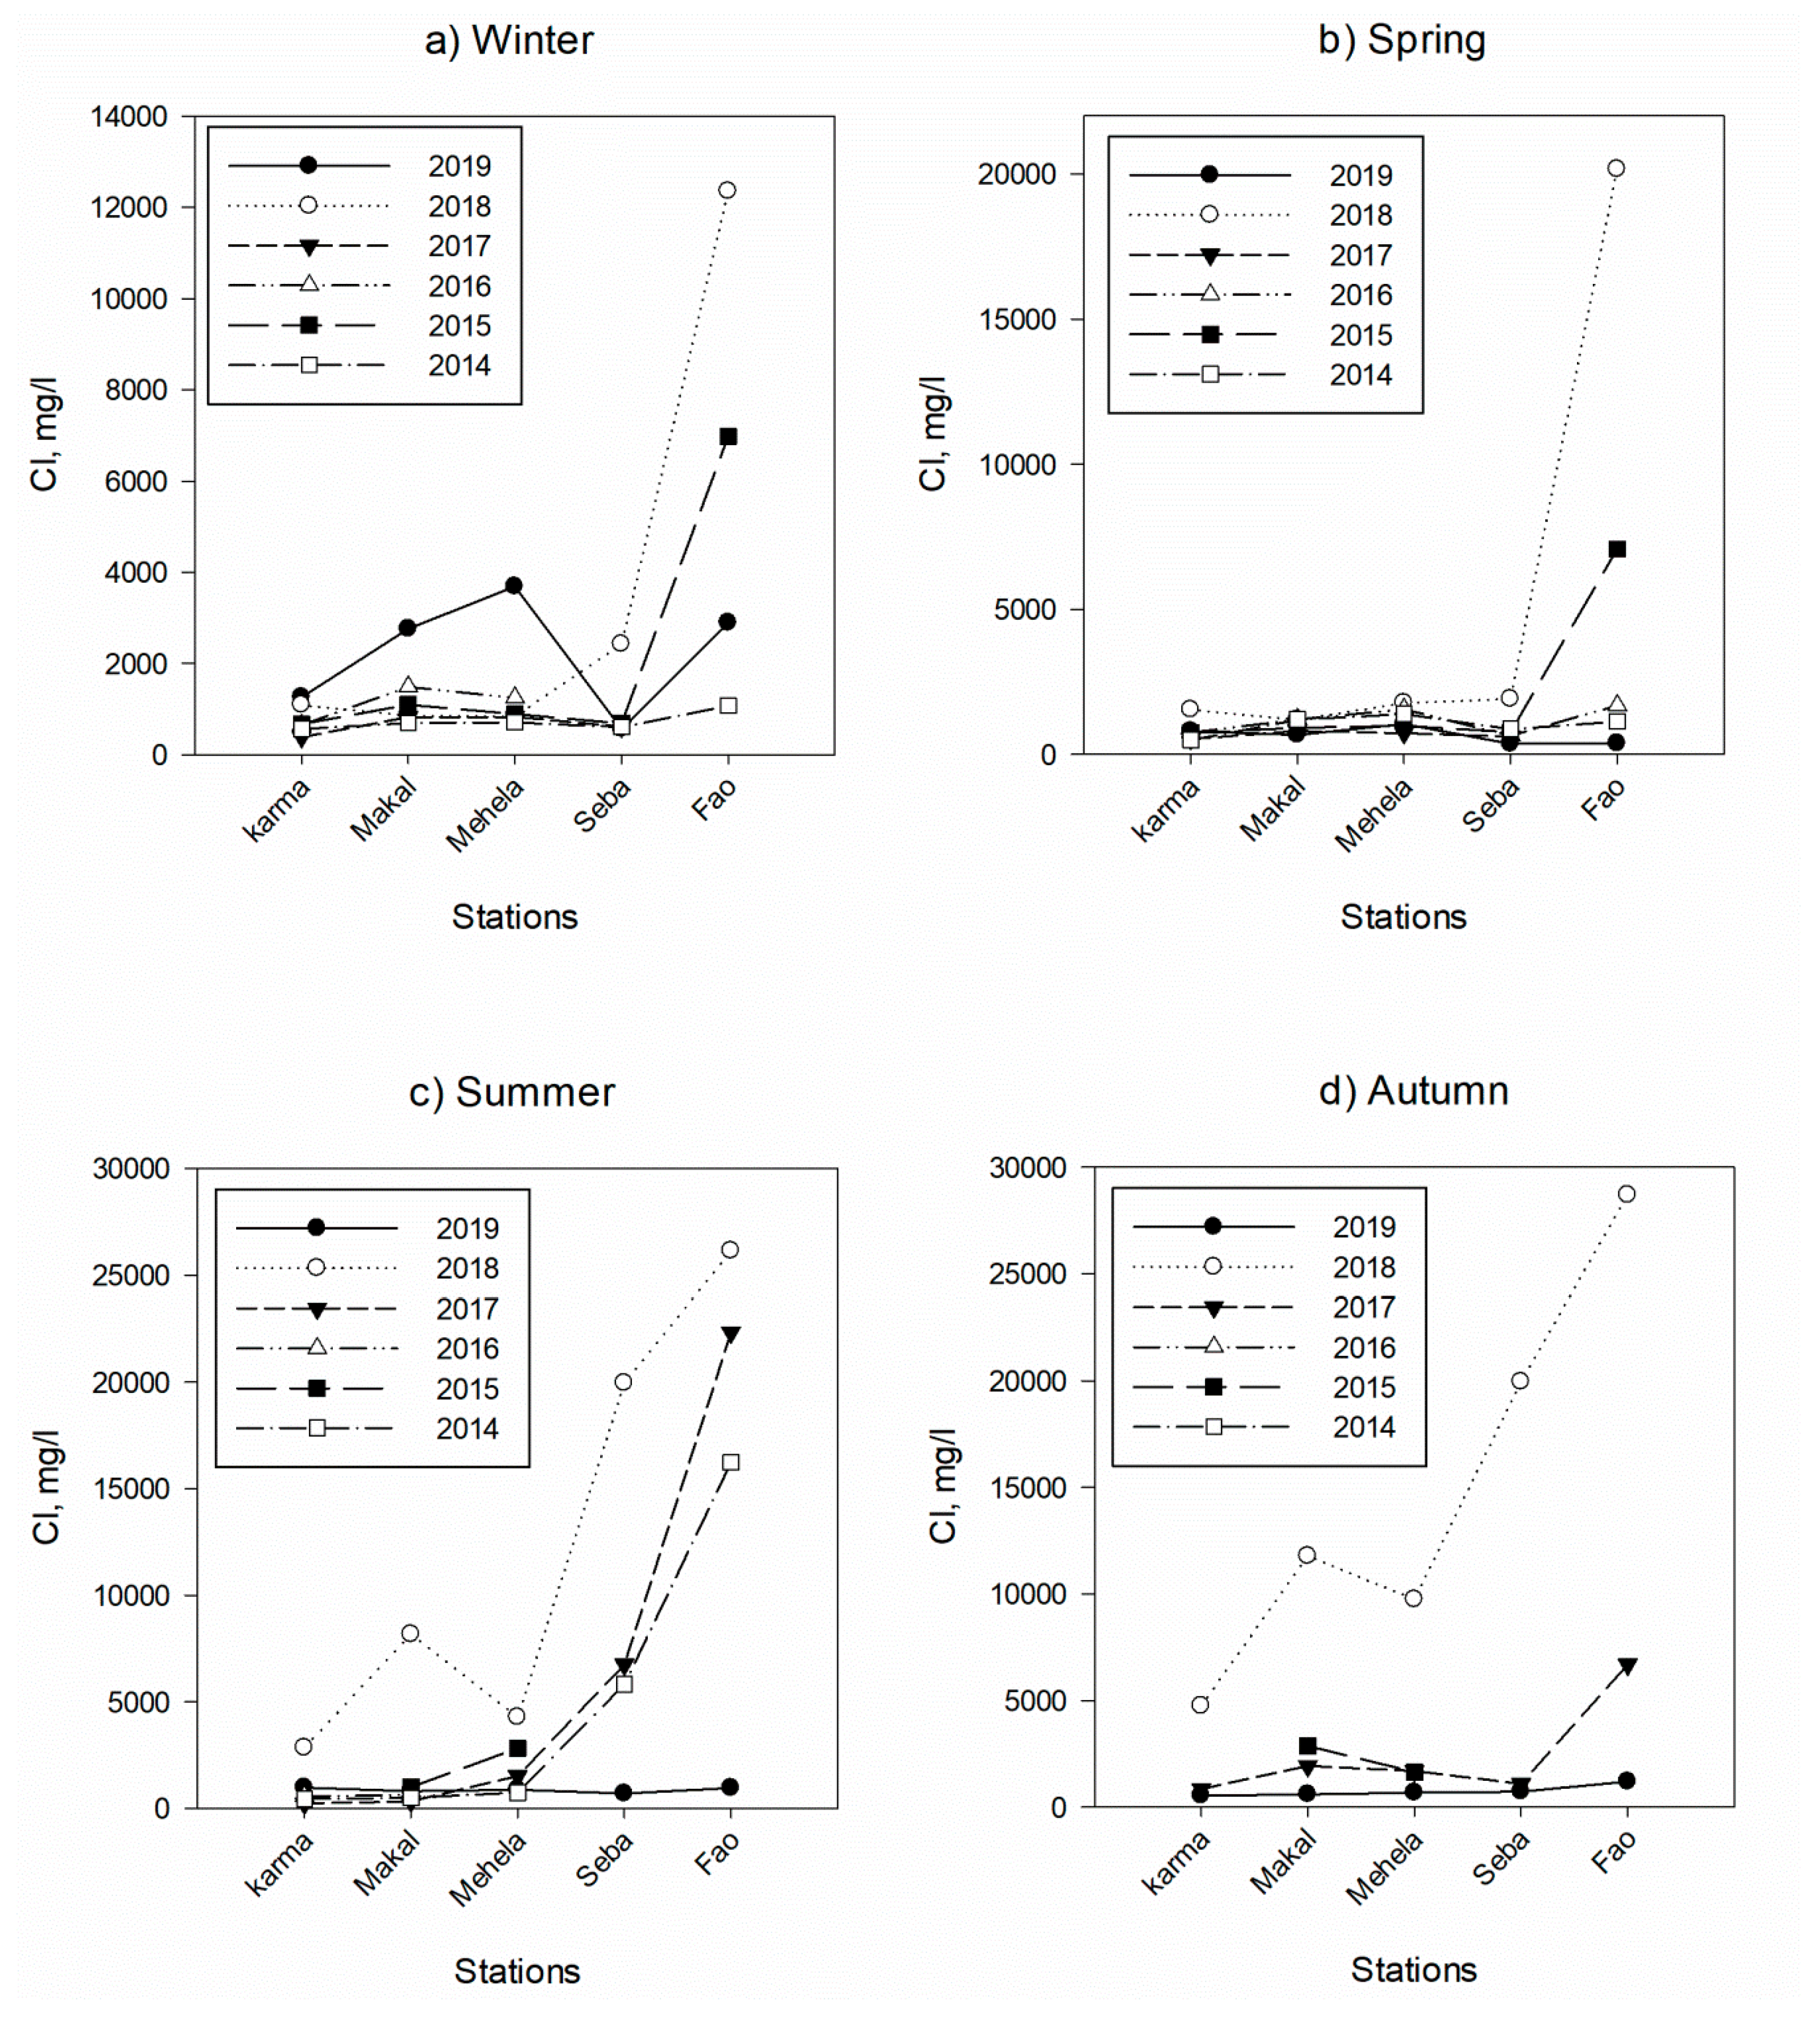
Figure 7 illustrates the seasonality values changes of Cl concentrations through the four seasons of 2014 to 2019. The results showed that all the readings of the Cl concentrations exceeded the Iraqi and International Standards. The highest autumn values were registered in 2018 at the station of Al-Fao. On the other hand, the values as the lowest ones were registered in summer 2017 at Al-Karma station. A gradual increase was observed in the values of Cl concentrations from winter 2014 to attain its lowest value in winter 2017. Then, the values of the Cl concentrations rise again to attain its highest value in the Seba and Al-Fao stations during winter 2018 and in Karma, Makal, and Mehela stations during winter 2019. Additionally, the values of chloride concentrations follow the same path taken by previous variable concentrations in this study in terms of oscillations and differences between high and low concentrations during other seasons. It was noticed through the spatial distribution of the values of the concentrations of Cl during the comparative study period for the winter season that they were rising gradually during the years from 2014 to 2016, while fluctuations in the values appear between high and low in the years 2017 to 2019.
It was observed that the concentrations of chlorides varied at stations of selection throughout the current investigation, in addition to gradually increasing their levels towards the south in the Al-Fao district, but at lower rates than the concentrations in the part of northern and central Shatt Al-Arab, in some elements, it may reach half. The highest concentrations were due to the quality of the water supplied from Tigris and Euphrates Rivers as well as Karun Stream (Figure 1 and Figure 2) and the weather conditions. In addition, the quantities of soil deposits from the adjacent shoulders that contain them and have the greatest effect in raising the above-mentioned concentrations rates, especially in the southern of SAA stations, where they contributed to raising the rates of the elements due to the flooding of water on two sides of SAA River and its mixing with the salty soil adjacent to it. In general, relatively low chloride concentrations from 2017 and 2019 indicated high water levels due to increased water releases from the Karun River and both Euphrates and Tigris rivers. This increased concentration in chloride made the sites selected unsuitable for drinking needs according to Iraqi and WHO standards [65].
The results of the spatial distribution of chloride concentrations in winter 2018 are illustrated in Figure A1 (see Appendix A). It was observed that chloride records started with natural values that are within the natural limitation in the higher portion of the river up to Karma Ali station. In Karma Ali, a very high concentration was recorded compared to the upstream concentrations. This rise continues gradually to the port of Abo Folos station in the south, while followed by an explicit decline in the Seba station and then rose at far south of the river at Fao station. Readings in this chapter ranged from 330 mg/L in Al-Azer station to 3687 mg/L in Al-Mehela Station. The spatial distribution of chloride concentrations in spring 2019 indicated a gradual increase in the concentrations values starting from the middle and south of Shatt Al-Arab, where the highest concentration is 1052 mg/L. Then, there was a marked decrease in chloride concentration towards the south. Although all the recorded readings of chloride exceeded the limit during summer 2019, there was an apparent variation in the spatial distribution between low and high concentration values along the Shatt Al-Arab stream. An exception was recorded in Al-Azer and Al-Qurna stations, where they were within the allowed limit.
3.3. Sulfate
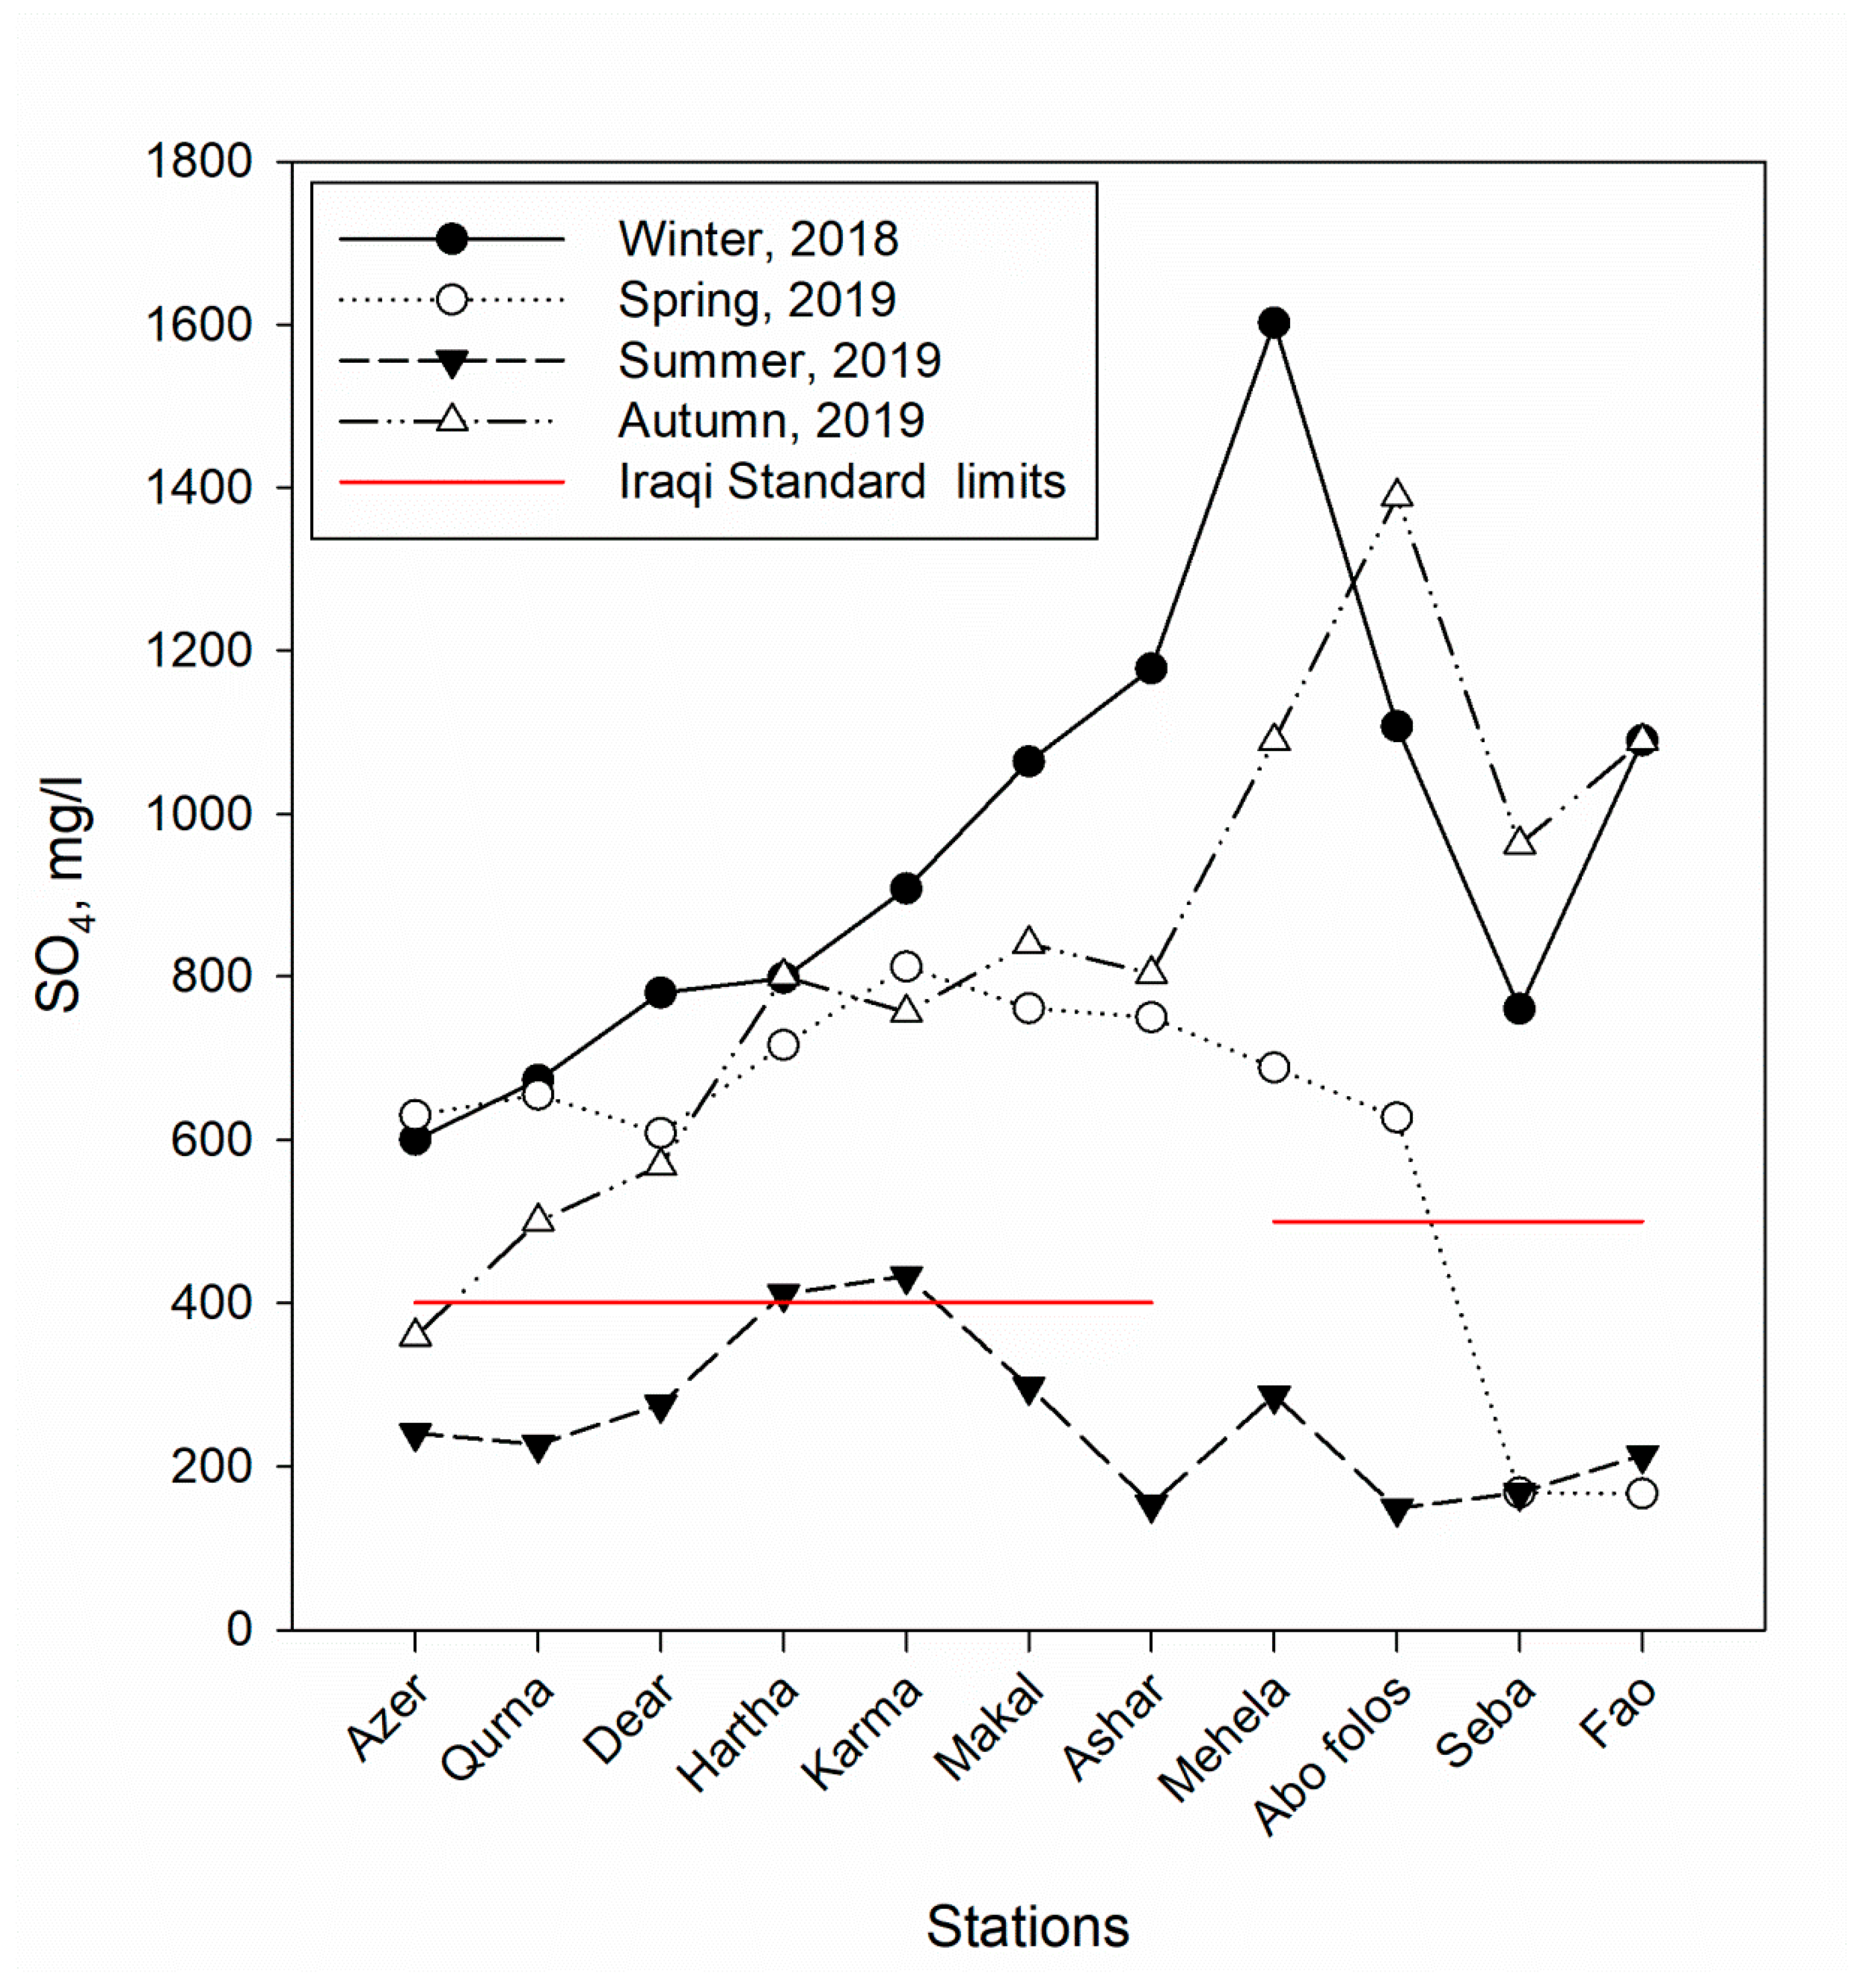
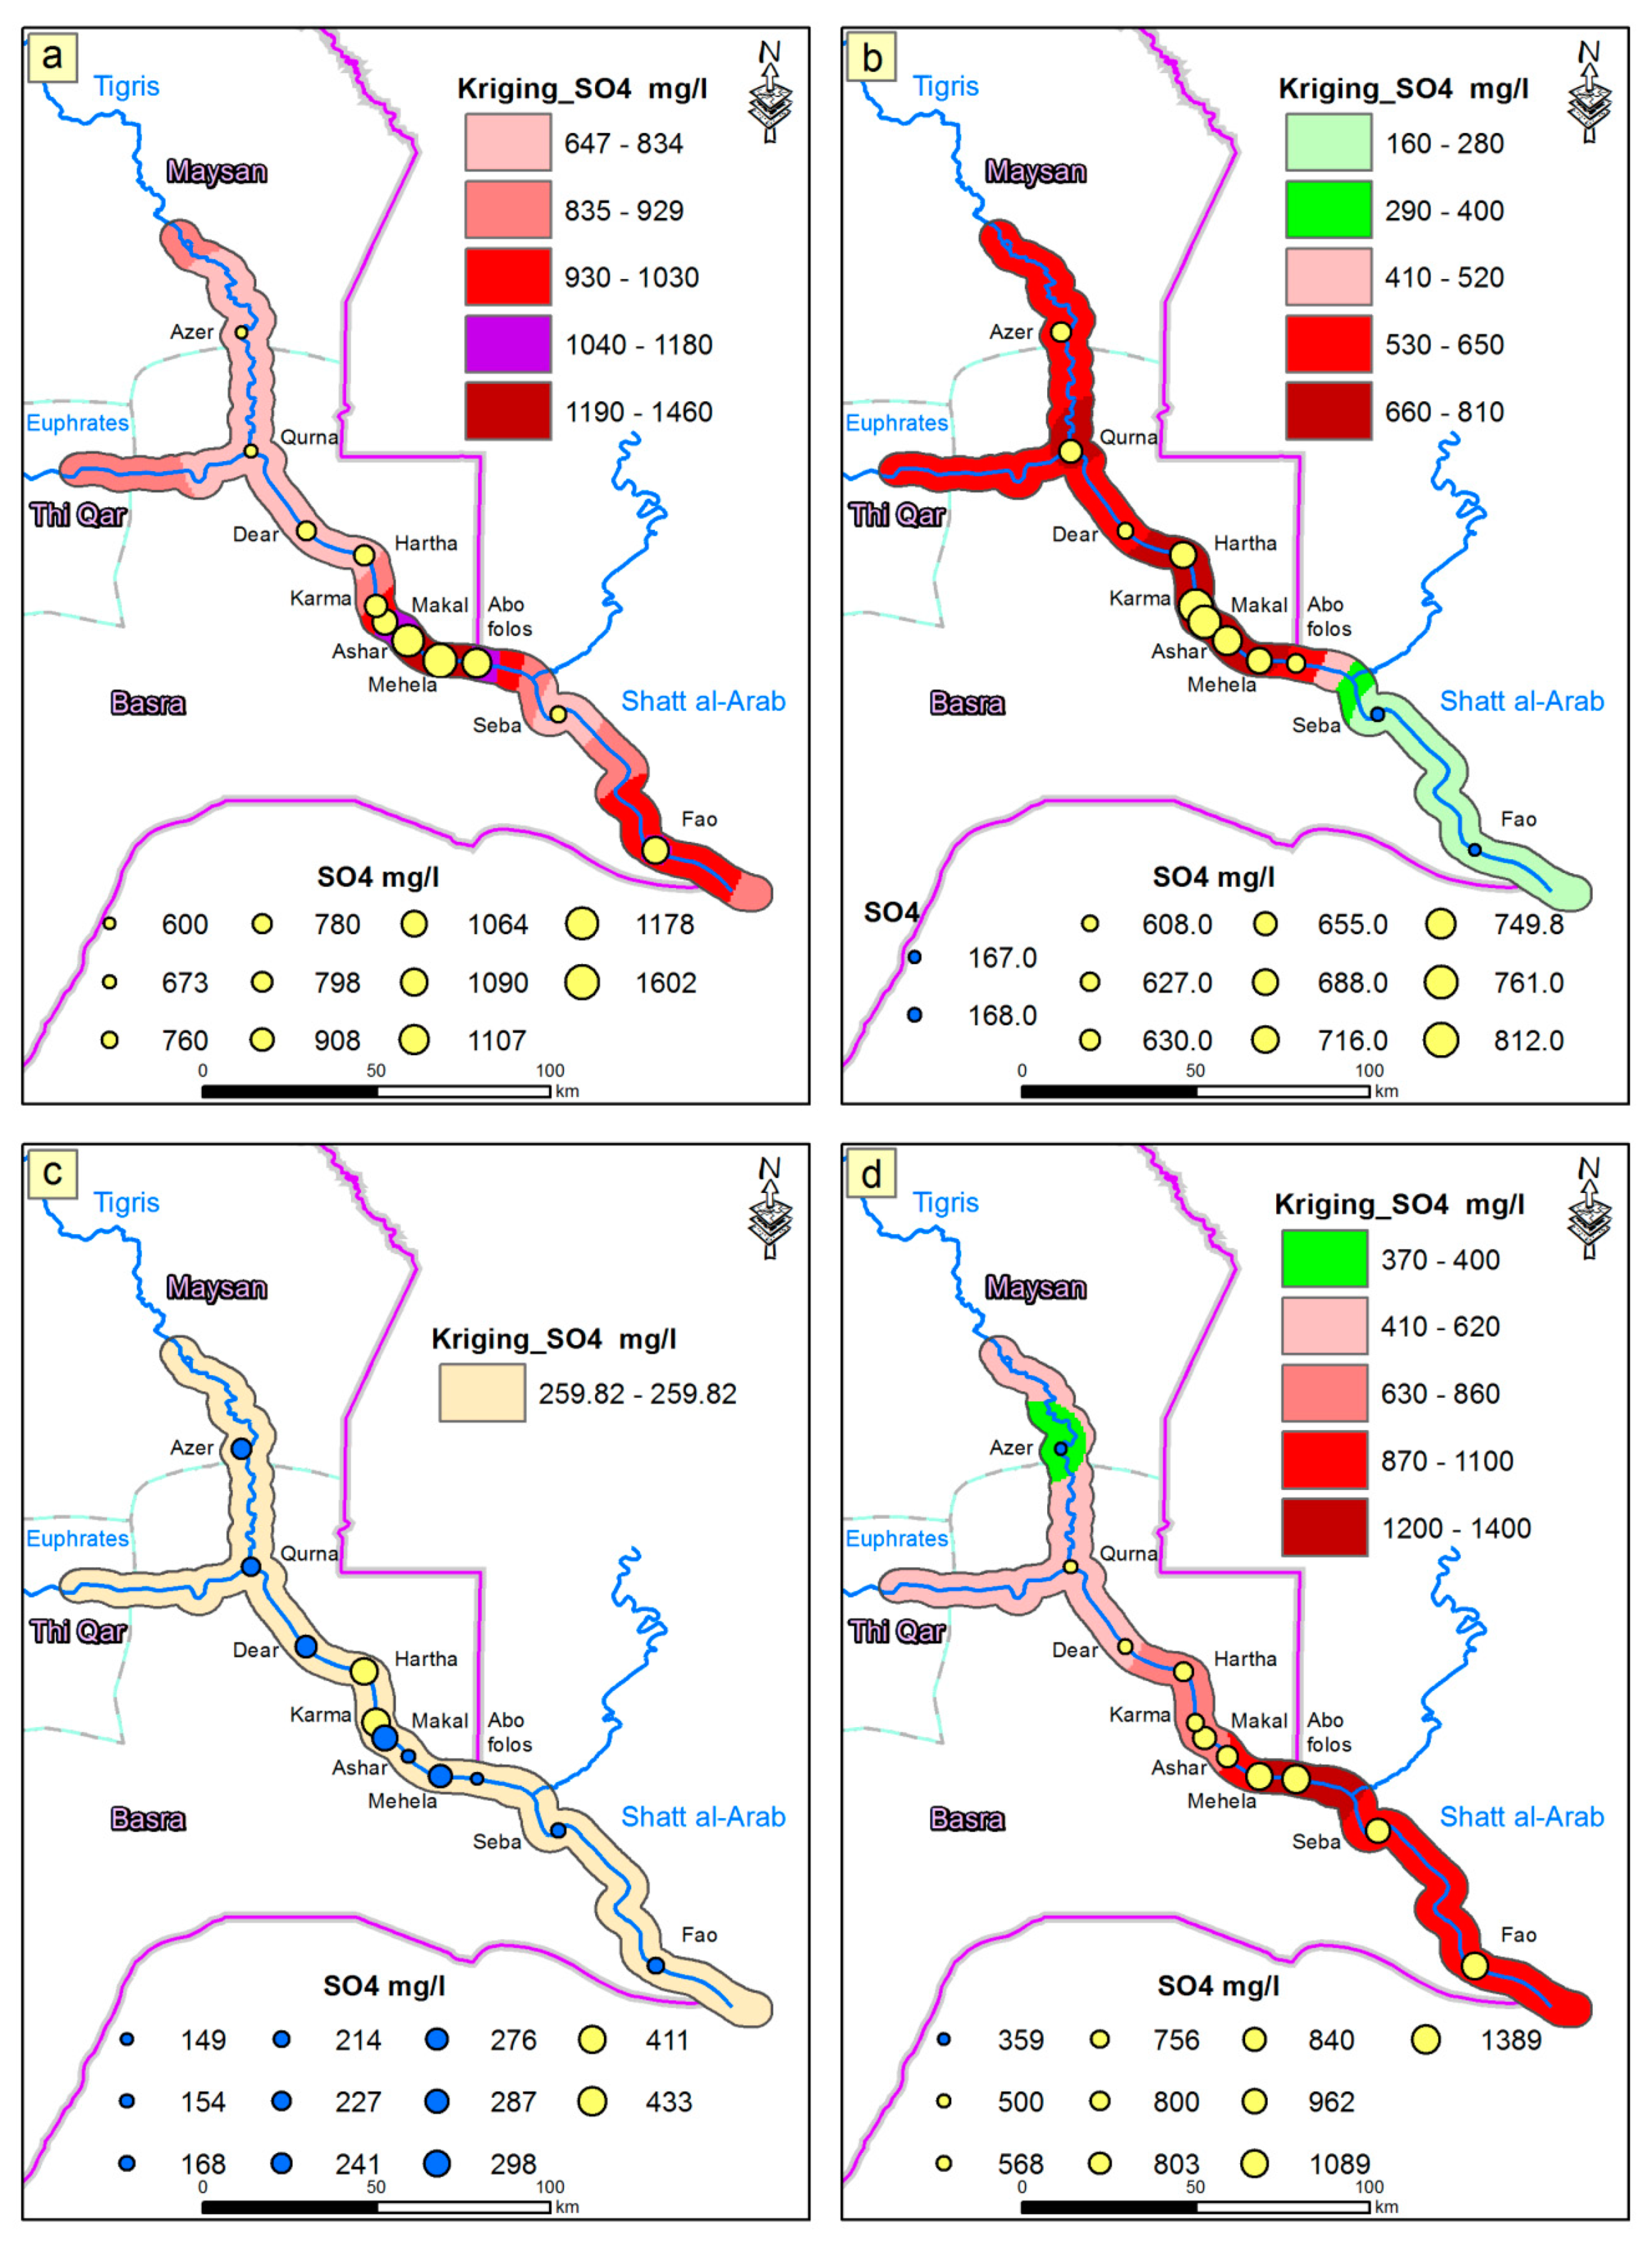
The results of sulfates display an apparent increase in their values from the limit Iraqi standards of the first section of SAA River, which was 400 mg/L. An exception of this increase in the values of the sulfate concentrations was in the regions of Al-Azer, Al-Qurna, Al-Makal, and Al-Ashar which reached 241, 227, 298, and 154 mg/L, respectively, during July 2019 (Figure 8). Likewise, during October 2019, the values of the sulfate concentrations in Al-Azer station reached 359 mg/L. The results in the first segment were ranging from 154 to 1178 mg/L, where the lowest value was registered in the station of Ashar during July 2019 and the highest value in the same station during December 2018. For the second section of the river, most sulfate values concentrations exceeded the Iraqi standards (500 mg/L) during this study. An exception was in Al-Seba and Al-Fao stations during March 2019 and all the values of the stations in the second section during July 2019. The highest value of the sulfate concentrations was 1602 mg/L in the Mehela station during December 2018, and the smallest value was 149 mg/L in the Abu Folos Port area during July 2019 (Figure 8). High concentrations of sulfate in winter 2018 were due to the high disposal of fuel in SAA that produce a huge amount of sulfate.
The results of a comparison of sulfate concentrations showed that the values of the sulfate concentrations exceeded the 500 and 250 mg/L, which is the limit of the WHO and European Union standards, respectively, in all stations during winter 2018 and spring 2019, excluding the stations of Al-Seba and Fao during spring 2019. Moreover, the sulfate concentrations exceeded 250 mg/L in five stations during the summer of 2019. Furthermore, the values of the sulfate concentrations have exceeded the limit of the WHO standards in all selected stations during autumn 2019, excluding that for the station of Al-Azer which reached 359 mg/L, while the values of the sulfate concentrations exceeded the limit of the European Union standards in all selected stations during the same season.
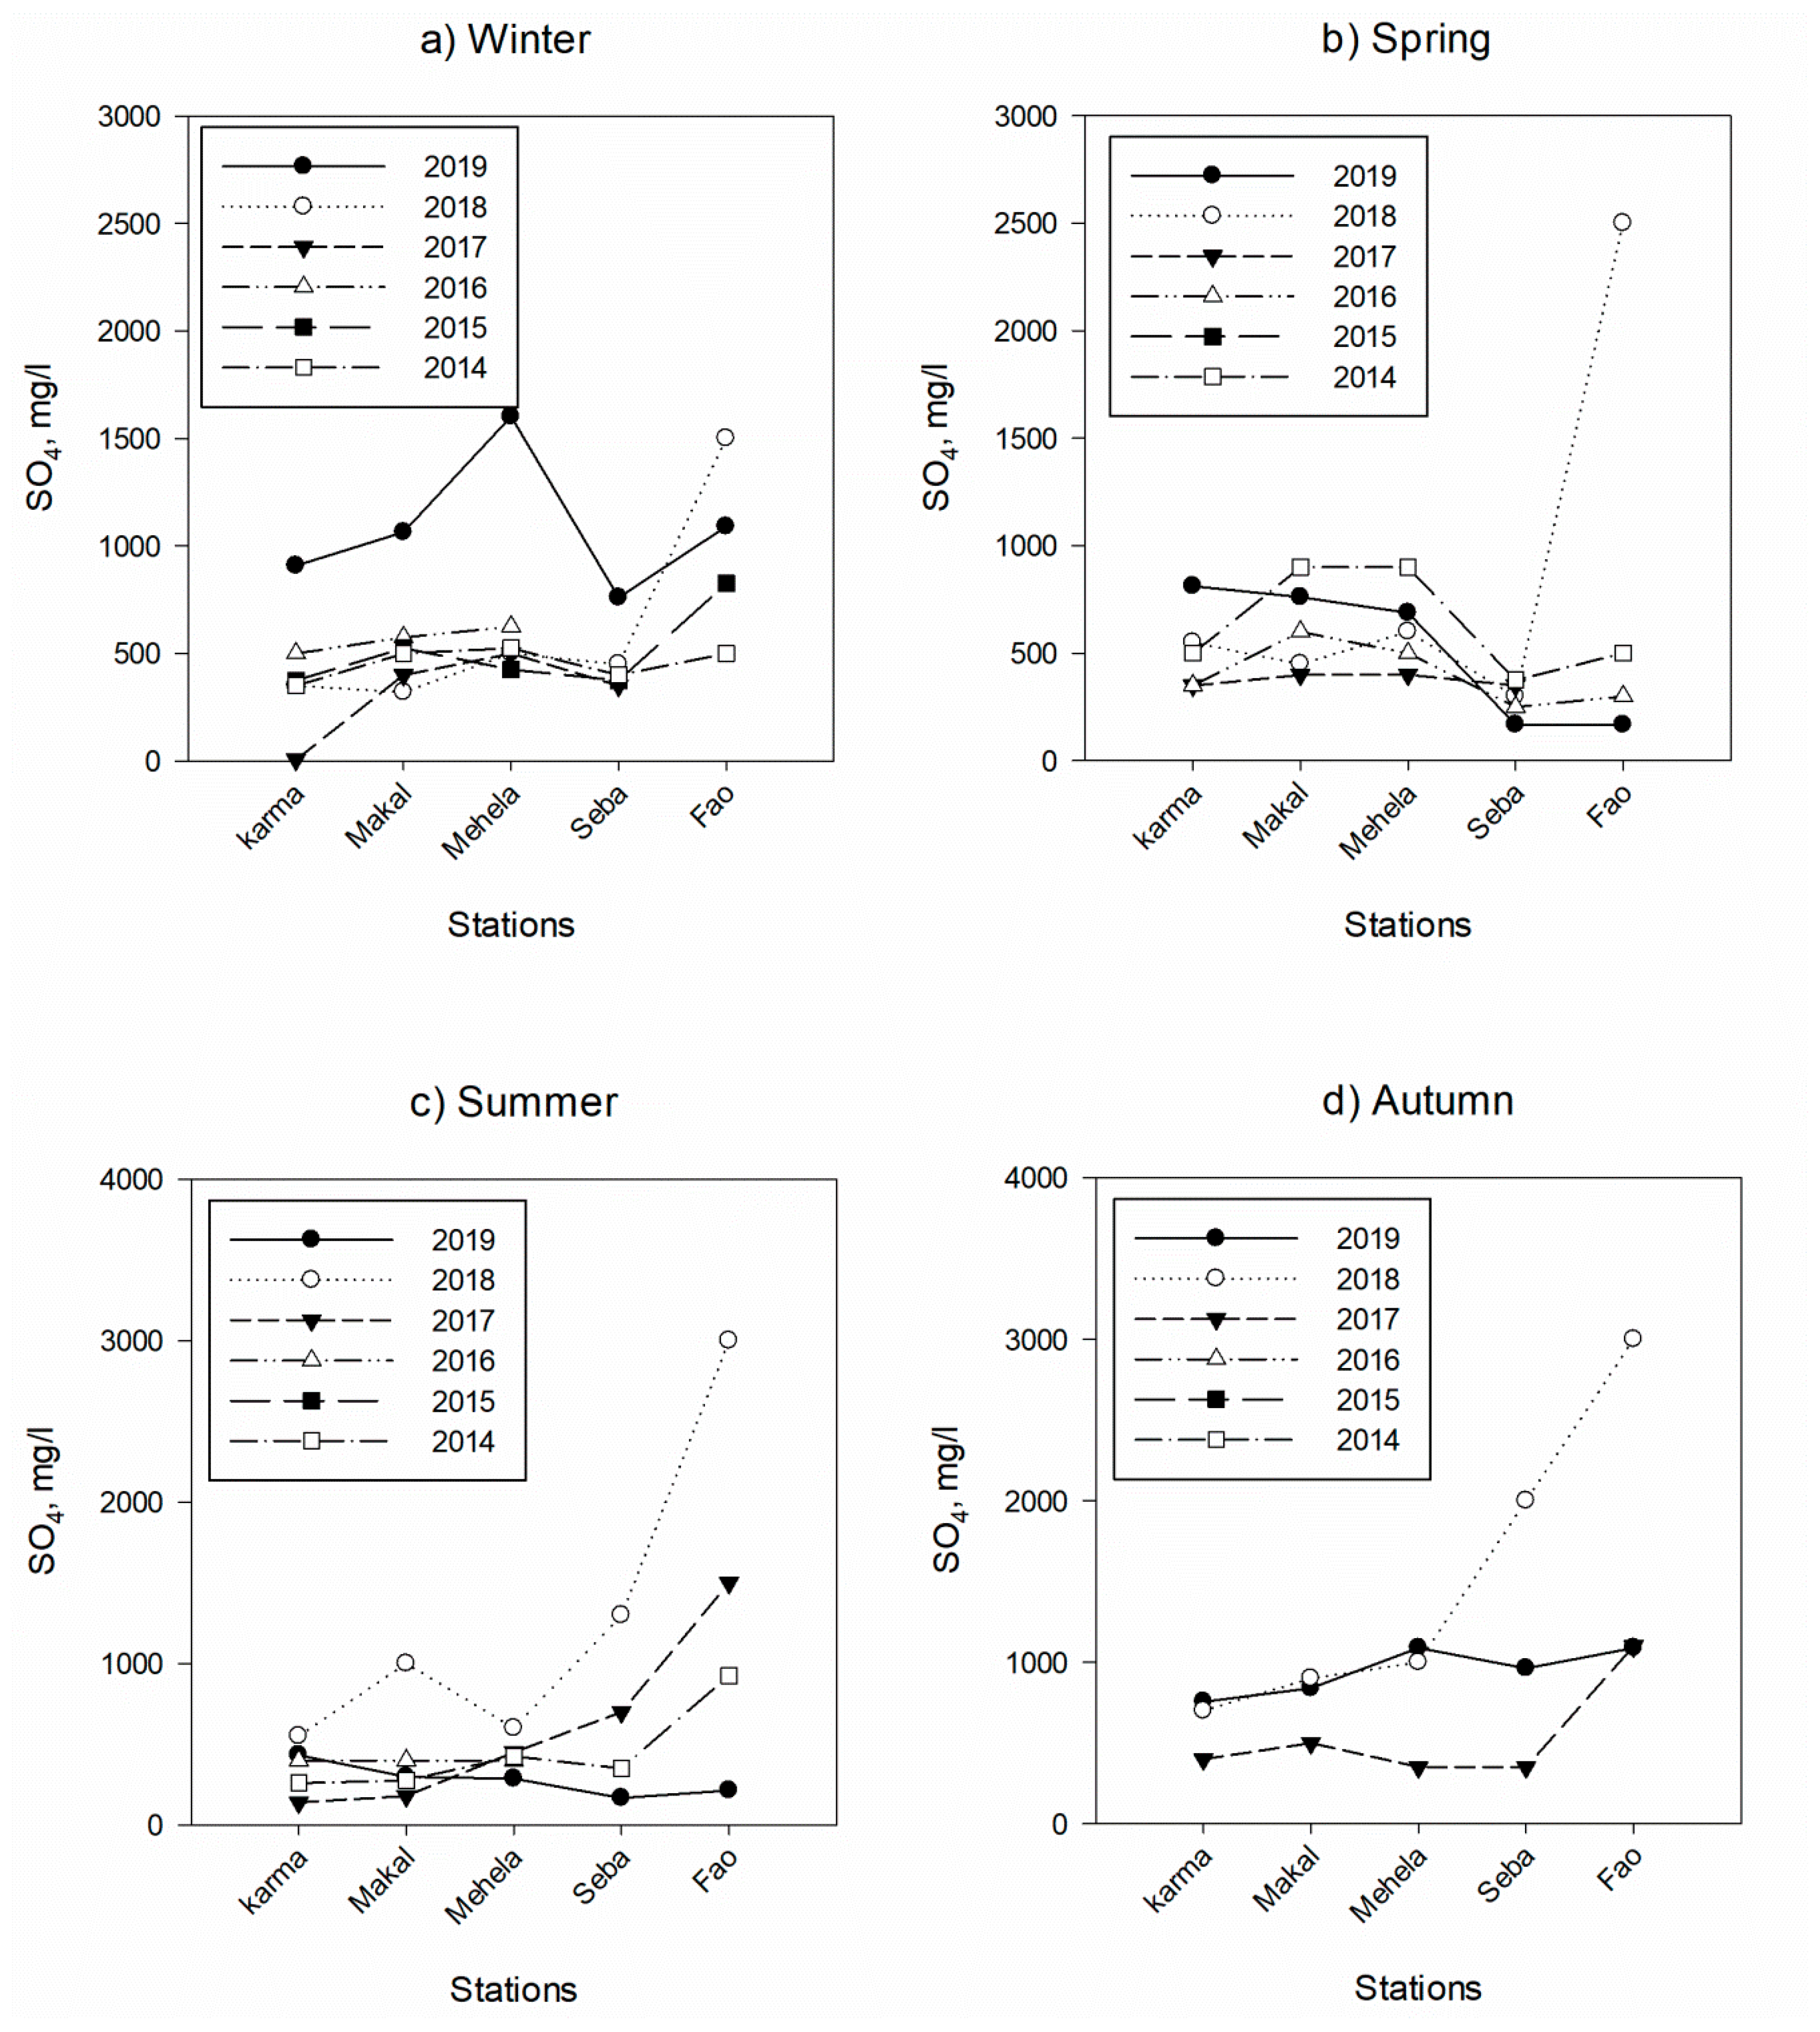
According to Figure 9 for four seasons of 2014–2019, the results showed that all the readings of the SO4 concentrations exceeded the Iraqi Standards, excluding one reading in the stations for during winter 2017 (6.1 mg/L in Al-Karma station), two readings in spring 2019 (168 mg/L in Al-Seba station and 167 mg/L in Al-Fao station), three readings in summer 2017 and 2019 (140, 180, and 168 mg/L in Al-Karma, Al-Makal and Al-Seba stations, respectively). The highest recorded values were in autumn and summer of 2018 at Al-Fao station which was recorded at 3000 mg/L. While the lowest recorded values were recorded in the winter of 2017 at Al-Karma station which was recorded at 6.1 mg/L. A gradual increase in the values of SO4 concentrations was observed from winter 2014 to attain its lowest value in winter 2017. Then, the values of the SO4 concentrations rise again to attain its highest value in the Seba and Al-Fao stations during winter 2018 and in the Karma, Makal, and Mehela stations during winter 2019. The SO4 as major anion recorded a content more than the limit of permissibility, as proposed by standards of WHO and Iraqi Standards for all periods and stations.
Generally, the spatial distribution of sulfate concentrations during winter 2018 showed an increase in the concentration values along the Shatt Al-Arab waterway and this increase gradually continued to the south as shown in Figure A2a (see Appendix A). In the spring of 2019, the sulfate spatial distributions showed an increase in the values of sulfate concentrations upstream and downstream the river to the areas of Seba and Al-Fao to yalpsid lower seulav than the allowed limits as shown in Figure A2b. A uniform spatial distribution of sulfate concentrations during summer 2019 was observed in all monitoring stations on the SAA River, excluding for that in Al-Hartha and Al-Karma stations which were high as shown in Figure A2c. However, the spatial distribution during autumn 2019 showed a sharp increase in the sulfate concentrations towards the south. The very high sulfate concentration explains the dark color in the map in the mid and south of the SAA waterway as shown in Figure A2d.
3.4. Total Hardness
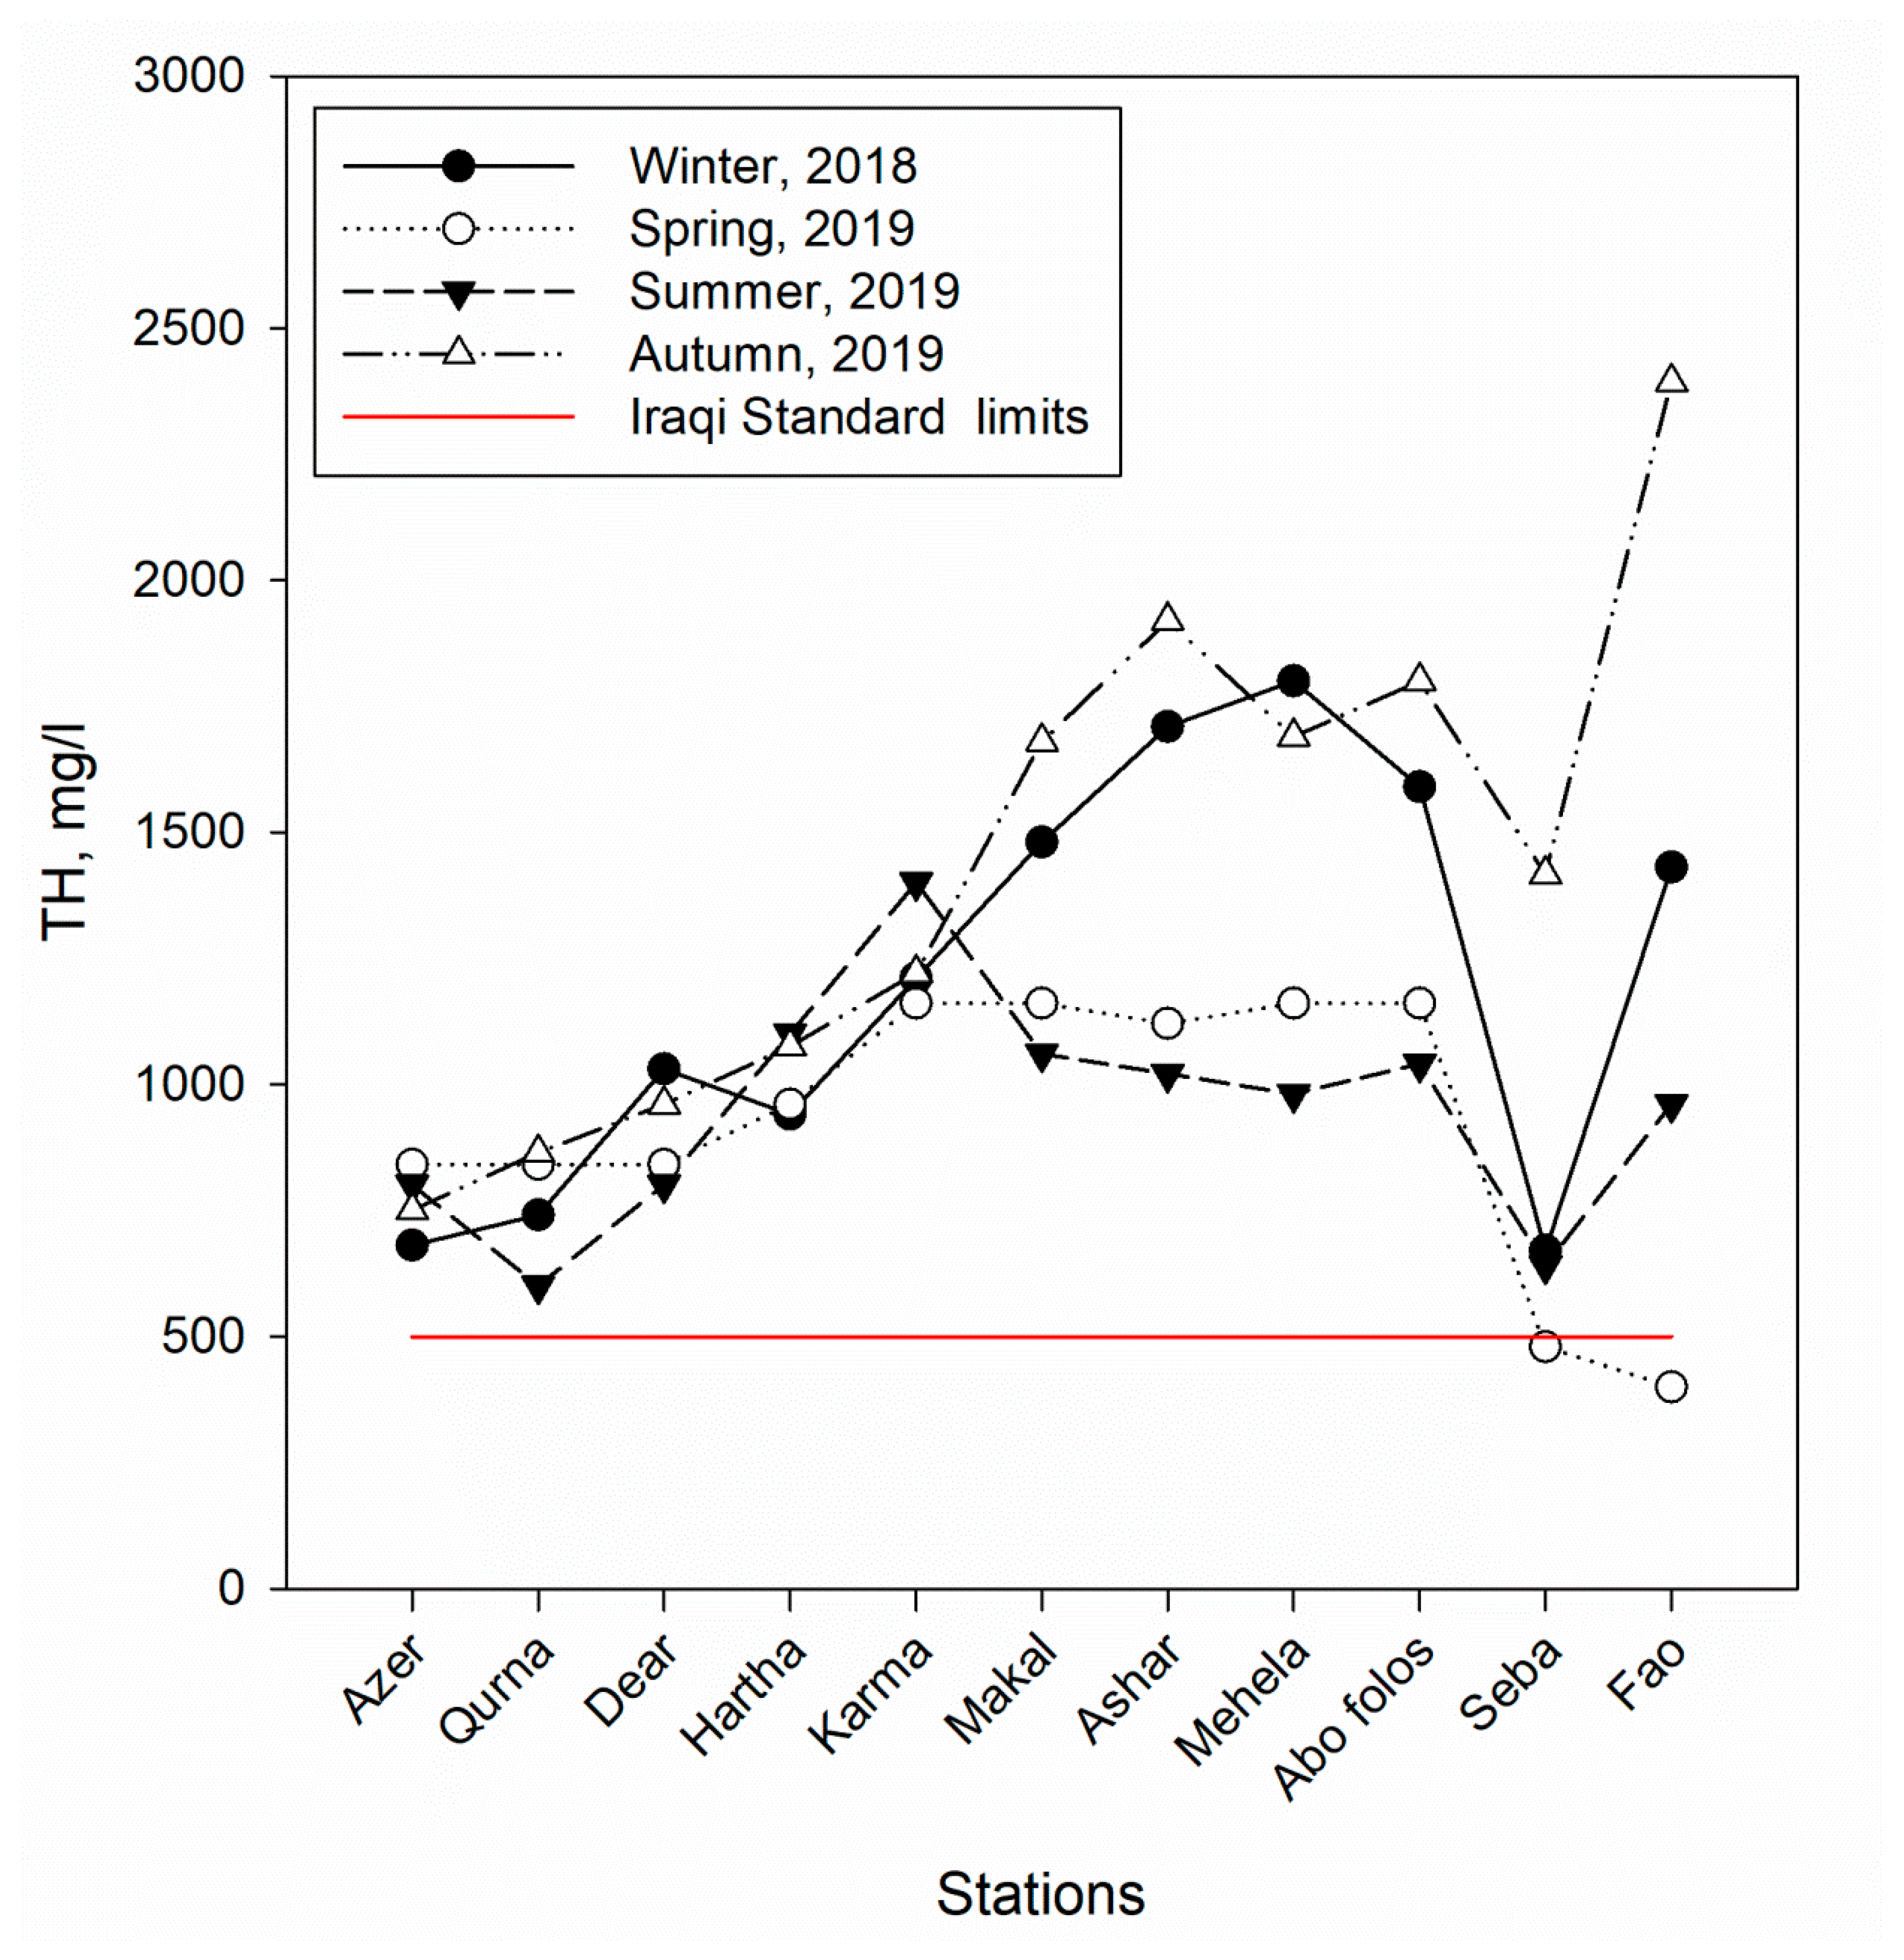
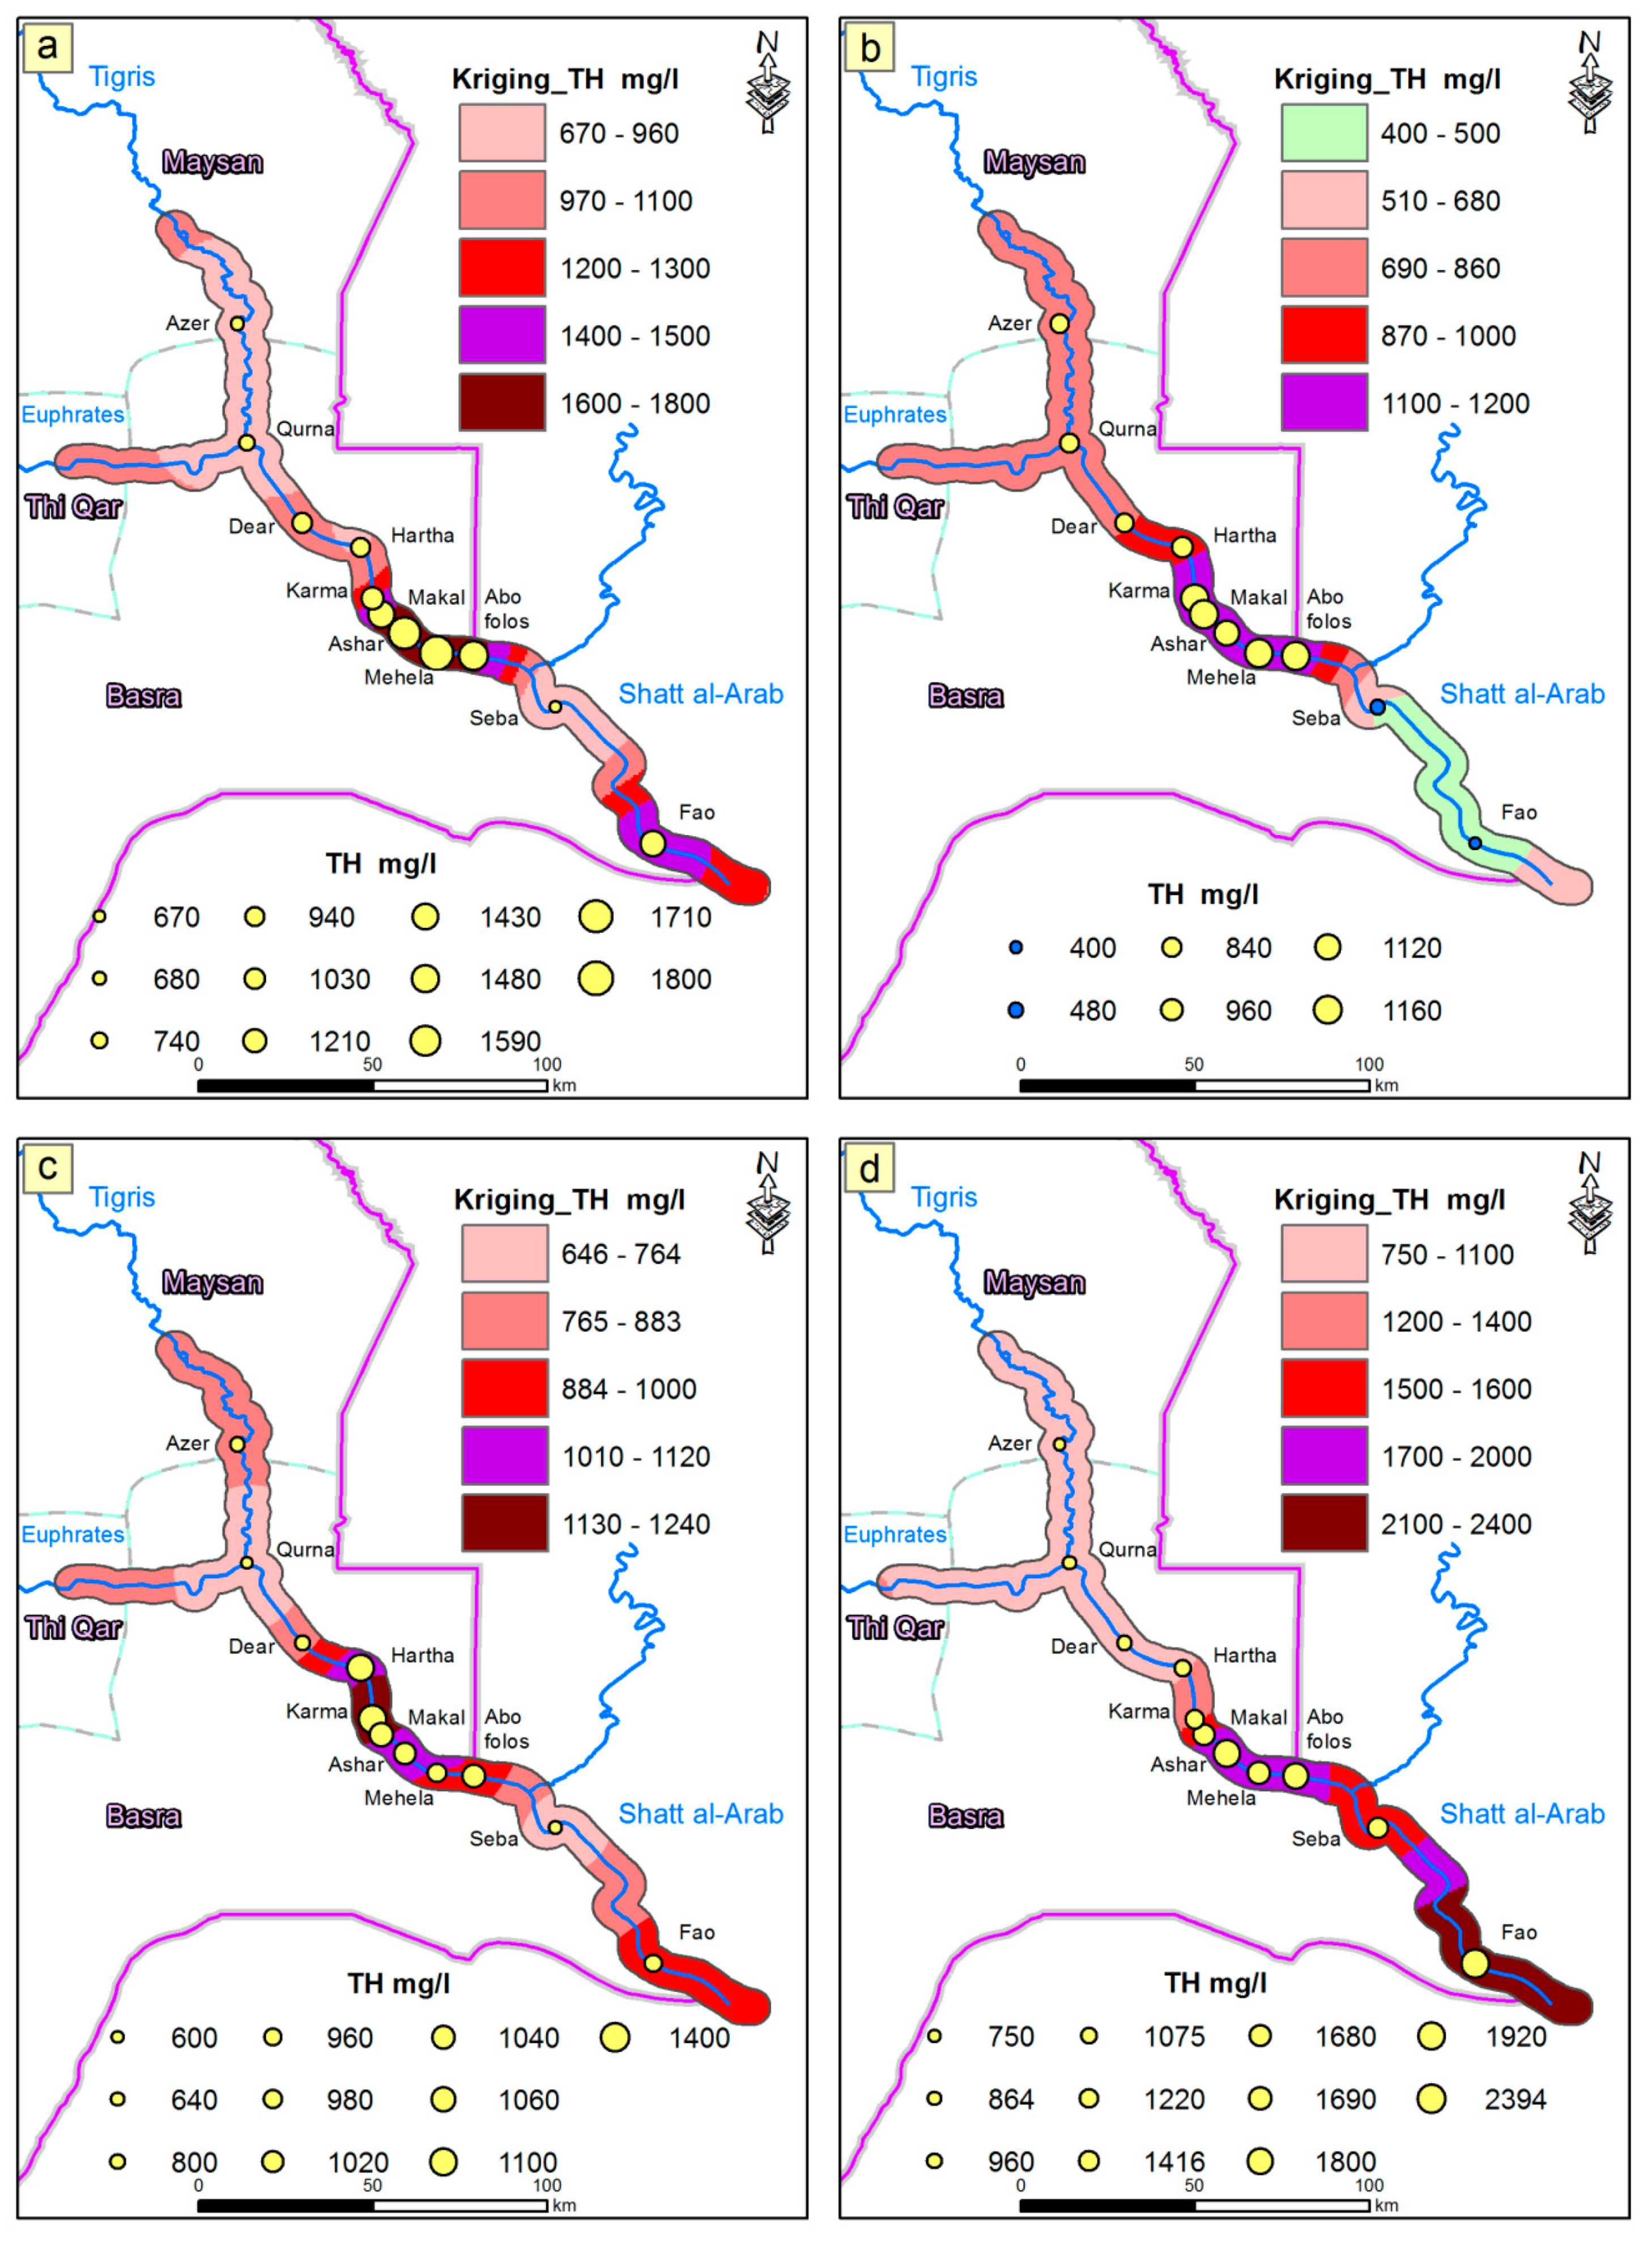
The results showed that all the readings of the total hardness exceeded the Iraqi Standards (500 mg/L as calcium carbonate, CaCO3), excluding for two readings during March 2019 (480 mg/L as CaCO3 in Seba station and 400 mg/L as CaCO3 in Fao station). The highest value was 2393.8 mg/L as CaCO3 was recorded in the Fao region south of Basra during October 2019. The lowest value was 400 mg/L as CaCO3 in Fao during March 2019, as shown in Figure 10. In general, the hardness is classified into four levels which are; (0–60 mg/L) categorized soft; (61–120 mg/L) categorized hard moderately; (21–180 mg/L) classified as hard, and greater than (180 mg/L) categorized as very hard. In contrast, water-soluble Ca and Mg are minerals of the insolubility of water that commonly render the water to be “very hard”. Therefore, most of the water in SAA is very hard [66,67]. During winter 2018, the total hardness concentration in Mehela station was 1800 mg/L, which was way higher than the other station’s values. In spite of this, higher values of the total hardness concentrations were observed during winter 2018 in most selected stations. On the other hand, the total hardness concentrations during the spring, summer, and autumn of 2019 recorded higher readings than WHO standards (500 mg/L as CaCO3) in all the selected stations.
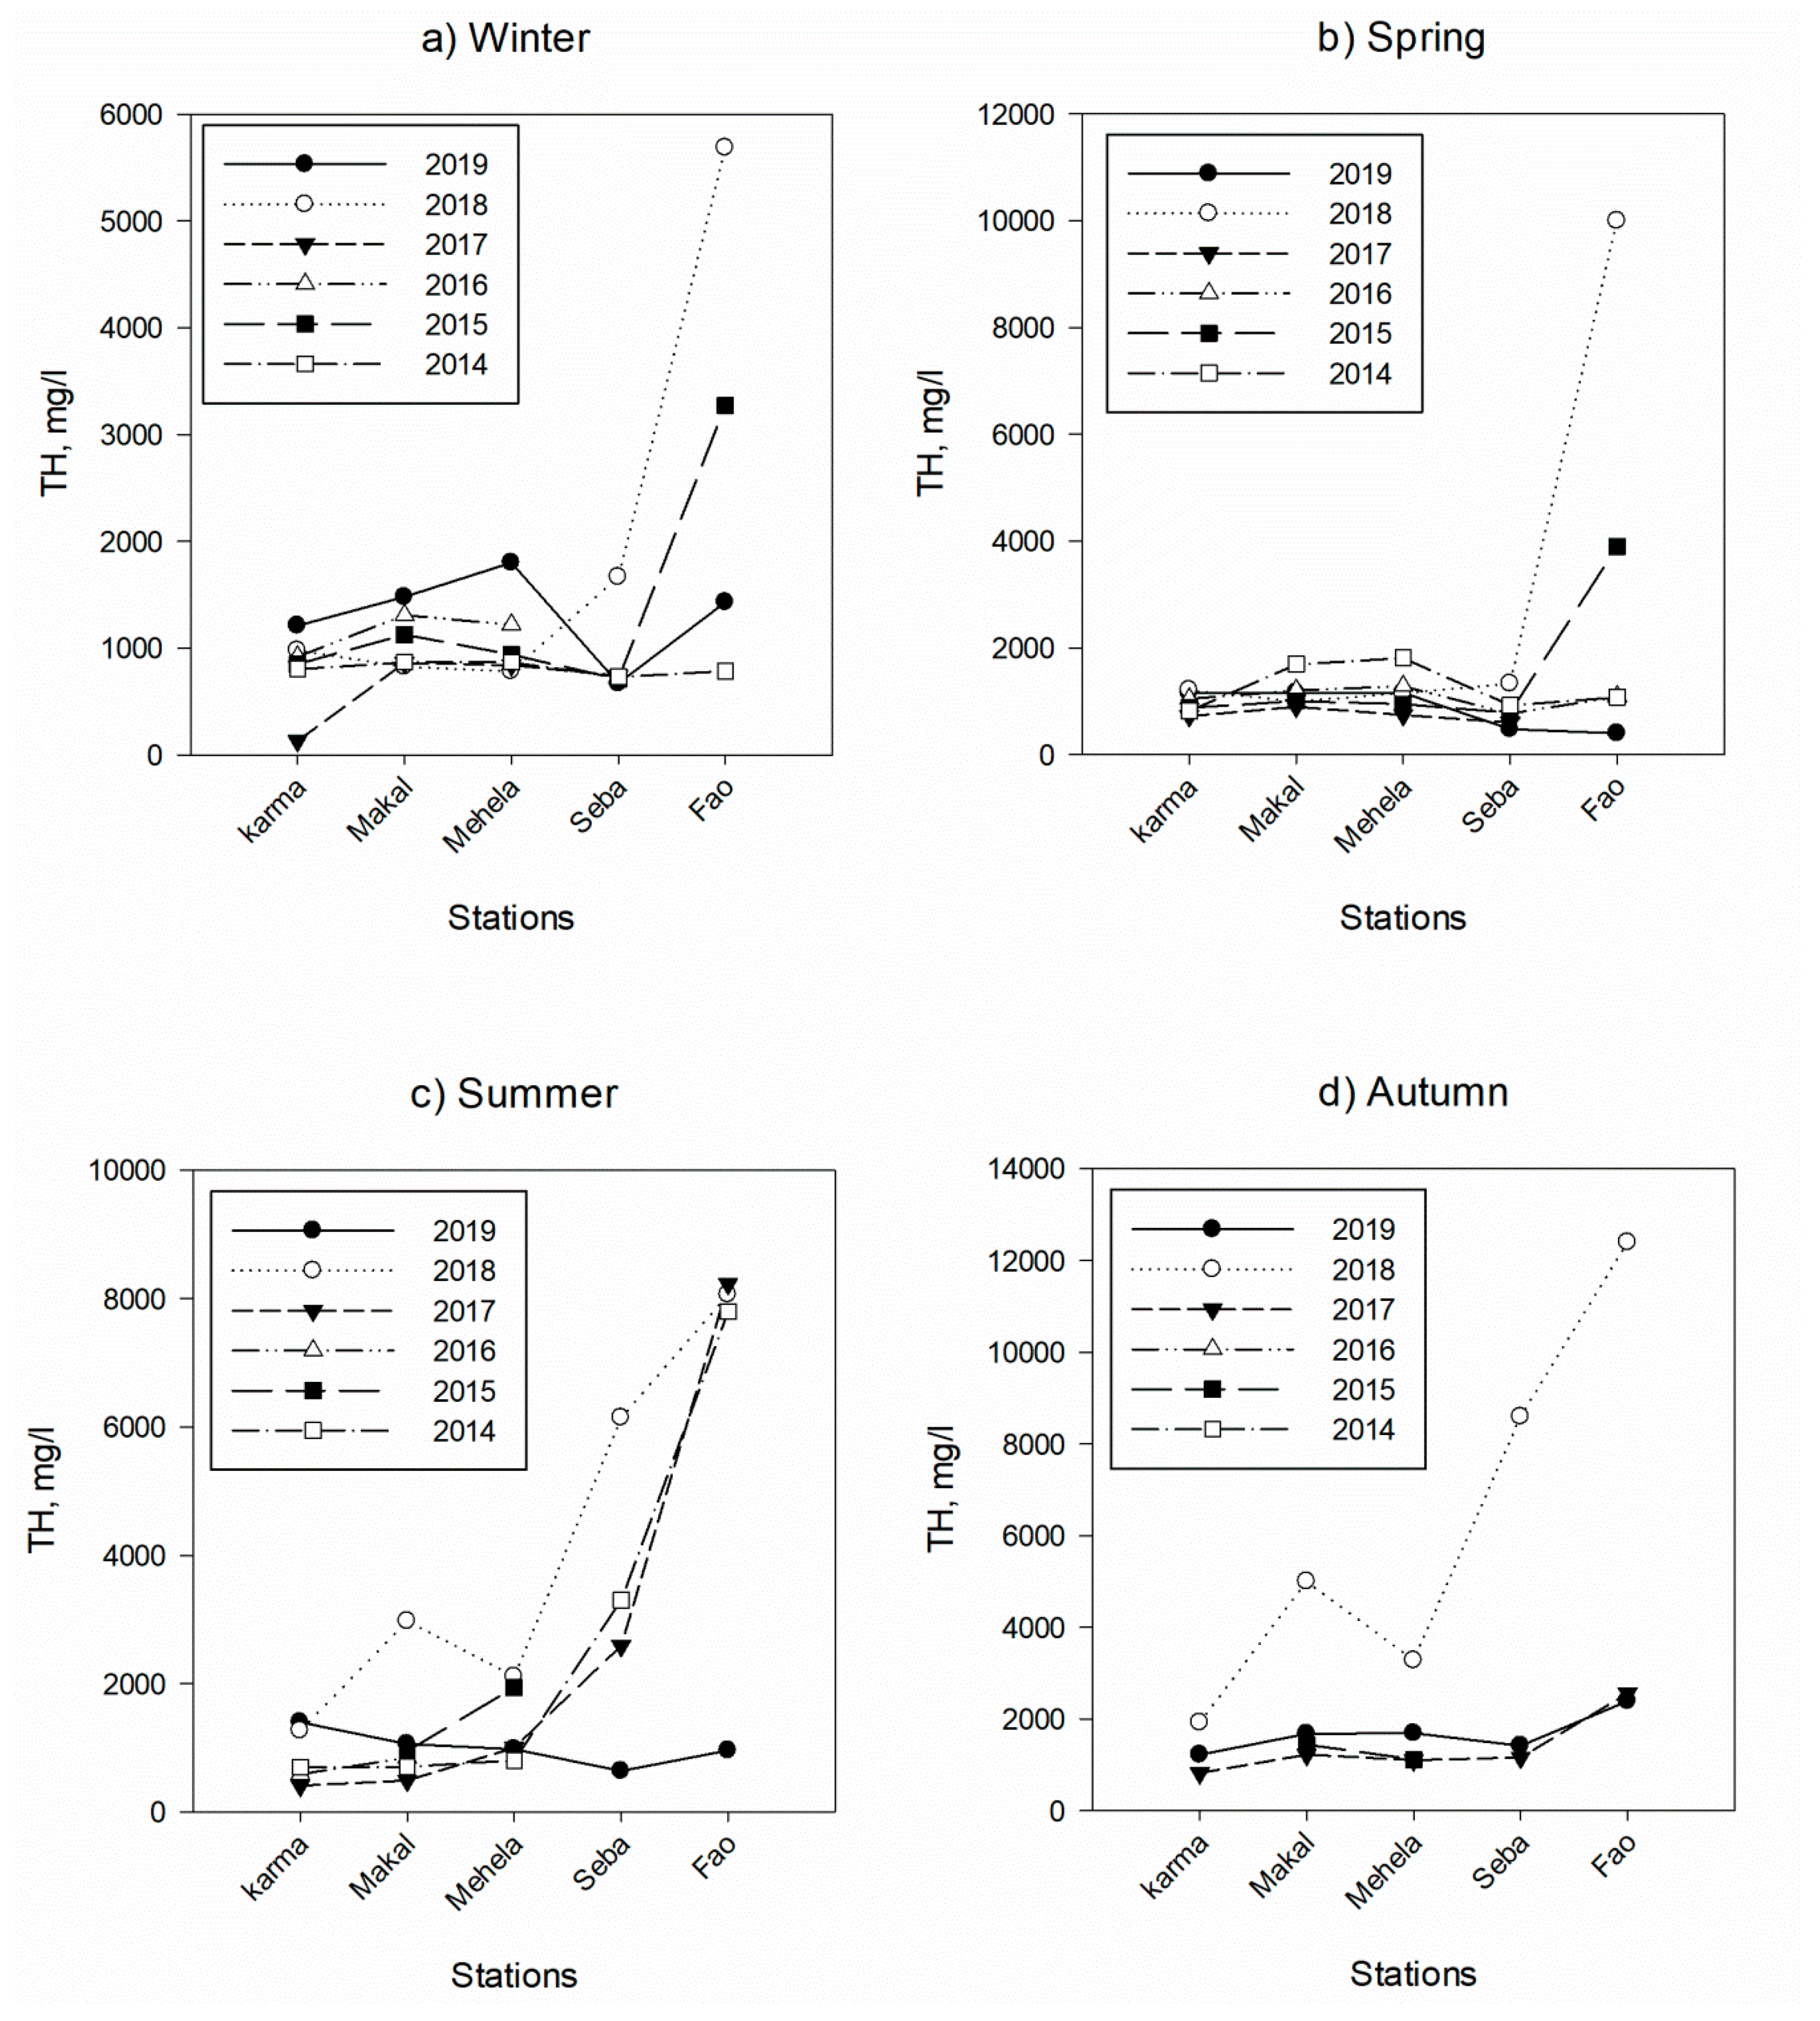
Figure 11 illustrates the seasonality values changes of TH concentrations from 2014 to 2019. The results showed that all the readings of the TH concentrations exceeded the Iraqi Standards, excluding one reading during winter 2017 (133 mg/L as CaCO3 in Al-Karma station), two readings during spring 2019 (480 mg/L as CaCO3 in Al-Seba station, and 400 mg/L as CaCO3 in Al-Fao station), and two readings during summer of 2017 (408 mg/L as CaCO3 in Al-Karma station and 489 mg/L as CaCO3 in Al-Makal station). The highest autumn values were registered in 2018 in the station of Al-Fao. On the other hand, the lowest values were registered in spring 2017 at Al-Karma station. This parameter showed a gradual increase in the values of TH concentrations from winter 2014 to attain its lowest value in winter 2017.
Additionally, the values of total hardness concentrations follow the same path taken by TDS variable concentrations in terms of oscillations and differences between high and low concentrations during other seasons. It saw noticed through the spatial distribution of the values of the concentrations of TH during the comparative study period for the winter season, that they were rising gradually during the years from 2014 to 2016, while fluctuations in the values appear between high and low in the years 2017 to 2019, to record the lowest reading which was 133 mg/L as CaCO3 at the Karma station during winter 2017. While the highest reading was 12,400 mg/L as CaCO3 at Fao station in Autumn 2018. In general, relatively low total hardness concentrations from 2017 to 2019 indicated high water levels due to increased water releases from the Karun River and both Euphrates and Tigris rivers.
The results in Figure A3 (see Appendix A) showed that the spatial distribution of the total hardness concentrations for winter 2018 ranged between 670–1800 mg/L as CaCO3. The gradual rise of TH concentrations in the stations above the SAA waterway was decreased compared to that of Al-Hartha station. After that, total hardness concentrations started to gradually rise towards the south, and the highest value displayed at Mehela station. The decrease in total hardness concentrations showed the lowest value at the Seba station. The spatial distribution of total hardness concentrations for spring 2019 showed a gradual increase toward the south downstream of the Abu Folos Port area. Maximum total hardness concentrations of 1160 mg/L as CaCO3 were observed at Karma, Makal, Mehela, and Abu Folos. However, the concentrations in the far south decreased. The lowest value was at the Fao station before meeting the Arabian Gulf which was 400 mg/L as CaCO3.
The spatial distribution of TH concentrations in the autumn and spring seasons of 2019 was almost the same at the northern and central of SAA River to the Ashar region (Figure A3). The spatial distribution of TH concentrations during summer 2019 showed an increase and decreased across the course of SAA River from north to south. The TH distribution was varying from the lowest concentration of 600 mg/L as CaCO3 at Qurna station to the highest concentration of 1400 mg/L as CaCO3 at Karma Ali station. The increase in total hardness values was probably due to the high water temperatures and high electrical conductivity. The impact of the high temperatures and electrical conductivity on the decomposition and weathering of basal rocks increased the total hardness values in the four seasons, which resulted in the very high hard water of Shatt Al-Arab [67,68].
3.5. Other Water Quality Parameters
Turbidity, Sodium (Na), Phosphate (PO4), and total organic Carbon (TOC) were also measured in this study during the study period of 2018 to 2019. Due to a lack of data availability, these parameters were not compared to previous data. Turbidity readings recorded a significant increase in their values for water samples. All readings exceeded the specified limit of 5 NTU. The results of the turbidity showed a variation between high and very high values. For example, the turbidity of the samples in Makal and Fao locations during March 2019 was 617 and 689 NTU, respectively. The high increase in the turbidity values was followed by a sudden decrease during December 2018 in Al-Ashar and Mehela regions 0.61 and 2.95 NTU, respectively which are below the limit as shown in Figure 12a. In addition, the outcomes attained for the concentrations of turbidity surpassed the background levels specified by US-EPA [69] due to the domestic sewage and urban runoff. Thus, the higher seasonal turbidity was due to the accumulation of huge quantities of sewage waste from the nearby area, the aquatic vegetation’s growth, or/and decrease in water flow [70]. The results revealed that all of the turbidity concentrations exceeded the Iraqi and WHO standards (5 NTU), excluding the two readings in Al-Ashar and Mehela stations, which were 0.61 and 2.95 NTU, respectively, during winter 2018. For example, during spring 2019, the turbidity concentration in Al-Fao station was 689 NTU which is higher than both standards.
Sodium concentrations of Shatt Al-Arab water samples range from 239.08 to 2373 mg/L, where the maximum value recorded in Mehela during winter (December 2018), while the lowest value recorded in the Fao region during the spring (March 2019) as shown in Figure 12b. Sodium concentrations were higher than the maximum allowable limit in drinking water which is 200 mg/L [71]. All of the sodium concentrations exceeded the Iraqi standards (200 mg/L) during this study. In spite of this, higher values of the sodium concentrations were observed during winter 2018 in most selected stations. On the other hand, sodium concentrations during the spring, summer, and autumn of 2019 recorded higher readings than the Iraqi and WHO standards (200 mg/L) in all the selected stations.
The results showed that the phosphate variable over the study period exceeded the Iraqi standards of 0.2 mg/L (Figure 12c). During December 2018, the results mostly exceeded the determinants in the study area, excluding the areas of Abo Folos, Al-Seba, and Al-Fao stations, which reached 0.19, 0.059, and 0.13 mg/L, respectively. During March and July of 2019, all the readings of the phosphate did not exceed the standard limits, except one reading which is located in Al-Azer station which was 0.21 mg/L during July of 2019. Also, all readings during October of 2019 exceeded Iraqi Standard Limits. The highest value of the phosphate variant was 1.95 mg/L in the Abo Folos Port area during October 2019, and the lowest value was 0.007 mg/L in the Al-Seba area during July 2019 (Figure 12c). In addition, the results also revealed that most of the phosphate concentrations exceeded the European Union standard. For example, during winter 2018, the phosphate concentration in Karma station was 1.9 mg/L which is way higher than the European Union standard (0.7 mg/L). However, some of the stations showed a concentration of the phosphate within the Iraqi limits. Nevertheless, phosphate concentrations during the spring and summer of 2019 recorded lower readings than the Iraqi and European standards in all the selected stations. On the other hand, all phosphate concentrations at all selected stations were much higher than the Iraqi and European determinants during the fall of 2019.
The TOC concentrations of Shatt Al-Arab during this study ranged from 33 mg/L in Al-Dear station during Autumn 2019 to 141 mg/L in the Abo Folos station during Winter 2018. The results showed that all values of TOC concentrations exceeded the Iraqi Standards (less than 2 mg/L), as shown in Figure 12d. The comparative TOC concentrations’ values found in the research area might be because of the terrigenous materials’ dilution most significantly sand and dust storms. These are deliberated as the main sediment source for the Shatt Al-Arab’s southern part [72]. Thus, the outcomes concluded that SAA plays an essential function to provide nutrients to the northeast of the Arabian Gulf.
3.6. Heavy Metals
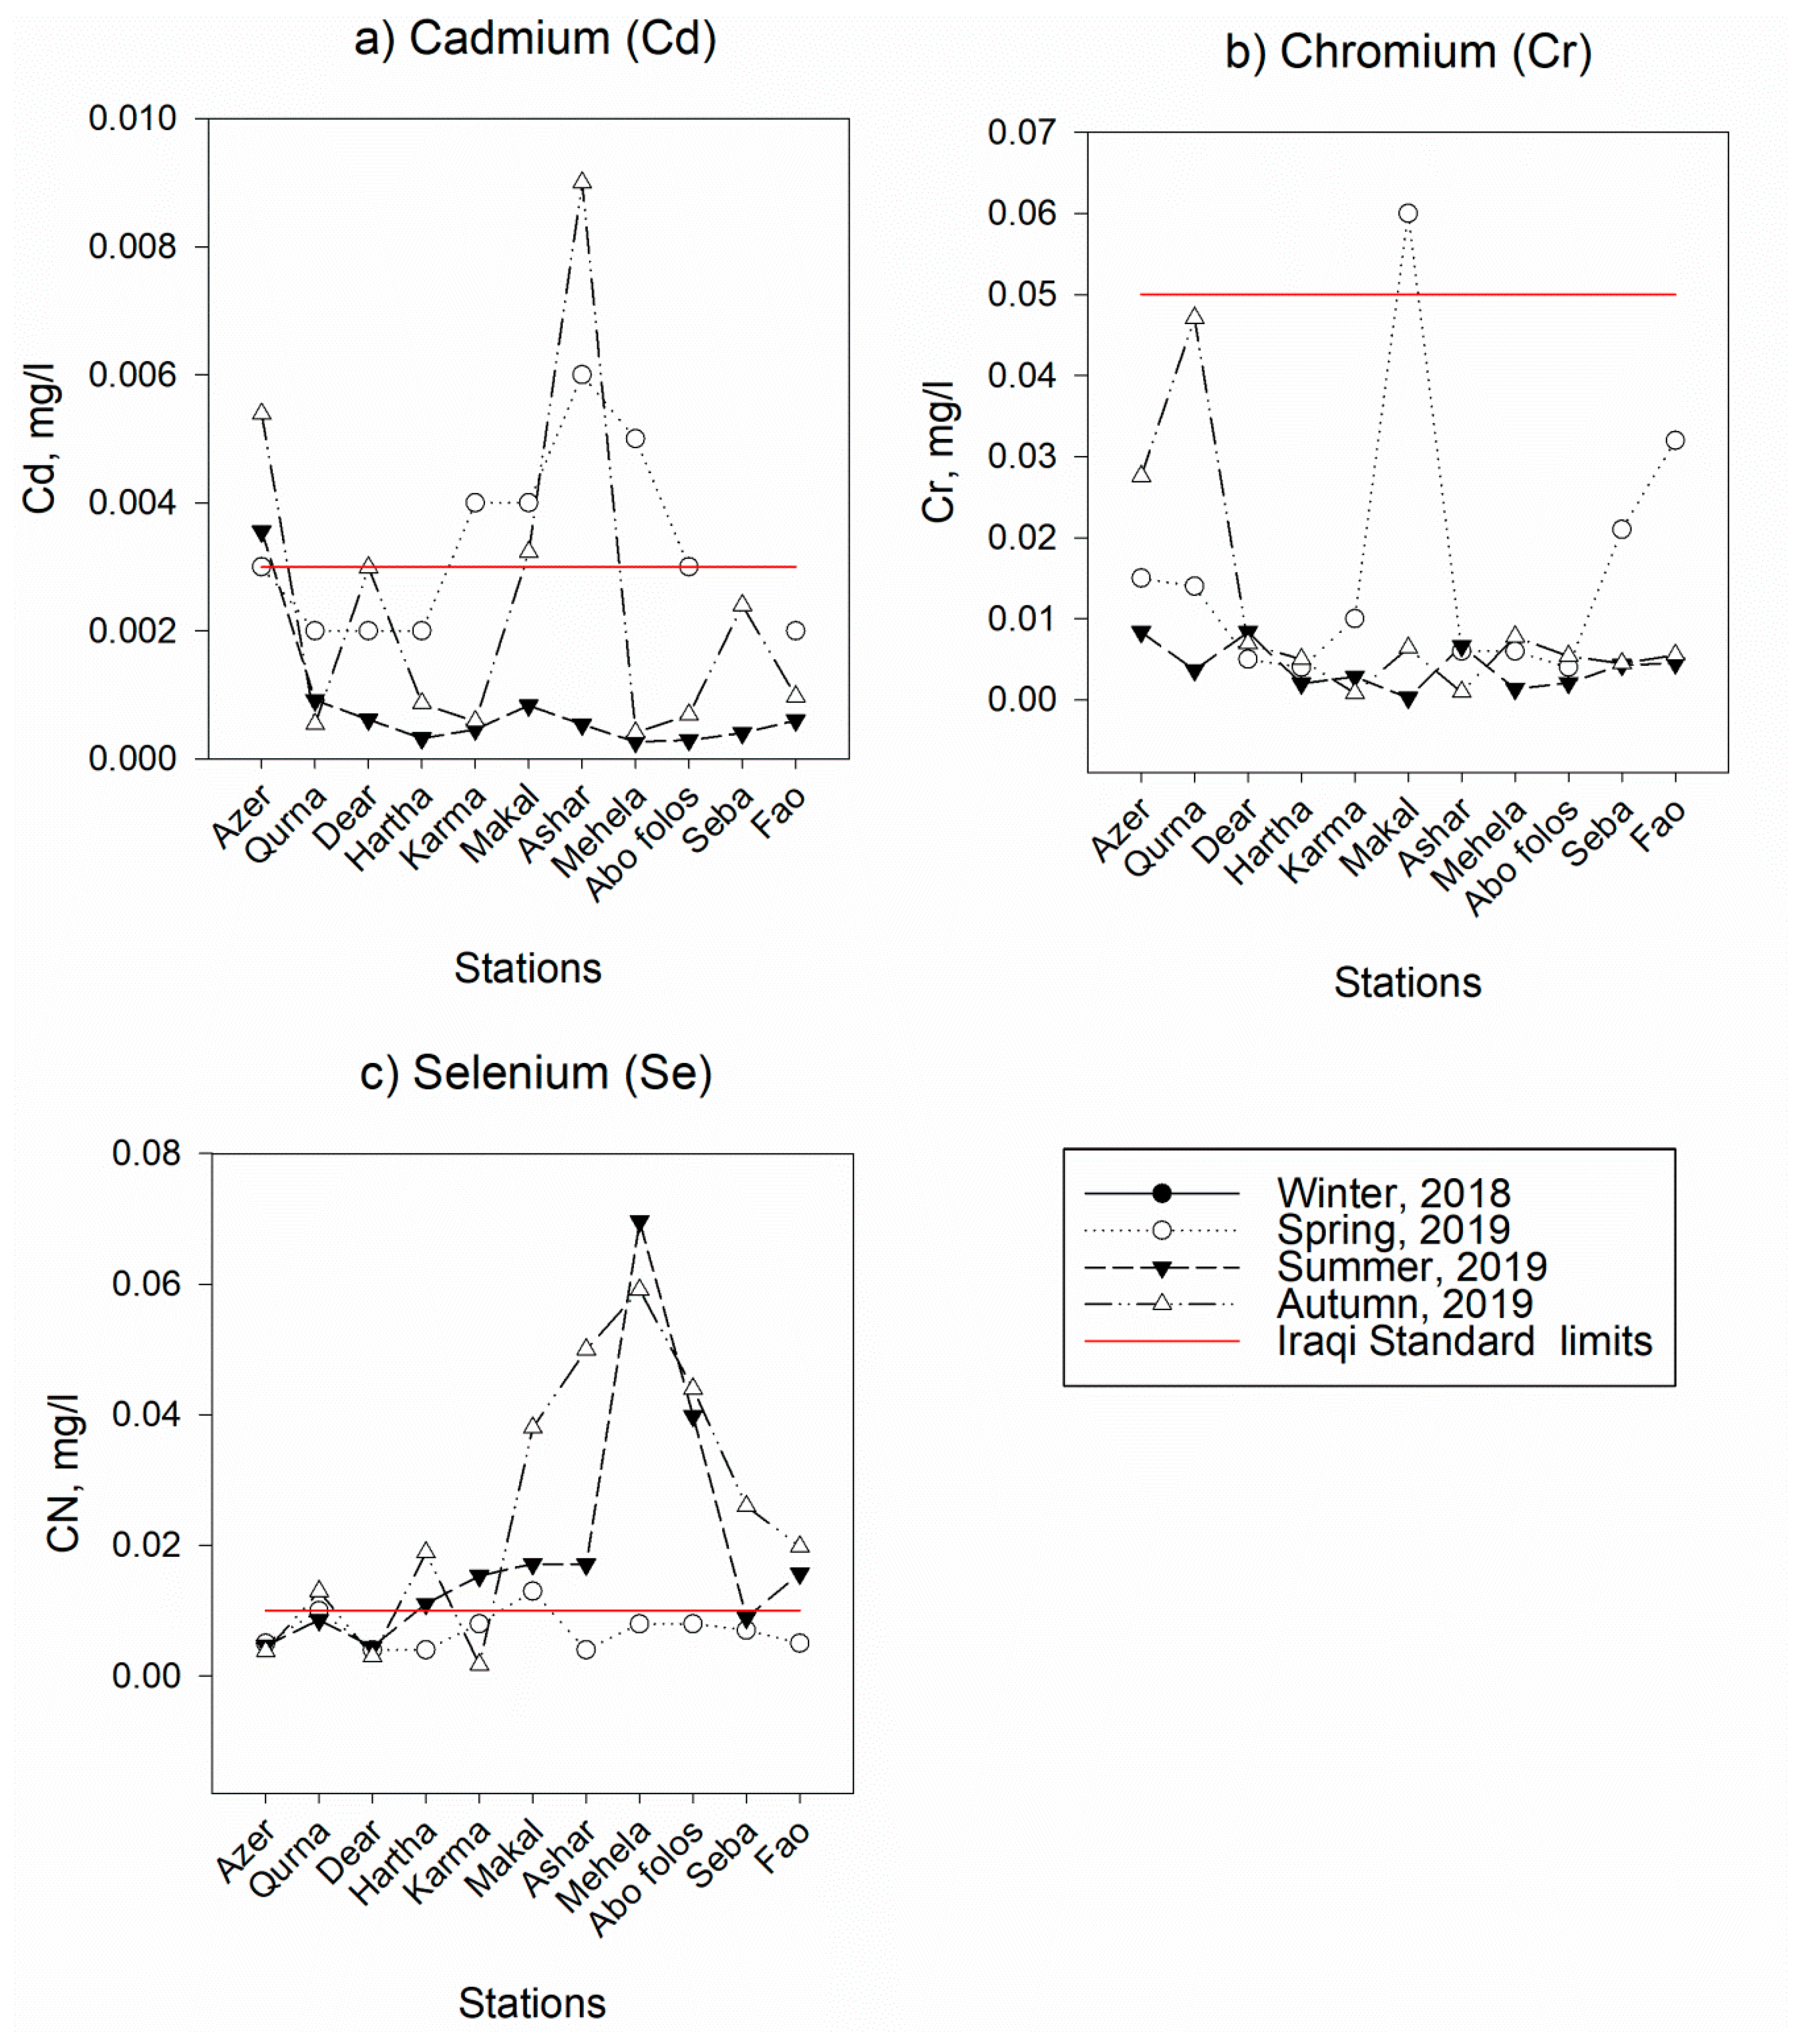
In this study, the heavy metals of cadmium (Cd2+), chromium (Cr3+), and selenium (Se) were also investigated during the study period of 2018 to 2019. Due to a lack of data availability, these parameters were not compared to previous data. The results of cadmium concentrations in SAA ranged between 0.009 to 0.00027 mg/L. The lowest reading was at Mehela station during summer 2019, while the highest reading was in Al-Ashar station during Autumn 2019 (Figure 13a). Cadmium concentration increased during summer 2019 at Al-Azer station. In autumn 2019, an increase was also recorded in Al-Azer, Al-Makal, and Al-Ashar stations. It was noted that no results of cadmium concentration were obtained for all selected samples of winter 2018. The cadmium concentrations which were recorded by the devices were under detection level (U.D.L) as shown in Figure 13a. Eight values of the total cadmium concentrations were 0.003 mg/L that exceeded the Iraqi and WHO standards during this study. For instance, during spring 2019, the cadmium concentrations in Al-karma, Al-Makal, Al-Ashar, and Al-Mehela stations were 0.004, 0.004, 0.006, and 0.005 mg/L respectively, which were higher than that of the other stations’ values. Moreover, higher values of the cadmium concentrations were observed during autumn 2019 in some selected stations and only one station during summer 2019. On the other hand, cadmium concentrations during the spring and autumn of 2019 recorded higher readings than the European Union (0.005 mg/L) standards which were 0.009 and 0.00539 mg/L in Al-Ashar station and Al-Azer station, respectively.
Chromium concentrations of Shatt Al-Arab water samples ranged from 0.000253 to 0.06 mg/L where the maximum value was recorded in Al-Makal station during spring 2019. While the lowest value recorded in the same station during summer 2019 (Figure 13b). According to the Iraqi standards, the maximum allowable limit for the chromium concentrations is 0.05 mg/L. However, the results of the current study of chromium concentrations showed that they did not exceed the Iraqi standards in all the selected stations, excluding at Al-Makal station during spring 2019, which was 0.06 mg/L. The chromium exceeded the WHO (0.03 mg/L) and the European Union (0.05 mg/L) standards at Qurna and Fao stations.
The results showed that the lowest value of the selenium concentration was 0.0017 mg/L in Al-Karma station during October 2019 (Figure 13c). Selenium concentrations during winter 2018 were not detected by the test devices because the concentrations were below the level of the device sensor. Most of the results of the selenium concentrations exceeded the Iraqi standards. For instance, the exceeded values of the selenium concentrations were in the Al-Makal station during spring 2019 as well as in the stations of Al-Hartha, Al-Karma, Al-Makal, Al-Ashar, Abo Folos, and Al-Fao during summer 2019. The exceeded values of the selenium concentrations were observed during autumn 2019 in eight stations. On the other hand, the selenium concentration readings exceeded the limit of the WHO standards (0.03 mg/L), in Al-Mehela and Abo Folos stations, during summer 2019. Also, selenium concentrations exceeded the WHO standards in Al-Makal, Al Ashar, Al-Mehela, and Abo Folos stations during autumn 2019. Selenium concentration readings also exceeded the limit of the European Union standards (0.05 mg/L) in Al-Mehela station during summer and autumn 2019.
3.7. Geochemical Characterizations
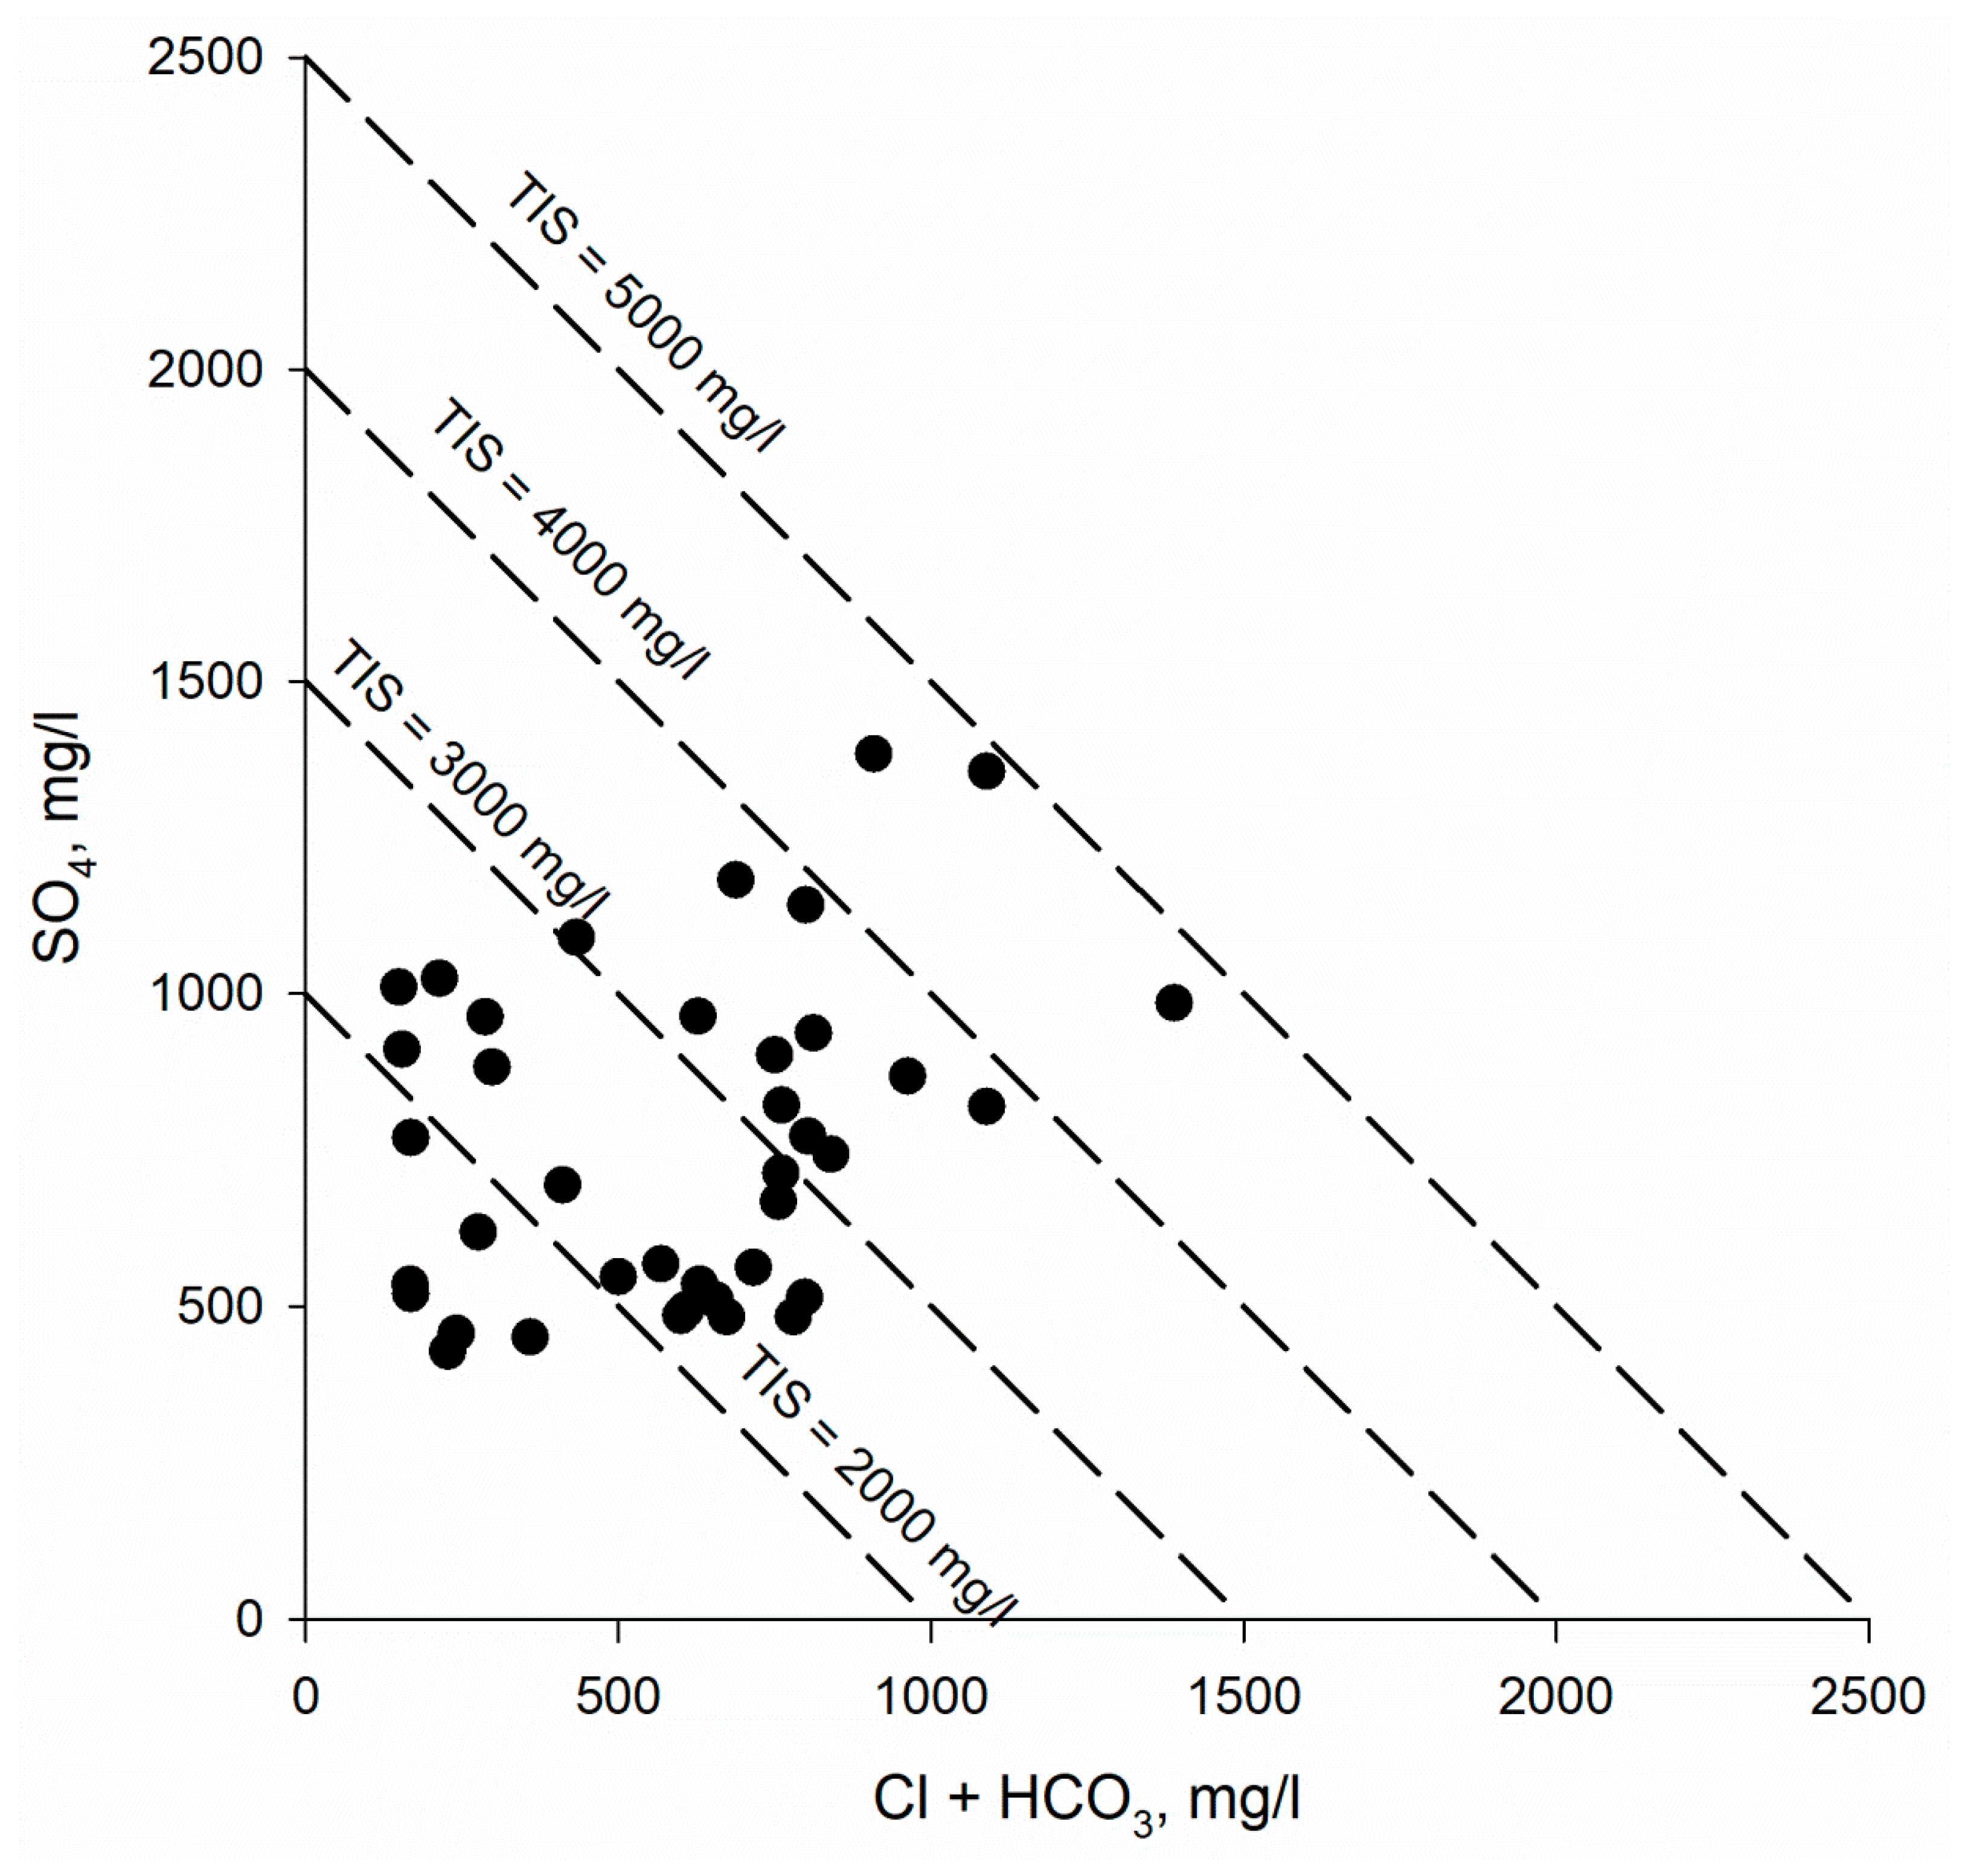
The study of geochemical properties aims to facilitate the understanding and interpretation of all evolutionary trends, especially in the surface water system, when they are interpreted in conjunction with maps of hydrochemical divisions and their distribution. Moreover, water chemistry is studied primarily by (i) the correlation graph of SO4 vs. HCO3 + Cl, in which iso-salinity lines are drawn for reference (Figure 14), and (ii) triangular plots involving major cations and anions as reported by Vespasiano et al. [37]. Also, the SO4 versus HCO3 + Cl correlation scheme can recover the ratios between variants that lose information about the absolute concentration, that is, the mass of chemical components of interest indicates one kilogram of sulfate. As reported, salinity water composition was used to evaluate the presence of mixing processes between surface water and shallow and deep aquifers. Figure 14 highlights that SO4 and HCO3 + Cl are the main constituents of the aqueous solutions.
Figure 14 highlights another useful index for water classification called Ionic Salinity or Total Ionic Salinity (TIS). This index shows the sum of anion and cation total contents (expressed in mg/L). The values of Iso-TIS lines are reported in Figure 14 as the sum of SO4 and Cl + HCO3. The samples of SAA waters fall into four groups: (i) less than 2000 mg/L, (ii) between 2000 and 3000 mg/L, (iii) between 3000 and 4000 mg/L, and (iv) between 4000 to 5000 mg/L. Most data are located between 2000 to 4000 mg/L. Even if these diagrams are not very suitable for the detection of possible mixing processes, it is possible to identify a mixing line between waters from the SAA sampled upstream of the river estuary with those of other water samples characterized by Ca-SO4 composition. The waters of the SAA are characterized by strong mixing and weak stratification, which shows the role of marine waters that penetrate the SAA course in increasing the concentration of salts of river water along the water column.
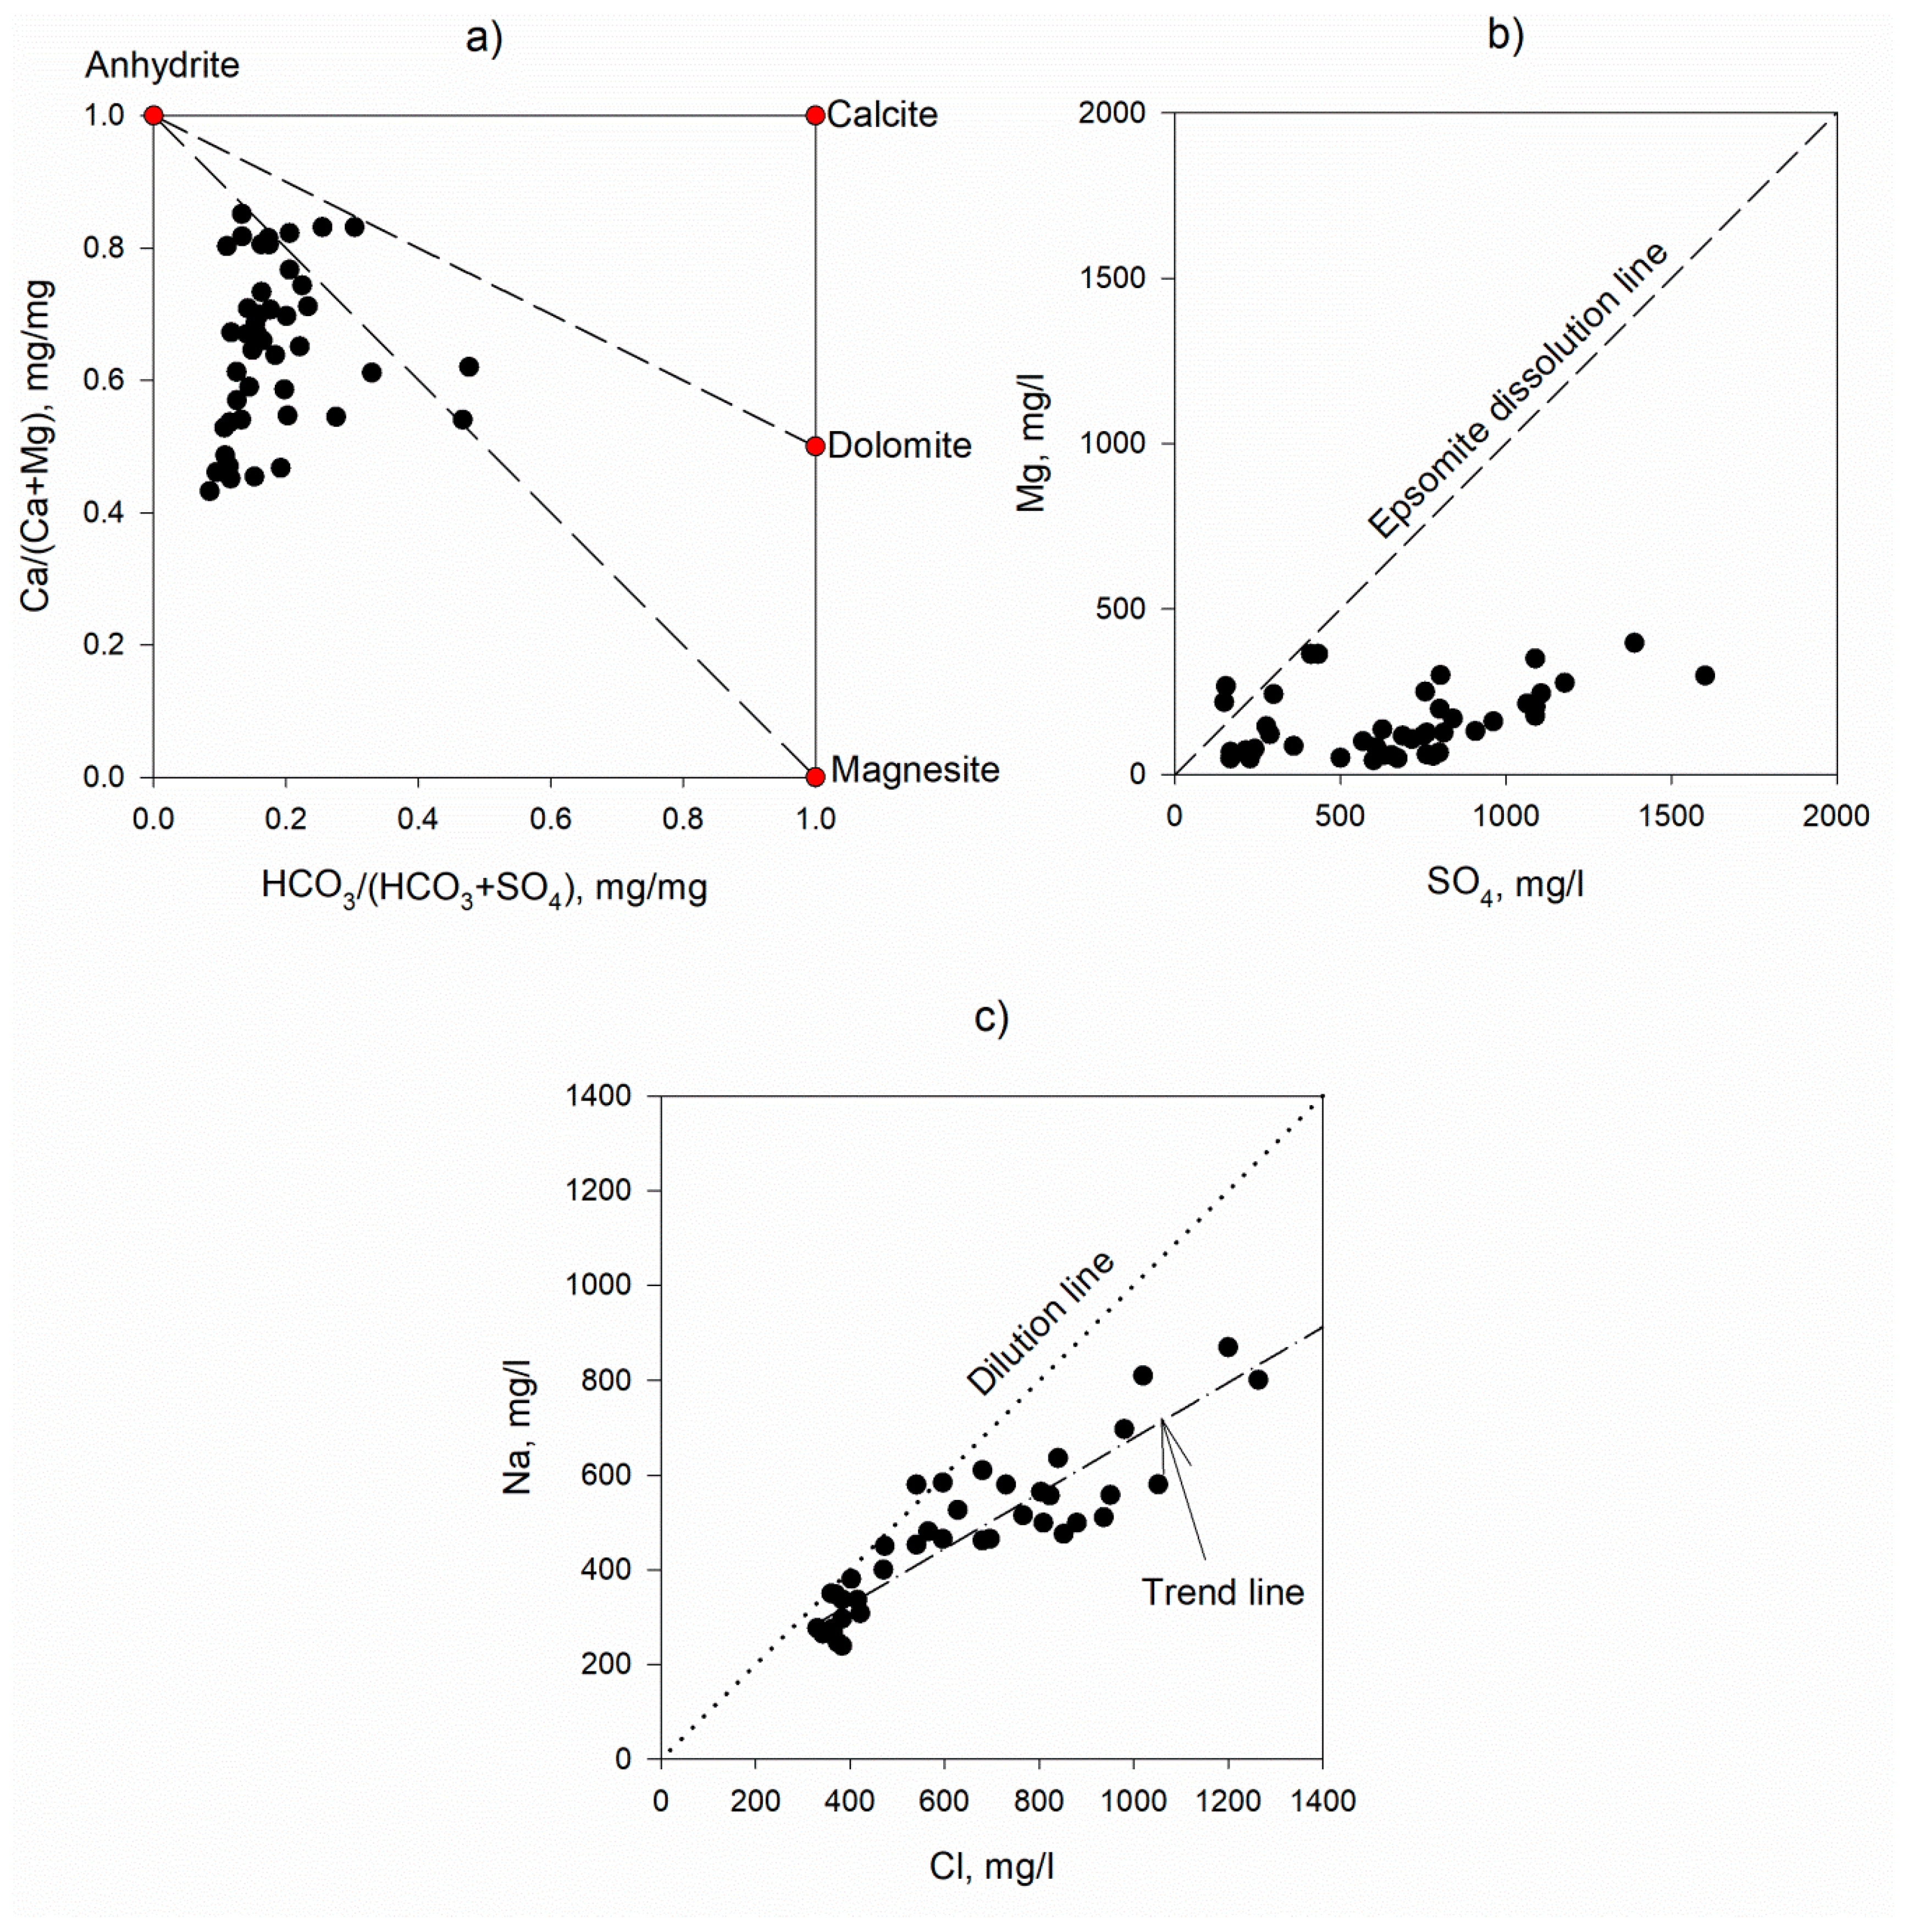
Figure 15a,b highlights the relationships between the main solutes in the sampled of SAA waters using the two plots of Ca/(Ca + Mg) vs. HCO3/(HCO3 + SO3) and Mg vs. SO4, respectively. The water chemistry interactions that take place between the waters of the SAA and the marine waters entering from the Arabian Gulf result from the interactions of water rocks during groundwater circulation in a system dominated by evaporating carbonate rocks (Figure 15a). Most of SAA waters fall below the Magnesite tie-line, while some of them fall below the Dolomite tie-line. This is indicated that the dissolution of carbonate rocks is mainly Dolomite and Magnesite. In contrast, Magnesium carbonate seems to react with Shatt Al-Arab waters lithologies (Figure 15a).
Usually, Epsomite (a hydrous of magnesium sulfate) dissolution leads to an increase in SO4 and Mg contents in the groundwater with Mg/SO4 ratios equal to 1. However, in the Mg vs. SO4 diagram (Figure 15b), the SAA waters are distributed below the Epsomite dissolution line. Most water samples have Mg/SO4 ratios of less than 1, excluding two samples. This was due to either (i) a decrease in magnesium concentrations due to fewer magnesite rocks dissolution, or (ii) an increase in sulfate contents (Figure 15b). The Na-Cl plot (Figure 15c) shows that most of the Na-Cl water samples are distributed below the Na-Cl dilution line. Most water samples of SAA have Na/Cl ratios of less than 1, excluding one sample. The trend line of the Na-Cl plot deviated from the Na-Cl dilution line, with a negative coefficient of 140, a slope of 1.67, and a correlation coefficient R2 of 0.98.
4. Discussion
Contemporary real-life case studies on water quality parameters were presented and discussed by several researchers [73,74,75,76]. In this present research, the quality of biotic factors provides vital data regarding the water health body. The mentioned parameters are utilized to detect whether the water quality is suitable for recreation, drinking, and irrigation, and to assist the life of aquatic creatures’ purposes [23,77]. Chlorides, nitrates, bicarbonates, phosphates, carbonates, and sulfates are anions principally comprising of TDS [77,78]. A positive correlation between temperature and the TDS concentrations was observed in SAA. High rates of evaporation were observed leading to an increase in salt concentration [59]. A negative correlation between TDS and the water amount of discharge was also found at eleven stations. Al-Shawi et al. [60] found that as river discharge declines, the TDS values increase. In winter, high TDS concentrations of 2018 in comparison with summer are attributed to the solids addition from effluents of sewage and runoff water that elevates the values of TDS (Figure 3). Hassan et al. [49] concluded that values of TDS in Euphrates River elevated in months of winter and declined in months of summer. Compared with the results of previous years (Figure 4) except for winter concentrations, the current results were greater than winter for previous years. This was due to high flowrates (due to high rainfalls) of both Tigris and Euphrates Rivers, especially in 2018, as reported in previous studies [6,7,8]. Hussein and Attee [62] and Hammadi [63] reported high concentrations of TDS with low flowrates in the years 2000 to 2010. The highest values were recorded in December at Mehela station. The TDS increased gradually towards the river mouth, which coincides with increased salinity. This increased agreed with the results obtained by Al-Lami [64].
The spatial distribution of Cl concentrations during autumn 2019 takes the same path as in previous seasons (Figure A1). The distribution gradually increased towards the south of the Shatt Al-Arab waterway. In this region, the highest chloride concentration was 1200 mg/L at Fao station. This increase in the concentration of chlorides may be attributed to the presence of dissolved chloride from different rocks and salts in the Shatt Al-Arab. These rocks contain halite, which is one of the sources of chloride and other minerals. The chloride ion was not within the normal limits for drinking purposes, according to the WHO standard in 2006. WHO considered that water is not suitable for drinking use if the chloride ion exceeds 250 mg/L. The Food and Agriculture Organization of the World’s Guide in 1985 limits the chloride concentration to 1050 mg/L in the irrigation [65].
The high sulfate concentrations in Figure 8 were due to the locations of electrical power plants (Turkish power plant and Al-Najebbia power plant). These plants produced compounds of sulfate to the environment of SAA. Al-Hejuje [79] reported that the activities of agriculture play a vital role in contributing compounds of sulfate. It was noticed from Figure 9 that the concentrations of sulfate for samples of water were not within the limits of acceptability according to WHO and Iraqi Standards for the whole water stations at the period of study and signifying high content of minerals. For stations of downstream of SAA, all concentrations variables are observed to elevate due to the activities of anthropogenic and the activities works in the regions of downstream. The sulfate is initiated from sources of a naturalist (i.e., agricultural sewage and runoff). Dawood et al. [80] reported that the values of high SO4 in the location study were higher than those in a nearby study area. The geology and area are two main factors that affect erosion of soil that increases measure parameters (i.e., EC, TDS, and TH). That inorganic pollution is influenced by the above mentioned factors [80]. Laxative effects and bitter taste in some individuals may be a result of high sulfate concentrations [81]. Diarrhea and dehydration are results of people who are drinking high levels of water sulfate especially children which are sulfate sensitive than adults [82]. Results of undergoing investigation went behind the borders of permissibility advised by the Standards of Iraq [83] for all supplies of water.
The concentrations of total hardness increased gradually towards the south towards the mouth of the river in the Arabian Gulf (Figure 11), which coincides with the increase in salinity, and this corresponds to the results obtained by Al-Lami [64]. It was also noticed, through the spatial distribution of TH concentrations during the comparative study period of the autumn season that they were significantly higher during 2018 compared to the results of 2019 (Figure 10). The reason for the high values of hardness concentrations recorded during the summer and autumn seasons during the study period may be due to the evaporation of water, and that because of the difference in salinity of the two ecosystems [69,70]. Also, high sodium levels (Figure 12a) in the Shatt Al-Arab River can be attributed to the decrease in water levels in the Tigris and Euphrates rivers during recent years. This decrease promoted the saline arm to extend from the Arabian Gulf up to 100 km into the Shatt Al-Arab River during dry years. Moreover, anthropogenic activities in Basra can represent a significant additional source of sodium concentrations [66]. This study is planning to construct a blocking dam downstream of the SAA at the Abu Folos Port area to prevent the rise of salty water coming back from the Arabian Gulf.
5. Conclusions
In this study, the water quality parameters (total dissolved solids, total hardness, sulfate, and chloride) of the Shatt Al-Arab River (SAA) were measured during winter 2018 to autumn 2019 and compared with previously available data (2014 to 2018). In addition, spatial distribution using the kriging technique was utilized to analyze the water quality parameters from 2018 to 2019. Other parameters (turbidity, sodium, phosphate, and total organic carbon) and heavy metals (cadmium, chromium, and selenium) were also measured during the study period. Moreover, geochemical characterizations were investigated using binary diagrams to evaluate the variation in the constituent ratios. The results of the study showed a noticeable deterioration in water quality due to the high concentrations of salts during the study period, due to the incursion of the salt tongue (marine water) to the upper part of SAA, which made it unhealthy for human, agricultural, and animal consumption. The spatial distribution of TDS found that high concentrations of TDS were observed in the central of SAA during winter 2018. The TDS increased toward the very south of SAA before the entrance to the Arabian Gulf, especially in autumn 2019. During winter 2018, an increase in sulfate concentrations along the SAA waterway was observed in the sulfate spatial distribution. This increase gradually continued to the south of SAA. During summer 2019, a uniform spatial distribution of sulfate concentrations was observed in all monitoring stations on the SAA, excluding for that in Al-Hartha and Al-Karma stations. Furthermore, the analyses of geochemical properties showed that SAA waters mainly from the dissolution of carbonate rocks. Most of the SAA water samples are distributed below the Epsomite dissolution line and the Na-Cl dilution line.
The more water releases from the fresh sources of the river, the more it contributed to pushing the salty water coming from the Arabian Gulf. This leads to a decrease in the salinity of the water. The results of this study found that the values of salt concentrations during the winter of 2018 are completely different from other seasons in the confined area from Al-Hartha station to Al-Seba station. This was due to the impact of this region on the rise of the salty in the front of seawater coming from the Arabian Gulf during the summer of 2018 due to the low flowrate to feed the SAA. There was a constant increase in the concentrations of salt concentrations from the head of Qurna to the south, up to the confluence of the Karon River on the Shatt Al-Arab, where the quantity of salts decreases relatively to rise again in the Fao station. This research also found that the study area was confined from Al-Maqal station to Abu Flus port station where the salty marine water coming from the Gulf remains for longer periods as it is a low area, which made it a storage basin for salty water. Therefore, it requires a large number of expenses and long periods from the Tigris River to push this salty water towards the sea. In this study, one major issue is that part of the SAA is located in another country (Iran). It is not accessible for the researchers for necessary investigations. A blocking dam downstream of the SAA (at Abu Flus Port) was suggested by this research to prevent salty water from coming back from Arabian Gulf, especially during the receding period. A future study is planned to investigate the influence of salty water in presence of blocking dam on water quality parameters in SAA.
Author Contributions
The performing data analysis, providing required materials, writing—original draft preparation, formulation of overarching research aims, and data/evidence collection were performed by Z.Q.L.; conceptualization, the performing data analysis, ideas, methodology, and writing—review and editing were performed by A.-S.T.A.-M.; methodology, reviewing similar studies, acquiring required data, validation, and writing—review and editing were the task of D.E.S. All authors have read and agreed to the published version of the manuscript.
Funding
This research received no external funding.
Acknowledgments
The authors would like to thank Mustansiriyah University, (www.uomustansiriyah.edu.iq) Baghdad-Iraq and Likewise, the Water Examination Laboratory and the Central Library at the Center for Marine Sciences at Basra University and the Department of Water and Soil Control at the Ministry of Environment.
Conflicts of Interest
The authors declare no conflict of interest.
Appendix A
Figure A1.
Spatial distributions of Cl concentrations by kriging (a) winter 2018 (b) spring 2019 (c) summer 2019 (d) autumn 2019.
Figure A1.
Spatial distributions of Cl concentrations by kriging (a) winter 2018 (b) spring 2019 (c) summer 2019 (d) autumn 2019.

Figure A2.
Spatial distribution of SO42− concentrations by kriging (a) winter 2018 (b) spring 2019 (c) summer 2019 (d) autumn 2019.
Figure A2.
Spatial distribution of SO42− concentrations by kriging (a) winter 2018 (b) spring 2019 (c) summer 2019 (d) autumn 2019.

Figure A3.
Spatial distributions of TH concentrations by kriging (a) winter 2018 (b) spring 2019 (c) summer 2019 (d) autumn 2019.
Figure A3.
Spatial distributions of TH concentrations by kriging (a) winter 2018 (b) spring 2019 (c) summer 2019 (d) autumn 2019.

References
- Mutter, G.M.; Al-Madhhachi, A.T.; Rashed, R.R. Influence of soil stabilizing materials on lead polluted soils using Jet Erosion Tests. Int. J. Integr. Eng. 2017, 9, 28–38. [Google Scholar]
- Hasan, M.B.; Al-Madhhachi, A.T. The influence of crude oil on mechanistic detachment rate parameters. Geosciences 2018, 8, 332. [Google Scholar] [CrossRef] [Green Version]
- Abbas, M.N.; Al-Madhhachi, A.T.; Esmael, S.A. Quantifying soil erodibility parameters due to wastewater chemicals. Int. J. Hydrol. Sci. Technol. 2019, 9, 550–568. [Google Scholar] [CrossRef]
- Al-Madhhachi, A.T.; Mutter, G.M.; Hasan, M.B. Predicting Mechanistic Detachment Model due to Lead-Contaminated Soil Treated with Iraqi Stabilizers. KSCE J. Civ. Eng. 2019, 23, 2898–2907. [Google Scholar] [CrossRef]
- Hashim, Z.E.; Al-Madhhachi, A.T.; Alzubaidi, L.A. Behavior of soil erodibility parameters due to biological soil crusts using jet erosion tests. Ecol. Eng. 2020, 153, 105903. [Google Scholar] [CrossRef]
- Rahi, K.A.; Al-Madhhachi, A.T.; AL-Hussaini, S.N. Assessment of Surface Water Resources of Eastern Iraq. Hydrology 2019, 6, 57. [Google Scholar] [CrossRef] [Green Version]
- Al-Madhhachi, A.T.; Rahi, K.A.; Leabi, W.K. Hydrological Impact of Ilisu Dam on Mosul Dam; the River Tigris. Geosciences 2020, 10, 120. [Google Scholar] [CrossRef] [Green Version]
- Al-Madhhachi, A.T.; Al-Mussawy, H.A.; Basheer, M.I.; Abdul-Sahib, A.A. Quantifying Tigris Riverbanks Stability of Southeast Baghdad City using BSTEM. Int. J. Hydrol. Sci. Technol. 2020, 10, 230–247. [Google Scholar] [CrossRef]
- Saad, H.T.; Hantoush, A.A.; Mahdi, E.A.; Saleh, S.M. Distribution and Sources of Dissolved Fatty Acids in Water of Shatt Arab Estuary and Northwest Arabian Gulf. Mesop. J. Mar. Sci. 2009, 24, 25–34. [Google Scholar]
- Saad, H.T.; Hantoush, A.A.; Hello, M.A.; Zukhair, M.K. Seasonal Variations of Particulate Fatty Acids in Waters of Shatt Arab River and Northwest Arabian Gulf. Mesop. J. Mar. Sci. 2010, 25, 41–52. [Google Scholar]
- Hantoush, A.; Adhub, A.Y.; Hussain, N.A. Levels of Dissolved and Particulate Petroleum Hydrocarbons in Shatt Arab River, Basrah, Southern Iraq. Mesop. J. Mar. Sci. 2008, 23, 77–96. [Google Scholar]
- Farid, W.A.; Saad, H.T.; Adhub, A.Y. Monitoring of Hydrocarbons in Shatt Al Arab River by Using Some Species of Molluscs. Mesop. J. Mar. Sci. 2008, 23, 305–319. [Google Scholar]
- Mohammad, M.H.; Imarah, F.J.M.; Mezher, A.A. Determination of Nickel in Water of Shatt Arab River by Atomic Absorption and Spectrophotometery. Mesop. J. Mar. Sci. 2008, 23, 167–179. [Google Scholar]
- Mohammed, M.H. Modified Method for the Determination of Cobalt (II) and Copper (II) ions by Adopting Schiff Base Complexes in Water of Shatt Arab River. Mesop. J. Mar. Sci. 2011, 26, 170–181. [Google Scholar]
- Jorany, Y.S.J.; Sowdani, K.H.; Mizhir, A.A. Bulid-up a Flow Injection Analysis Unit for Ammonium Determination in the Shatt Al-Arab Water. Mesop. J. Mar. Sci. 2011, 26, 47–58. [Google Scholar]
- Hejuje, M.M. Distribution of Heavy Elements in Water and Sediments from Ashar and Khandek Canals Connected with Shatt Arab River and Their Effects on Algae. Master’s Thesis, Basrah University, Basrah, Iraq, 1997. [Google Scholar]
- Khafaji, B.Y. Preliminary Survey of Selected Heavy Metals in Jubyla Branch Connected with Shatt Arab River. Mesop. J. Mar. Sci. 2000, 15, 69–80. [Google Scholar]
- Imarah, J.M.; Mahmood, A.A.; Humadi, M.S. Levels of Trace Metals in Shatt Arab Branches during Spring and Summer Seasons. Mesop. J. Mar. Sci. 2006, 2, 9–17. [Google Scholar]
- El-Baba, M.; Kayastha, P.; Huysmans, M.; De Smedt, F. Evaluation of the Groundwater Quality Using the Water Quality Index and Geostatistical Analysis in the Dier al-Balah Governorate, Gaza Strip, Palestine. Water 2020, 12, 262. [Google Scholar] [CrossRef] [Green Version]
- Greene, R. Addressing accessibility challenges of GIS-based multiple-criteria decision analysis for integrated land management: Case study in the Humber region of Newfoundland Labrador, Canada. Master’s Thesis, Memorial University of Newfoundland, St. John’s, NL, Canada, 2010. [Google Scholar]
- Burrough, P.A. Principles Geographic Information System for LResources Assessment; Calrendon Press: Oxford, UK, 1986; p. 193. [Google Scholar]
- Fazal, S. GIS Basics. New Age International; (P) Ltd.: New Delhi, India, 2008; p. 339. [Google Scholar]
- Da Silva, P.P.; Fulcher, C. Human Dimensions of Marine Fisheries: Using GIS to Illustrate Land-Sea Connections in the Northeast U.S. Herring, Clupea harengus, Fishery. Mar. Fish. Rev. 2006, 67, 19–25. [Google Scholar]
- Yasmin, R.; Islam, M.; Alam, M.J. A Study on Potential Application of Geographic Information Systems (GIS) in Fisheries and Aquaculture of Bangladesh. World J. Fish Mar. Sci. 2012, 4, 609–619. [Google Scholar]
- Kumar, R.; Singh, R.D.; Sharma, D. Water recourses of India. Curr. Sci. 2005, 89, 794–811. [Google Scholar]
- Naithani, R.; Pande, I.P. Physicochemical assessment of water quality with respect to Remote sensing and GIS techniques. Adv. Pure Appl. Chem. (APAC) 2012, 1, 1–6. [Google Scholar]
- Assaf, H.; Saadeh, M. Assessing water quality management options in the Upper Litani Basin, Lebanon, using an integrated GIS-based decision support system. Environ. Model. Softw. 2008, 2, 27–1337. [Google Scholar] [CrossRef]
- Al-Bassam, B.F. Assessment of shallow groundwater quality in Zhengzhou area using remote sensing and GIS. J. Eng. Dev. 2009, 13, 72–86. [Google Scholar]
- Meixler, M.S.; Bain, M.B. A GIS framework for fish habitat prediction at the river basin scale. Int. J. Ecol. 2012, 2012, 10. [Google Scholar] [CrossRef] [Green Version]
- Salih, S.A.; Al-Hadithy, I.M.; Al-Nuami, A.S. Water quality assessment of Haditha Dam lake-western Iraqi desert using remote sensing and GIS techniques. Iraqi J. Desert Res. 2008, 1, 1–15. [Google Scholar]
- Sail, K.N.; Al-Nuami, A.S.; Abd Al-Aziz, B. Assessment water quality of Al-Habania reservoir by using Remote Sensing Techniques and Geographical information system. Iraqi J. Civ. Eng. 2008, 11, 27–38. [Google Scholar]
- Abbas, A.; Ziboon, A.R.T. Using remote sensing and GIS technique to study soil physical properties for Hour Al-Hammar (South of Iraq). Eng. Technol. J. 2010, 28, 164–180. [Google Scholar]
- Jaber, H.S. A Geographic Information System application for water resources of Iraq. J. Eng. Dev. 2012, 16, 23–31. [Google Scholar]
- Sachit, D.E.; Azawi, H.K. Application of Monte Carlo Simulation to Find Travel Time of Groundwater in the Iraqi Western Desert. Environ. Nat. Resour. Res. 2018, 8, 17–38. [Google Scholar] [CrossRef] [Green Version]
- Hassan, A.A.; Dawood, A.S.; AL-Mansori, N.J. Assessment of Water Quality of Shatt Al-Basrah Canal using Water Pollution Index. Int. J. Eng. Technol. 2018, 7, 757–762. [Google Scholar] [CrossRef] [Green Version]
- Al-Adhab, H.; Salman, A.; Sagban, A. Using multivariate statistical methods to Evaluate water quality in some of Basrah province locations. In Proceedings of the ICCEET 2019, Najaf, Iraq, 23–24 April 2019; pp. 65–72. [Google Scholar]
- Vespasiano, G.; Cianflone, G.; Cannata, C.B.; Apollaro, C.; Dominici, R.; De Rosa, R. Analysis of groundwater pollution in the Sant’Eufemia Plain (Calabria—South Italy). Ital. J. Eng. Geol. Environ. 2016, 2, 5–15. [Google Scholar] [CrossRef]
- Vespasiano, G.; Cianflone, G.; Romanazzi, A.; Apollaro, C.; Dominici, R.; Polemio, M.; De Rosa, R. A multidisciplinary approach for sustainable management of a complex coastal plain: The case of Sibari Plain (Southern Italy). Mar. Pet. Geol. 2019, 109, 740–759. [Google Scholar] [CrossRef]
- Apollaro, C.; Caracausi, A.; Paternoster, M.; Randazzo, P.; Aiuppa, A.; De Rosa, R.; Fuoco, I.; Mongelli, G.; Muto, F.; Vanni, E.; et al. Fluid geochemistry in a low-enthalpy geothermal field along a sector of southern Apennines chain (Italy). J. Geochem. Explor. 2020. [Google Scholar] [CrossRef]
- Chabuk, A.; Al-Madhlom, Q.; Al-Maliki, A.; Al-Ansari, N.; Hussain, H.M.; Laue, J. Water quality assessment along Tigris River (Iraq) using water quality index (WQI) and GIS software. Arab J Geosci 2020, 13, 654. [Google Scholar] [CrossRef]
- Al-Mahmood, H.H.; Al-Shawi, I.J.; Al-Imarah, F.J. Survey for the evaluation of physical-chemical parameters of Shatt Al-Arab Water from (1974–2005). Basrah Mag. Agric. Sci. 2008, 21, 433–448. [Google Scholar]
- Hassan, F.W.; Hassan, F.I.; Jasim, A.H. The Effect of industrial effluents polluting water near their discharging in Basrah Governorate/Iraq. Basrah Res. Mag. 2011, 37, 42–53. [Google Scholar]
- Mahdi, B.A. Environmental pollution in Shatt al-Arab estuary. J. Int. Acade. Res. Multidis. 2015, 3, 32–42. [Google Scholar]
- APHA, A.W. Standard Methods for the Examination of Water and Waste Water, 20th ed.; American Public Health Association, American Water Works Association, Water Environment Federation: Washington, DC, USA, 1998. [Google Scholar]
- Saad, S.A.H. Notes on problems of water pollution in the Shatt al-Arab. Arabic Gulf Mag. 1980, 12. [Google Scholar]
- Abdullah, S.S. Study in the Shatt al-Arab River Load in the City of Basrah. Master’s Thesis, Marine Science Centre, University of Basrah, Basrah, Iraq, 1990. [Google Scholar]
- Abaychi, J.K.; Mustafa, Y.Z. The asiatic clam, Corbicula fluminea: An indicator of trace metal pollution in the Shatt al-Arab River, Iraq. Environ. Pollut. 1988, 54, 109–122. [Google Scholar] [CrossRef]
- Jawad, A.H.M. Study of some chemical and physical indicators of water Shatt al Arab in Basra city. Mesop. Mag. 1994, 2, 189–203. [Google Scholar]
- Hassan, F.W.; kream, S.M.; Khasaf, D.K.; Aliwi, Y.J. The quality of irrigation water in Al-Faw city. Basra Res. Mag. 2011, 37, 33–41. [Google Scholar]
- Hussain, N.A.; Karim, H.H.; Al-Saad, H.T.; Yousif, O.H.; Al-Saboonchi, A.A. Shatt Al-Arab fundamental scientific. Mar. Sci. Cent. 1990, 391. [Google Scholar]
- Yaacoub, R.R. The Meteorology in Arabian Gulf: Arabian Gulf-selected Scientific Studies; Marine science center, Dar Al-Hekma Publishing House, Univ. of Basrah: Basra, Iraq, 1986. [Google Scholar]
- Tsihrintzis, V.A.; Hamid, R.; Fuentes, H.R. Use of geographic information systems (GIS) in water resources: A review. Water Resour. Manag. 1996, 10, 251–277. [Google Scholar] [CrossRef]
- Bailey, T.C.; Gatrell, C. Interactive Spatial Data Analysis; Longman Group Limited: Essex, UK, 1995. [Google Scholar]
- Johnston, K.; Ver Hoef, J.M.; Krivoruchko, K.; Lucas, N.; Ver Hoef, J.M. Using ArcGIS Geostatistical Analyst; Environmental Systems Research Institute: New York, NY, USA, 2001. [Google Scholar]
- Isaaks, E.H.; Srivastava, M.R.; Isaaks, E.H. An Introduction to Applied Geostatistics; Oxford University Press: New York, NY, USA, 1989. [Google Scholar]
- Deutsch, C.V.; Journel, A.G. GSLIB: Geostatistical Software Library and User’s Guide, 2nd ed.; Oxford University Press: New York, NY, USA, 1998. [Google Scholar]
- Hooshmand, A.; Delghandi, M.; Izadi, A.; Aali, K.A. Application of kriging and cokriging in spatial estimation of groundwater quality parameters. Afr. J. Agric. Res. 2011, 6, 3402–3408. [Google Scholar]
- Al-Hello, A.; Al-Obaidy, A.-J. The chemistry of Shatt Al-Arab waters from Qurna to Al-Fao. Mesop. Oceanogr. 1997, 2, 190–201. [Google Scholar]
- Mossa, Z.J. Study the Environmental Changes of the Phenols in the Shatt Al-Arab and Its Branches and Its Impact on the Internal Density of Algae. Master’s Thesis, University of Basra, Basrah, Iraq, 2006. [Google Scholar]
- Al-Shawi, I.J.; Al-Rubaie, I.A.; Abdullah, I.K. Menology study of the southern part of the Tigris and Euphrates and the extent of their impact on the Chemical and physical characteristics of the Shatt Al-Arab Rive. Al-Mallam Mag. 2007, 6. [Google Scholar]
- Reid, G.K. Ecology of Inland Waters and Estuaries; D. Van Nostrand Co.: New York, NY, USA, 1961; p. 375. [Google Scholar]
- Hussein, S.A.; Attee, R.S. Comparative studies on limnological features of the Shatt Al-Arab estuary and Mehejran canal. I. Seasonal variations in biotic factors. Basrah J. Agric. Sci. 2000, 13, 49–59. [Google Scholar]
- Hammadi, N.S. An Ecological Study of the Rotifera of Shatt Al-Arab Region. Ph.D. Thesis, College of Agriculture, University of Basrah, Basrah, Iraq, 2010; p. 351. [Google Scholar]
- Al-Lami, O.T. Effect of Some Marine Properties for Arabian Gulf on North Part’s Hydrol. of Shatt Al-Arab Riverbed. Master’s Thesis, College of Arts, University of Basrah, Basrah, Iraq, 2009. [Google Scholar]
- Al-Asadi, S.R. Geography of Water Resources, 1st ed.; Al-Ghadeer Company for Printing and Publishing Ltd.: Basra, Iraq, 2014; p. 82. [Google Scholar]
- Al-Maliky, J.H.A. Analysis of Water Quality and the Impact of the Salt Wedge from the Arabian Gulf on the Shatt Al-Arab River, Iraq. Master’s Thesis, School of Geography, Planning and Environmental Management. University of Queensland-Australia and the University of Basrah, Basrah, Iraq, 2012; p. 81. [Google Scholar]
- Al-Aboodi, A.H.; Abbas, S.A.; Ibrahim, H.T. Effect of Hartha and Najibia power plants on water quality indices of Shatt Al-Arab River, south of Iraq. Appl. Water Sci. 2018, 8, 1–10. [Google Scholar] [CrossRef] [Green Version]
- Yaseen, B.R.; Al-Asaady, K.A.; Kazem, A.A.; Chaichan, M.T. Environmental impacts of salt tide in Shatt Al-Arab Basra/Iraq. J. Environ. Sci. Toxicol. Food Technol. 2014, 10, 35–43. [Google Scholar] [CrossRef]
- United States Environmental Protection Agency (USEPA). Final Water Quality Monitoring Summary Report 2012, Remedial Dredging New Bedford Harbor Superfund Site; OU #1 Contract No. W912WJ-09-D-0001-0010-07; United States Environmental Protection Agency (USEPA): Washington, DC, USA, 2012.
- Pradeep, V.; Deepika, C.; Urvi, G.; Hitesh, S. Water Quality Analysis of an Organically Polluted Lake by Investigating Different Physical and Chemical Parameters. Int. J. Res. Chem. Environ. 2012, 2, 105–111. [Google Scholar]
- Ramesh, K.; Elango, L. Groundwater quality and its suitability for domestic and agricultural use in Tondiar river basin, Tamil Nadu, India. Environ. Monit. Assess. 2011. [Google Scholar] [CrossRef]
- AL-Bakri, D.; AL-Ghadban, A.; Khalaf, F. Sedimentological characteristics of the surficial sediments of the Kuwaiti marine environment, northern Arabian Gulf. Sedimentology 1984. [Google Scholar] [CrossRef]
- Olyaie, E.; Banejad, H.; Chau, K.; Chau, K.; Melesse, A.M. A comparison of various artificial intelligence approaches performance for estimating suspended sediment load of river systems: A case study in United States. Environ. Monit. Assess. 2015, 187, 189. [Google Scholar] [CrossRef]
- Alizadeh, M.I.; Kavianpour, M.R.; Danesh, M.; Adolf, J.; Shamshirband, S.; Chau, K. Effect of river flow on the quality of estuarine and coastal waters using machine learning models. Eng. Appl. Comput. Fluid Mech. 2018, 12, 810–823. [Google Scholar] [CrossRef] [Green Version]
- Shamshirband, S.; Nodoushan, E.J.; Adolf, J.E.; Manaf, A.A.; Mosavi, A.; Chau, K. Ensemble models with uncertainty analysis for multi-day ahead forecasting of chlorophyll a concentration in coastal waters. Eng. Appl. Comput. Fluid Mech. 2019, 13, 91–101. [Google Scholar] [CrossRef] [Green Version]
- Kargar, K.; Samadianfard, S.; Parsa, J.; Nabipour, N.; Shamshirband, S.; Mosavi, A.; Chau, K. Estimating longitudinal dispersion coefficient in natural streams using empirical models and machine learning algorithms. Eng. Appl. Comput. Fluid Mech. 2020, 14, 311–322. [Google Scholar] [CrossRef]
- Al-Galibi, M.K.N. Deterioration of Water Characteristics in Shatt Al-Arab River and Ways of Treatments. Master’s Thesis, College Education for Human Science, the University Basrah, Basrah, Iraq, 2019; p. 100. [Google Scholar]
- Canadian Council of Ministries of the Environment (CCME). Scientific Criteria Document for the Development of the Canadian Water Quality Guidelines for the Protection of Aquatic Life. 2003. Available online: http://ceqg-rcqe.ccme.ca/ (accessed on 15 August 2020).
- Al-Hejuje, M.M. Application of Water Quality and Pollution Indices to Evaluate the Water and Sediments Status in the Middle Part of Shatt Al-Arab River. Ph.D. Thesis, College of Science, University of Basrah, Basrah, Iraq, 2015; p. 214. [Google Scholar]
- Dawood, A.S.; Jabbar, M.T.; AL-Tameemi, H.J. Effect of groundwater salinity level on soil using remote sensing and GIs techniques: Case study of southwest of Basra Province. J. Eng. Sci. Technol. 2018, 13, 977–989. [Google Scholar]
- Udayalaximi, G.; Himabindu, D.; Ramadass, G. Geochemical evolution of ground water quality in selected areas of Hyderabad. India Ind. J. Sci. Technol. 2010, 3, 546–553. [Google Scholar] [CrossRef]
- Djidel, M.; BousnoubraKhericri, H.; Nezli, I. The minerality impact of deep ground water, in Desert Regions, on Human and the environment. Southern Algeria. Eur. J. Sci. Res. 2010, 45, 540–551. [Google Scholar]
- Central Organization for Quality Control and Standardization. Drinking-Water Standard IQS: 417; Central Organization for Quality Control and Standardization, Council of Ministers: Basrah, Iraq, 2001.
Figure 1.
Locations of the sampling stations selected in the present study and showing the most important polluting sources of the Shatt Al-Arab River including; sanitary landfill sites, health activities, and industrial activities of types B and C, according to the classification of Iraqi legislation for river pollutants.

Figure 2.
Geomorphological formation of the study area (Ministry of Industry and Minerals, Basra Geological, 2017).
Figure 2.
Geomorphological formation of the study area (Ministry of Industry and Minerals, Basra Geological, 2017).

Figure 3.
TDS concentrations of the selected stations for different seasons during the study period.
Figure 3.
TDS concentrations of the selected stations for different seasons during the study period.

Figure 4.
Comparison of TDS concentrations of the selected stations for four seasons during the period of 2014 to 2019.
Figure 4.
Comparison of TDS concentrations of the selected stations for four seasons during the period of 2014 to 2019.

Figure 5.
Spatial distributions of TDS concentrations using kriging interpolation: (a) winter 2018, (b) spring 2019, (c) summer 2019, and (d) autumn 2019.
Figure 5.
Spatial distributions of TDS concentrations using kriging interpolation: (a) winter 2018, (b) spring 2019, (c) summer 2019, and (d) autumn 2019.

Figure 6.
Chloride concentrations of the selected stations for different seasons during the study period.
Figure 6.
Chloride concentrations of the selected stations for different seasons during the study period.

Figure 7.
Comparison of Cl concentrations of the selected stations for four seasons during the period of 2014 to 2019.
Figure 7.
Comparison of Cl concentrations of the selected stations for four seasons during the period of 2014 to 2019.

Figure 8.
The sulfate (SO42−) concentrations of the selected stations for different seasons during the study period.
Figure 8.
The sulfate (SO42−) concentrations of the selected stations for different seasons during the study period.

Figure 9.
Comparison of SO4 concentrations of the selected stations for four seasons during the period of 2014 to 2019.
Figure 9.
Comparison of SO4 concentrations of the selected stations for four seasons during the period of 2014 to 2019.

Figure 10.
Total hardness concentrations of the selected stations for different seasons during the study period.
Figure 10.
Total hardness concentrations of the selected stations for different seasons during the study period.

Figure 11.
Comparison of TH concentrations of the selected stations for four seasons during the period of 2014 to 2019.
Figure 11.
Comparison of TH concentrations of the selected stations for four seasons during the period of 2014 to 2019.

Figure 12.
Other water quality parameter concentrations of the selected stations for different seasons during the study period: (a) Turbidity, (b) Sodium, (c) Phosphate, and (d) Total Organic Carbon.
Figure 12.
Other water quality parameter concentrations of the selected stations for different seasons during the study period: (a) Turbidity, (b) Sodium, (c) Phosphate, and (d) Total Organic Carbon.

Figure 13.
Heavy Metals concentrations of the selected stations for different seasons during the study period: (a) Cadmium, (b) Chromium, and (c) Selenium.
Figure 13.
Heavy Metals concentrations of the selected stations for different seasons during the study period: (a) Cadmium, (b) Chromium, and (c) Selenium.

Figure 14.
Correlation diagram of SO4 vs. HCO3 + Cl showing the water samples from the Shatt Al-Arab River. Iso-salinity lines (TIS) are drawn for reference.
Figure 14.
Correlation diagram of SO4 vs. HCO3 + Cl showing the water samples from the Shatt Al-Arab River. Iso-salinity lines (TIS) are drawn for reference.

Figure 15.
Binary diagrams: (a) Ca/(Ca + Mg) vs. HCO3/(HCO3 + SO4), (b) Mg vs. SO4, and (c) Correlation diagrams of Na vs. Cl, for the water samples from the Shatt Al-Arab River.
Figure 15.
Binary diagrams: (a) Ca/(Ca + Mg) vs. HCO3/(HCO3 + SO4), (b) Mg vs. SO4, and (c) Correlation diagrams of Na vs. Cl, for the water samples from the Shatt Al-Arab River.

Publisher’s Note: MDPI stays neutral with regard to jurisdictional claims in published maps and institutional affiliations. |
© 2020 by the authors. Licensee MDPI, Basel, Switzerland. This article is an open access article distributed under the terms and conditions of the Creative Commons Attribution (CC BY) license (http://creativecommons.org/licenses/by/4.0/).
Share and Cite
MDPI and ACS Style
Lateef, Z.Q.; Al-Madhhachi, A.-S.T.; Sachit, D.E. Evaluation of Water Quality Parameters in Shatt AL-Arab, Southern Iraq, Using Spatial Analysis. Hydrology 2020, 7, 79. https://0-doi-org.brum.beds.ac.uk/10.3390/hydrology7040079
AMA Style
Lateef ZQ, Al-Madhhachi A-ST, Sachit DE. Evaluation of Water Quality Parameters in Shatt AL-Arab, Southern Iraq, Using Spatial Analysis. Hydrology. 2020; 7(4):79. https://0-doi-org.brum.beds.ac.uk/10.3390/hydrology7040079
Chicago/Turabian StyleLateef, Zahraa Q., Abdul-Sahib T. Al-Madhhachi, and Dawood E. Sachit. 2020. "Evaluation of Water Quality Parameters in Shatt AL-Arab, Southern Iraq, Using Spatial Analysis" Hydrology 7, no. 4: 79. https://0-doi-org.brum.beds.ac.uk/10.3390/hydrology7040079
Note that from the first issue of 2016, this journal uses article numbers instead of page numbers. See further details here.