Article

An Assessment of the Recent Evolution of the Streamflow in a Near-Natural System: A Case Study in the Headwaters of the Mero Basin (Galicia, Spain)

by
M. L. Rodríguez-Blanco
1,*,
M. M. Taboada-Castro
2 and
M. T. Taboada-Castro
3
1
History, Art and Geography Department, GEAAT Group, University of Vigo, Campus As Lagoas, 36310 Ourense, Spain
2
ETSIIAA, Area of Soil Science and Soil Chemistry, University of Valladolid, 34004 Palencia, Spain
3
Faculty of Sciences, Centre for Advanced Scientific Research (CICA), University of A Coruna, 15071 A Coruña, Spain
*
Author to whom correspondence should be addressed.
Submission received: 30 September 2020 / Revised: 3 December 2020 / Accepted: 3 December 2020 / Published: 8 December 2020

Abstract

:
Observational trend analysis is fundamental for documenting changes in river flows and placing extreme events in their longer-term historical context. Observations from near-natural catchments, i.e., with little or no alteration by humans, are of great importance in detecting and attributing streamflow trends. The purpose of this study is to analyze the annual and seasonal trends of stream discharge (mean, low and high flows) in a headwater catchment in NW Spain, i.e., in the wettest corner of the Iberian Peninsula. The results showed no significant decrease in the mean annual stream discharge. However, significantly lower summer and autumn mean stream discharge and an increase in low flow period were detected, in addition to lesser autumn high flow. The rainfall pattern followed an upward trend, but was not significant. This different pattern shown by rainfall and discharge indicates that is not sufficient to explain the observed trend in stream discharge. Air temperature, most notably by enhancing evapotranspiration, may explain the altered patterns of stream discharge.

1. Introduction

Due to the incalculable value of water as an asset for all, both in the present and in the future, and the importance of streamflow as an indicator of long-term hydro-climatic changes, curbing and quantifying changes in streamflow series have become essential for water resource planning and management [1,2]. Streamflow integrates the influence of atmospheric variables over a catchment and, presumably, if consistent changes in rainfall and other climate variables (winds, atmosphere/heat fluxes) are observed, these should also be reflected in the catchment scale. However, this is not so obvious, because catchment characteristics (geology, slope, soils) impact rainfall-runoff transformation properties [3,4,5]. Additionally, human activities can greatly influence the river systems and make it difficult for trend detection and attribution [6,7]. Against this background, streamflow measures in natural or near-natural rivers become of prime importance in understanding hydrological processes in an area and identifying and attributing emerging trends [8,9,10]. Hydrological predictive modellings also require adequate and suitable local data to represent rainfall-runoff processes accurately. In fact, several studies have highlighted the importance of the hydrological modelling components in the rainfall-runoff modelling chain. Some of these studies investigated uncertainties linked to rainfall and the surface roughness component, and only a few focus on streamflow variations [5,11,12]. In this respect, Bermudez et al. [11] showed that a better representation of the hydrological processes occurring in the model domain and the availability of more accurate streamflow input data may reproduce a better response and improve model performance.
The term natural-regime stream is not well defined in the literature. Occasionally, it is simply described as rivers where little or no human intervention has taken place, thus rendering them highly unspoilt [13]. However, setting thresholds to differentiate natural-regime streams is not an easy task [14]. Various criteria relating to certain features describing the character of the riparian zone and river channel, the discharge regime and land use in the catchment were used to catalog human disturbance. For example, indicators of hydrologic alterations (IHA) are widely used to characterize human alterations of streamflow regimes [15], but they contain 33 individual parameters. The integrated connectivity status index (CSI) is also used to determine human interference in fluvial connectivity, defining the natural or free-flowing rivers as, i.e., systems largely unaffected by changes to fluvial connectivity, allowing unobstructed movement and exchange of water, energy, material and species within the river system and with surrounding landscapes [16]. As the impact is extensive, defining the threshold for distinguishing natural rivers is sometimes difficult. For example, Batalla et al. [17] define the degree of impoundment as an indicator of the extent to which reservoirs could change flow, while Nardi et al. [18] and Scheel et al. [19] used river–floodplain disconnectivity to evaluate man-made impacts. In the present study, the term “near-natural-regime stream” is used in the same sense as it has been used in previous research into this topic [8,20], meaning that it describes river flow regimes minimally affected by anthropogenic disturbances, such as reservoirs, dams, channelization, water extraction. Therefore, the term near-natural does not necessarily equate to totally undisturbed pristine conditions; but it might include minor disturbances, such as land-use and land management changes.
The request for a reference streamflow dataset for near-natural catchments has been largely recognized worldwide and supported by some international programs, like FRIEND [9]. In this context, a significant number of studies have been conducted over the last few years with the aim of detecting, measuring and evaluating streamflow trends in near-natural catchments [6,7,8,20,21,22]. Regarding trend studies in Europe, no uniform trend has been observed for streamflow [5,6]. Thus, whereas positive trends in annual, monthly and low flows were observed in near-natural catchments in Nordic countries [23], a generalized pattern of negative trends in annual and seasonal streamflows were reported for southern European rivers [5].
Most trend studies in the Iberian Peninsula focused on annual, seasonal, monthly and low flows. Lorenzo-Lacruz et al. [22] detected a generalized reduction in streamflow when studying a large database of Spanish mountain rivers not disrupted by major human interference. These results are in line with the Martínez-Fernández [20] study that found downward trends in annual and seasonal streamflows in an analysis of 74 near-natural rivers in Spain. Zabaleta et al. [24] also highlighted dominant-negative trends in various catchments in the Basque Country. Significant downward trends in annual streamflow were also identified in the headwaters of the Ribera Salada [21], Tagus [25] and Duero [26]. However, in the Águeda basin (north-central region of Portugal), Hawtree et al. [27] found no evidence of significant reductions in streamflow, despite wide afforestation that could, arguably, be explained by the presence of compensatory climate trends over the study period.
To summarize, most of the aforementioned trend studies in the streamflow series carried out in Spain focused on regions with a Mediterranean climate. Thus, these studies do not comprehensively analyze the hydro-climatic changes of streams in the humid region of Spain (NW Spain). There is general agreement that air temperatures have increased over the last century in NW Spain [28,29]. However, it is unclear how these changes may have affected streamflow. Evidently, the results obtained for the Mediterranean area are not directly applicable to more humid regions. Hence, it is a challenge to examine stream discharge in humid catchments.
In this paper, a streamflow trend analysis was carried out in a headwater catchment of NW Spain (i.e., under a humid climate) with the aim of contributing to filling a gap in research on a national scale. The analysis will be carried out at different time scales (annual, seasonal and monthly), paying special attention to the duration and severity of the low flow. The choice of the study area (a headwater catchment of the Mero basin) is based on: (i) not being affected by anthropogenic alterations such as reservoirs and dams, therefore qualifying it as an example of a near-natural regimen fluvial system, (ii) its characteristics, which respond to the archetype of the Galician rural environment: small population centers with highly dispersed single-family dwellings, and (iii) the strategic, environmental and social importance of its water resources. The Mero basin is important for the future socio-economic development of the city of A Coruña and its metropolitan area (NW Spain), because it is the main contributor to the Abegondo-Cecebre reservoir, the largest source of water supply for the area. This reservoir also provides high-quality habitats for a large number of species and was cataloged as a Special Area of Conservation of Natura 2000 in 2014.

2. Materials and Methods

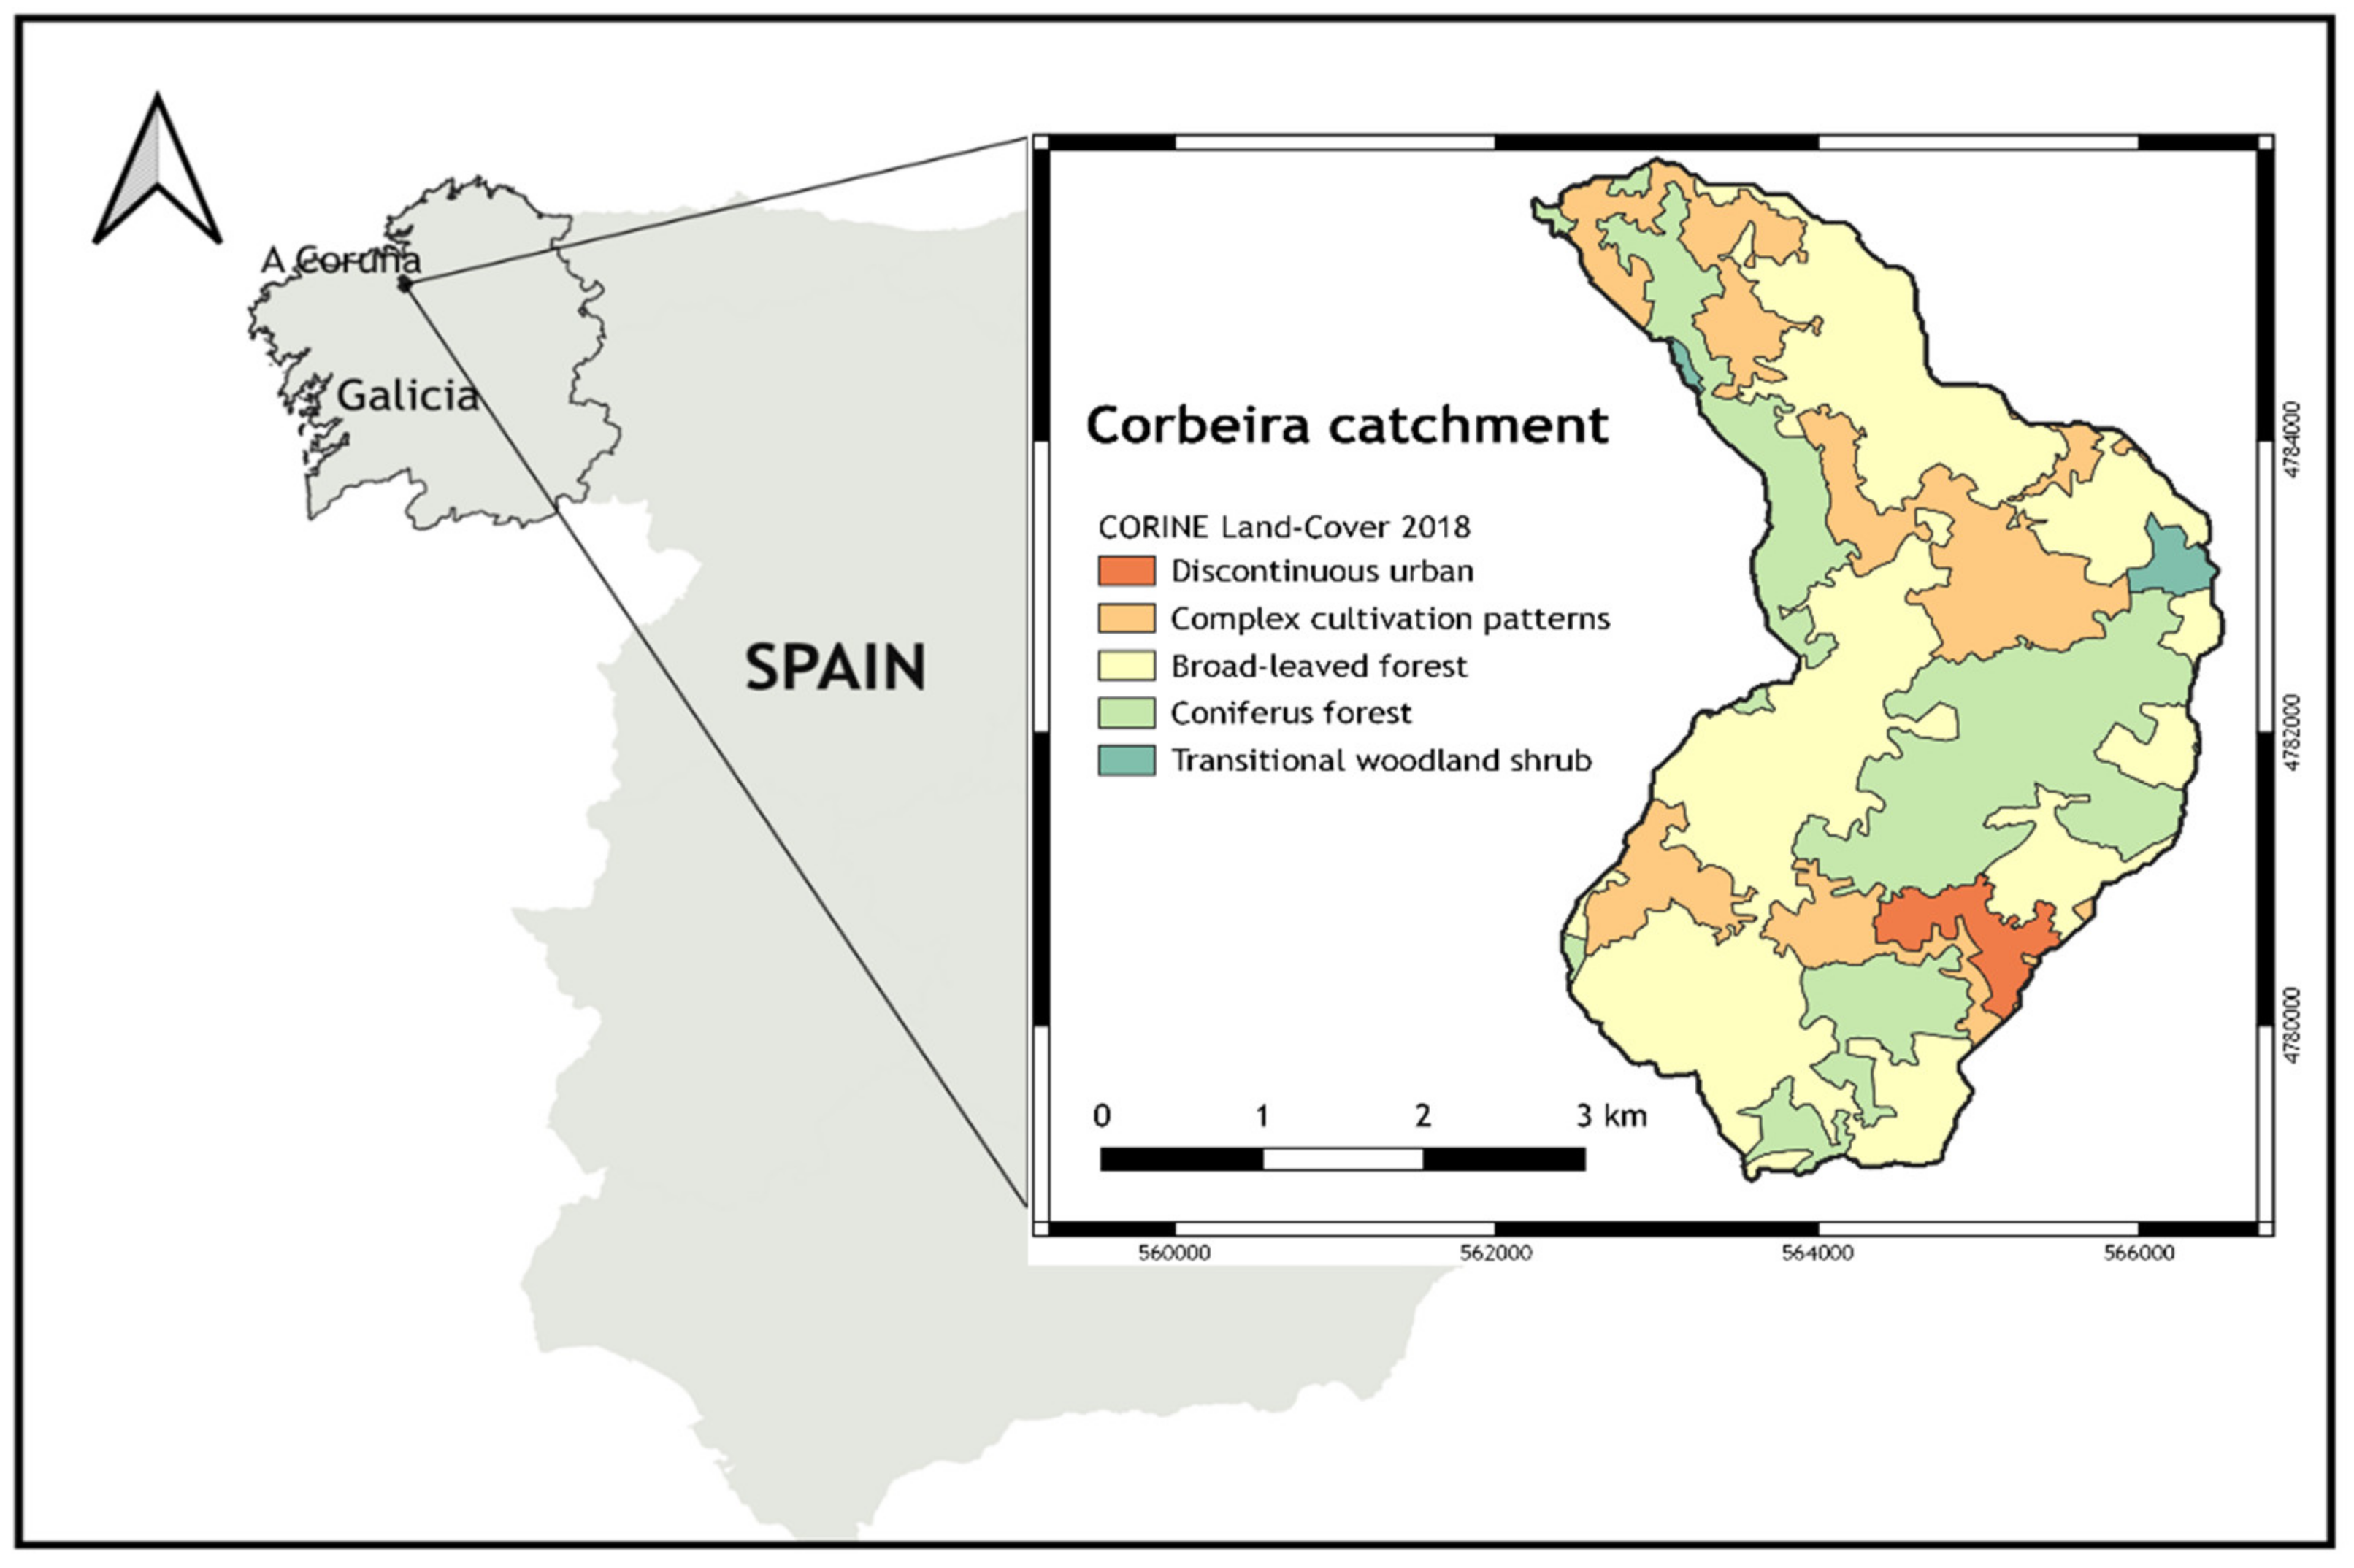
2.1. Case Study and Data Description

This study was carried out at a headwater catchment (Corbeira) of the larger Mero basin (245 km2), located near A Coruña in northwest Spain (Figure 1). The catchment is not affected by substantial human alterations directly modifying natural stream behavior, such as reservoirs and hydropower stations. It drains a catchment area of 16 km2 with a river length of 10 km and mean slope of 19%. The gauging station lies at 65 m a.s.l., while the highest elevation stands at 470 m a.s.l. Soils and land use are typical of the region. Soils are formed on a uniform substrate consisting of materials belonging to the Series of Órdenes Complex [30]. They are generally deep, rich in organic matter, acid and can be classified as Umbrisols and Cambisols [31]. Their texture is silty loam. The catchment is predominantly rural, with a low population density (about 35 inhabitants km2). The primary land uses include commercial forest (65%), mainly eucalyptus plantations, and agricultural land (30%). The climate is oceanic with a mean annual temperature of approximately 13 ºC and mean annual rainfall of 1073.6 mm, ranging from 639.9 mm to 1788.2 mm (based on the period 1983/1984–2018/2019 for the nearest weather station of the Galician meteorological service about 8 km distant). Higher monthly rainfall values generally occur during the autumn-winter period (October–March), when 68% of the annual rainfall is recorded.

2.2. Instrumentation and Dataset

Monitoring the Corbeira headwater catchment started in 2004. Water level at the catchment outlet was measured using a water pressure sensor (registering data every minute and recording mean data every 10 min). The records were rendered as discharge through the level–discharge relationship, obtained by stream discharge measurements taken under different flow conditions.
Rainfall and temperature data series were used to compare with stream discharge, using climate data from the Mabegondo station, which is located near the study area and holds data from 1983.

2.3. Data Processing and Analysis

For this study, 15 successive years of hydro-meteorological data recorded from October 2004 to September 2019 were used. Taking into account the importance of low and high flows, in addition to the mean value, the following were extracted from the data series: the duration of low and high flows, i.e., number of days with discharge below 0.1 (Q10: mean daily discharge was exceeded 90% of the designated time) and 0.2 percentiles (Q20: mean daily discharge was exceeded 80% of the designated time) for low flows, and 0.8 (Q80: mean daily discharge was exceeded 20% of the designated time) and 0.9 (Q90: mean daily discharge was exceeded 10% of the designated time) for high flow [23] and its severity (discharge deficit), i.e., volume below Q10 and Q20 [32]. All parameters were calculated on a daily basis. Once these parameters were estimated, a trend analysis was performed with the non-parametric Mann–Kendall test and the Sen method, using the Makesens program developed by the Finnish Meteorological Office [33]. The presence of a monotonic increasing (positive) or decreasing (negative) trend was tested with the Mann–Kendall test and the slope of a linear trend (i.e., the magnitude) was estimated with the Sen method [34]. The Mann–Kendall test has been widely used in studies investigating trends in hydro-climatic series [35,36] due to it being more robust against outliers and being more powerful than other tests [37]. The analysis was applied on an annual, seasonal and monthly basis. For the seasonal trend, the year was divided in four seasons: autumn (October–December), winter (January–March), spring (April–June) and summer (July–September).
Changes in land use in the study period were also evaluated by analyzing differences in land use between 2000 and 2018, based on the Corine Land Cover for the years 2000 and 2018.

3. Results

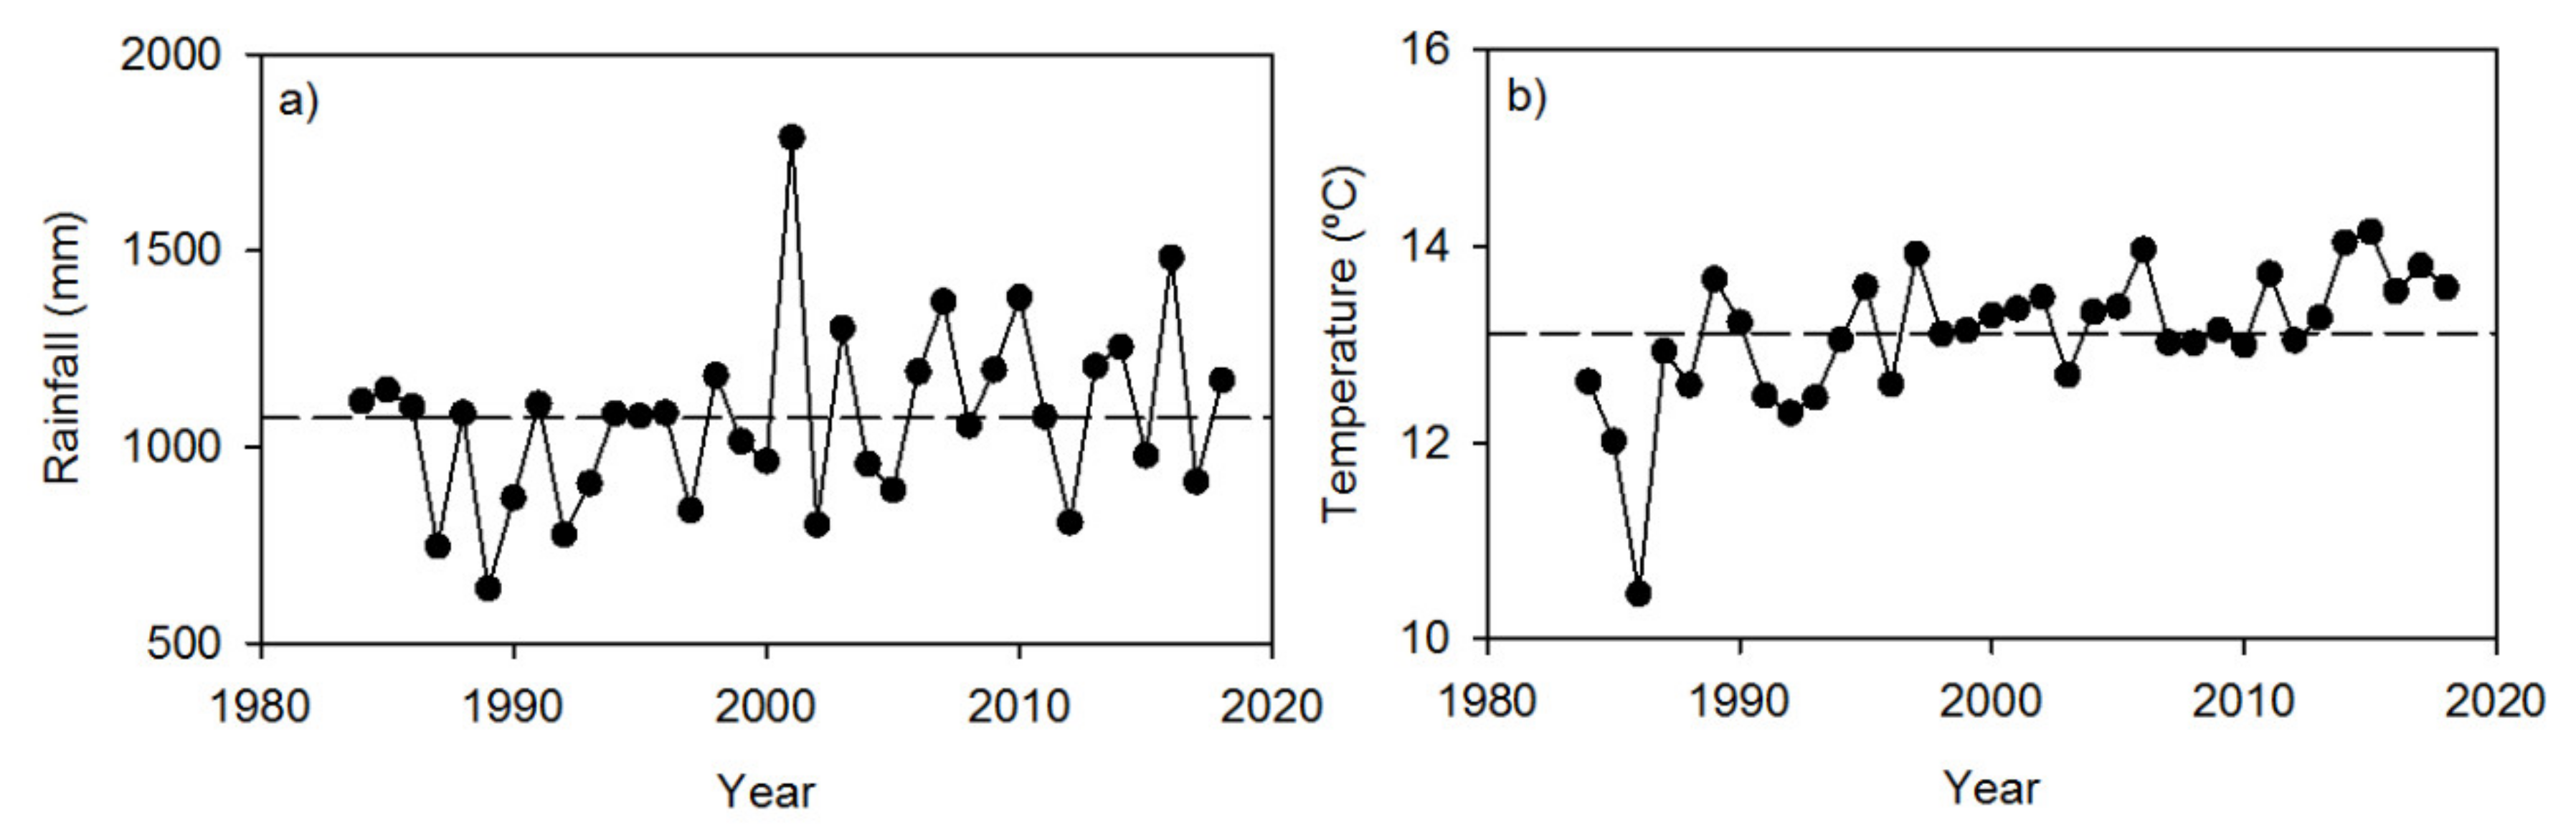
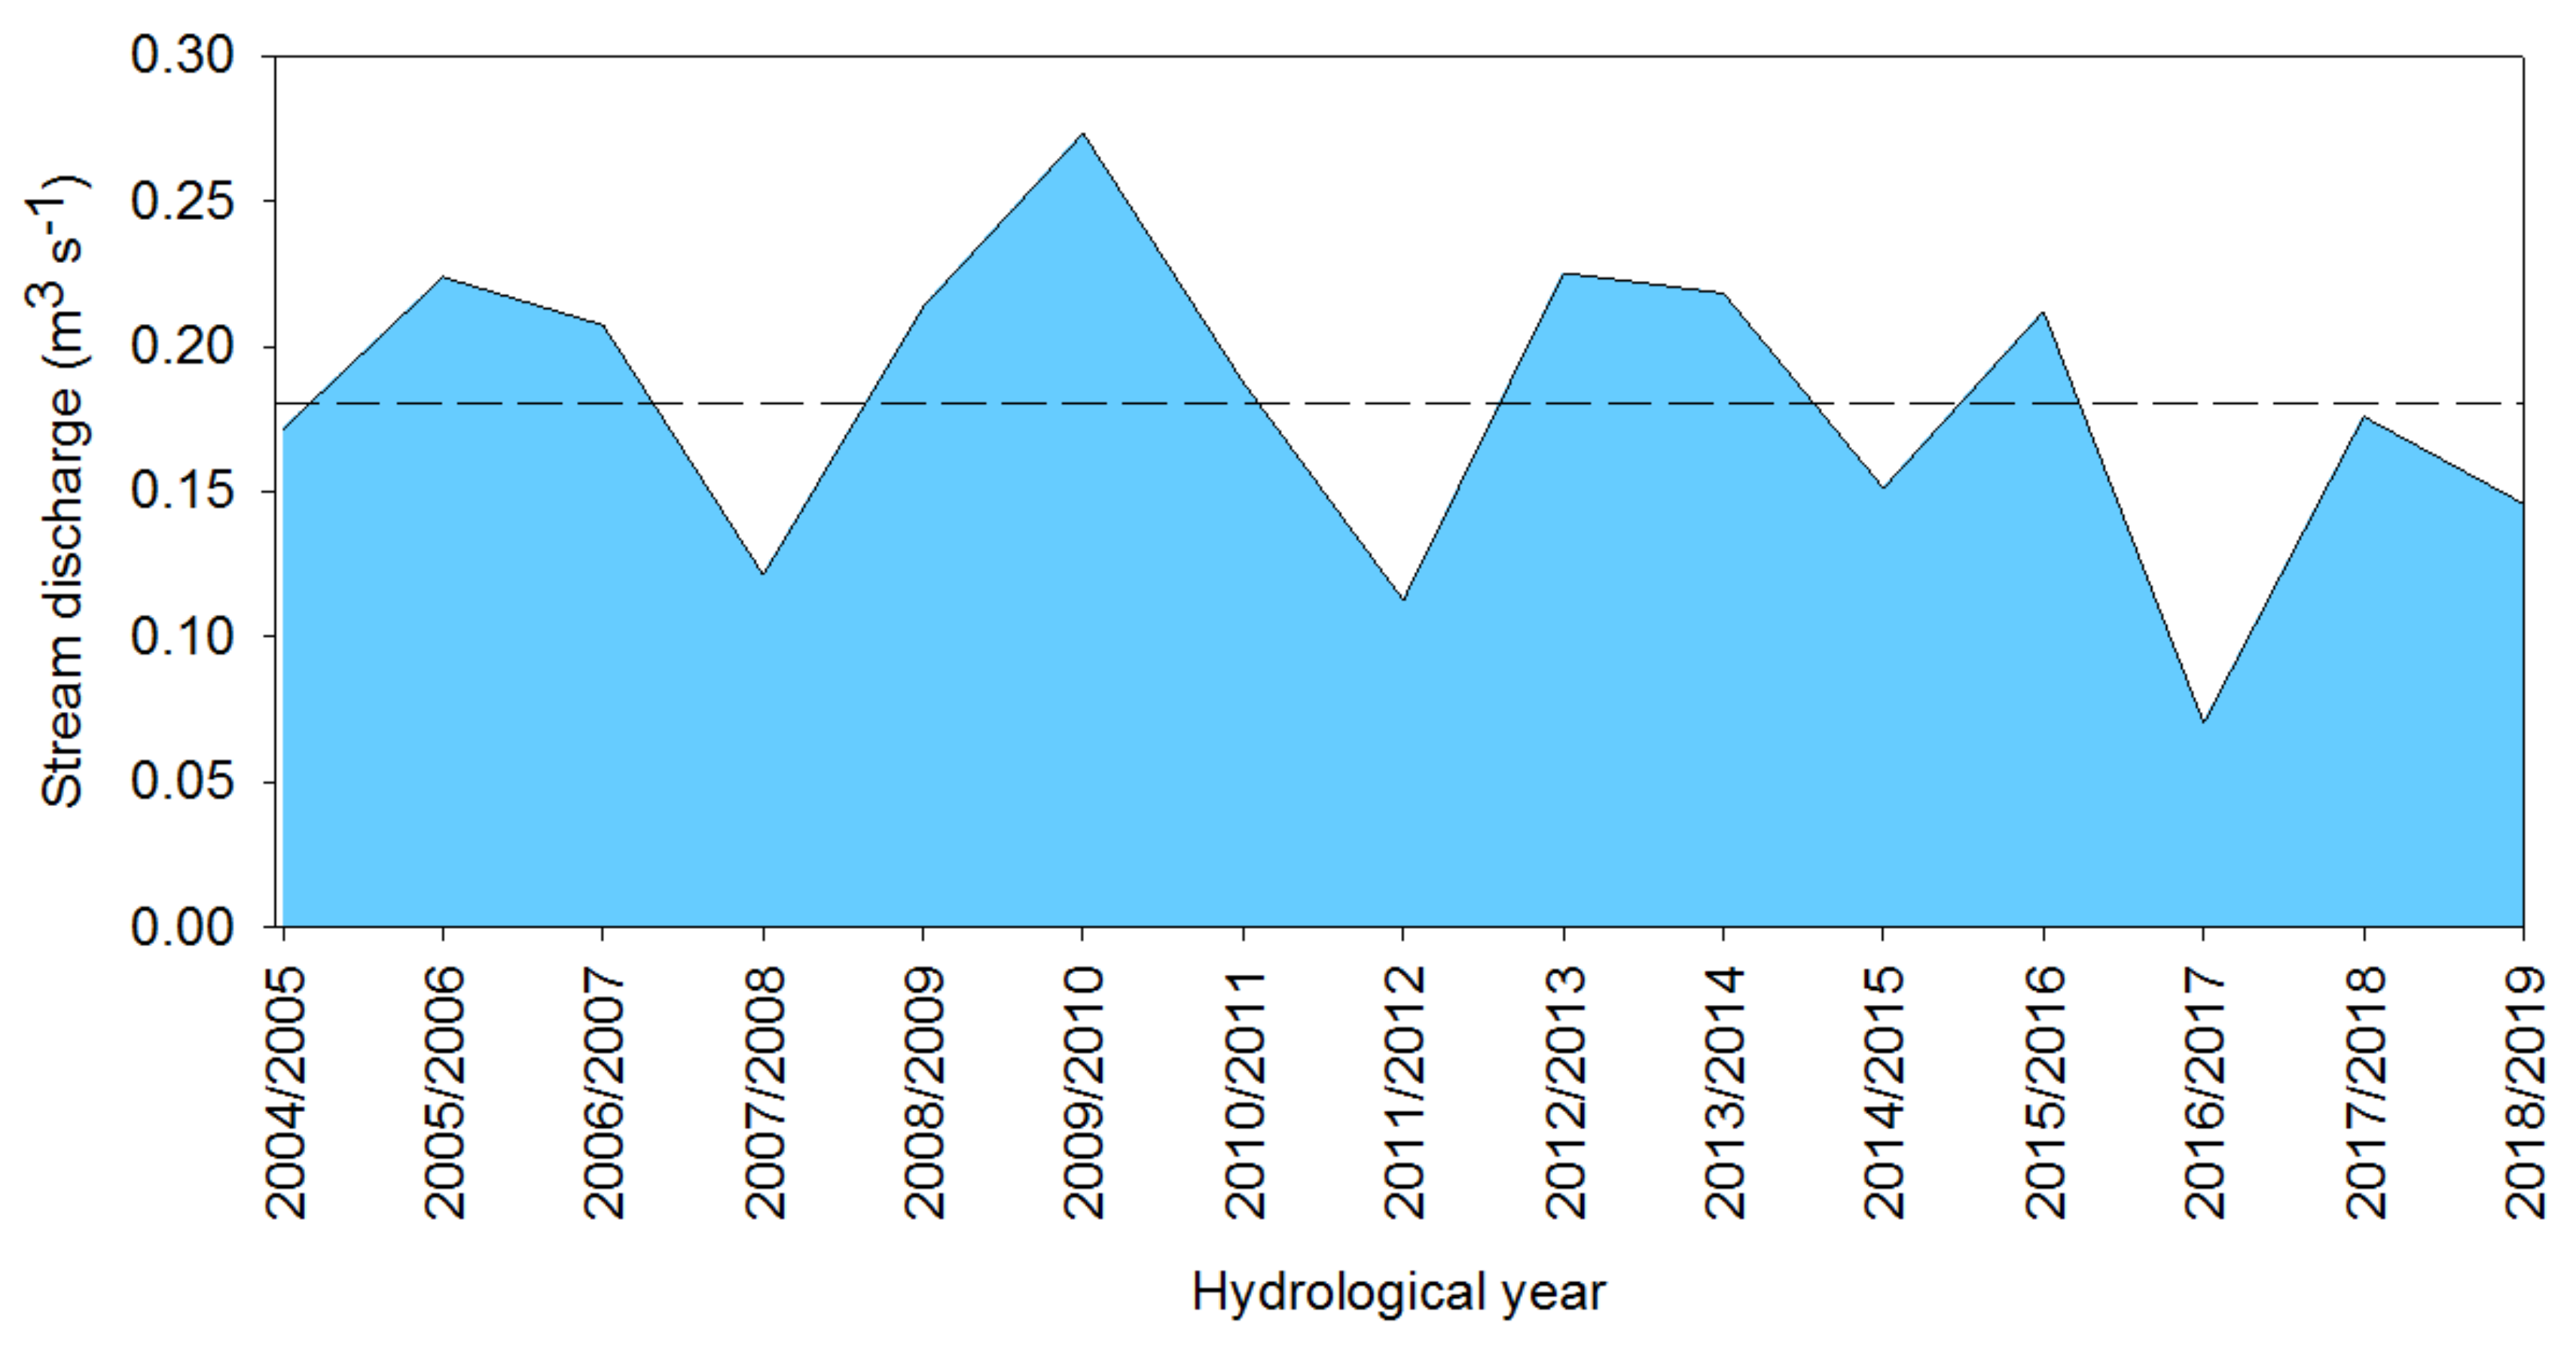
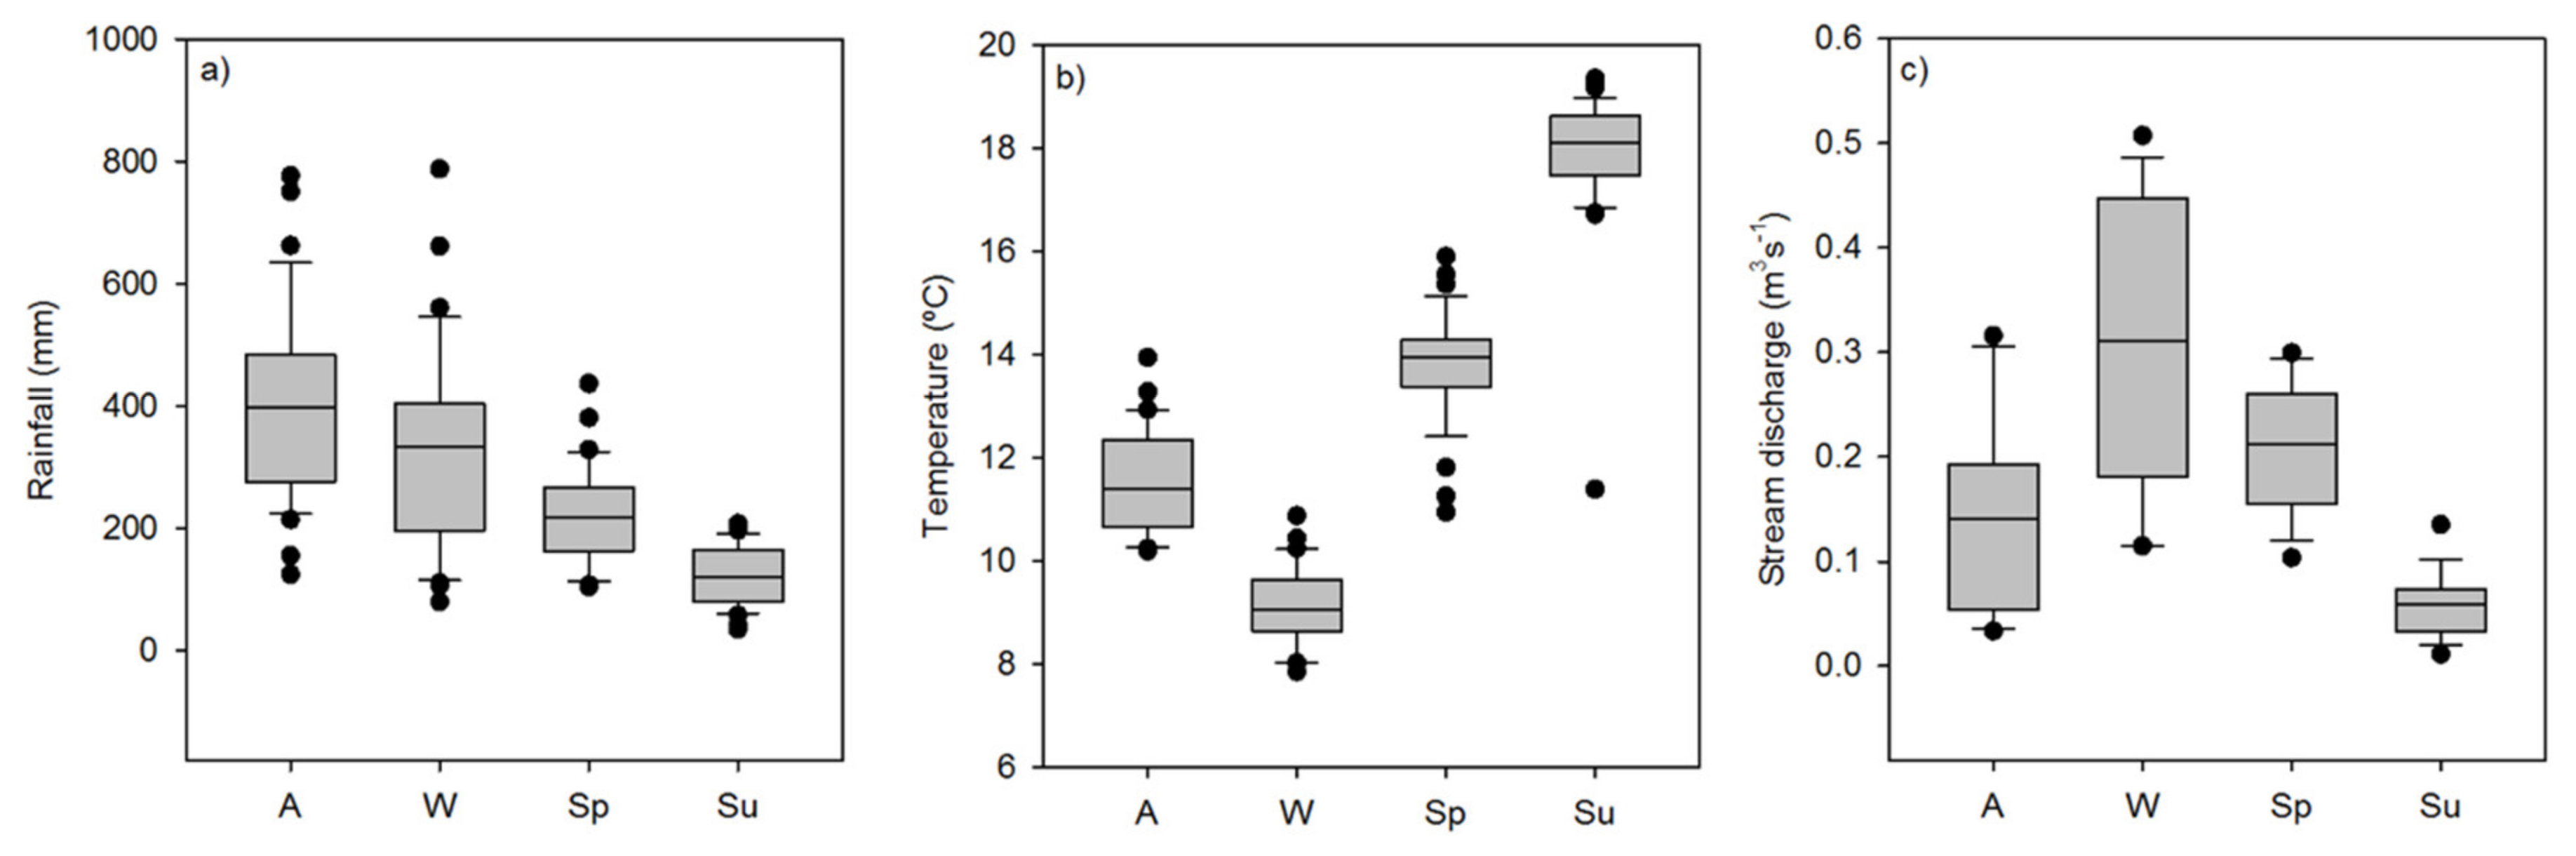
3.1. Statistical Characteristics of the Climatic Conditions and Streamflow

Figure 2 presents the annual rainfall and temperature during the study period, while the mean annual stream discharge between 2004 and 2019 is shown in Figure 3. High interannual variability can be observed, especially for rainfall and stream discharge. The annual streamflow in the study catchment varied from 0.08 m3 s−1 (2016/2017) to 0.273 m3 s−1 (2009/2010), with a mean annual stream discharge of 0.181 m3 s−1, a standard deviation of 0.05 m3 s−1 and a variation coefficient of 29%, which denotes a marked inter-annual fluctuation. Regarding seasonal patterns, streamflow was observed to be concentrated in the winter season (0.306 m3 s−1), whereas summer exhibited the lowest stream discharge (0.058 m3 s−1). However, winter did not return the highest value for every year (Figure 3). For example, in 2004/2005 and 2007/2008 hydrological years, spring exhibited the highest streamflow due to the reduced rainfall during the rainy season (587.6 and 731.63 mm for 2004/05 and 2007/08 respectively v.731.6 mm of the mean). In regard to the monthly distribution of stream discharge, there is an outstanding intra-annual variability (Figure 4), with mean discharge varying from 0.037 m3 s−1 (September) to 0.345 m3 s−1 (February). The months of February, March and April presented the largest discharge, while the highest mean monthly rainfall was registered in November, October and December. Previous studies in this area, point to streamflow being largely dependent on water storage in the soils, which together with the distribution of rainfall and evapotranspiration, are key variables controlling the hydrological response of the catchment [38,39].

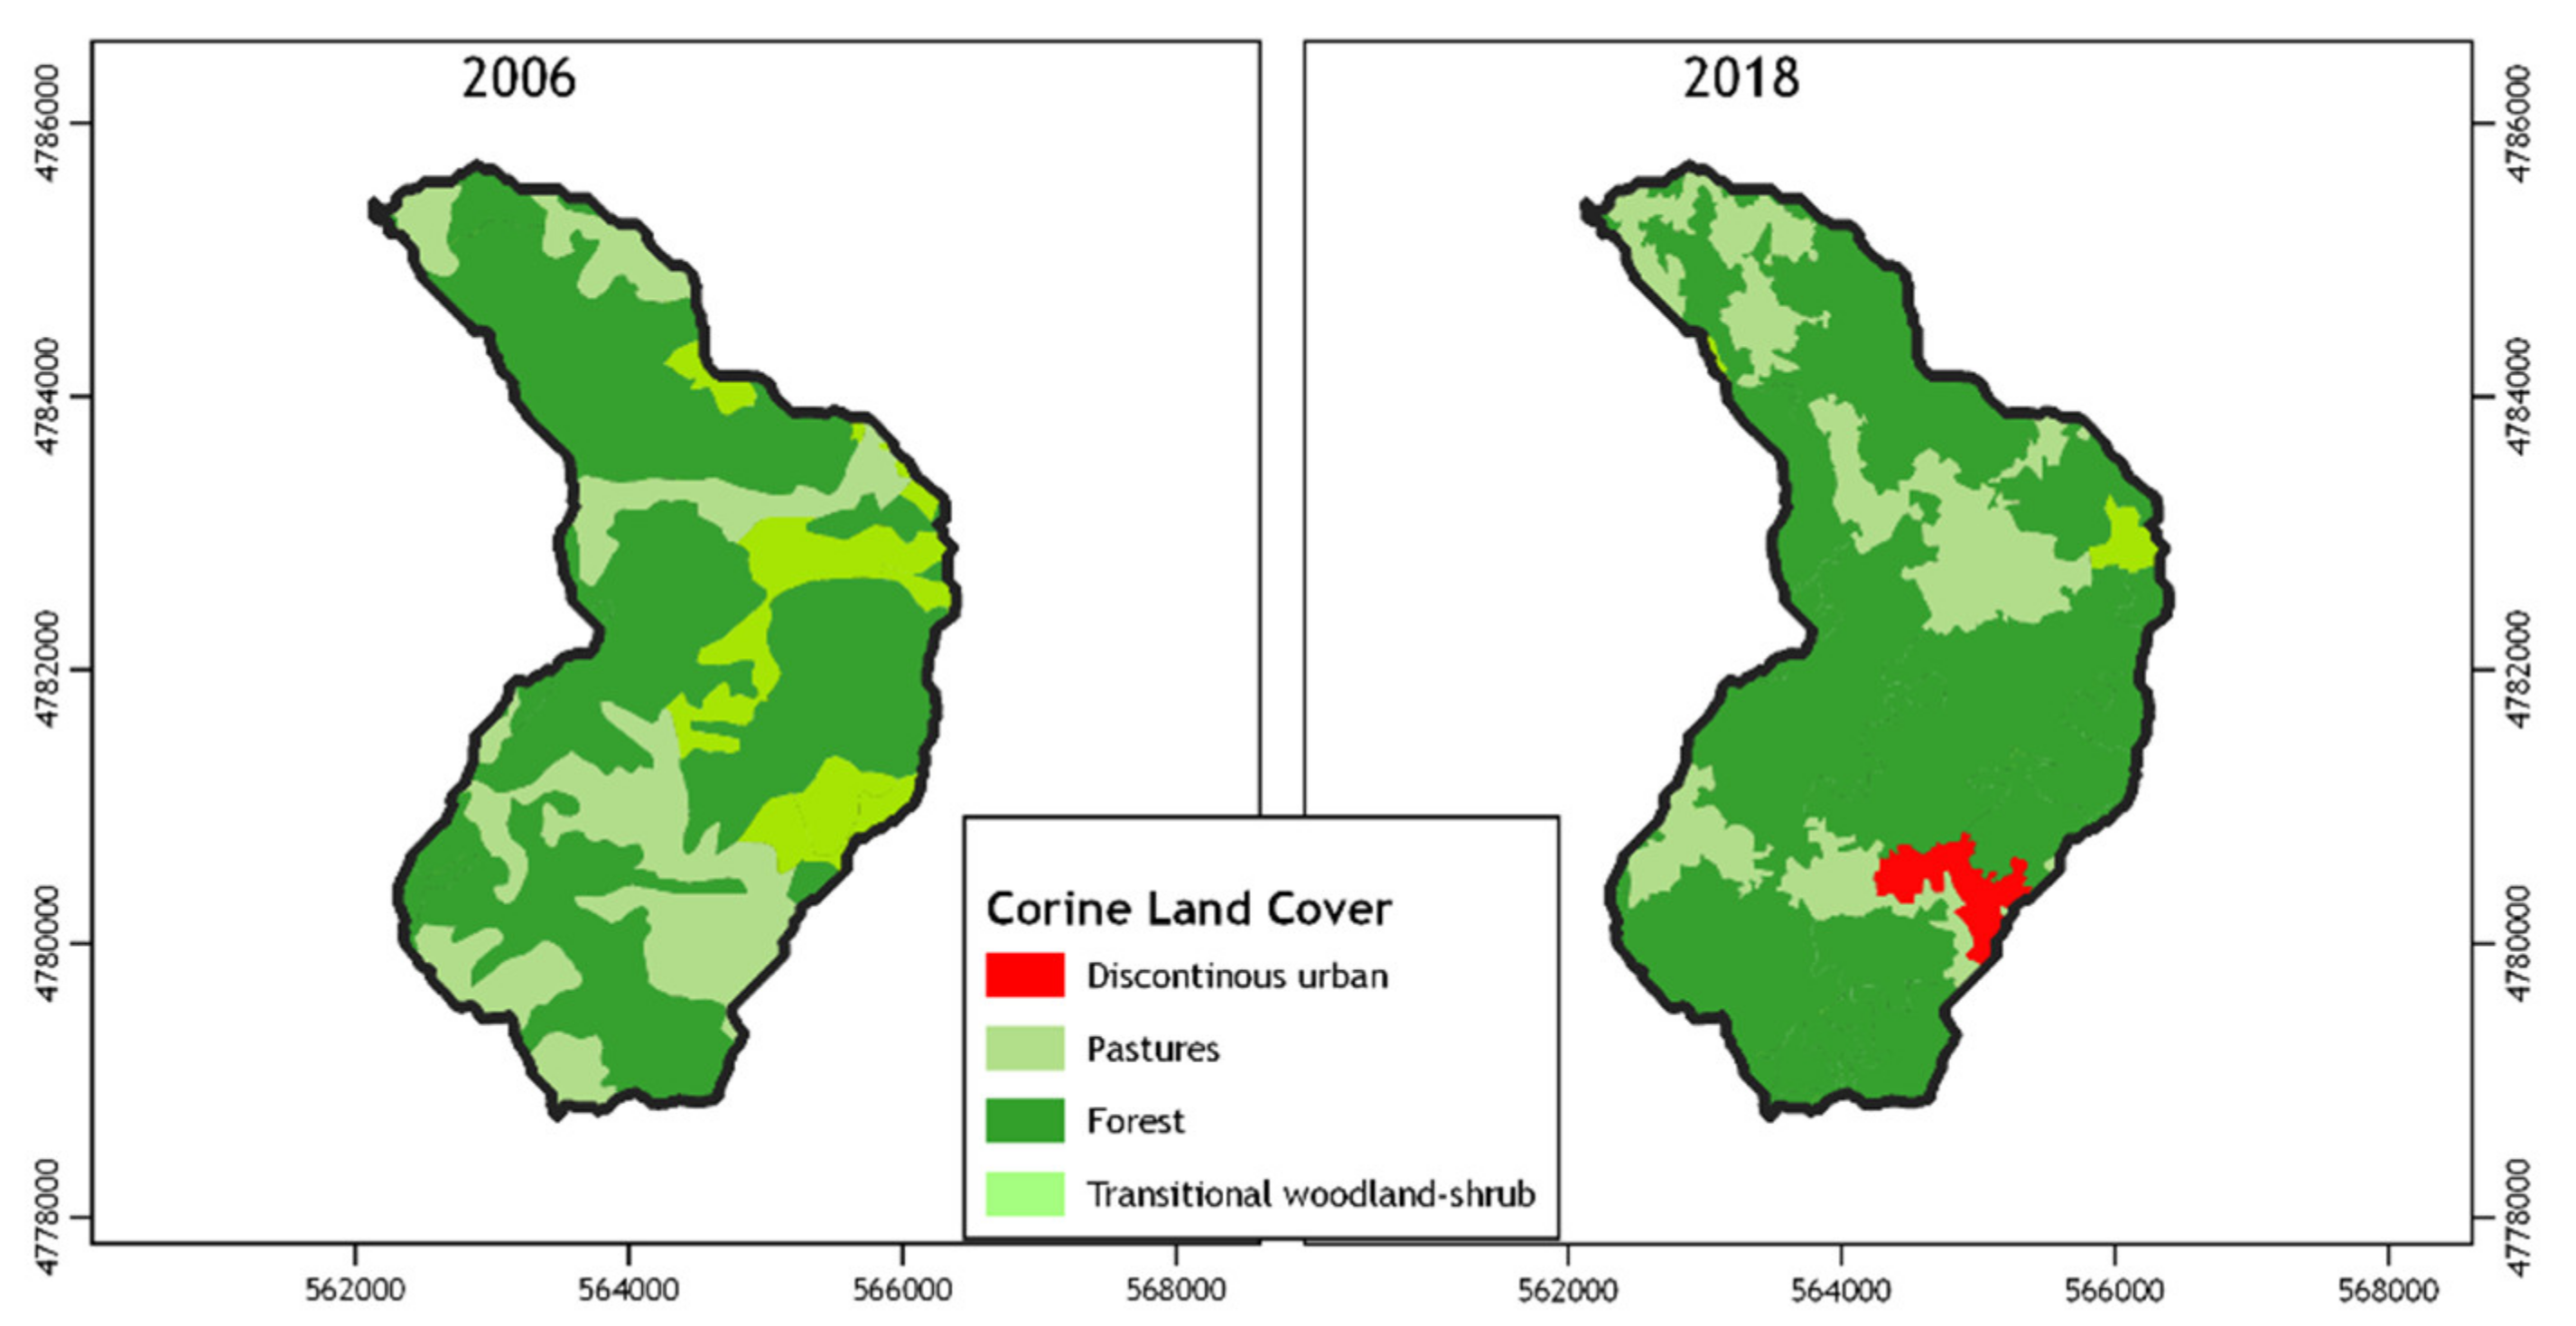
3.2. Land Use Changes

Figure 5 shows the main changes in land use in the Corbeira catchment based on Corine Land Cover. Forestry and agricultural land are the main land uses in the catchment. In the period between 2000 and 2018, a slight decrease was observed in the agricultural zone, whereas the forest area increased (about 3%). The findings from this study are in line with results from other studies indicating an expansion of forest due to the replacement of cultivated land by plantations, first with pine and from the 1960s, with eucalyptus [40,41]. In fact, the northwest of the Iberian Peninsula constitutes a representative area of the transformations of land-use systems in southern Europe [42], as it has undergone wide changes in the spatial distribution of land uses in recent decades, due to reduced traditional agricultural activity, rural abandonment and more plantations of fast-growing tree species.

3.3. Trend Analysis of Climatic Variables and Stream Discharge

The results for the Thiel–Sen/Mann–Kendall trend tests for rainfall and temperature are presented in Table 1, while the results for discharge are shown in Table 2. Upward trends were identified for rainfall and temperature data, with a very strong positive trend for temperature and annual results being significant at a 99% confidence level. This upward trend is closely related to the significant upward trend during summer. In contrast, the results for rainfall were not clear, and despite showing an upward trend signal, they did not prove to be significant (i.e., p-value > 0.1).
For the discharge data record, the results suggested a downward trend for annual discharge, although it was not found to be significant at a reliable confidence level (p-value > 0.1). However, when examining by season, a number of significant trends were found. Thus, a downward trend was detected in autumn, which was very clear in October, weaker and not significant in November and positive (upward) in December, although the test yielded results with a lower confidence level (p-value = 0.1). Summer also showed a downward trend due to those observed in September, August and July, although the trend in the latter month was weaker and not significant. Spring exhibited a downward trend, while results suggested an increase during winter. However, trends for these seasons were very weak and not statistically significant (Table 2).

3.4. Trend in Low and High Flows

Results of low and high flow trend analysis are displayed in Table 3. An upward trend for the low flow period was observed at different temporal scales, although some of these did not prove to be significant. If the seasonal scale is included, summer and autumn showed significant upward trends in the duration of the low flow period and the severity (volumetric deficit), due to the clear upward trend in the months of October, November, July, August and September. On the contrary, in winter and spring, there was no significant evidence at low flows.
Concerning the high flow, a downward trend in the annual duration of the high flow period was observed, although it did not prove to be significant (Table 3). A negative (downward) trend was also observed in autumn and spring, but was only significant for Q80 in autumn, which can be justified by the downward trend observed during October.

4. Discussion

The results show that discharge in the Corbeira catchment does not show a marked annual fluctuation. However, the intra-annual variability is much larger, with the maximum variability occurring in autumn.
With respect to trend analysis of climate variables, upward trends were found for the temperature at the annual and seasonal scale, as has been already reported in previous studies in the Iberian Peninsula [9,43]. In contrast, no significant trends were detected for rainfall on any time scale, similar to the results of Rodrigo and Trigo [29] for the La Coruña station (located near the study area), which showed positive (non-significant) trends for annual and autumn rainfall and negative for spring and summer. Similarly, and in the context of long-term evaluation of rainfall in Galicia, Lago et al. [28] pointed out the absence of a unidirectional trend in annual rainfall. However, at a seasonal scale, these authors indicated a possible change in distribution throughout the year, with wetter autumns and less humid winters, mainly due to the decrease in rainfall in February and springs and summers of sub-dry or dry trends. These facts have a heavy impact because more than two-thirds of the water demand takes place in the period between April and September, in which scarcely one-third of the total annual rainfall is registered. Furthermore, it must be noted that in the autumn-winter semester, the period with the highest water contribution, it is possible to record a marked rainfall deficit. An example would be the winter 2004-05 (169.4 mm in winter 2004-05 vs. 333.4 mean rainfall in winter).
With hydrological variables, the annual discharge trend test revealed that there was no significant trend for stream discharge. However, significant downward trends were observed for autumn and summer. In the present study, the observed trends cannot be explained by changes in rainfall, since Z values, although negative, were close to zero, indicating no trends. The study of low and high flows suggested upward trends in the duration of low flow and severity (volumetric deficit) due to the increase in the number of days with low flow in summer and autumn (Table 3). In contrast, the duration of the high flow period seemed to decrease, particularly during autumn. The longer low flow duration and severity found in our study are in line with the results from other studies in temperate humid catchments [24,27] indicating an extension of the low flow period during autumn, which resulted in a longer period of time with low stream discharge, as well as a temporary increase in the volumetric deficit. Given the length of data, it is difficult to say whether the increase of evaporative demand during these seasons, induced by higher temperatures, has caused the apparent trend. Several studies in the Iberian Peninsula have already reported a reduction in streamflow due to the increase in air temperatures [8,9,20]. For example, Morán-Tejeda [43] observed an increase in the number of days with low flow and a reduction in the frequency and magnitude of high flows in the Duero basin. These authors argued that this behavior is a consequence of raising temperatures by enhancing evapotranspiration, and changes in the land-cover, as a result of re-growth of vegetation, whose effects are more evident during the growth period (spring and summer), as it is associated with the highest demand for water from the soil, and a greater capacity for rainfall interception by the canopy [43]. Other authors have also associated re-vegetation and land-cover expansion in headwaters as a primary cause of decreasing stream discharge in the absence of rainfall trends.
The observed discharge trends in the Corbeira catchment and hence the Mero basin may have important implications for water management in the study area. The Abegondo-Cecebre reservoir, which is mainly fed by water from the Mero basin, was built in the mid-1970s to guarantee the availability of water for the city of A Coruña and its metropolitan area during drought periods and to reduce negative effects from floods. The decrease in discharge, as well as increase in the low flow period, enhance future risk and vulnerability especially in summer, which is characterized by the low flow. In recent years, there has been a substantial increase in the population in the area (from 250,000 to 450,000) representing a large rise in water demand. Moreover, tourism is growing in the city of A Coruña and its surroundings, especially in summer when the population may even double, which makes it necessary to satisfy an additional water demand at what is undoubtedly the least rainy time of year. In some cases, this causes the Abegondo-Cecebre reservoir to be insufficient if there has not been enough rain to fill it in the previous months, as occurred in 2010, triggering water restrictions and threatening the ecological environment, society and economy. This highlights the fact that alternative strategies for water management may come to the fore in low flow seasons (the most critical period for water management in the area) in order to reconcile the heavier demand for water for human activities with maintaining functioning riparian ecosystems, as it also has to be borne in mind that the reservoir is a Special Area of Conservation.

5. Summary and Final Remarks

An analysis of trends in annual and seasonal stream discharge (mean, low and high flows) was conducted in the headwaters of the Mero river, a near-natural system representative of the climate and land use characteristics of the northwestern Iberian Peninsula catchments. For this, both the non-parametric Mann–Kendall test and the Sen methods were applied.
The study did not detect statistically significant trends in annual stream discharge. However, significant downward trends in mean discharge were observed for autumn and summer. In addition, a significant upward trend in the number of days with low flow was particularly evident in spring and summer. Additionally, a falling trend in the high flows was observed in autumn. On the contrary, rainfall showed a positive pattern, although it was not significant. The different behavior shown by rainfall and discharge may be explained by the reduction of water resources associated with the increase in temperature in the study area, although this must be interpreted with caution, given the absence of long-term measurements.

Author Contributions

Conceptualization, M.L.R.-B.; Formal Analysis, M.L.R.-B.; Investigation, M.L.R.-B., M.M. Taboada-Castro, M.T.T.-C.; Data Curation, M.L.R.-B.; Writing—Original Draft Preparation, M.L.R.-B.; Writing—Review & Editing, M.M.T.-C., M.T.T.-C.; Supervision, M.L.R.-B., M.M.T.-C., M.T.T.-C.; Funding Acquisition, M.L.R.-B., M.M.T.-C., M.T.T.-C. All authors have read and agreed to the published version of the manuscript.

Funding

This research is a contribution to the projects 10MDS103031 of the Xunta de Galicia and CGL2014-56907-R funded by the Spanish Ministry of Economy and Competitiveness (MINECO). M.L. Rodriguez-Blanco has been awarded a post-doctoral research contract (Juan de la Cierva Programme), which was funded by the MINECO. We thank the reviewers for their valuable suggestions that helped to improve the manuscript substantially.

Conflicts of Interest

The authors declare no conflict of interest.

References

  1. Villarini, G.; Smith, J.A.; Serinaldi, F.; Ntelekos, A.A. Analyses of seasonal and annual maximum daily discharge records for central Europe. J. Hydrol. 2011, 399, 299–312. [Google Scholar] [CrossRef]
  2. Svensson, C.; Kundzewicz, W.Z.; Maurer, T. Trend detection in river flow series: 2. Flood and low-flow index series. Hydrol. Sci. J. 2005, 50, 1–824. [Google Scholar] [CrossRef] [Green Version]
  3. Wagener, T.; Wheater, H.; Gupta, H.V. Rainfall-Runoff Modelling in Gauged and Ungauged Catchments; World Scientific: Singapore, 2004. [Google Scholar]
  4. Moradkhani, H.; Sorooshian, S. General Review of Rainfall-Runoff Modeling: Model Calibration, Data Assimilation, and Uncertainty Analysis. In Water Science and Technology Library; Springer: Berlin/Heidelberg, Germany, 2008; Volume 63, pp. 1–24. [Google Scholar]
  5. De Paola, F.; Giugni, M.; Pugliese, F.; Annis, A.; Nardi, F. GEV Parameter Estimation and Stationary vs. Non-Stationary Analysis of Extreme Rainfall in African Test Cities. Hydrology 2018, 5, 28. [Google Scholar] [CrossRef] [Green Version]
  6. Hannaford, J.; Marsh, T.J. High-flow and flood trends in a network of undisturbed catchments in the UK. Int. J. Clim. 2008, 28, 1325–1338. [Google Scholar] [CrossRef] [Green Version]
  7. Bertola, M.; Viglione, A.; Lun, D.; Hall, J.; Blöschl, G. Flood trends in Europe: Are changes in small and big floods different? Hydrol. Earth Syst. Sci. 2020, 24, 1805–1822. [Google Scholar] [CrossRef] [Green Version]
  8. Stahl, K.; Hisdal, H.; Hannaford, J.; Tallaksen, L.M.; Van Lanen, H.A.J.; Sauquet, E.; DeMuth, S.; Fendekova, M.; Jódar, J. Streamflow trends in Europe: Evidence from a dataset of near-natural catchments. Hydrol. Earth Syst. Sci. 2010, 14, 2367–2382. [Google Scholar] [CrossRef] [Green Version]
  9. Morán-Tejeda, E.; Lorenzo-Lacruz, J.; López-Moreno, J.I.; Rahman, K.; Beniston, M. Streamflow timing of mountain rivers in Spain: Recent changes and future projections. J. Hydrol. 2014, 517, 1114–1127. [Google Scholar] [CrossRef] [Green Version]
  10. Masseroni, D.; Camicis, S.; Cislaghi, A.; Vacchiano, G.; Massari, C.; Brocca, L. 65-year change of annual streamflow volumes across Europe with a focus on the Mediterranean basin. Hydrol. Earth Syst. Sci. 2020, 1–16. [Google Scholar] [CrossRef] [Green Version]
  11. Bermúdez, M.; Neal, J.; Bates, P.; Coxon, G.; Freer, J.E.; Cea, L.; Puertas, J. Quantifying local rainfall dynamics and uncertain boundary conditions into a nested regional-local flood modeling system. Water Resour. Res. 2017, 53, 2770–2785. [Google Scholar] [CrossRef] [Green Version]
  12. Annis, A.; Nardi, F.; Volpi, E.; Fiori, A. Quantifying the relative impact of hydrological and hydraulic modelling parameterizations on uncertainty of inundation maps. Hydrol. Sci. J. 2020, 65, 507–523. [Google Scholar] [CrossRef]
  13. LeRoy Poff, N.; Allan, J.D.; Bain, M.B.; Karr, J.R.; Prestegaard, K.L.; Richter, B.D.; Sparks, R.E.; Stromberg, J.C. The natural flow regime: A paradigm for river conservation and restoration. BioScience 1997, 47, 769–784. [Google Scholar] [CrossRef]
  14. Chaves, M.L.; Costa, J.L.; Chainho, P.; Costa, M.J.; Prat, N. Selection and validation of reference sites in small river basins. Hydrobiology 2006, 573, 133–154. [Google Scholar] [CrossRef]
  15. Richter, B.D.; Baumgartner, J.V.; Powell, J.; Braun, D.P. A Method for Assessing Hydrologic Alteration within Ecosystems. Conserv. Biol. 1996, 10, 1163–1174. [Google Scholar] [CrossRef] [Green Version]
  16. Grill, G.; Lehner, B.; Thieme, M.; Geenen, B.; Tickner, D.; Antonelli, F.; Babu, S.; Borrelli, P.; Cheng, L.; Crochetiere, H.; et al. Mapping the world’s free-flowing rivers. Nature 2019, 569, 215–221. [Google Scholar] [CrossRef] [PubMed]
  17. Batalla, R.J.; Gómez, C.M.G.; Kondolf, G. Reservoir-induced hydrological changes in the Ebro River basin (NE Spain). J. Hydrol. 2004, 290, 117–136. [Google Scholar] [CrossRef]
  18. Nardi, F.; Morrison, R.R.; Annis, A.; Grantham, T.E. Hydrologic scaling for hydrogeomorphic floodplain mapping: Insights into human-induced floodplain disconnectivity. River Res. Appl. 2018, 34, 675–685. [Google Scholar] [CrossRef]
  19. Scheel, K.; Morrison, R.R.; Annis, A.; Nardi, F. Understanding the Large-Scale Influence of Levees on Floodplain Connectivity Using a Hydrogeomorphic Approach. JAWRA J. Am. Water Resour. Assoc. 2019, 55, 413–429. [Google Scholar] [CrossRef]
  20. Martínez-Fernández, J.; Sánchez, N.; Herrero-Jiménez, C.M. Recent trends in rivers near-natural flow regime: The case of the river headwaters in Spain. Prog. Phys. Geogr. 2013, 37, 685–700. [Google Scholar] [CrossRef]
  21. Buendia, C.; Bussi, G.; Tuset, J.; Vericat, D.; Sabater, S.; Palau, A.; Batalla, R.J. Effects of afforestation on runoff and sediment load in an upland Mediterranean catchment. Sci. Total. Environ. 2016, 540, 144–157. [Google Scholar] [CrossRef]
  22. Lorenzo-Lacruz, J.; Serrano, S.M.V.; López-Moreno, J.I.; Morán-Tejeda, E.; Zabalza, J. Recent trends in Iberian streamflows (1945–2005). J. Hydrol. 2012. [Google Scholar] [CrossRef]
  23. Wilson, D.; Hisdal, H.; Lawrence, D. Has streamflow changed in the Nordic countries?—Recent trends and comparisons to hydrological projections. J. Hydrol. 2010, 394, 334–346. [Google Scholar] [CrossRef]
  24. Zabaleta, A.; Morales, T.; Meaurio, M.; Gorria, C.; Antigüedad, I. Regional Hydrological Signs for Climate Change in Southern Europe (Basque Country). In Proceedings of the International Conference on Water, Climate and Environment (Balwois), Ohrid, Republic of Macedonia, 28 May–2 June 2012. [Google Scholar]
  25. Lorenzo-Lacruz, J.; Serrano, S.M.V.; López-Moreno, J.I.; Beguería, S.; García-Ruiz, J.M.; Cuadrat, J.M. The impact of droughts and water management on various hydrological systems in the headwaters of the Tagus River (central Spain). J. Hydrol. 2010, 386, 13–26. [Google Scholar] [CrossRef] [Green Version]
  26. Morán-Tejeda, E.; López-Moreno, J.I.; Barbancho, A.C.; Vicente-Serrano, S.M. River regimes and recent hydrological changes in the Duero basin (Spain). J. Hydrol. 2011, 404, 241–258. [Google Scholar] [CrossRef]
  27. Hawtree, D.; Nunes, J.P.; Keizer, J.J.; Jacinto, R.; Santos, J.; Rial-Rivas, M.E.; Karine-Boulet, A.; Tavares-Wahren, F.; Feger, K.-H. Time series analysis of the long-term hydrologic impacts of afforestation in the Águeda watershed of north-central Portugal. Hydrol. Earth Syst. Sci. 2015, 19, 3033–3045. [Google Scholar] [CrossRef] [Green Version]
  28. Lago, A.; Lage, A.; Cruz, R.; Pérez-Muñurizi, V. Estudo das varia- cións de temperatura e precipitación en Galicia nos últimos trinta anos no contexto do cambio climático global. Rev. Real Acad. Galega Cienc. 2006, 25, 27–58. [Google Scholar]
  29. Rodrigo, F.S.; Trigo, R.M. Trends in daily rainfall in the Iberian Peninsula from 1951 to 2002. Int. J. Clim. 2007, 27, 513–529. [Google Scholar] [CrossRef]
  30. Instituto Tecnologico Geominero de Espana (IGME). Mapa GeoloÅLgico de Espana, 1:50,000; Hoja 45: Betanzos, Spain, 1981. [Google Scholar]
  31. IUSS Working Group WRB. World Reference Base for Soil Resources 2014, Update 2015: International Soil Classification System for Naming Soils and Creating Legends for Soil Maps; World Soil Resources Reports No. 106; FAO: Rome, Italy, 2015. [Google Scholar]
  32. Ouarda, T.B.M.J.; Charron, C.; St-Hilaire, A. Statistical Models and the Estimation of Low Flows. Can. Water Resour. J. Rev. Can. Ressour. Hydrol. 2008, 33, 195–206. [Google Scholar] [CrossRef] [Green Version]
  33. Salmi, T.; Määttä, A.; Anttila, P.; Ruoho-Airola, T.; Amnell, T. Detecting Trends of Annual Values of Atmospheric Pollutants by the Mann-Kendall Test and Sen’s Slope Estimates—The Excel Template Application MAKESEN; Publication on Air Quality No 31; Air Quality Research; Finnish Meteorological Institute: Helsinki, Finland, 2002. [Google Scholar]
  34. Gilbert, R.O. Statistical Methods for Environmental Pollution Monitoring; John Wiley & Sons: Hoboken, NJ, USA, 1987. [Google Scholar]
  35. Fathian, F.; Dehghan, Z.; Bazrkar, M.H.; Eslamian, S. Trends in hydrological and climatic variables affected by four variations of the Mann-Kendall approach in Urmia Lake basin, Iran. Hydrol. Sci. J. 2016, 61, 1–13. [Google Scholar] [CrossRef] [Green Version]
  36. Forootan, E. Analysis of trends of hydrologic and climatic variables. Soil Water Res. 2019, 14, 163–171. [Google Scholar] [CrossRef] [Green Version]
  37. Kundzewicz, Z.W.; Graczyk, D.; Maurer, T.; Pińskwar, I.; Radziejewski, M.; Svensson, C.; Szwed, M. Trend detection in river flow series: 1. Annual maximum flow/Détection de tendance dans des séries de débit fluvial: 1. Débit maximum annuel. Hydrol. Sci. J. 2005, 50, 797–810. [Google Scholar] [CrossRef]
  38. Palleiro, L.; Rodríguez-Blanco, M.; Taboada-Castro, M.M.; Taboada-Castro, M.T. Hydrological response of a humid agroforestry catchment at different time scales. Hydrol. Process. 2013, 28, 1677–1688. [Google Scholar] [CrossRef]
  39. Rodríguez-Blanco, M.; Taboada-Castro, M. An overview of patterns and dynamics of suspended sediment transport in an agroforest headwater system in humid climate: Results from a long-term monitoring. Sci. Total. Environ. 2019, 648, 33–43. [Google Scholar] [CrossRef] [PubMed]
  40. Jones, J.; Creed, I.F.; Hatcher, K.L.; Warren, R.J.; Adams, M.B.; Benson, M.H.; Boose, E.; Brown, W.A.; Campbell, J.L.; Covich, A.; et al. Ecosystem Processes and Human Influences Regulate Streamflow Response to Climate Change at Long-Term Ecological Research Sites. Bioscience 2012, 62, 390–404. [Google Scholar] [CrossRef] [Green Version]
  41. Moreira, F.; Rego, F.C.; Ferreira, P.G. Temporal (1958–1995) pattern of change in a cultural landscape of northwestern Portugal: Implications for fire occurrence. Landsc. Ecol. 2001, 16, 557–567. [Google Scholar] [CrossRef]
  42. Fuchs, R.; Herold, M.; Verburg, P.H.; Clevers, J.G.; Eberle, J. Gross changes in reconstructions of historic land cover/use for Europe between 1900 and 2010. Glob. Chang. Biol. 2014, 21, 299–313. [Google Scholar] [CrossRef] [PubMed]
  43. Del Río, S.; Herrero, L.; Pinto-Gomes, C.; Penas, Á. Spatial analysis of mean temperature trends in Spain over the period 1961–2006. Glob. Planet. Chang. 2011, 78, 65–75. [Google Scholar] [CrossRef] [Green Version]
Figure 1. Geographic location and main types of land use within the headwater of the Corbeira catchment.
Hydrology 07 00097 g001
Figure 2. Annual series for (a) rainfall and (b) temperature. Horizontal dotted line indicates the long-term mean for each variable.
Hydrology 07 00097 g002
Figure 3. Variations in stream discharge in Corbeira catchment (2004/2005–2018/2019). Horizontal dotted line indicates the mean for the study period.
Hydrology 07 00097 g003
Figure 4. Boxplot of seasonal distribution of (a) rainfall, (b) temperature and (c) discharge in Corbeira catchment.
Hydrology 07 00097 g004
Figure 5. Land-use changes in the Corbeira catchment between 2000 and 2018.
Hydrology 07 00097 g005
Table 1. Statistics (Z of the Mann–Kendall Test and Q of the Sen’s Slope Estimator) for rainfall and temperature trend analysis.
RainfallTemperature
Mann–Kendall TrendSen’s Slope EstimateMann–Kendall TrendSen’s Slope Estimate
Test ZSignificanceQTest ZSignificanceQ
Annual1.48 5.2423.69***0.037
Autumn0.61 1.9891.35 0.027
Winter1.43 3.6881.79+0.027
Spring−0.15 −0.1983.81***0.055
Summer−0.25 −0.2082.60**0.036
October0.69 0.8731.87+−0.017
November1.40 2.2190.31 0.009
December−1.08 −0.9800.28 0.007
January0.67 0.8842.10*0.048
February1.38 1.4530.11 0.003
March1.35 1.1571.96+0.027
April0.01 0.0172.33*0.061
May−0.04 −0.0422.16*0.048
June0.48 0.2573.29***0.068
July0.71 0.1642.06*0.040
August1.20 0.3722.13*0.033
September−1.27 −0.9021.05 0.029
** test is significant at p < 0.001; * test is significant at p < 0.05; + test is significant at p < 0.1.
Table 2. Statistics (Z of the Mann–Kendall Test and Q of the Sen’s Slope Estimator) for stream discharge trend analysis.
Mann–Kendall TrendSen’s Slope Estimate
Test ZSignificanceQ
Annual−1.09 −0.004
Autumn−2.28*−0.011
Winter0.20 0.002
Spring−0.49 −0.003
Summer−2.67**−0.003
October−2.57*−0.008
November−1.19 −0009
December1.68+−0.020
January0.00 −0.001
February0.79 0.011
March0.20 0.003
April−0.49 −0.005
May−1.09 −0.005
June−1.29 −0.005
July−1.39 −0.004
August−2.28*−0.003
September−2.67**−0.004
** test is significant at p < 0.001; * test is significant at p < 0.05; + test is significant at p < 0.1.
Table 3. Statistics (Z of the Mann–Kendall Test and Q of the Sen’s Slope Estimator) for low and high flow trend analysis.
Mann–Kendall TrendSen’s Slope Estimate
Test ZSignificanceQ
AnnualQ102.79**6.875
Q203.07**8.429
Severity (Q10)2.90**9.379
Severity (Q20)1.48**0.011
Q80−0.84 −1.000
Q90−0.10 −0.333
AutumnQ102.59**1.00
Q202.38*3.00
Q80−1.50 −1.444
Q90−1.89+−0.250
WinterQ101.04 0.000
Q200.17 0.000
Q800.25 1.000
Q900.40 0.222
SpringQ201.04 0.000
Q80−1.19 −0.667
Q90−0.25 0.000
SummerQ102.24*4.200
Q202.31*4.200
OctoberQ102.88**0.875
Q202.38*1.556
Q80−2.38*0.000
NovemberQ101.49 0.000
Q201.80+0.000
Q80−1.88+−0.727
Q90−1.64 0.000
DecemberQ201.22 0.000
Q80−1.72+−0.889
Q90−1.69+0.000
JanuaryQ200.17 0.000
Q800.80 0.182
Q900.68 0.000
FebruaryQ800.75 0.400
Q900.65 0.000
MarchQ80−0.05 0.000
AprilQ80−0.15 −0.125
Q90−0.10 0.000
MayQ80−0.65 0.000
JuneQ80−1.00 0.000
JulyQ101.14 0.000
Q201.94+0.571
AugustQ102.52*1.385
Q202.40*1.333
SeptemberQ102.68**2.231
Q202.35*1.000
** test is significant at p < 0.001; * test is significant at p < 0.05; + test is significant at p < 0.1.
Publisher’s Note: MDPI stays neutral with regard to jurisdictional claims in published maps and institutional affiliations.

