
Landslide Susceptibility Analysis: A Logistic Regression Model Case Study in Coonoor, India


1
Centre for Advanced Research on Environment, School of Civil Engineering, SASTRA Deemed to be University, Thanjavur 613401, India
2
Biological Systems Engineering Department, Virginia Tech, Blacksburg, VA 24061, USA
*
Author to whom correspondence should be addressed.
Hydrology 2021, 8(1), 41; https://0-doi-org.brum.beds.ac.uk/10.3390/hydrology8010041
Submission received: 29 January 2021
/
Revised: 26 February 2021
/
Accepted: 3 March 2021
/
Published: 5 March 2021
(This article belongs to the Special Issue Socio-Hydrology: The New Paradigm in Resilient Water Management)
Abstract
:Landslides are a common geologic hazard that disrupts the social and economic balance of the affected society. Therefore, identifying zones prone to landslides is necessary for safe living and the minimal disruption of economic activities in the event of the hazard. The factors causing landslides are often a function of the local geo-environmental set-up and need a region-specific study. This study evaluates the site characteristics primarily altered by anthropogenic activities to understand and identify the various factors causing landslides in Coonoor Taluk of Uthagamandalam District in Tamil Nadu, India. Studies on landslide susceptibility show that slope gradient, aspect, relative relief, topographic wetness index, soil type, and land use of the region influence slope instability. Rainfall characteristics have also played a significant role in causing landslides. Logistic Regression, a popular statistical tool used for predictive analysis, is employed to assess the various selected factors’ impact on landslide susceptibility. The factors are weighted and combined in a GIS platform to develop the region’s landslide susceptibility map. This region has a direct link between natural physical systems, hydrology, and humans from the socio-hydrological perspective. The landslide susceptibility map derived using the watershed’s physical and environmental conditions offers the best tool for planning the developmental activities and prioritizing areas for mitigation activities in the region. The Coonoor region’s tourism and agriculture sectors can significantly benefit from identifying zones prone to landslides for their economic stability and growth.
1. Introduction
Landslides are a common geologic hazard in the hill and mountain terrains of the world. The landslides impact the society and livelihoods of the affected communities. Landslides can result in loss of lives and cause potential damage to infrastructure facilities, agricultural land, public and private assets. UNESCO has also recognized landslides as a significant geohazard globally and attributes 14% of total casualties from various natural hazards like earthquakes, floods, etc. to landslides [1,2]. Global landslides cause nearly 1000 fatalities and a loss of approximately 4 million USD in a year [3]. They can impede the region’s economic growth and development and hamper the region’s social set-up by isolating the hill communities for long periods from the rest of the surrounding areas. Landslides also lead to environmental degradation by the removal of soil and tree cover. They have significant economic value and affect the environment adversely and hence are a severe concern in mountainous terrains. Assessment of the regions prone to landslides is therefore mandatory for any developmental, land use, and mitigation planning in the hill and mountain communities.
Landslides have profound social and economic impacts. Landslides affect public and private properties and cause both direct and indirect losses that can have either consequential or inconsequential economic impacts [4]. Linear infrastructure like roads or railroads are often severely damaged by landslides causing disruption to normal traffic or completely cutting off the access to the affected areas. This directly affects the tourism industry in the region. The direct economic impact which is consequential involves the repair of damaged infrastructure which includes property and installations or its replacement and clean-up activities. Fatal and non-fatal injuries or accident costs caused by landslide also fall under this category. In cases of remote hamlets or villages, whose economy depends on transporting their raw material or manufactured goods using the roads affected by landslides suffer economic losses due to traffic disruption caused by landslides, though indirect losses are consequential [4]. Moreover, the decrease in tourist activity due to landslides or even landslide vulnerability is an indirect consequential loss. Indirect losses also include reduced real estate values, devaluation of tax revenues, loss of industrial/agriculture revenue, loss of productivity of labor force due to injury, death, or trauma caused by landslides, and the capital spent on prevention/mitigation measures [5]. Landslides can significantly reduce the revenue of the affected regions causing a social set-back [6]. They impose severe constraints to the affected population in terms of economic loss and social set-back [7]. This significant impact of landslides on the socio-economic system of the affected region mandates a thorough understanding of factors causing landslides in the specific geo-environment.
Landslides are caused by several topographical, environmental, geological, hydrological, and geotechnical factors such as terrain features, slope morphometry, drainage pattern, land use and land cover in the region, geomorphological set-up, etc. These factors are usually termed as causative factors [8,9]. Landslides are triggered by extreme rainfall events or snowmelt, seismic activity, and/or anthropogenic activities [2,10]. Climate change and extreme rainfall events trigger landslides more frequently, causing considerable losses to the society, particularly in areas with a large settlement [11,12,13,14]. Haque et al. [15] investigated the human cost of global warming, focusing on deadly landslides and triggers between 1995–2014. They reported that there was a significant increase in the number of fatal landslides in the said period. Haque et al. [15] also demonstrated the linkage between catastrophic landslides and extreme rainfall events in their study, particularly in densely populated areas. The effect of various factors contributing to landslides in a region can be perceived in a landslide susceptibility map that describes the spatial propensity of landslide vulnerability in a selected geographic or geomorphic boundary.
Landslide susceptibility assessment is a complex process and involves determining the spatial association between various factors causing landslides and its location. Several statistical, deterministic, and heuristic methods are employed to evaluate landslide susceptibility [13,15,16,17,18,19,20,21,22,23,24]. Data-driven statistical models are widely favored for their simplicity and ease of application, while the limitations can come from a lack of local data including temperature and precipitation [25]. Popular statistical methods used to assess landslide susceptibility are bivariate methods [26,27], multivariate regression [28,29], and logistic regression [19,20,30,31,32]. Bivariate models like frequency ratio, weights of evidence, information value, and yule coefficient assess the spatial association between landslide occurrence and each causative factor using a set of observations. Bivariate models are simple and straightforward, but the relative importance of the factors influencing landslides cannot be determined using bivariate methods. Multiple regression models attempt to evaluate the relationship between landslides and numerous causative factors. They also estimate the importance of these factors in causing landslides and can also identify outliers. However, the multiple regression model’s success depends on the data used, and the results are too difficult to interpret. Logistic Regression is a statistical modelling approach used to parameterize a non-linear relationship between dependent and independent variables [31,33,34], particularly when the dependent variable has a binary or dichotomous output. Logistic regression, like linear regression, evaluates the relationship between several predictor variables and the dependent variable. Unlike linear regression, which requires continuous variables, logistic regression can use any type of independent variables—continuous and categorical. It is also not mandatory for independent variables to have a normal distribution and evaluate multiple independent variables. The logistic regression model features make it an ideal choice for modelling landslide susceptibility in this study. However, it should be noted that this method requires a large dataset and is sensitive to the large variance in the dataset used.
Landslide susceptibility models are region-specific and are, to a large extent, dictated by the local geo-environmental set-up.
Coonoor is a popular hill-station in Tamil Nadu, India and is located in the western ghats, a zone prone to intense slope stability problems. Tourism and tourism-related activities such as flower shows, vegetable shows, hiking, special events in botanical gardens, eco-tourism, etc. are prevalent throughout the year. People witness landslides every year, particularly in the months between October and December due to intense and prolonged monsoonal rainfall. These landslides cause severe distress to the hill community in terms of social and economic losses [10]. Therefore, it is necessary to study the factors causing landslides in the Coonoor Taluk to map the regions susceptible to landslides.
This study evaluates the factors that contribute to landslide occurrences, understands their spatial association with the landslide, and map landslide susceptibility using a logistic regression model for Coonoor Taluk, India. The objective of the study is to throw light on the relation between landslide susceptibility and anthropogenic activities in this region. Geo-environmental factors are used to build the landslide susceptibility map and are compared with the most significant anthropogenic activities that have modified the natural setting in the region.
2. Methodology
2.1. Study Area: Coonoor Taluk, Tamil Nadu
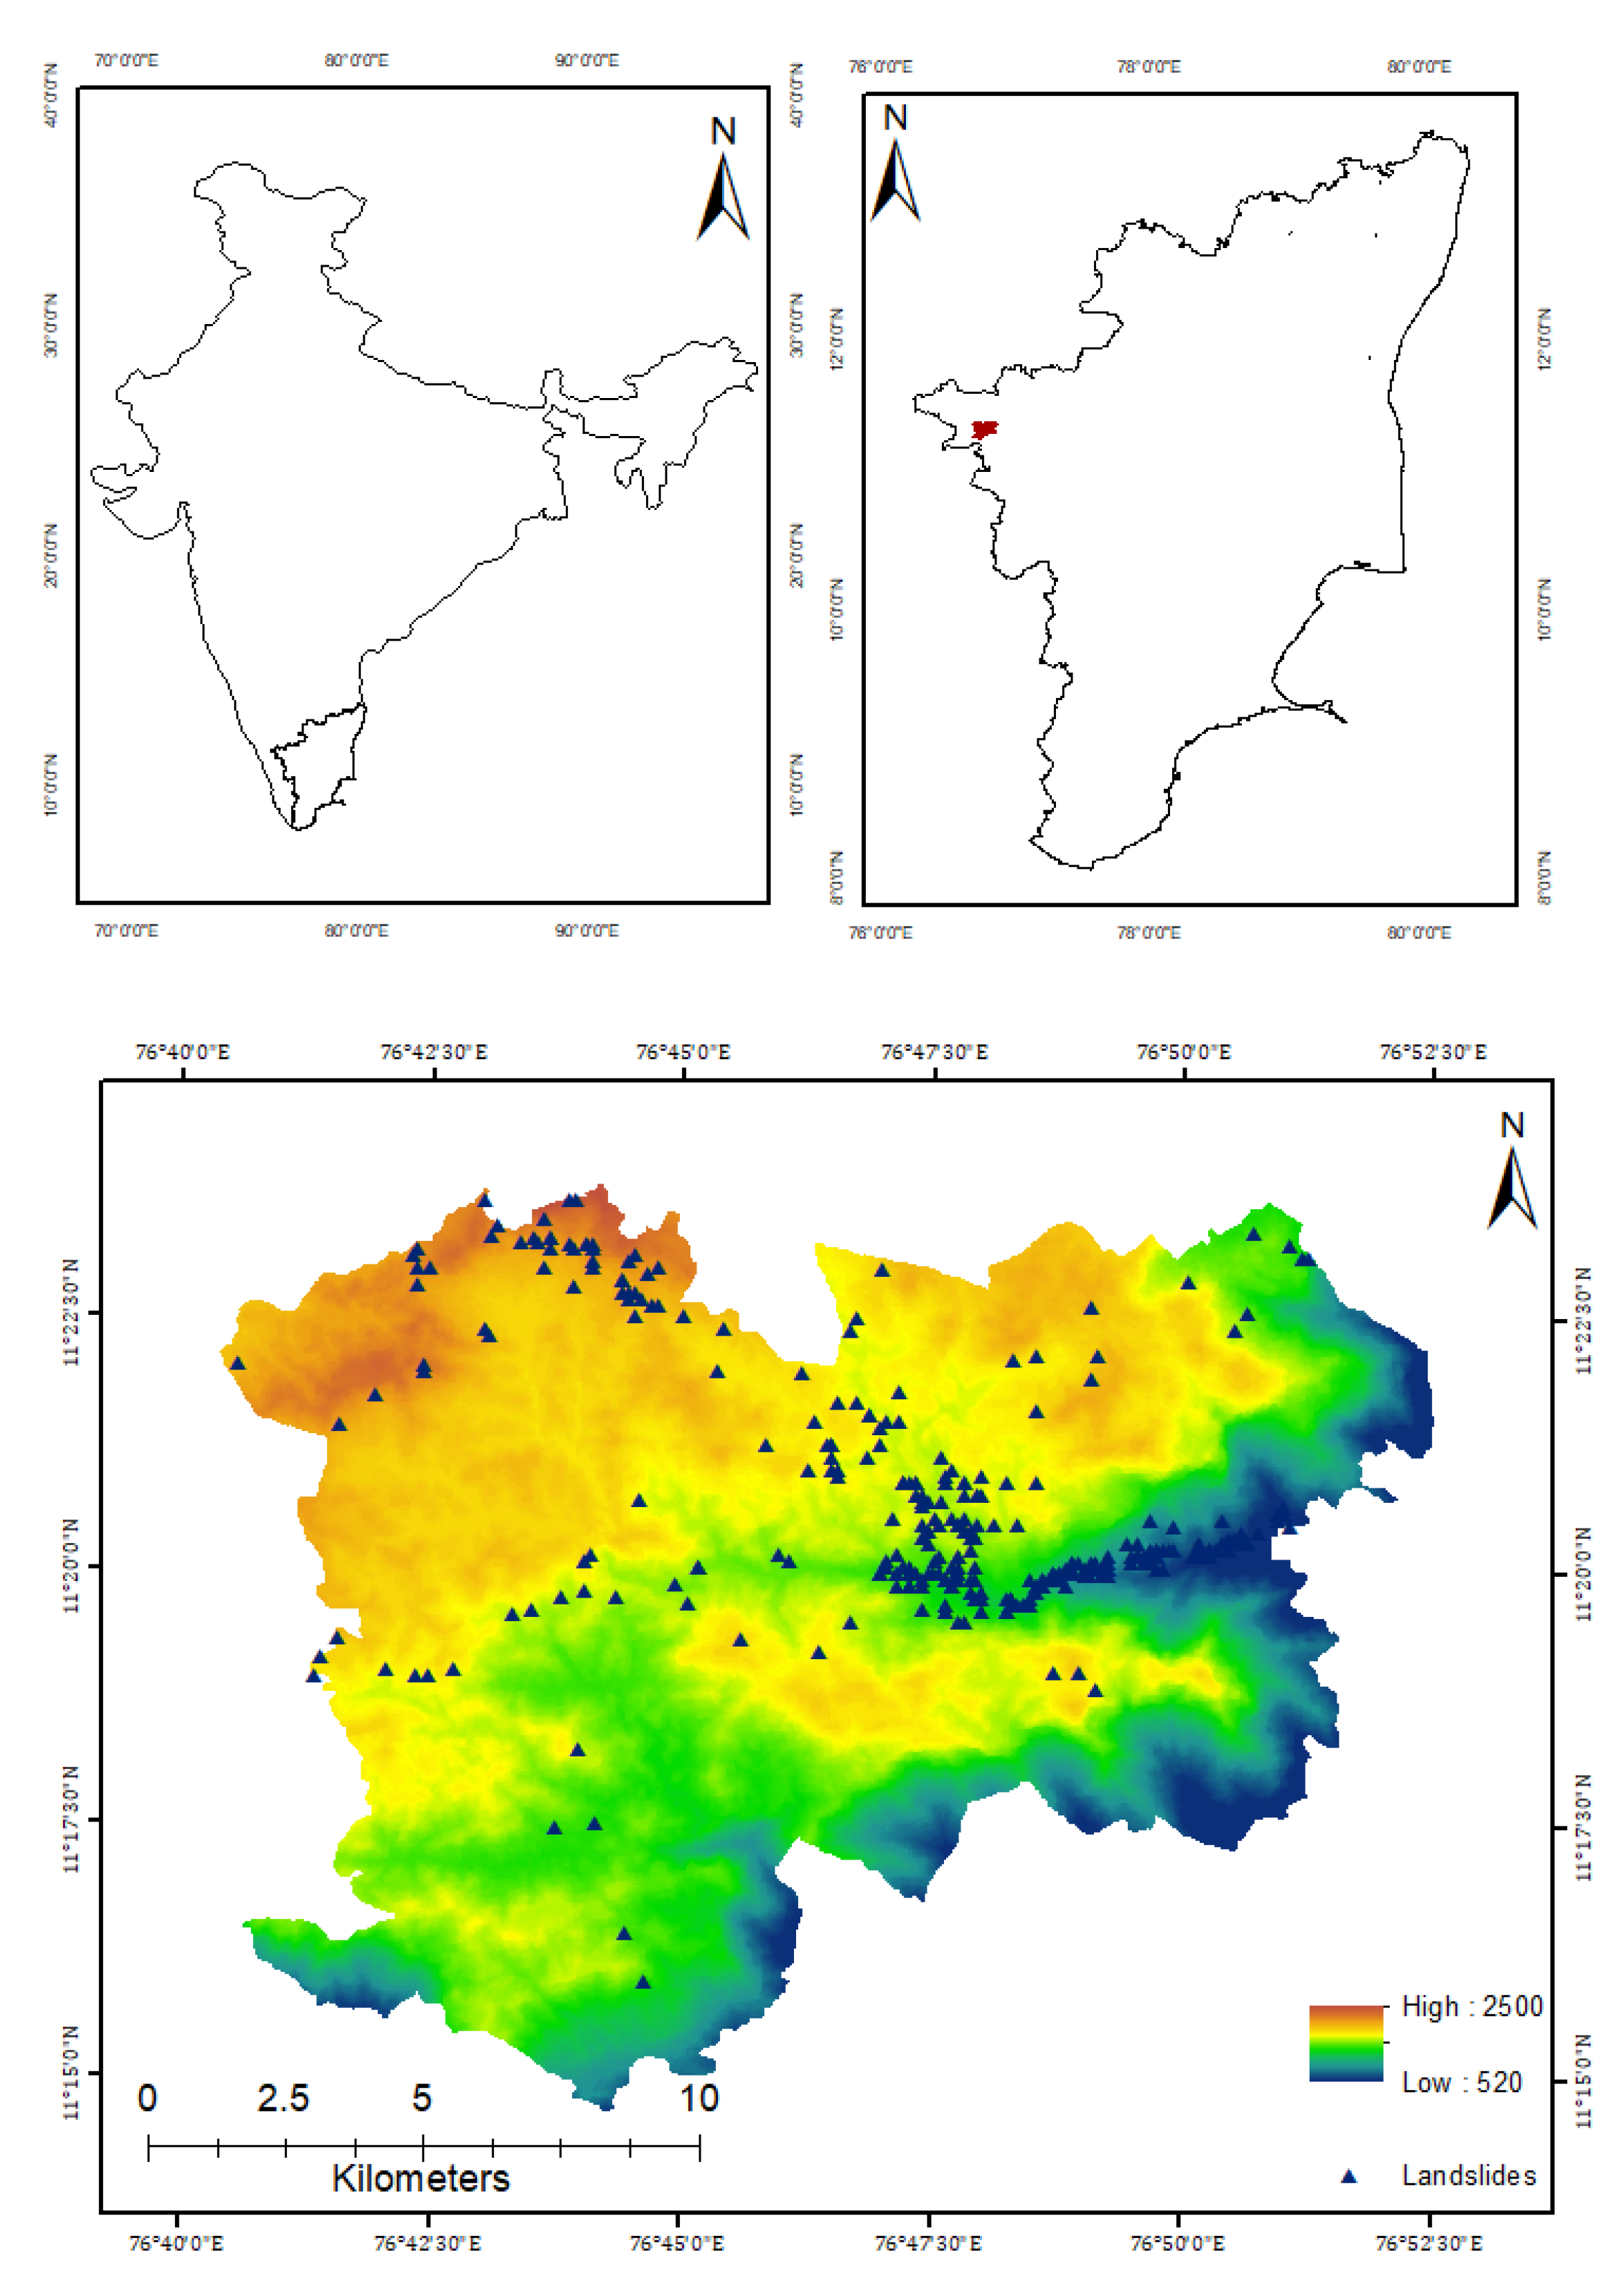
Coonoor, a popular hill station in the Western Ghats, is a sensitive eco-system in South India (Figure 1). It covers approximately 230 square kilometers and is bound on the southeastern flank by Doddabetta ranges, Hulikal ravine on the southwest, and Kothagiri ridges on the northeast. It has a well-connected road and rail network through Mettupalayam. The region falls under a tropical zone on account of its elevation and experiences a subtropical highland climate. Its altitude ranges between 394 m and 2033 m, and the average altitude can be described as 1800 to 2000 m above mean sea level. The annual average temperature is 17 °C, with the highest temperature records in May and the lowest temperature in January. The average yearly rainfall is 1335 mm [35]. Precipitation is minimum in the winter months between January and March and maximum in the north-east monsoon season, between October and December. The relative humidity is high almost throughout the year. Bedrock geology consists predominantly of the charnockite rock group with Satyamangalam schist enclaves [36,37]. They are acidic, deeply weathered, and capped with aluminous laterite in several places forming an irregular soil horizon [37].
The most common landforms observed in the region are gentle mounds with thick soil cover and high peaks with steep escarpment. The area is characterized by crests, valleys, deep gorges, cascades, and high-velocity streams [37]. It is drained by numerous streams of the first order that originate from the peaks, and the drainage pattern is predominantly dendritic.
Coonoor Taluk has a population of 157,754, according to the 2011 census. The rural and urban population is 27,128 and 130,626 respectively, i.e., nearly 82.8% of the population are urban dwellers. The metropolitan region is densely populated. It is also home to native tribes like Badugas and Todas, who constitute about 1.5% of the Taluk population. The literacy rate in the Coonoor Taluk is nearly 88%. The economy is dependent on tourism-related activities and the tea industry. Almost 24% of the tea plantations and factories of Nilgiris District, Tamil Nadu, are located in Coonoor. Coonoor being a hill station, has a massive tourist influx all through the year. In 2016, the tourist population visiting Coonoor was 2,463,779, of which nearly 98% were domestic tourists. While this study does not consider the human footprint on landslides, the factors considered in identifying the susceptible zones, including the inhabitants of those regions, will have a direct bearing on broader conclusions in making them more resilient to these landslide disasters.
2.2. Data Sources
Data sources include both analogue and digital formats of data. Landslide inventory was collected from the National Highway Authority, Southern Railways Coonoor Division, State Highway Department, Coonoor, Office of the District Collector, Nilgiris, and from various literature sources [10,37,38]. Freely downloadable digital data products like ASTERDEM (30 m × 30 m), LANDSAT 8 OLI, and analogue maps like Survey of India (SOI) topographic maps 58 A11 and 58 A15 of 1:50,000 scale obtained from GSI, India were used to derive the various thematic layers. The soil map was adopted from the Tamil Nadu Agriculture University (TNAU), Coimbatore, India. Limited soil samples were also collected from selected locations for geotechnical analysis and cross-verified with the TNAU soil map. Daily rainfall data for the various rainfall stations in Coonoor Taluk and Uthagamandalam were obtained from Tamil Nadu Statistical Department, Chennai, India, for the years 2007–2017.
2.3. Landslide Characterization
Landslide inventory is a vital dataset required for modelling landslide susceptibility. Scientific records of landslide incidences, including their spatial and temporal attributes, are rare in the region. The inventory has been constructed for the period between 1992 and 2018 based on available records from Government departments, literature, and field survey of known locations. Landslide data collected from the records of the Geological Society of India (GSI) shows that nearly 367 landslides have occurred in the period of study (1992–2018) and includes landslides of small, medium, and large volumes. The information on the length, width, and depth of the recorded landslides is available for only 270 landslides. The volume of these landslides ranges from 3.925 m3 to 2,512,000 m3. Nearly 38% of the landslides have a volume less than 100 m3 and 31% above 1000 m3. Landslides have primarily occurred due to cut slopes’ failure, toe erosion in road cuts or natural slopes, removal of material from the toe, and failure of steep cuts. Approximately 74% of the landslides have occurred due to road cutting activity. The slope failures are shallow in nature, and rainfall is observed to be the triggering factor most often. Hence the landslides triggered by rains alone are considered for this study. Nearly 57% of the landslides recorded are earth slides, slumps, and soil slides, and about 40% of the landslides fall in the category of debris and debris slides. Slope failures like subsidence, boulder fall, and rock toppling are also observed in the region but rare. Figure 2 shows the location of the landslides used for the training of the logistic regression model.
2.4. Spatial Database of Causative Factors
Numerous factors, including topographical, geotechnical, geological, environmental, hydrologic, and climatic factors, contribute to landslides occurrences. The factors are often a function of the local geo-environmental set-up. Therefore, it is necessary to assess each factor’s influence with respect to its local geo-environment based on the landslide occurrences. Table 1 presents the various factors commonly used to map landslide susceptibility in literature. The factors that influence landslides in this area were selected based on their correlation to causing landslides. Factors such as aspect, slope gradient, curvature, relative relief, land use, soil, topographic wetness index, distance from lineaments, distance from streams, and average annual rainfall were considered for assessing landslide susceptibility in this region [13,15,19,31,32,34,39]. A Pearson’s correlation analysis was carried out for each of the factors listed above to assess their relationship to landslides in this specific geo-environment. The factors that showed a correlation greater than 0.4 were selected to model landslide susceptibility using logistic regression. The factors selected for the study based on Pearson’s correlation were aspect, slope, relative relief, TWI, soil, land use and annual precipitation.
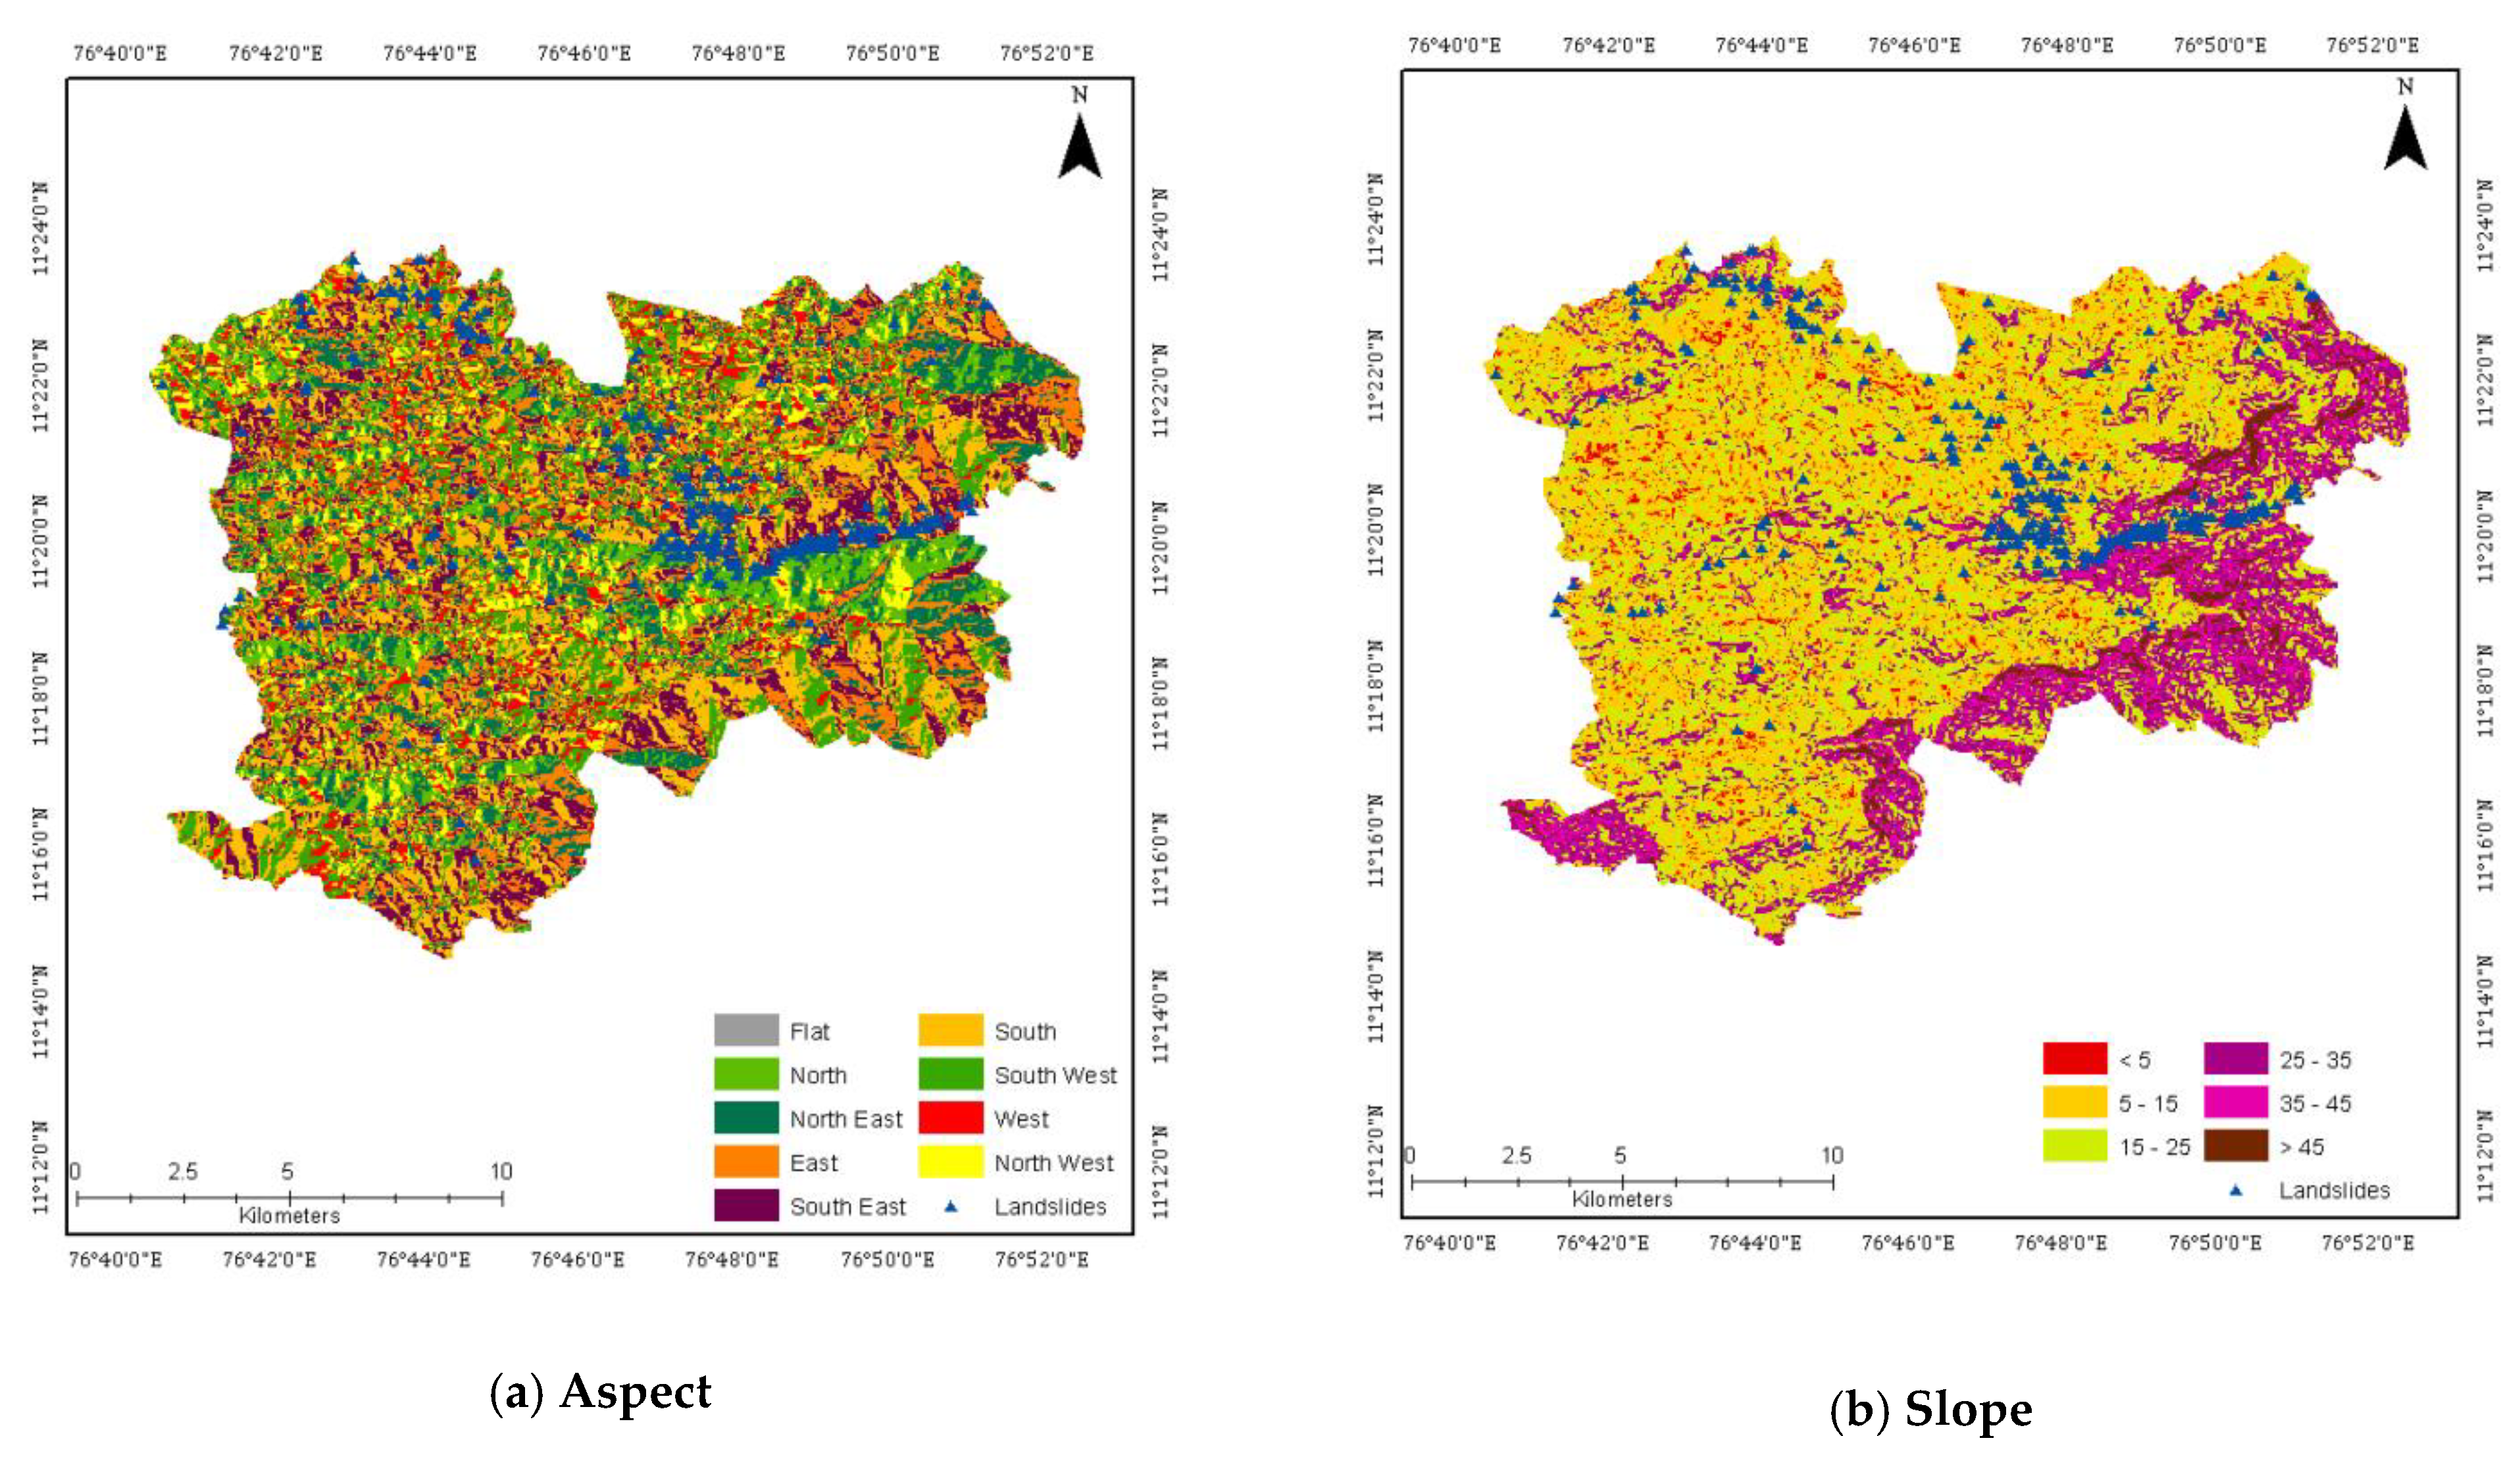
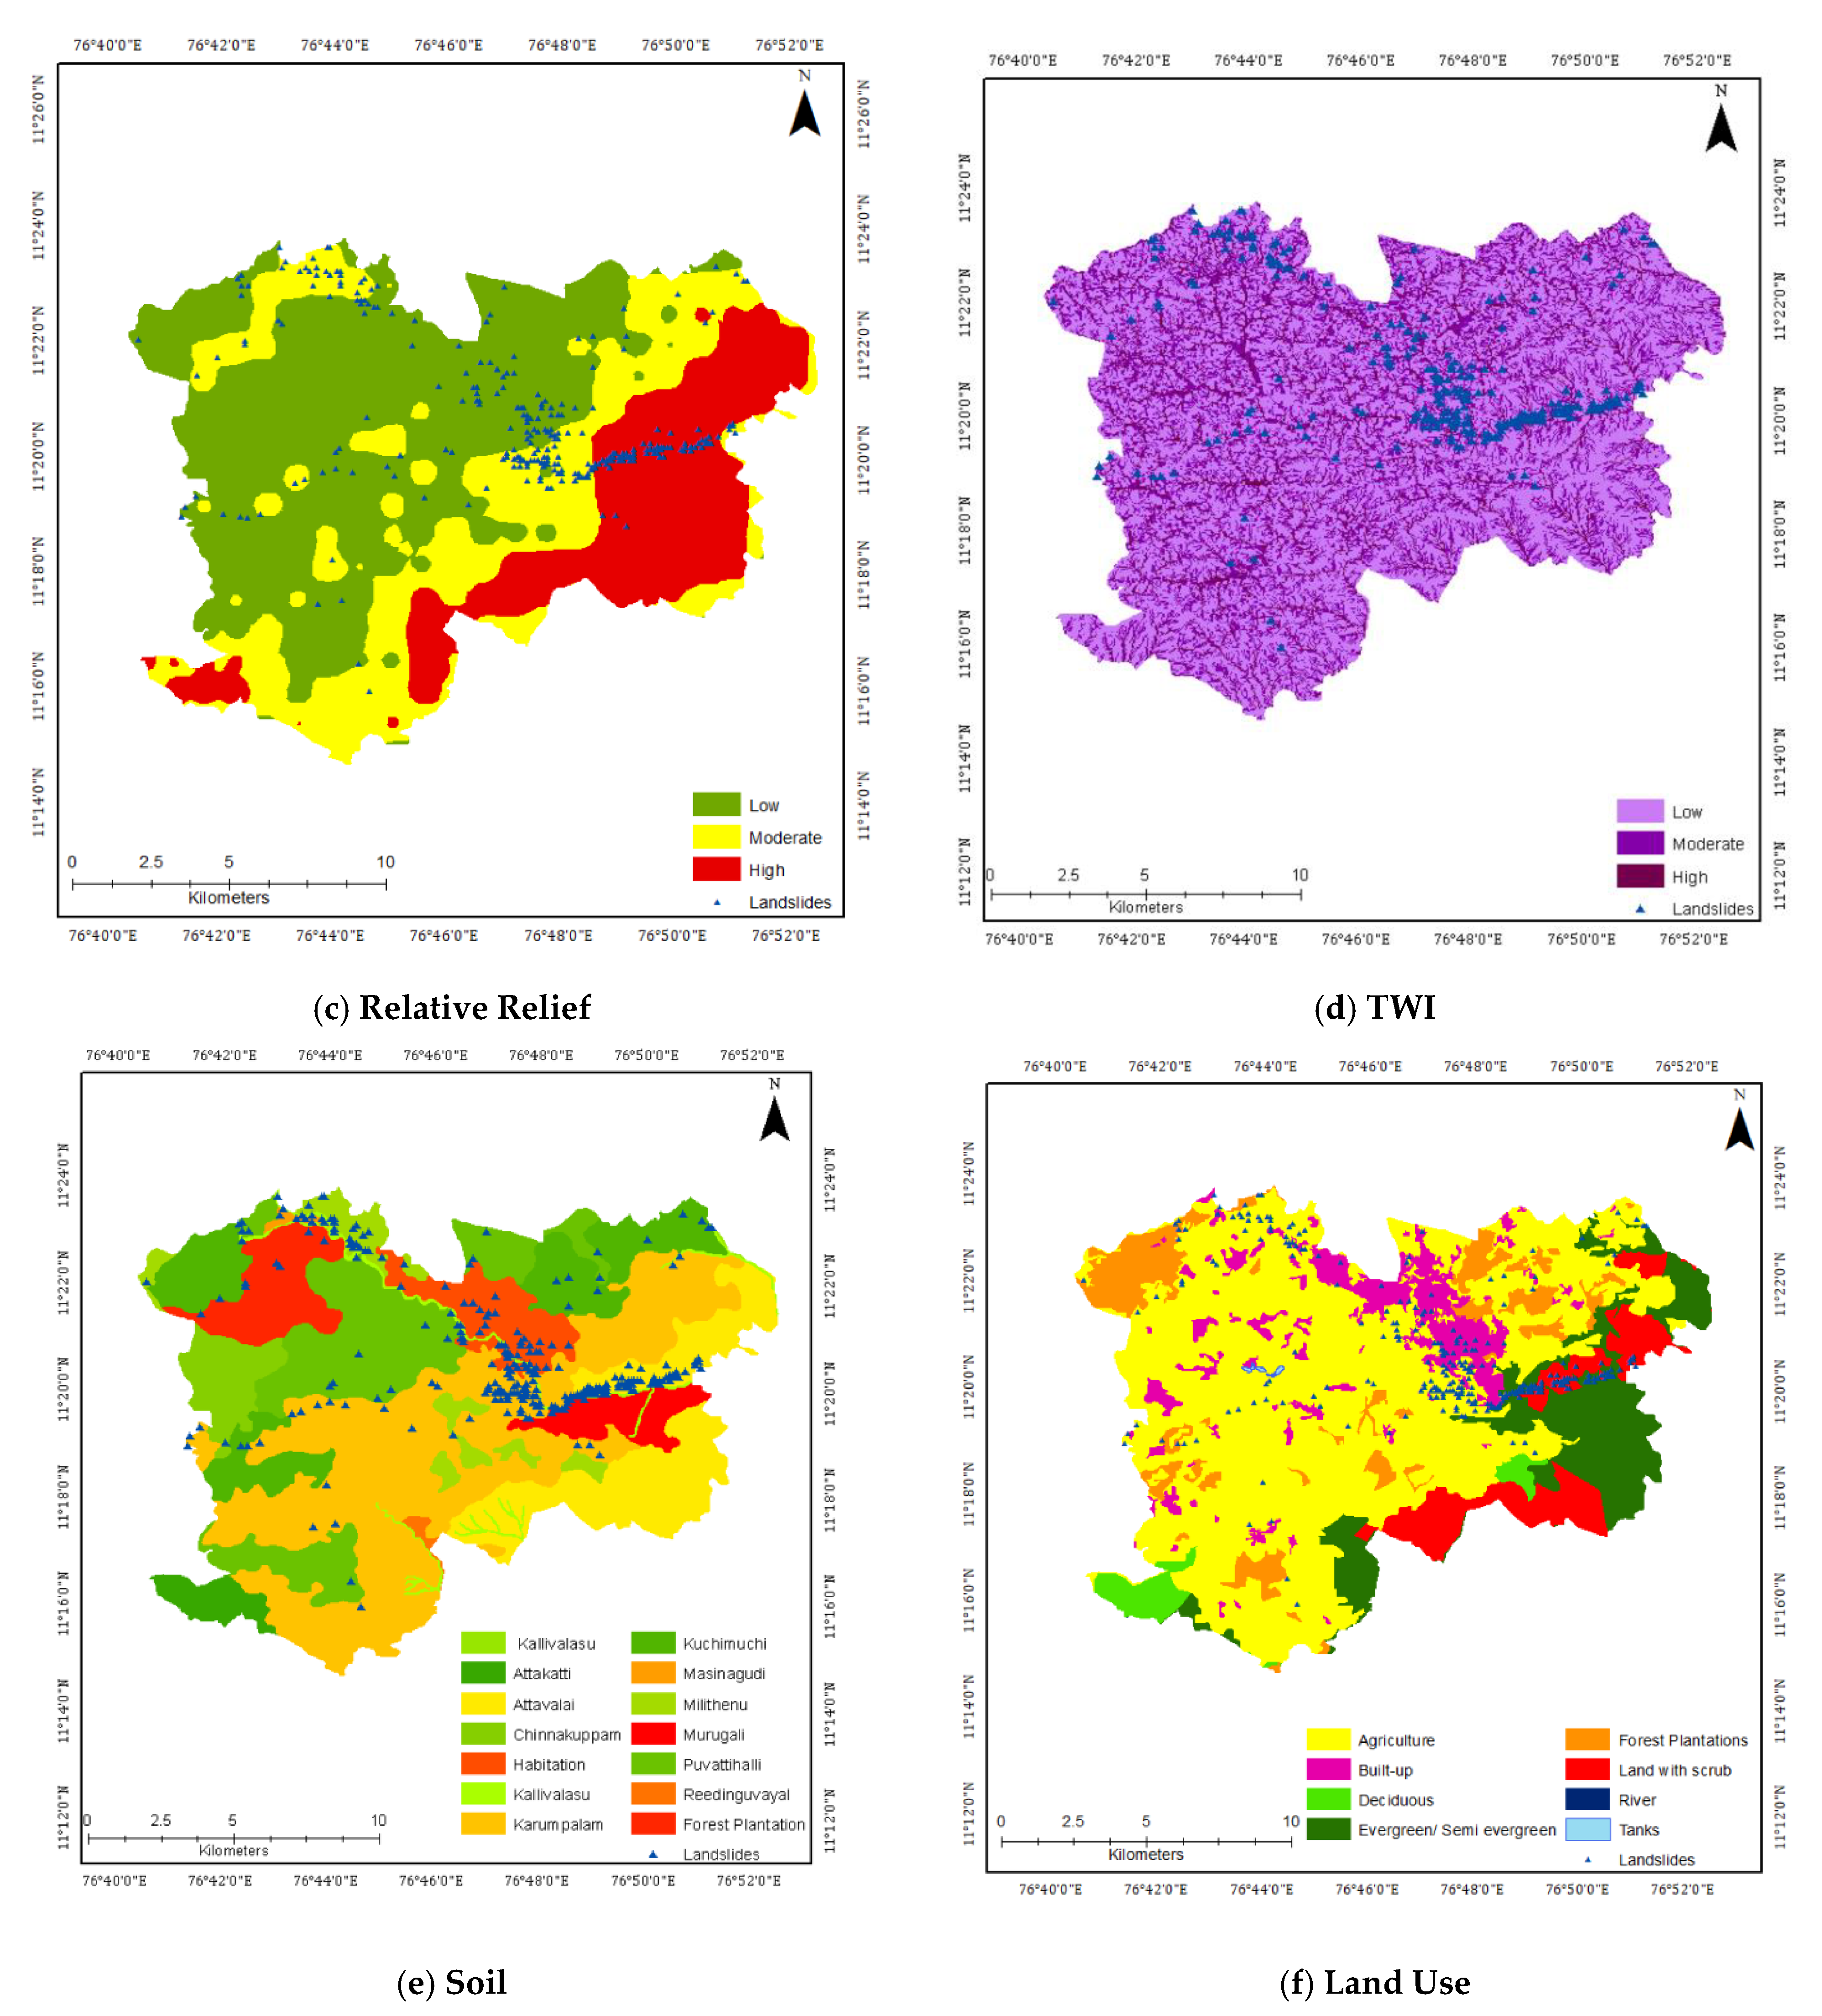
Thematic layers aspect, slope gradient, relative relief, and topographic wetness index were extracted from ASTER GDEM of 30 m × 30 m resolution using the spatial analyst tool of ArcMap. Aspect represents slope direction and was divided into eight cardinal directions and a category flat (Figure 2a). Slope gradient was reclassified into five classes as 0°–5°, 5°–15°, 15°–25°, 25°–35°, 35°–45°, and greater than 45° (Figure 2b). Relative relief represents the difference in maximum and minimum elevation within a pixel. Relative relief was classified into three categories low (92–250), moderate (250–495), and high (495–922) and is presented in Figure 2c. The spatial distribution of topographic wetness index (TWI) was generated using flow accumulation and slope datasets. Flow accumulation was also extracted from ASTERDEM of 30 m resolution using flow direction raster. It was reclassified as low (5.77–9.44), moderate (9.44–12.64), and high (12.64–22.78) and is shown in Figure 2d.
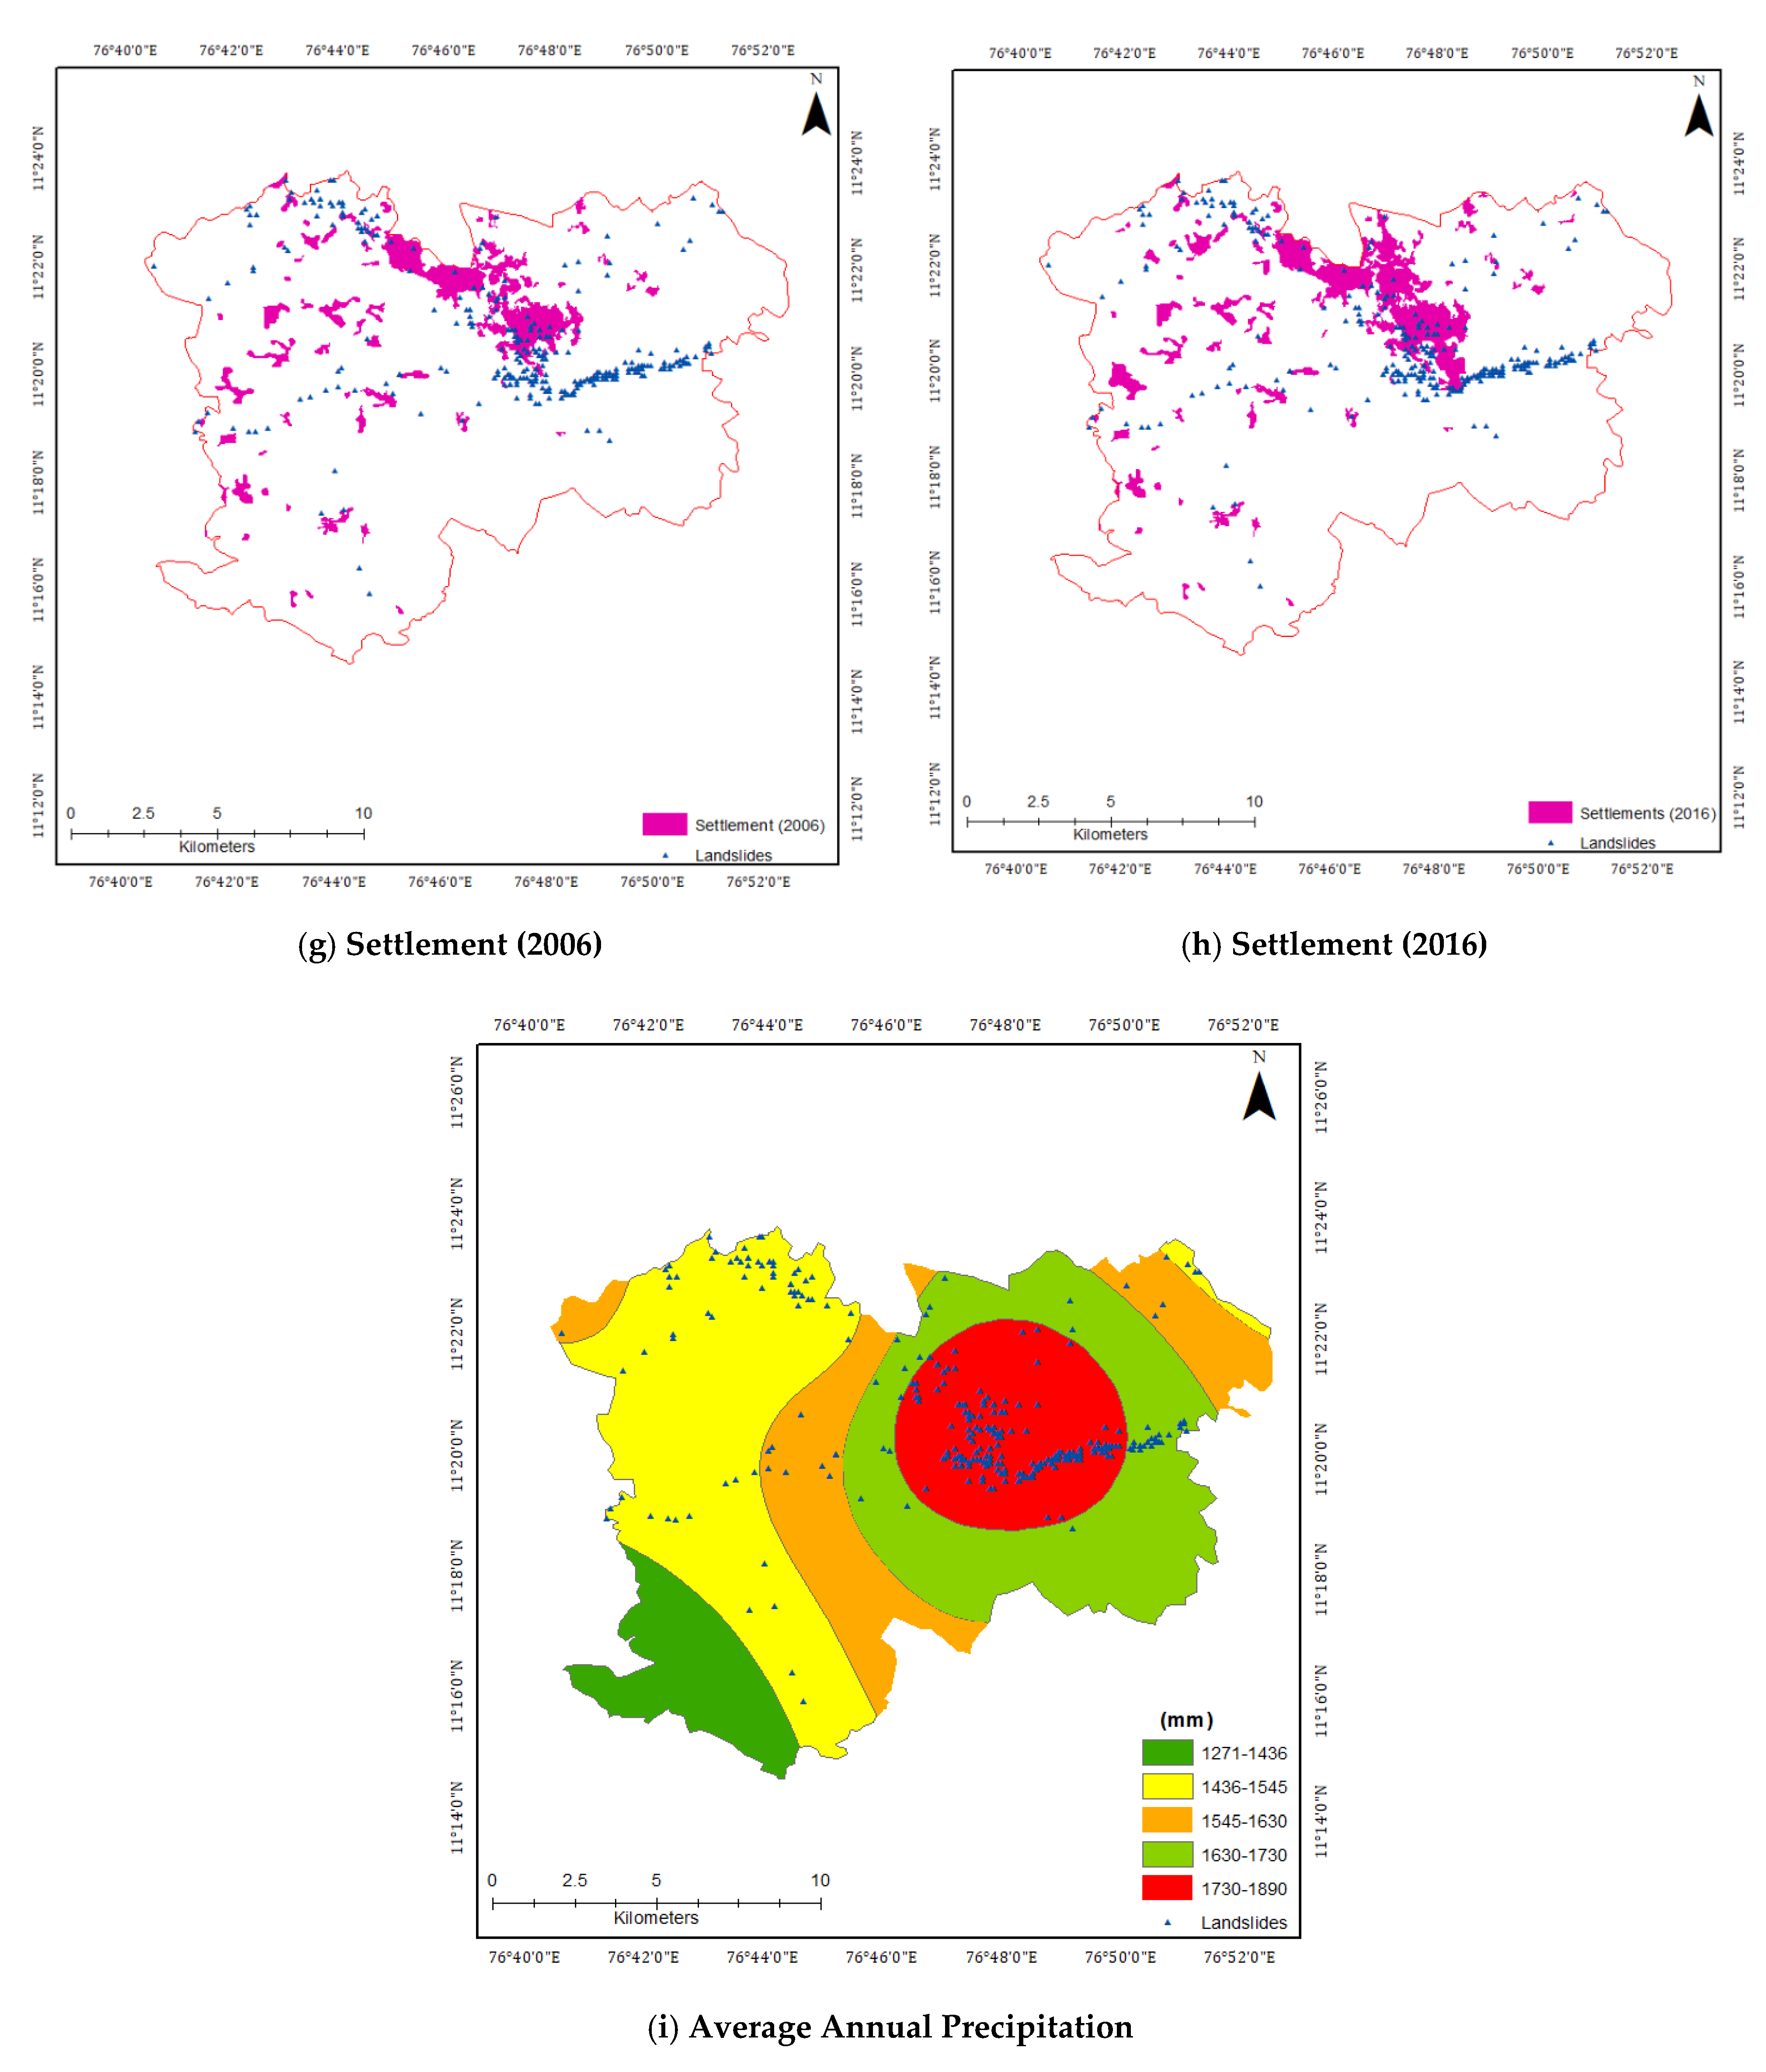
The soil was classified based on the region of occurrence as Kallivalasu, Attakatti, Attavalai, Chinnakupam, Karumpalam, Kuchimuchi, Masinagudi, Milithenu, Murugali, Puvattihalli, and Reedinguvayalu soil series (Figure 2e). The soil’s textural classification in the region indicates that loam, loamy sand, sandy clay loam, sandy clay, and clay were present as stratified layers. Rock outcrops were also noticed in the north-western part of the study area. They were converted into plantations taking advantage of the terrain. The thickness of the soil varies between 51 cm in Murugali and 7 m in Attavalai. Land use was extracted from BHUVAN data provided by the National Remote Sensing Agency, India. The land use map is of scale 1: 50,000. Figure 2f shows the land use map for the year 2016. The major land use categories are agriculture, forests, land with scrub, settlements, and water bodies. Tea cultivation and agriculture occupy nearly 78.4% of the area in the region. Settlements are dense in the northern part of the study area. An analysis of the spatial spread of settlements in a decade between 2006 and 2016 indicates an increase of nearly 28% (Figure 2g,h).
Daily rainfall data were used to calculate the average annual rainfall. Rainfall data from six rainfall stations—Coonoor, Ketti, Kothagiri, Runnymede, Kundah, and Uthagamandalam, was used to map the spatial variations of average annual rainfall in the study area using spatial kriging (Figure 2i). It was classified into four classes based on natural breaks—1275 mm–1436 mm, 1436 mm–1545 mm, 1545 mm–1603 mm, and 1603 mm–1890 mm.
2.5. Landslide Susceptibility Assessment
A binary logistic regression model was used to map the spatial variability of the zones prone to landslides in Coonoor. The spatial variation of the factors causing landslides is shown in Figure 2.
Logistic function f(z) describes the probability of occurrence of a landslide event and is defined as
and it varies from zero to one. ”z” is expressed as the linear combination of predictors i.e., independent variables that cause landslides and respective coefficients. The model is expressed by
b0 represents model coefficient i.e., the intercept or constant; b1…….bn are coefficients representing the measure of the contribution of predictor variables X1…..……. Xn in causing landslides. The terms b0 to bn are unknown and are determined based on the relationship between the independent variables and landslide conditions and are estimated by the maximum likelihood approach, which is a derivative of the probability distribution of landslides, the dependent variable [34]. The independent variables are spatially represented as thematic layers and illustrate each factor causing a landslide. “z” varies between −∞ and +∞ and is an index that allows the user to combine the various independent variables responsible for landslide occurrence. Sample observations are used to fit a multiple logistic regression model. The coefficients b0, b1, b2, b3…….bn are estimated and used to ascertain landslide probability.
z = b0 + b1X1 + b2X2 + b3X3 +…….+ bnXn
Logistic regression (LR) model is built by (i) selection of independent variables based on its association with landslide occurrence (ii) checking the statistical significance of the selected variables using p-value significance test (iii) verifying the lack of inter-dependency between the selected independent variable using collinearity statistics—tolerance and VIF (iv) modelling landslide probability through logistic regression model and (v) validation through Area Under Curve (AUC) and landslide density function using the validation dataset. In this study, the landslide density function, computed for each class of a thematic layer is used to transform nominal variables into numerical variables, and is used as input variables for determination of the LR model. This helps prevent the creation of a large number of dummy variables. Moreover, it incorporates the knowledge of landslide history into the model. The landslide density function is defined as
Landslides cover nearly 1.1% of the total area, which is many times smaller than the area in which landslides are not present, and hence, it can be considered a rare event [43,44]. The ratio of landslide to non-landslide pixels used for developing the training dataset of the model is based on sensitivity analysis conducted on a different ratio of 1:1, 1:2, 1:2.5 and 1:5 based on various literature [31,44,45]. Seed cells of 100 m radius surrounding a landslide location were considered to extract the independent variable’s feature in a landslide affected region. Similarly, random locations not affected by landslides were also selected to represent zones not prone to landslides. The landslide pixels’ ratio to non-landslide pixels was maintained as 1:1, 1:2, 1:2.5 and 1:5 to generate the training dataset. It was observed that the ratio of 1:2.5 performed better consistently in these trials, and hence it was selected for the study. Different random sets of pixels with no landslides were selected to verify the consistency of the results. A binary variable to indicate the absence (0) or presence (1) of the landslide was added to the dataset.
2.5.1. Multicollinearity Analysis
Collinearity among the selected independent variables profoundly affects the model performance [39,46]. Tolerance and variance inflation factor (VIF) is used to measure multicollinearity in selected variables. Tolerance values less than 0.2 indicate marginal multicollinearity among selected independent variables, while tolerance less than 0.1 advocates multicollinearity to a great extent. Similarly, a variable with VIF greater than 2 indicates serious multicollinearity [44,47]. All the variables selected have a tolerance greater than 0.2 and VIF less than two, which indicates that the variables are not unduly correlated with each other (Table 2). Hence, all the selected variables were used to build the model.
Statistical Package for Social Sciences (SPSS) was used to build the logistic regression model. The logistic regression method based on the forward likelihood ratio was selected to assess the effect of the predictor variables of landslide occurrences. The statistical significance of the chosen variable was evaluated using the χ2 score. The Wald χ2 score’s significance level for a predictor variable to enter the model was set at 0.1. The training sets were evaluated based on the χ2 value of Hosmer–Lemeshow, Nagelkerke R2, and Cox and Snell R2.
2.5.2. Landslide Susceptibility Map and Validation
The model was trained using the landslides that occurred between 1992 and 2009. The pixel size of the raster dataset used for the landslide model was 30 m × 30 m. The total area of Coonoor region was represented with 255,700 pixels and the landslide data used for training the model consisted of 7859 pixels. Random selection of landslide and non-landslide pixels was adopted to build the logistic regression model. Validation of the model was carried out using the landslides that happened between the years 2010–2018. The coefficients calculated using the logistic regression model are assigned as weights for the thematic layer. The weighted thematic layers are combined in a GIS environment. The landslide probability is determined from the logistic function “z”. The spatial distribution of landslide probability represents the landslide susceptibility of the region. Hence, the spatial variation of probability is reclassified into five categories: very low, low, moderate, high, and very high, using quantile classification to represent landslide susceptibility. The landslide susceptibility map is validated using the landslide density index and area under the curve (AUC) to envisage the prediction and success rate of the landslide model built. Cumulative landslide percentage and area were plotted, and the area under these curves was calculated using both the training dataset and validation dataset of landslides. These represent the prediction and success rate of the model developed.
3. Results and Discussion
3.1. Logistic Regression Model for Mapping Landslide Susceptibility
The variables—aspect, slope, relative relief, TWI, soil, land use, and average annual rainfall were used to build the landslide susceptibility model. The model included all the selected variables. The null hypothesis for the test is set as the coefficient is zero. The estimated coefficient of the selected factors was statistically different from zero. The logistic regression model employed to assess the impact of predictor variables on landslides’ occurrence showed that the goodness of fit was acceptable as the significance of χ2 was greater than 0.05.
Similarly, Cox and Snell R2 and Nagelkerke R2 of 0.589 and 0.838, respectively, which are greater than 0.2 [48] indicate that selected independent i.e., predictor variables explained the dependent variable successfully. Table 3 shows the coefficient for the factors influencing landslide susceptibility in the region, and the model’s summary of classification is presented in Table 4. The model indicates that aspect (slope direction), relative relief, and TWI are negatively correlated, while all other factors are positively correlated. The influence of the parameters on increasing the susceptibility to landslides can be understood by exponentiating these factors’ coefficient, which expresses their odds. Table 3 shows that this study’s most influential parameters are average annual rainfall and land use, followed by slope and soil, indicating that climate and anthropogenic interference are very significant in causing landslides in this region.
The landslide susceptibility index based on the logistic regression model is
z = 2.765 − 2.542 (Aspect) +1.204 (slope) − 6.288 (Relative Relief) − 3.044 (TWI) + 0.995 (Soil) + 1.885 (Land Use) + 2.081 (Average Annual Rainfall)
The classification summary of the model shows that the model has a 93.4% successful prediction rate. The model’s capability to delineate areas not prone to landslides is higher (95.3%) than the ability to identify zones prone to landslides (90.2%).
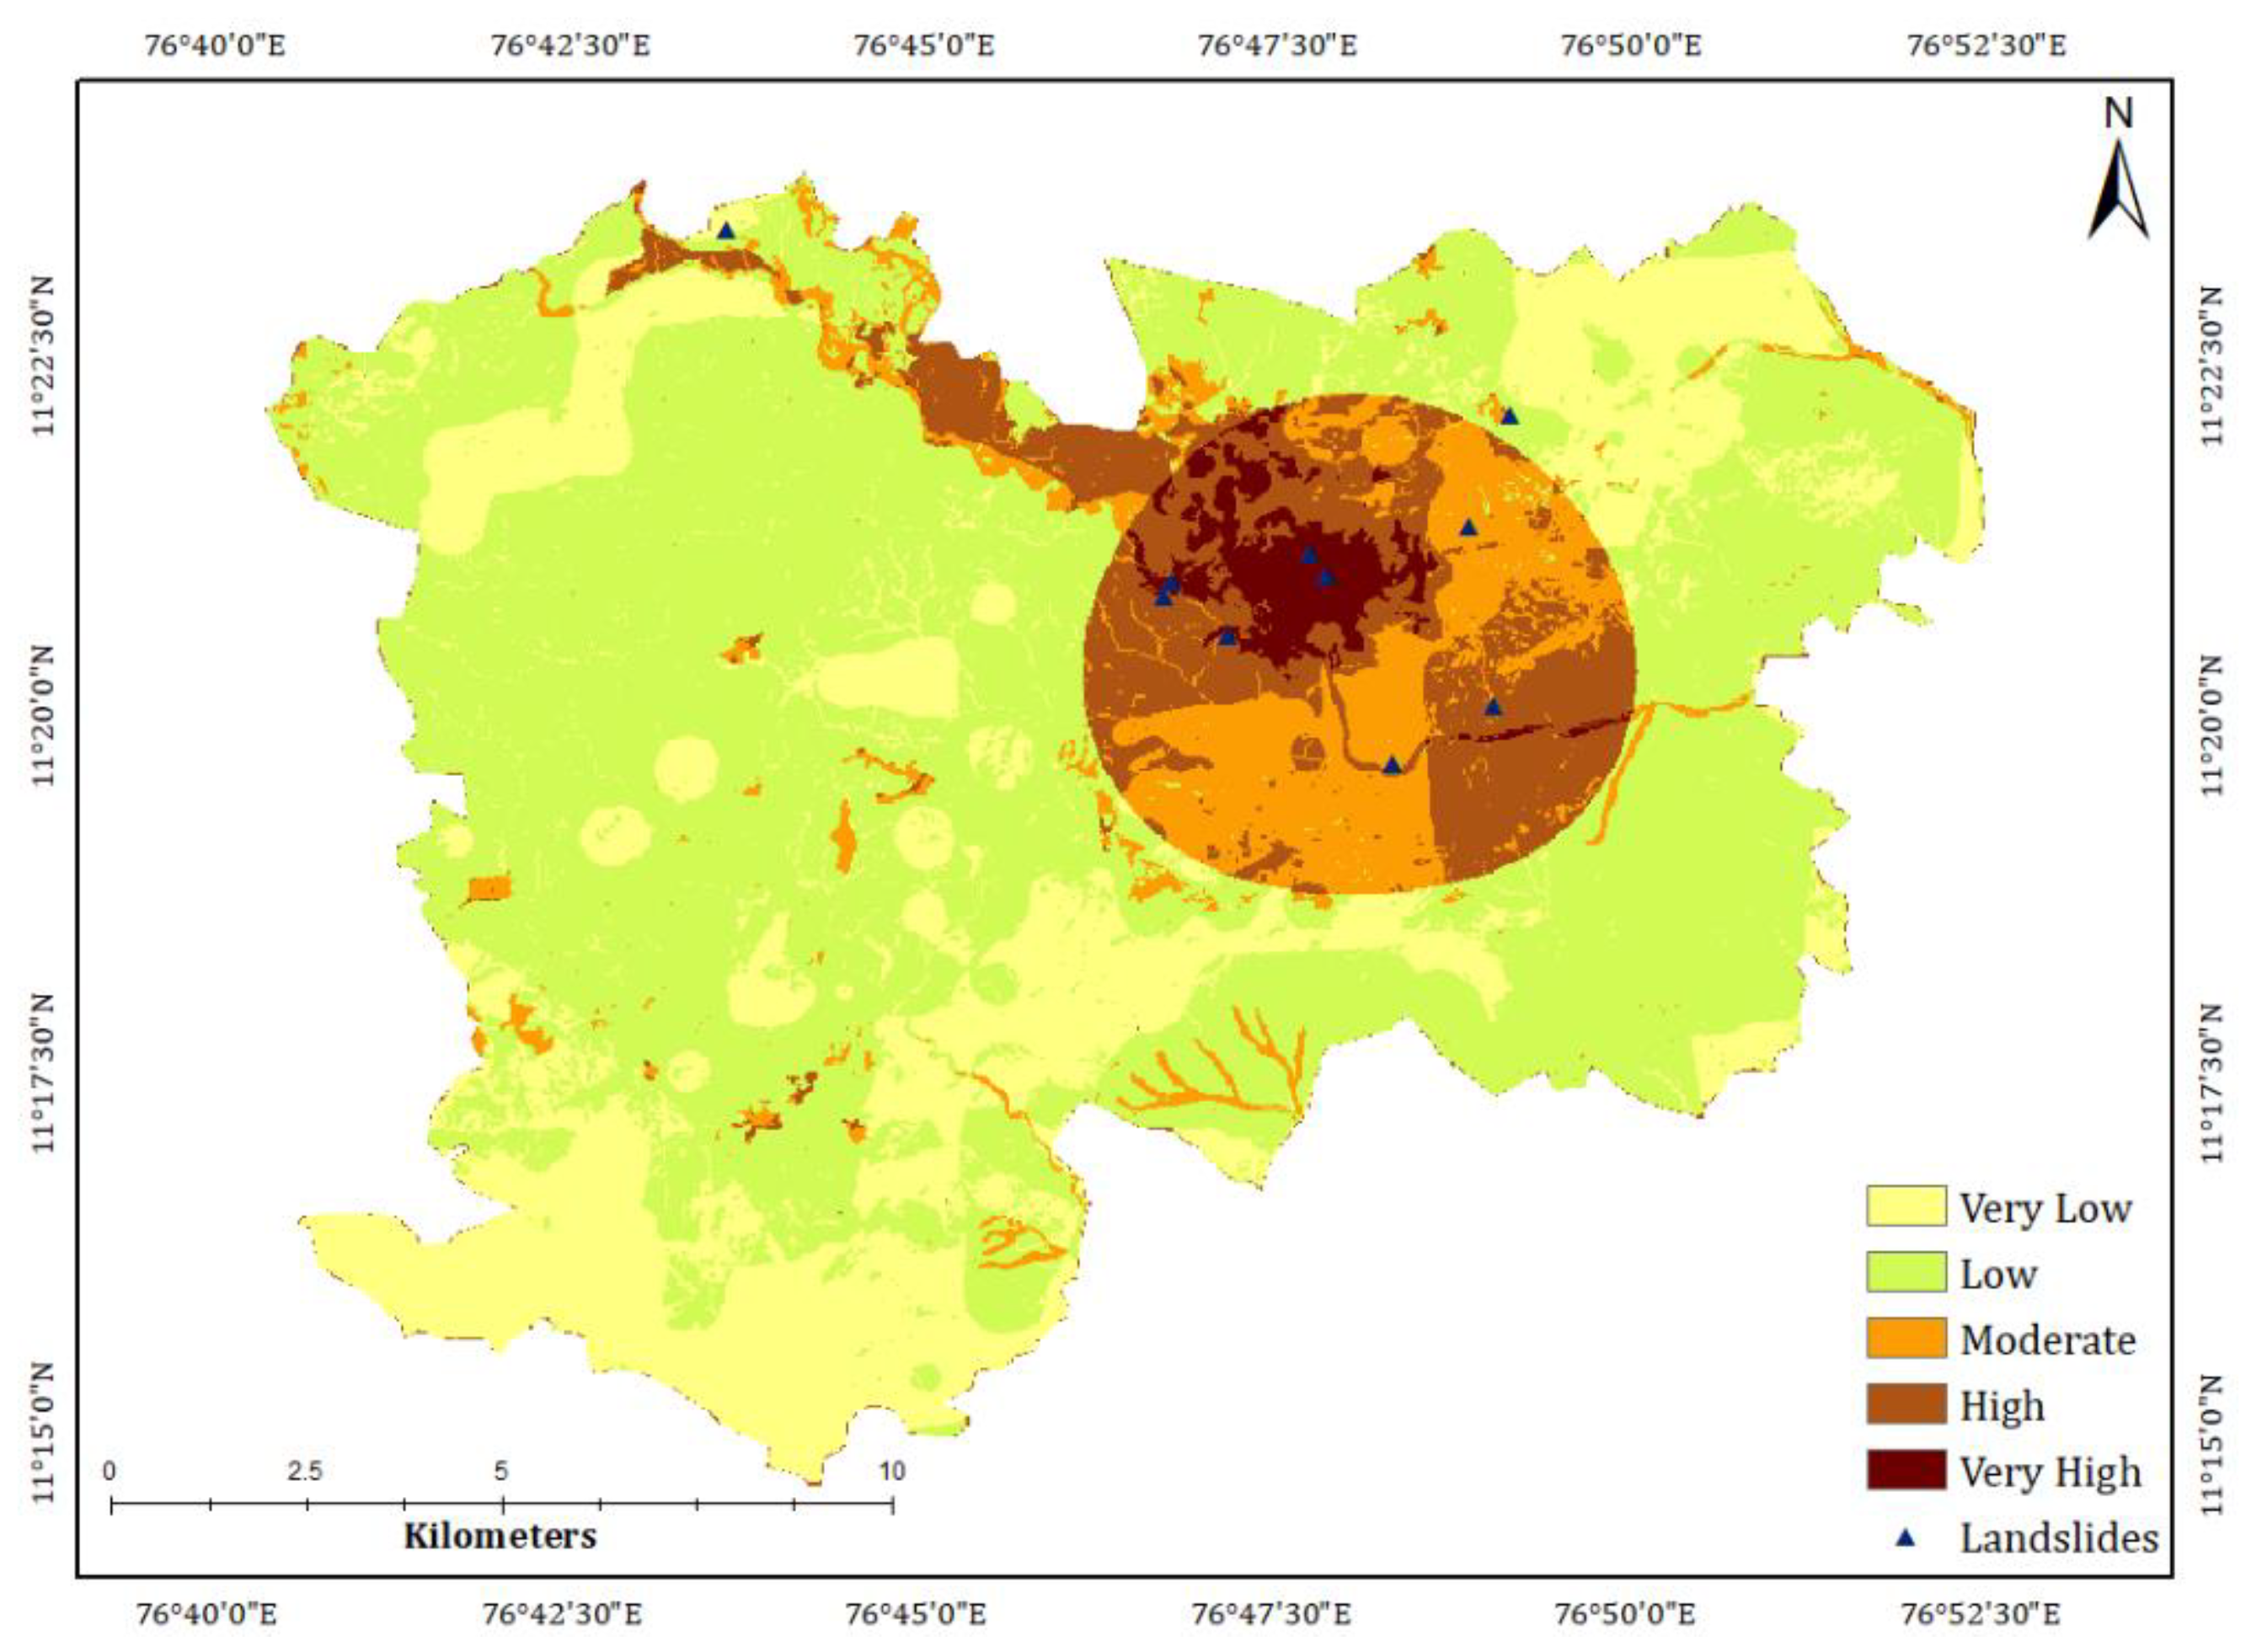
3.2. Spatial Variation of Landslide Susceptibility
Landslide susceptibility map (Figure 3) of the region has been reclassified into five zones for better understanding: very low, low, moderate, high, and very high using quantile classification. Quantile classification is used as the distance between categories is not known. The upper limit of probability of landslide susceptibility in the very low, low, moderate, and high zones result to be 7%, 29%, 59%, and 84%, respectively. Zones with a probability of landslide susceptibility greater than 84% are classified as very high hazard zones. The zones demarcated as high and very high susceptible constitute 18.5% and 17.6% of the total area, but nearly 34% and 48.6% of the landslides have occurred in these zones, respectively. Settlements fall in these high and very high susceptible zones. The major road network that connects hill town to the plains and further to the district center Udhagamandalam falls in these high and very high susceptible zones. A part of the Nilgiri Mountain Railway, a UNESCO world heritage site, falls in these zones. The high susceptible region is densely populated, intensely modified for agriculture, and has a high linear infrastructure density. The southern part of the study area with intense agriculture is not much affected by landslides. Therefore, slope modifications for development may enhance landslide susceptibility.
Simple biological stabilization techniques like turfing the slopes with plants like hedge grass-like vetiver, asparagus can be popularized among high-density settlements. The roots will act as reinforcement and improve the shear strength of the slopes. The water outlets and drainages can also be regulated along the slopes to avoid the slopes’ saturation.
The performance of the logistic regression model is assessed using landslide occurrences between the years 2010 and 2018. A buffer of 100 m radius was used to delineate the landslide area. The landslide density function calculated with the validation dataset indicates that landslide density function increases exponentially with the susceptibility class (Table 5).
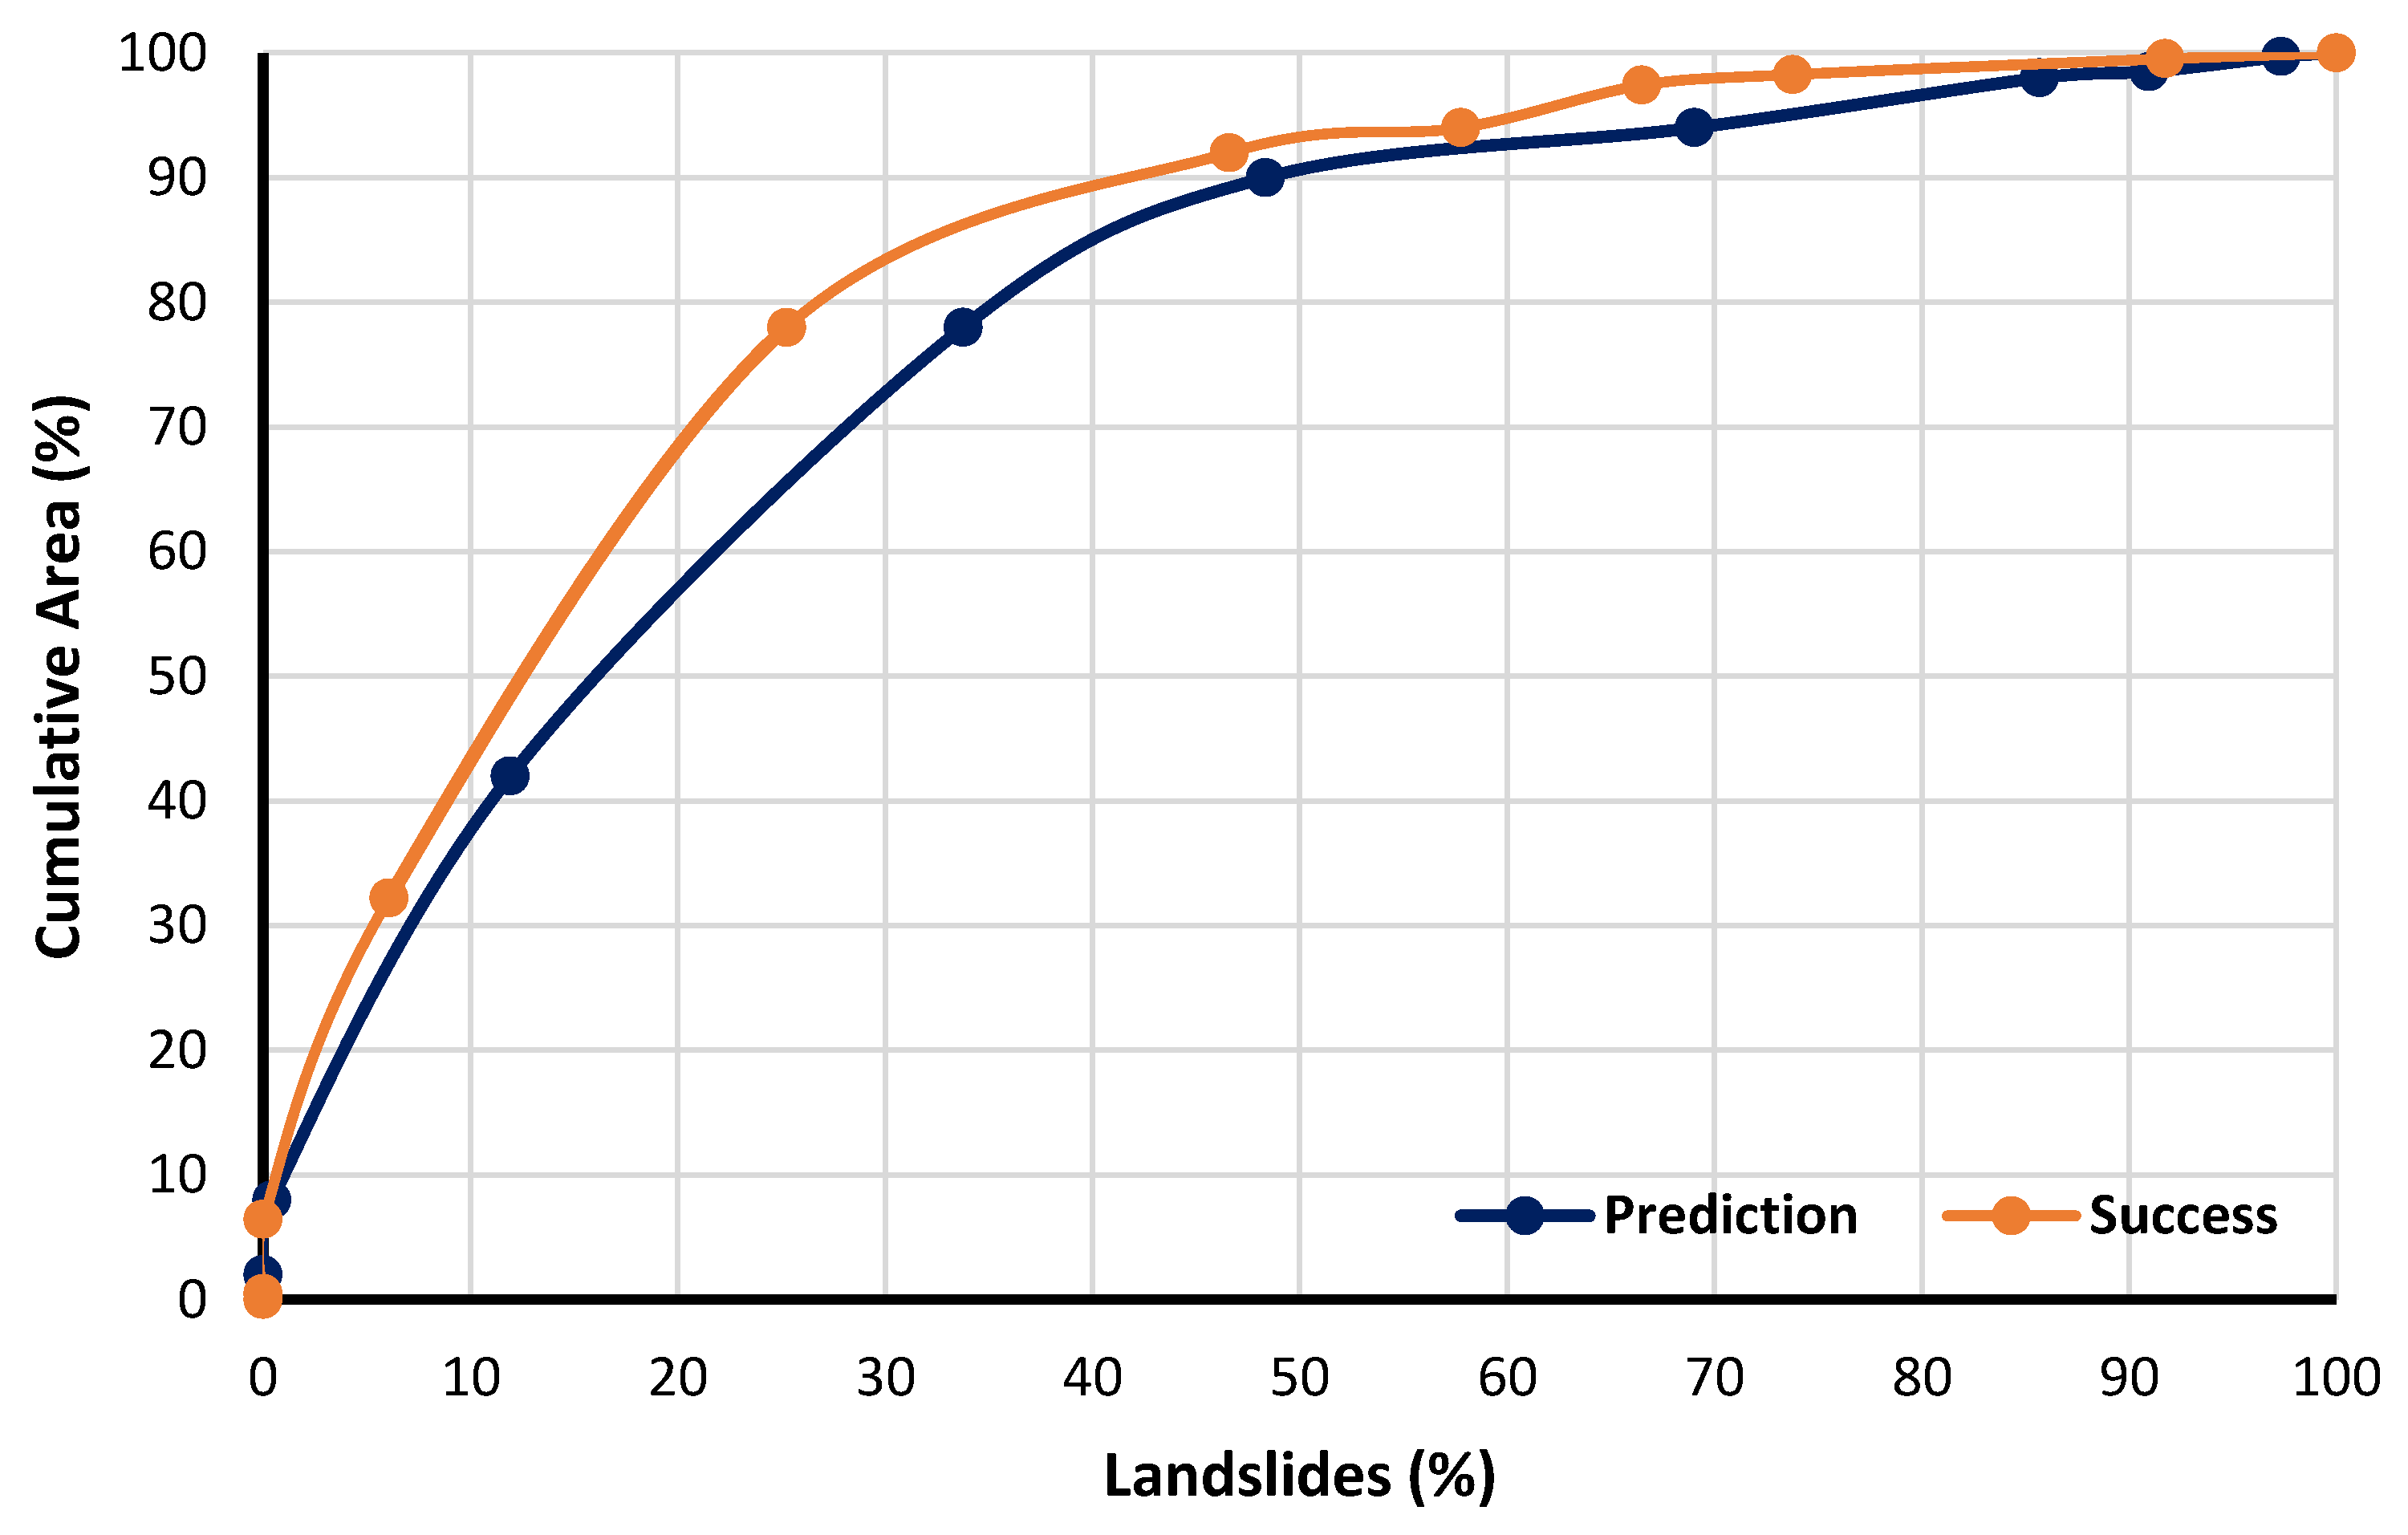
It increases from 0.17 for low susceptible areas to 2.76 for very highly susceptible areas. Area Under the Curve (AUC) is a standard indicator used to assess the susceptibility model’s spatial forecasting capacity [49]. The AUC of the landslide susceptibility map generated using the logistic regression model is portrayed in Figure 4. The AUC for the prediction and success rates are 79% and 83%, respectively (Figure 4), indicating that the model built assesses landslide susceptibility in Coonoor Taluk satisfactorily. The model shows a better success rate, indicating that this model’s susceptibility map can be used for planning schemes for hazard preparedness and land use planning with greater accuracy.
3.3. Effect of Local Geo-Environment on Landslides
Average annual rainfall is observed as the most influential parameter that contributes to landslide susceptibility in this region. Bisht et al. [50] reported that the study area region had witnessed both 95th and 99th percentile extreme precipitation events between 1971–2015. An analysis of the relationship between the past landslide occurrence and rainfall indicates that antecedent rainfall plays a vital role in initiating landslides. A minimum of five days antecedent rainfall of 132 mm is required to cause small and medium volume landslides. Landslides are more prevalent in the zones where the average annual rainfall ranges between 1730 mm–1890 mm, which is the highest recorded in this region i.e., nearly 55% of the landslides have been registered in this zone. It is also noted that around 26% of the landslides are observed in the zones where average annual rainfall ranges between 1436–1545 mm. This region is intensely cultivated, and a high number of landslide incidences may be due to the land modification for agriculture and related agriculture practices.
The descriptive statistics of slope gradient indicates that most slopes fall in the gentle—moderate category where landslides are most likely to occur [51,52,53,54]. The majority of landslides have occurred in slopes less than 28°. Gentle slopes appear to be more prone to landslides [13,19]. Nearly 40% of the landslides have occurred in the slopes with a gradient between 15°–25° that cover 34% of the total area. Slopes with steeper angles have significantly less overburden as the material tends to erode faster due to its gradient. The overburden covering the slope is highly resistant to movement. Slope direction often dictates the flow direction, and the amount of rainfall received. Nearly 45% of the study area’s slopes face the southeast, south and southwest directions, and 59% of the landslides have occurred in the slopes facing these directions. These slopes are frequently affected by landslides by virtue of their slope morphometry.
Soil is ranked as the fourth factor that influences landslide susceptibility. Masinagudi series and Kallivalasu series are more prone to landslides. Nearly 22% of the total slides fall in 3% of the Masinagudi series area, and 9% of landslides fall in 19% of the total area occupied by the Kallivalasu series. Both the series have soil in the category sandy clay loam. The average hydraulic conductivities of Kallivalasu and Masinagudi series are 2.29 × 10⁻⁴ cm/s and 6.31 × 10⁻⁵ cm/s, respectively, with an average thickness of 3 m each. These deposits being moderately permeable and lesser in thickness, allow the water to reach the nearly impermeable bedrock and shear resistance at the soil’s interface overburden and rock bed reduces to an insignificant amount causing the entire overburden to fail.
Topographic wetness index (TWI), a steady-state wetness index quantifies the topographic control on the hydrologic processes. While it considers the slope morphometry and upstream contributing area per unit width perpendicular to the direction of flow [55], a suite of soil moisture indices is widely used for predicting hydrologic extremes [56,57]. It is a more relevant metric for hill terrains than flat areas. It also explains the distribution of soil moisture [58]. It quantifies the tendency to distribute soil water, which is influenced by topography [59] and is often used in vegetation studies. Landslides are more prevalent in the high TWI zones indicating that soil moisture is an essential factor that causes landslide susceptibility. It is rather challenging to be spatially mapped. Hence, TWI can be effectively used in place of soil moisture despite its inability to consider the humidity, heterogeneity of soil, and vegetation cover [58].
Relative relief helps to characterize the relief characteristics without taking into account the mean sea level. Landslides are more prevalent in zones with moderate relative relief i.e., 37% of landslides have occurred in 37% of the area falling under the moderate relative relief category.
3.4. Effect of Anthropogenic Activities of Landslides
Anthropogenic factors are not included in the susceptibility model. Notwithstanding this, it is reasonable to construct a susceptibility map based on the geo-environmental factors and compare the susceptibility zones with the anthropogenic interferences. In fact, nearly 68% of the landslides have occurred in the zones heavily modified by anthropogenic activities. The gentle slopes are modified by various anthropogenic activities, mainly agricultural and construction activities, including infrastructure development and housing projects, because of their favorable topography. The gentle slope gradient does not allow rapid drainage of water during heavy rainfall periods increasing pore pressure and subsequent slope failure. The high density of settlements in favorable topography further increases the surcharge weight on the slopes, saturate soil due to improper drainage arrangements to carry stormwater, greywater, and sullage.
The principal land use categories are agriculture, forest (includes deciduous and evergreen forest), a forest plantation, land with scrub, built-up area, and water bodies (tanks and river). Tea plantation occupies nearly 64% of the region, forest and forest and forest plantation (24%), land with scrub (7%), built-up area (4%), and rest by water bodies. The vast area of land under agriculture points to intense anthropogenic interference. The slopes are continuously modified and irrigated for agricultural purposes, leading to saturated soil moisture conditions in the top 100–150 cms with shifted surface energy fluxes [60,61], causing significant concern in problems related to slope instability. Though the built-up area occupies only 4% of the study area, the built-up density is very high, making the region more prone to landslides. In a decade, an increase of nearly 28% in the built-up area i.e., the settlements, is witnessed, as seen from Figure 2g,h. The expansion of settlement zones indicates the land pressure caused due to urbanization and makes the built-up category more vulnerable to landslides and increases the risk associated with landslides. The losses in terms of life and property will be more when a landslide occurs in this area. The area under scrubland also does not protect the soil the slopes from sliding. Many of the landslides were also observed to have happened in these land use categories.
Linear infrastructure is a predominant factor causing slope instability in the region, particularly the railway lines. Around 90% of the landslides have occurred near the linear infrastructure facilities of which 48% have been reported along the rail route. Natural slopes are modified continuously to lay or widen the roads and regular maintenance activities for both the road and railway lines. These interferences have severe consequences on the slopes’ stability as they usually steepen the natural slope reducing their shear resistance. Moreover, these modified slopes with made-up fills of borrow materials tend to have lower permeability, leading to pore pressure increase, which further decreases the slopes’ shear resistance. The removal of forest cover for laying or widening of linear infrastructure further adds to slope instability problems as root cohesion can add to slope stability lost in these slopes. Major roads like the national and state highway with large traffic volumes appear to be most affected by these slope instability problems.
Average annual precipitation and land use are the two most dominant factors that cause landslides in the region. This study emphasizes that anthropogenic interference has played a major role in causing landslides in this environmental set-up. Particularly, linear infrastructure facilities like roads and railway lines have been very influential. These zones are more prone to the risk of landslides. Landslides have a significant social and economic effect in this region as the zones falling in the high susceptibility category are predominantly built-up area and intensely cultivated regions. A further study relating landslide occurrences to extreme climate events can add value to this study.
4. Conclusions
Coonoor is severely affected by landslides almost every year during periods of intense and prolonged rainfall, causing heavy social and economic losses to its residents. The economy of Coonoor is dependent mainly on tourism and tourism-related activities. Landslide susceptibility mapping can help identify zones that need immediate attention in terms of planning mitigation strategies and development activities. Logistic regression is a more reliable model to map landslide susceptibility compared to other heuristic models like the analytical hierarchy process model or statistical models like frequency ratio model and is hence used for this study.
The physical and environmental factors causing landslides were identified, and the logistic regression model was used to assess their impact on causing slope instability. The model shows that average annual rainfall, land use, slope morphometry, and soil type are important factors that contribute to slope instability. The landslide susceptibility map indicates the spatial distribution of areas’ susceptibility to various degrees of landslide vulnerability. It is a crucial component to ascertain the temporal mapping of landslides. The spatial distribution of susceptibility classes in the region based on the logistic regression model shows that nearly 17.6% of the area is classified as highly unstable i.e., very high susceptible, and 48.6% of total landslides falls under this unstable category i.e., very highly susceptible. Anthropogenic interference is observed to be a very significant factor that has caused landslides in the region as most of the instable areas fall in the densely built-up zones, adjacent to major roads and railway line and in agriculture areas and where forests are disturbed by road infrastructure development like roads and forest plantations.
This study reinforces the need for providing landslide susceptibility maps in hill–town development and planning. It is an indispensable tool for planning land management and mitigation strategies. It will also aid the town planners in developing sustainable agriculture practices. It can help in locating regions for future growth in suitable areas of low susceptibility. It can help policymakers in hazard management and disaster planning and preparedness at the taluk level. It can also be further used at the block level with the availability of block boundaries. It can also help in drawing policies against land degradation and watershed deterioration.
Author Contributions
Conceptualization, E.R.S.; Data curation, E.R.S.; Formal analysis, E.R.S. and V.S.; Funding acquisition, E.R.S.; Investigation, E.R.S.; Methodology, E.R.S. and V.S.; Project administration, E.R.S.; Validation, E.R.S.; Writing—original draft, E.R.S.; Writing—review & editing, V.S. Both authors have read and agreed to the published version of the manuscript.
Funding
This research was funded by NRDMS, DST, grant number DST-NRDMS (155/18-2015) and the APC was funded by Hydrology, MDPI.
Data Availability Statement
All the data used in this study will be made available on request to the senior author.
Acknowledgments
This study was supported by DST-NRDMS (155/18-2015). The authors would like to acknowledge the financial support rendered by NRDMS, DST, for the research with thanks. We also would like to thank the Vice-Chancellor of SASTRA Deemed University, Thanjavur, India, for the support and the facilities to carry out this work. We acknowledge the partial support received by the corresponding author from the Virginia Agricultural Experiment Station (Blacksburg) and the Hatch Program of the National Institute of Food and Agriculture, U.S. Department of Agriculture (Washington, D.C.).
Conflicts of Interest
The authors declare no conflict of interest.
References
- Varnes, D.J. Commission on the Landslides of the IAEG, UNESCO. Landslide Hazard Zonation: A Review of Principles and Practice; UN: New York, NY, USA, 1984; Volume 3, p. 61. [Google Scholar]
- Froude, M.J.; Petley, D.N. Global fatal landslide occurrence from 2004 to 2016. Nat. Hazards Earth Syst. Sci. 2018, 18, 2161–2181. [Google Scholar] [CrossRef] [Green Version]
- Lee, S.; Pradhan, B. Probabilistic landslide hazards and risk mapping on Penang Island, Malaysia. J. Earth Syst. Sci. 2006, 115, 661–672. [Google Scholar] [CrossRef]
- Winter, M.G.; Barbara, S.; Derek, P.; David, P.; Clare, H.; Jonathan, S. The economic impact of landslides and floods on road networks. Proc. Eng. 2016, 143, 1425–1434. [Google Scholar] [CrossRef] [Green Version]
- Schuster, R.; Highland, L.M. Socioeconomic and Environmental Impacts of Landslides in Western Hemisphere; U.S. Geological Survey: Denver, CO, USA, 2001. [Google Scholar]
- Perera, E.N.C.; Jayawardana, D.T.; Jayasinghe, P.; Bandara, R.M.S.; Alahakoon, N. Direct impact of landslides on socioeconomic systems: A case study from Aranayake, Sri Lanka. Geoenviron. Disas. 2018, 5. [Google Scholar] [CrossRef]
- Hervás, J.; Bobrowsky, P. Mapping: Inventories, Susceptibility, Hazard and Risk. In Landslides—Disaster Risk Reduction; Springer International Publishing: Berlin, Germany, 2008; pp. 321–349. [Google Scholar]
- Jaiswal, P.; van Westen, C.J. Estimating temporal probability for landslide initiation along transportation routes based on rainfall thresholds. Geomorphology 2009, 112, 96–105. [Google Scholar] [CrossRef]
- Sujatha, E.R.; Rajamanickam, G.V. Landslide Hazard and Risk Mapping Using the Weighted Linear Combination Model Applied to the Tevankarai Stream Watershed, Kodaikkanal, India. Hum. Ecol. Risk Assess. Int. J. 2014, 21, 1445–1461. [Google Scholar] [CrossRef]
- Jaiswal, P.; Van Westen, C.J.; Jetten, V. Quantitative assessment of landslide hazard along transportation lines using historical records. Landslides 2011, 8, 279–291. [Google Scholar] [CrossRef]
- Cloutier, C.; Locat, J.; Jakob, M.; Schornbus, M. Slope Safety Preparedness for Effects of Climate Change. In Proceedings of the Joint Technical Committee JTC-1TR3 Forum, Naples, Italy, 17–18 November 2015. [Google Scholar]
- Gariano, S.L.; Guzzetti, F. Landslides in chaning climate. Earth Sci. Rev. 2016, 162, 227–252. [Google Scholar] [CrossRef] [Green Version]
- Lee, S.; Hong, S.-M.; Jung, H.-S. A Support Vector Machine for Landslide Susceptibility Mapping in Gangwon Province, Korea. Sustainability 2017, 9, 48. [Google Scholar] [CrossRef] [Green Version]
- Sangelantoni, L.; Gioia, E.; Marincioni, F. Impact of climate change on landslides frequency: The Esino river basin case study (Central Italy). Nat. Hazards 2018, 93, 849–884. [Google Scholar] [CrossRef]
- Haque, U.; da Silva, A.P.F.; Devoli, G.; Pilz, J.; Zhao, B.; Khaloua, A.; Wilopo, W.; Andersen, P.; Lu, P.; Lee, J.; et al. The human cost of global warming: Deadly landslides and their triggers (1995–2014). Sci. Total Environ. 2019, 682, 673–684. [Google Scholar] [CrossRef]
- Ayalew, L.; Yamagishi, H. The application of GIS-based logistic regression for landslide susceptibility mapping in the Kakuda-Yahiko Mountains, Central Japan. Geomorphology 2005, 65, 15–31. [Google Scholar] [CrossRef]
- Hasekioğulları, G.D.; Ercanoglu, M. A new approach to use AHP in landslide susceptibility mapping: A case study at Yenice (Karabuk, NW Turkey). Nat. Hazards 2012, 63, 1157–1179. [Google Scholar] [CrossRef]
- Zare, M.; Pourghasemi, H.R.; Vafakhah, M.; Pradhan, B. Landslide susceptibility mapping at Vaz Watershed (Iran) using an artificial neural network model: A comparison between multilayer perceptron (MLP) and radial basic function (RBF) algo-rithms. Arab. J. Geosci. 2013, 6, 2873–2888. [Google Scholar] [CrossRef]
- Eker, R.; Aydın, A. Assessment of Forest Road Conditions in Terms of Landslide Susceptibility: A Case Study in Yĭgılca Forest Directorate (Turkey). Turk. J. Agric. For. 2014, 38, 281–290. [Google Scholar] [CrossRef]
- Pourghasemi, H.R.; Moradi, H.R.; Aghda, S.M.F.; Gokceoglu, C.; Pradhan, B. GIS-based landslide susceptibility mapping with probabilistic likelihood ratio and spatial multi-criteria evaluation models (North of Tehran, Iran). Arab. J. Geosci. 2013, 7, 1857–1878. [Google Scholar] [CrossRef] [Green Version]
- Trigila, A.; Iadanza, C.; Esposito, C.; Mugnozza, G.S. Comparison of Logistic Regression and Random Forests techniques for shallow landslide susceptibility assessment in Giampilieria (NE Sicily, Italy). Geomorphology 2015, 249, 119–136. [Google Scholar] [CrossRef]
- Hong, H.; Naghibi, S.A.; Pourghasemi, H.R.; Pradhan, B. GIS-based landslide spatial modeling in Ganzhou City, China. Arab. J. Geosci. 2016, 9, 1–26. [Google Scholar] [CrossRef]
- Pham, B.T.; Pradhan, B.; Bui, D.T.; Prakash, I.; Dholakia, M. A comparative study of different machine learning methods for landslide susceptibility assessment: A case study of Uttarakhand area (India). Environ. Model. Softw. 2016, 84, 240–250. [Google Scholar] [CrossRef]
- Roodposhti MJShahabi, H.; Safarrad, T. Fuzzy Shannon entropy: Ahybrid GIS-based landslide susceptibility mapping method. Entropy 2016, 18, 343. [Google Scholar]
- Sehgal, V.; Lakhanpal, A.; Maheswaran, R.; Khosa, R.; Sridhar, V. Application of multi-scale wavelet entropy and multi-resolution Volterra models for climatic downscaling. J. Hydrol. 2018, 556, 1078–1095. [Google Scholar] [CrossRef]
- Bijukchhen, S.M.; Kayastha, P.; Dhital, M.R. A Comparative Evaluation of Heuristic and Bivariate Statistical Modeling for Landslide Susceptibility Mappings in Ghurmi-DhadKhola, East Nepal. Arab. J. Geosci. 2013, 6, 2727–2743. [Google Scholar] [CrossRef]
- Kayastha, P.; Dhital, M.R.; Smedt, F.D. Evaluation and Comparison of GIS Based Landslide Susceptibility Mapping Procedures in Kulekhani Watershed, Nepal. J. Geol. Soc. India 2013, 81, 219–231. [Google Scholar] [CrossRef]
- Nandi, A.; Shakoor, A. A GIS-based landslide susceptibility evaluation using bivariate and multivariate statistical analyses. Eng. Geol. 2010, 110, 11–20. [Google Scholar] [CrossRef]
- Pradhan, B.; Mansor, S.; Pirasteh, S.; Buchroithner, M.F. Landslide hazard and risk analyses at a landslide prone catchment area using statistical based geospatial model. Int. J. Remote Sens. 2011, 32, 4075–4087. [Google Scholar] [CrossRef]
- Pradhan, B.; Lee, S. Landslide susceptibility assessment and factor effect analysis: Back propagation artificial neural networks and their comparison with frequency ratio and bivariate logistic regression modelling. Environ. Model. Softw. 2010, 25, 747–759. [Google Scholar] [CrossRef]
- Sujatha, E.R.; Kumaravel, P.; Rajamanickam, V. GIS based Landslide Susceptibility Mapping of Tevankarai Ar Sub-watershed, Kodaikkanal, India using Binary Logistic Regression Analysis. J. Mt. Sci. 2011, 8, 505–517. [Google Scholar]
- Akgun, A. A comparison of landslide susceptibility maps produced by logistic regression, multi-criteria decision, and likelihood ratio methods: A case study at İzmir, Turkey. Landslides 2011, 9, 93–106. [Google Scholar] [CrossRef]
- Kleinbaum, D.G.; Klein, M. Logistic Regression: A Self-Learning Text, 3rd ed.; Springer: New York, NY, USA, 2010; p. 701. [Google Scholar]
- Talaei, R. Landslide susceptibility zonation mapping using logistic regression and its validation in Hashtchin Region, northwest of Iran. J. Geol. Soc. India 2014, 84, 68–86. [Google Scholar] [CrossRef]
- Sujatha, E.R.; Suribabu, C.R. Rainfall Analyses of Coonoor Hill Station of Nilgiris District for Landslide Studies. IOP Conf. Ser. Earth Environ. Sci. 2017, 80, 012066. [Google Scholar] [CrossRef] [Green Version]
- Seshagiri, D.N.; Badrinarayanan, S.; Upendran, R.; Lakshmikantham, C.B.; Srinivasan, V. The Nilgiris Landslide—Miscellaneous Publication No. 57; Geological Survey of India: Kolkata, India, 1982. [Google Scholar]
- Chandrasekaran, S.S.; Sayed Owaise, R.; Ashwin, S.; Jain Rayansh, M.; Prasanth, S.; Venugopalan, R.B. Investigation on in-frastructural damages by rainfall-induced landslides during November 2009 in Nilgiris India. Nat. Hazards 2013, 65, 1535–1557. [Google Scholar] [CrossRef]
- Ganapathy, G.P.; Rajawat, A.S. Use of hazard and vulnerability maps for landslide planning scenarios: A case study of the Nilgiris, India. Nat. Hazards 2015, 77, 305–316. [Google Scholar] [CrossRef]
- Pourghasemi, H.R.; Rahmati, O. Prediction of the landslide susceptibility: Which algorithm, which precision? Catena 2018, 162, 177–192. [Google Scholar] [CrossRef]
- Sujatha, E.R.; Rajamanickam, V. Landslide susceptibility mapping of Tevankarai Ar sub-watershed, Kodaikkanal taluk, India, using weighted similar choice fuzzy model. Nat. Hazards 2011, 59, 401–425. [Google Scholar] [CrossRef]
- Basu, T.; Pal, S. Identification of landslide susceptibility zones in Gish River basin, West Bengal, India. Georisk Assess. Manag. Risk Eng. Syst. Geohazards 2017, 12, 14–28. [Google Scholar] [CrossRef]
- Youssef, A.M. Landslide susceptibility delineation in the Ar-Rayth area, Jizan, Kingdom of Saudi Arabia, using analytical hierarchy process, frequency ratio, and logistic regression models. Environ. Earth Sci. 2015, 73, 8499–8518. [Google Scholar] [CrossRef]
- Van Den Eeckhaut, M.; Vanwalleghem, T.; Poesen, J.; Govers, G.; Verstraeten, G.; Vandekerckhove, L. Prediction of landslide susceptibility using rare events logistic regression: A case study in the Flemish Ardennes (Belgium). Geomorphology 2006, 76, 392–410. [Google Scholar] [CrossRef]
- Bai, S.-B.; Wang, J.; Lü, G.-N.; Zhou, P.-G.; Hou, S.-S.; Xu, S.-N. GIS-based logistic regression for landslide susceptibility mapping of the Zhongxian segment in the Three Gorges area, China. Geomorphology 2010, 115, 23–31. [Google Scholar] [CrossRef]
- Domínguez-Cuesta, M.J.; Jiménez-Sánchez, M.; Berrezueta, E. Landslides in the Central Coalfield (Cantabrian Mountains, NW Spain): Geomorphological features, conditioning factors and methodological implications in susceptibility assessment. Geomorphology 2007, 89, 358–369. [Google Scholar] [CrossRef]
- Hosmer, D.W.; Lemeshow, S. Applied Regression Analysis; John Wiley and Sons: New York, NY, USA, 1989; ISBN 978-0-470-58247-3. [Google Scholar]
- Allison, P.D. Logistic Regression Using the SAS System: Theory and Application; Wiley Interscience: New York, NY, USA, 2001; p. 288. [Google Scholar]
- Cornell, R.G.; Clark, W.A.V.; Hosking, P.L.; Ebdon, D.; Shaw, G.; Wheeler, D.; Wilson, A.G.; Bennett, R.J. Statistical Methods for Geographers. J. Am. Stat. Assoc. 1988, 83, 575. [Google Scholar] [CrossRef]
- Xiao, T.; Segoni, S.; Chen, L.; Yin, K.; Casagli, N. A step beyond landslide susceptibility maps: A simple method to investigate and explain the different outcomes obtained by different approaches. Landslides 2020, 17, 627–640. [Google Scholar] [CrossRef] [Green Version]
- Bisht, D.S.; Chatterjee, C.; Raghuwanshi, N.S.; Sridhar, V. Spatio-temporal trends of rainfall across Indian river basins. Theor. Appl. Clim. 2018, 132, 419–436. [Google Scholar] [CrossRef]
- Yalcin, A. GIS-based landslide susceptibility mapping using analytical hierarchy process and bivariate statistics in Ar-desen (Turkey): Comparisons of results and confirmations. Catena 2008, 72, 1–12. [Google Scholar] [CrossRef]
- Parker, R.N.; Hales, T.C.; Mudd, S.M.; Grieve, S.W.D.; Constantine, J.A. Colluvium supply in humid regions limits the frequency of storm-triggered landslides. Sci. Rep. 2016, 6, 34438. [Google Scholar] [CrossRef] [Green Version]
- Chen, W.; Han, H.; Huang, B.; Huang, Q.; Fu, X. A data-driven approach for landslide susceptibility mapping: A case study of Shennongjia Forestry District, China. Geomat. Nat. Hazards Risk 2018, 9, 720–736. [Google Scholar] [CrossRef]
- He, Q.; Shahabi, H.; Shirzadi, A.; Li, S.; Chen, W.; Wang, N.; Chai, H.; Bian, H.; Ma, J.; Chen, Y.; et al. Landslide spatial modelling using novel bivariate statistical based Naïve Bayes, RBF Classifier, and RBF Network machine learning algorithms. Sci. Total Environ. 2019, 663, 1–15. [Google Scholar] [CrossRef] [PubMed]
- Sørensen, R.; Zinko, U.; Seibert, J. On the calculation of the topographic wetness index: Evaluation of different methods based on field observations. Hydrol. Earth Syst. Sci. 2006, 10, 101–112. [Google Scholar] [CrossRef] [Green Version]
- Sehgal, V.; Sridhar, V.; Tyagi, A. Stratified drought analysis using a stochastic ensemble of simulated and In-Situ soil moisture observations. J. Hydrol. 2017, 545, 226–250. [Google Scholar] [CrossRef] [Green Version]
- Kang, H.; Sridhar, V. Assessment of Future Drought Conditions in the Chesapeake Bay Watershed. JAWRA J. Am. Water Resour. Assoc. 2018, 54, 160–183. [Google Scholar] [CrossRef]
- Raduła, M.W.; Szymura, T.H.; Szymura, M. Topographic wetness index explains soil moisture better than bioindication with Ellenberg’s indicator values. Ecol. Indic. 2018, 85, 172–179. [Google Scholar] [CrossRef]
- Moeslund, J.E.; Arge, L.; Bøcher, P.K.; Dalgaard, T.; Ejrnaes, R.; Odgaard, M.V.; Svenning, J.-C. Topographically controlled soil moisture drives plant diversity patterns within grasslands. Biodivers. Conserv. 2013, 22, 2151–2166. [Google Scholar] [CrossRef]
- Sridhar, V.; Wedin, D.A. Hydrological behaviour of grasslands of the Sandhills of Nebraska: Water and energy-balance assessment from measurements, treatments, and modelling. Ecohydrology 2009, 2, 195–212. [Google Scholar] [CrossRef]
- Sridhar, V. Tracking the Influence of Irrigation on Land Surface Fluxes and Boundary Layer Climatology. J. Contemp. Water Res. Educ. 2013, 152, 79–93. [Google Scholar] [CrossRef]
Figure 1.
Location map of the study area showing the Digital Elevation Model of Coonoor Taluk, Tamil Nadu, India.
Figure 1.
Location map of the study area showing the Digital Elevation Model of Coonoor Taluk, Tamil Nadu, India.

Figure 2.
Spatial Databases of Factors Causing Landslides in Coonoor, Tamil Nadu. (a) Aspect (b) Slope (c) Relative Relief (d) Topographic Wetness Index-TWI (e) Soil (f) Land Use (g) Settlement-2006 (h) Settlement-2016 (i) Average Annual Precipitation.
Figure 2.
Spatial Databases of Factors Causing Landslides in Coonoor, Tamil Nadu. (a) Aspect (b) Slope (c) Relative Relief (d) Topographic Wetness Index-TWI (e) Soil (f) Land Use (g) Settlement-2006 (h) Settlement-2016 (i) Average Annual Precipitation.


Figure 3.
Landslide Susceptibility Map of Coonoor Taluk of Nilgiris District, India using Logistic Regression Model.
Figure 3.
Landslide Susceptibility Map of Coonoor Taluk of Nilgiris District, India using Logistic Regression Model.

Figure 4.
Prediction and Success Rate of the Logistic Regression Model using Area Under the Curve Method.
Figure 4.
Prediction and Success Rate of the Logistic Regression Model using Area Under the Curve Method.


Table 1.
Common Physical and Environmental Factors causing Landslides used in Literature.
| Factor | Reference |
|---|---|
| Aspect | Sujatha and Rajamanickam (2011) [40]; Akgun (2012) [32]; Eker and Aydin (2014) [19]; Talaei (2014) [34]; Lee et al. (2017) [13]; Pourghasemi and Rahmati (2018) [39] |
| Slope | Sujatha and Rajamanickam (2011) [40]; Akgun (2012) [32]; Eker and Aydin (2014) [19]; Talaei (2014) [34]; Lee et al. (2017) [13]; Basu and Pal (2018) [41]; Youssef (2015) [42]; Pourghasemi and Rahmati 2018 [39] |
| Relief | Sujatha and Rajamanickam (2011) [40]; Eker and Aydin (2014) [19]; Talaei (2014) [34]; Youssef (2015) [42]; Pourghasemi and Rahmati 2018 [39] |
| Relative Relief | Qui et al., 2018 |
| Curvature | Sujatha and Rajamanickam (2011) [40]; Eker and Aydin (2014) [19]; Talaei (2014) [34]; Youssef (2015) [42]; Lee et al. (2017) [13]; Pourghasemi and Rahmati 2018 [39] |
| Soil | Sujatha and Rajamanickam (2011) [40]; Lee et al. (2017) [13] |
| Geology | Eker and Aydin (2014) [19]; Talaei (2014) [34]; Youssef (2015) [42]; Lee et al. (2017) [13]; Pourghasemi and Rahmati 2018 [39] |
| Distance from Fault/Lineament | Sujatha and Rajamanickam (2011) [40]; Akgun (2012) [32]; Talaei (2014) [34]; Youssef (2015) [42]; Lee et al. (2017) [13] |
| Distance from Streams | Akgun (2012) [32]; Talaei (2014) [34]; Youssef (2015) [42]; Pourghasemi and Rahmati 2018 [39] |
| Drainage Density | Pourghasemi and Rahmati 2018 [39] |
| Topographic Wetness Index (TWI) | Sujatha and Rajamanickam (2011) [40]; Lee et al. (2017) [13] |
| Stream Power Index (SPI) | Lee et al. (2017) [13] |
| Land use | Sujatha and Rajamanickam (2011) [40]; Eker and Aydin (2014) [19]; Talaei (2014) [34]; Lee et al. (2017) [13]; Pourghasemi and Rahmati 2018 [39]; Haque et al. (2019) [15] |
| NDVI | Youssef (2015) [42] |
| Distance from Roads | Sujatha and Rajamanickam (2011) [40]; Akgun (2012) [32]; Talaei (2014) [34]; Youssef (2015) [42]; Pourghasemi and Rahmati 2018 [39] |
| Peak Ground Acceleration | Talaei (2014) [34] |
| Rainfall | Talaei (2014) [34]; Yousef (2015); Haque et al. (2019) [15] |
Table 2.
Multi-Collinearity Analysis of the selected Predictor Variables.
| Predictor Variable | Aspect | Slope | Relative Relief | TWI | Soil Type | Land Use | Average Annual Rainfall |
|---|---|---|---|---|---|---|---|
| Tolerance | 0.852 | 0.899 | 0.951 | 0.569 | 0.815 | 0.624 | 0.617 |
| VIF | 1.173 | 1.112 | 1.052 | 1.758 | 1.228 | 1.603 | 1.409 |
Table 3.
Factors selected for modelling landslide susceptibility and their estimated coefficient.
| Variables | βi | SE | Wald | df | Sig. | Exp(βi) |
|---|---|---|---|---|---|---|
| Aspect | −2.542 | 0.762 | 11.119 | 1 | 0.001 | 0.079 |
| Slope | 1.204 | 0.954 | 1.593 | 1 | 0.207 | 3.334 |
| Relative Relief | −6.288 | 1.298 | 23.453 | 1 | 0.000 | 0.002 |
| TWI | −3.044 | 1.198 | 6.458 | 1 | 0.011 | 0.048 |
| Soil | 0.995 | 0.153 | 42.556 | 1 | 0.000 | 2.705 |
| Land use | 1.885 | 0.534 | 12.078 | 1 | 0.001 | 6.391 |
| Average Annual Rainfall | 2.081 | 0.170 | 150.038 | 1 | 0.000 | 8.014 |
| Constant | 2.765 | 2.317 | 1.425 | 1 | 0.233 | 15.886 |
Table 4.
Classification Summary.
| Observed | Predicted | Percentage Correct | ||
|---|---|---|---|---|
| Landslides | ||||
| Non-Occurrence | Occurrence | |||
| Landslides | Non-Occurrence | 605 | 30 | 95.3 |
| Occurrence | 26 | 239 | 90.2 | |
| Overall Percentage | 93.4 | |||
Cut-off value = 0.50.
Table 5.
Landslide Density Function for the Susceptibility Classes using Validation Landslide Dataset.
Table 5.
Landslide Density Function for the Susceptibility Classes using Validation Landslide Dataset.
| Susceptibility Class | Area Pixels | Landslide Pixels | Area Ratio | Landslide Ratio | Landslide Density Function |
|---|---|---|---|---|---|
| Very Low | 45,240 | 0 | 0.000 | 0.177 | 0.00 |
| Low | 61,739 | 14 | 0.040 | 0.241 | 0.17 |
| Moderate | 56,364 | 48 | 0.138 | 0.220 | 0.63 |
| High | 47,406 | 117 | 0.336 | 0.185 | 1.81 |
| Very High | 44,951 | 169 | 0.486 | 0.176 | 2.76 |
Publisher’s Note: MDPI stays neutral with regard to jurisdictional claims in published maps and institutional affiliations. |
© 2021 by the authors. Licensee MDPI, Basel, Switzerland. This article is an open access article distributed under the terms and conditions of the Creative Commons Attribution (CC BY) license (http://creativecommons.org/licenses/by/4.0/).
Share and Cite
MDPI and ACS Style
Sujatha, E.R.; Sridhar, V. Landslide Susceptibility Analysis: A Logistic Regression Model Case Study in Coonoor, India. Hydrology 2021, 8, 41. https://0-doi-org.brum.beds.ac.uk/10.3390/hydrology8010041
AMA Style
Sujatha ER, Sridhar V. Landslide Susceptibility Analysis: A Logistic Regression Model Case Study in Coonoor, India. Hydrology. 2021; 8(1):41. https://0-doi-org.brum.beds.ac.uk/10.3390/hydrology8010041
Chicago/Turabian StyleSujatha, Evangelin Ramani, and Venkataramana Sridhar. 2021. "Landslide Susceptibility Analysis: A Logistic Regression Model Case Study in Coonoor, India" Hydrology 8, no. 1: 41. https://0-doi-org.brum.beds.ac.uk/10.3390/hydrology8010041
Note that from the first issue of 2016, this journal uses article numbers instead of page numbers. See further details here.