Article

Quantitative Classification of Desertification Severity for Degraded Aquifer Based on Remotely Sensed Drought Assessment

by
Pantelis Sidiropoulos
1,
Nicolas R. Dalezios
1,
Athanasios Loukas
2,*,
Nikitas Mylopoulos
1,
Marios Spiliotopoulos
1,
Ioannis N. Faraslis
3,
Nikos Alpanakis
1 and
Stavros Sakellariou
1
1
Department of Civil Engineering, School of Engineering, University of Thessaly, 38334 Volos, Greece
2
Department of Rural and Surveying Engineering, Faculty of Engineering, Aristotle University of Thessaloniki, 54124 Thessaloniki, Greece
3
Department of Environmental Sciences, School of Technology, University of Thessaly, 41110 Larisa, Greece
*
Author to whom correspondence should be addressed.
Submission received: 31 December 2020 / Revised: 7 March 2021 / Accepted: 10 March 2021 / Published: 17 March 2021
(This article belongs to the Special Issue Drought and Water Scarcity: Monitoring, Modelling and Mitigation)

Abstract

:
Natural and anthropogenic causes jointly lead to land degradation and eventually to desertification, which occurs in arid, semiarid, and dry subhumid areas. Furthermore, extended drought periods may cause soil exposure and erosion, land degradation and, finally, desertification. Several climatic, geological, hydrological, physiographic, biological, as well as human factors contribute to desertification. This paper presents a methodological procedure for the quantitative classification of desertification severity over a watershed with degraded groundwater resources. It starts with drought assessment using Standardized Precipitation Index (SPI), based on gridded satellite-based precipitation data (taken from the CHIRPS database), then erosion potential is assessed through modeling. The groundwater levels are estimated with the use of a simulation model and the groundwater quality components of desertification, based on scattered data, are interpolated with the use of geostatistical tools. Finally, the combination of the desertification severity components leads to the final mapping of desertification severity classification.

1. Introduction

Soil is a nonrenewable resource which can be easily destroyed under continuously increasing pressure. Under natural conditions, the changes in soil occur slowly while a balance exists between the rates of soil formation and the rates of its changes and losses. Rational management of soil resources may sustain or even improve its productive ability for a long time, otherwise it may take even centuries to be recreated through edaphogenesis processes. The soil is an open natural system, which interacts with the environment and faces continuous changes of various rates based on the intensity of the inputs as well as of the outputs affecting the environment and its sustainability. Nevertheless, land degradation is characterized by a combination of changes in the physical, biological, and chemical soil properties, which lead to erosion, loss of the soil productivity ability and, in most cases, to desertification [1]. Indeed, irrational land use, due to human intervention, leads to land degradation and desertification, which are directly related to the low productivity of the land and the exhaustion of available water resources.
Areas under desertification are different from desert areas, such as the Sahara and Kalahari deserts, where drought is the main factor causing desert conditions without considering other environmental factors [2]. In the Mediterranean region, for instance, desertification processes become active and are accelerated only when the soil parameters, despite climatological restrictions, reach critically low limits due to human activities [3]. As a result, desertification is spatially and temporally discontinuous and affects over 250 million people. Combating desertification has become an extremely significant priority in order to preserve the long-term productivity of populated drylands. Specifically, one-quarter of Earth’s land is at risk due to desertification, which corresponds to an area of over 3.6 billion hectares [4]. Moreover, since 1990, land degradation has caused the loss of six million hectares of productive land annually [5,6]. Thus, it is worth mentioning that a population of almost one billion is at risk due to desertification in over 100 countries.
The joint effect of natural and anthropogenic causes may lead to land degradation and, eventually, desertification. Desertification is the result of the combined effect of several factors, namely climate, hydrology, soil, geology, biology, physiography, as well as of the human activities [7]. Extended drought periods may cause soil exposure and erosion, leading to land degradation and, eventually, desertification. The lack or deficit of precipitation leads to droughts, which signifies a considerable threat to the protection of certain environments, such as the Mediterranean ecosystem. Specifically, in the Mediterranean region, the environmental conditions will be intensified due to climate change impacts [8,9]. In arid and semiarid regions, there is high risk of land degradation and desertification and along with the climate change and human activities, become a vicious circle. There are physical and chemical processes resulting in desertification. Physical degradation occurs on sloping land, causing extensive soil erosion within the semiarid and dry subhumid zones, resulting in the loss of more than 60% of the vegetative cover. On the other hand, the main chemical desertification process consists of secondary soil salinization due to irrational irrigation water management. As a result, soluble salts within irrigation waters may exceed critical thresholds. Moreover, leaching requirements may not be met by irrigation scheduling, and intrusion of seawater may occur due to overpumping of coastal aquifers [10,11,12]. Chemical desertification affects fertile agricultural land and it is usually localized in alluvial plains. Nevertheless, chemical desertification is not very extensive in the Mediterranean region. Here, MEDALUS [13] is the most commonly used tool for assessing desertification at national, regional, and local scales. It has also been applied in Greek regions [14]. It is based on soil characteristics, vegetation, climate, and management indicators. However, it has been developed for large spatial scales and does not take into consideration groundwater depletion and groundwater chemical status.
This paper presents a methodological procedure for the classification of desertification severity over a small-scale region of a degraded aquifer [2]. The methodology uses and evaluates, among other factors that are responsible for desertification, groundwater depletion and groundwater chemical status. At the first stage, physical desertification is considered. Specifically, starting from drought assessment by employing widely used indices, erosion assessment is then considered based on modeling of the soil loss function. The development of composite maps of these two factors over the study region leads to quantitative classification of the desertification severity. At the second stage, the mapping of groundwater levels is based on groundwater modeling. This is followed by the consideration of the chemical desertification component through the analysis and mapping of water quality field data and measurements. Then, composite mapping of stage two factors is added to the produced mapping of stage one, leading to the final classification of the desertification severity. The paper is formed under the following structure: Section 2 involves materials and methods, which includes several subsections as follows: Section 2.1 presents a conceptual and comprehensive description of desertification including causes, factors, stages, assessment methods and mitigation; Section 2.2 briefly describes drought concepts, types, quantification, indices and features; Section 2.3 presents the two-stage methodology for the desertification severity classification, including the study area and the relevant database, the physical and chemical desertification, and the classification of desertification risk. Finally, Section 3 covers the analysis and discussion of the desertification severity classification results in the study area.

2. Materials and Methods

2.1. Concepts and Features of Desertification Hazard

Desertification is a slow developing environmental hazard and consists of land degradation in arid, semiarid, and dry subhumid areas [5,15]. This is a general definition which does not fully address the interaction between climatic factors and human activities—the latter are often decisive factors in triggering the desertification processes. Land degradation leads to the reduction or loss of biological or economic productivity and the complexity of rainfed cropland, irrigated cropland or range, pasture, forest, and woodland. Nevertheless, soil erosion is a natural process that is essential for soil formation. Regarding the land degradation problem, most of the concerns about erosion are related to accelerated erosion, when the natural rate has been significantly increased by human activity. In fact, soil erosion by water is a widespread problem throughout Europe.
It is important to identify the areas at risk of desertification, and proceed into a quantitative classification of the desertification severity. The characteristics of such areas include low annual rainfall depth, high annual potential evapotranspiration, uneven precipitation distribution in space and time, increased intensity and high corrosion ability of rainfall, high soil moisture deficit, and high temperatures during the vegetative growing season. Section 2.1 presents a brief description of the concepts and features of the desertification hazard. Firstly, the causes and factors contributing to desertification are analyzed. This is followed by the outline of the desertification process stages. Then, the assessment and modeling methods are described, followed by the proposal of mitigation measures to combat desertification.

2.1.1. Causes, Factors, and Stages of Desertification

Desertification can be the result of either natural or anthropogenic causes, or a combination of both. The causes of natural desertification include geomorphological features of soil erosion processes, dry climatic conditions, water balance, as well as the historical aspects of a region [15]. In addition, the anthropogenic causes include urbanization, overexploitation and forest fires, overexploitation of surface and groundwater resources, agricultural intensification, overgrazing, urban and industrial expansion, as well as socioeconomic factors. However, the identification of the factors contributing to desertification is a complex process, since the factors pointed out as the main originators of land degradation are the most variable ones, such as climatic changes, deforestation, predatory exploitation, extensive cultivation, industrialization, and urbanization [16]. Desertification can thus be triggered by several factors, such as the effects of drought, population increase, geological and soil erosion, livestock pressures, nutrient mining, land abandonment and inequitable distribution of resources, poor infrastructure and market access, or poor agricultural and environmental policy framework. The factors of climate, hydrology, soil, geology, biology, physiography, and human activities, reported to cause desertification, are briefly presented in the following paragraphs [3].
Climate. Desertification processes are affected by the interaction between climate and desertification at various scales through its impact on dryland soils and vegetation as well as on the hydrological cycle in drylands [4]. The threat of climate change intensifies the problem, since lack or deficit of precipitation is the major driving force and feature of drought. Moreover, dryland soils often have low organic matter content and are frequently saline and/or alkaline. Desertification affects global climate change through soil and vegetation losses. Dryland soils contain a lot of carbon, which could be released into the atmosphere due to desertification, with significant consequences for the global climate system. The effect of global climate change on desertification is complex and not yet sufficiently understood. At first, higher temperatures can have a negative impact through increased loss of water from the soil and reduced rainfall in drylands. Similarly, an increase in carbon dioxide in the atmosphere can boost plant growth for certain species. Climate change may increase the desertification and aridity risk in vulnerable regions; however, biodiversity loss causes an impact on desertification, which is difficult to assess [4]. The Aridity Index (AI) is used to define arid, semiarid, and dry subhumid areas, other than polar and subpolar regions. AI is the ratio of annual precipitation (P) to potential evapotranspiration (PET), ranging from 0.03 to 0.65 (Table 1). In general, when the ratio is lower than 0.03, this indicates permanent desertification, whereas when the ratio is higher than 0.65 indicates no desertification [2,15].
Geology and Soils. The properties of rocks involve permeability, soil corrosion, and the rate of weathering of rocks, which may affect the desertification process. These rocks are limestones and marls of hilly land, where the soil is shallow and sensitive to drought. The acid fumes and volcanic rocks slowly form into soils that have coarse composition. Furthermore, desertification occurs when the soil is not able to provide rooting space and/or water and nutrients to plants. Soil performance is connected to desertification with soil formation rate, water holding capacity, plant nutrient availability, and soil erodibility. The soil characteristics which affect desertification rate and processes and are considered to be indicators of desertification risk are soil depth, soil texture, soil moisture, soil fertility, organic matter, surface infiltration, hydraulic conductivity, and field capacity.
Moreover, physiography affects significantly the three desertification processes, which favor the aforementioned features, namely erosion, salinity, and aridity. Desertification also depends on the slope gradient, aspect, and shape of land. Specifically, two formulae are presented, soil loss rate (Equation (1)) and erosion (Equation (2)), respectively, as follows:
E 1 = c × S a
E 2 = b × L m
where E1 is the soil loss; S is the slope gradient; E2 is the erosion; L is the slope length; and c, a, b, m are empirical coefficients [15]. By removing the most fertile topsoil, erosion reduces soil productivity and, where soils are shallow, may lead to a permanent loss of natural farmland. The erosion rate is very sensitive to both climate and land use. For example, the Mediterranean region is most vulnerable to erosion because it is subject to long dry periods followed by heavy bursts of erosive rain, falling on steep slopes with fragile soils [17].
Hydrology. The land phase of the water cycle, assessed through water balance, signifies the driving force with impacts on desertification. This process is limited by the available water supplies to satisfy the needs of the living organisms, such as plants and animals. The components of the hydrological cycle, such as surface runoff, infiltration, deep percolation to groundwater, as well as groundwater flow to the sea, are significant for desertification, especially in vulnerable areas. Furthermore, water losses may occur due to the permeability of limestone rocks, groundwater exploitation, sparse vegetation cover, industrial and urban demand, environmental pollution, and sedimentation. Irrigation replenishes the soil moisture and results in plant growth and could be used to prevent these areas from desertification.
Biology. The most dominant biotic land component that affects desertification is the vegetative cover of land, which is also the best possible indicator for desertification. A region is characterized by a desertification trend when the reduction of vegetation cover is persistent and more areas gradually become barren. A distinction should be made with seasonality and the rainfall variability in drylands, which also result in increased variability of vegetation cover. Nevertheless, there are relationships between climate, soil, and vegetation in an area, which affect vegetation cover. Areas with precipitation lower than 280 mm (P < 280 mm) and high evapotranspiration rate result in the reduction of water availability and gradually transform into bare soil land. Areas with rainfed crops (Table 2) are also vulnerable to erosion and desertification since the reduced protection by vegetation cover cannot prevent effective rainfall intensity at the ground surface [5].
Human activities. The main anthropogenic factors are considered to be of socioeconomic nature. One factor is the population growth and the continuous increase in water demand leading also to environmental pollution. Human intervention may also cause intensification of agriculture since overexploitation of plant biomass and irrational cultivation of hilly lands results in soil erosion. Land degradation is the result of deforestation and reduction of vegetative cover because of forest fires, overgrazing, land abandonment, and irrational land development. Deforestation provokes the increase in surface runoff toward the sea, which leads to the reduction of available resources, resulting in salinization of groundwater aquifers and seawater intrusion in coastal aquifers. Ineffective irrigation planning causes redundancy and losses of irrigated water leading to soil salinity [17]. Policy and institutional failures may also cause problems of water scarcity, groundwater depletion, soil erosion, and salinization. The human causes of desertification are not fully understood. Changing paradigms and varying views among researchers mean that there is no consensus yet on how human factors play a role in desertification [17]. Driving forces to desertification may be several recurrent core variables, such as climatic and economic factors, institutions, national and regional policy framework, or population growth [18]. For each location, desertification could be triggered by a set of factors, as well as feedback mechanisms, which may lead to change of land use [15].

2.1.2. Stages of the Desertification Process

Based on the causes and factors that contribute to drought and desertification, the stages and the processes that lead to desertification are summarized as follows:
Stage 1: Soil degradation. In this stage, the main issue is the reduction of the vegetation coverage over an area, which results in the raindrops falling on the ground to reach the surface.
Stage 2: Reduction of the organic matter and deterioration of the soil structure. The organic matter is the connecting factor between the soil particles. The reduction and, eventually, absence of organic matter can cause the weakening of the soil agglomerates and the reduction in biomass production.
Stage 3: Dispersion of soil agglomerates. The soil particles are separated into smaller ones, due to the falling raindrops. The degradation of the soil surface structure produces a chain of negative effects, starting from the reduction of biomass production and the subsequent loss of a significant amount of water for plants.
Stage 4: Runoff and sediment transfer. The process depends basically on rainfall, but it can also occur due to the wind. With respect to rainfall, the process can lead to surface runoff, as expected. The gradient of erosion may also be observed even after the rainfall. The erosion can result in the reduction of the biomass production and the decrease of the available depth in the root zone, as there is depletion in the organic matter and nutrients.
Stage 5: Soil degradation and desertification. The loss of soil volume and decrease in soil moisture to the extent that any living form of organism, which is useful for the human and its environment, can survive.

2.1.3. Methodologies and Simulation

A large range of methodologies and simulation attempts have been implemented within research activities related to desertification. Such methodologies include numerical models and simulation of the dynamics of the atmosphere, oceans and energy exchange between atmosphere-continent and atmosphere-ocean; short-term forecasting; assessment of long-term changes in climatic parameters, such as changes in land use and emission of green-house gases; climate change impacts to desertification; simulation of climate variability and extreme events with emphasis on small-scale effects; assessment of topography and geomorphology impact on high-resolution downscaling methods; and use of multiple indices to evaluate desertification in areas with large water deficits (PET > P). Existing desertification assessment and monitoring methods are also considered incorporating remote sensing data and methods; spatial modeling of the desertification severity risk in sensitive areas; mapping of the main processes causing desertification; and development of desertification classification schemes in sensitive areas [15]. Many dryland areas are subject to wind and water erosion. However, just wind erosion observation cannot assess the desertification affected area. Only when the frequency and magnitude of dust storms increase is there a clear indication of ongoing land degradation. Another indicator that has been used to identify land degradation is crop yield variability. However, yield data are not necessarily indicative of desertification.

2.1.4. Mitigation of Desertification

Desertification must be faced as a global problem and requires direct actions and measures. An integrated land use plan, alternative systems for the exploitation of natural resources, rational use, and management of water resources, protection from soil erosion, as well as forest protection, constitute some of the necessary actions. Mitigation must be effective even from the first stage of desertification. The prevention of land degradation, which leads to desertification, depends on the proper identification of the processes involved, as well as on accurate analysis and understanding of the causes and potential effects in specific areas. Integrated methodologies for land and water management are key measures for desertification prevention. Specifically, sustainable land use can prevent poor irrigation practices, overgrazing, or overexploitation of plants, which intensify dryland vulnerability. Nevertheless, improved water management measures can improve water-related services. In addition, key preventive measures against desertification include improving groundwater recharge through soil-water conservation or maintaining vegetative cover to protect the soil from wind and water erosion.

2.2. Physical Desertification: Drought

There is no precise and universally accepted definition of drought because there is a wide range of sectors of the economy affected by drought and water demand for different uses [19]. By considering drought as a hazard, there is a tendency to define and classify droughts. The definitions of drought are classified either as conceptual or operational. Conceptual definitions are general, whereas the operational definitions contribute more to the identification of the severity and the duration of drought, and are more useful in drought assessment and planning.

2.2.1. Drought Concepts and Types

In international literature, three operational definitions (or types) of drought are considered, namely meteorological or climatological, agricultural or agrometeorological, and hydrological drought [20]. A fourth type of drought, socioeconomic drought can also be considered. All types of drought begin with a deficiency of precipitation in a region over a period. Meteorological drought is considered during the early stages, where there is accumulated departure of precipitation from normal or expected [6,21,22]. If these dry conditions continue over a longer period, occasionally in association with high winds, above-normal temperatures and low relative humidity, impacts on agriculture and hydrology are expected. Agricultural drought refers to the agricultural impacts resulting from deficiencies in the water availability for agricultural use. The agricultural drought is described in terms of crop failure and exists when soil moisture is depleted so that crop yield is reduced considerably. More specifically, soils with low water holding capacity are typical of drought-prone areas and are more vulnerable to agricultural drought. Similarly, hydrological drought is considered to be a period during which the actual water supply, either surface water or groundwater, is less than the minimum water supply necessary for normal operations in a particular region (and/or watershed). Agricultural and hydrological droughts emphasize the interaction between the natural characteristics of meteorological drought and human activities that depend on precipitation [21,22,23]. Nevertheless, the relationship between the different drought types is complex.

2.2.2. Drought Quantification and Features

Drought indicators are variables describing drought features and are used to quantify droughts [21,22,24]. Climatic variables are used for meteorological, agricultural, or hydrological drought indicators, such as temperature and precipitation, stream flows, soil moisture, reservoir storage, groundwater levels, snowpack, and vegetation. Data analysis, interpretation, and aggregation leads to drought indicators and/or indices [19,25,26]. The validity of an index should be evaluated, along with its relationship to geophysical and statistical features of drought [21,27]. Drought indices are extensively used in drought quantification and assessment [15,22,28,29]. Several drought features are usually measured and monitored, such as severity, periodicity, duration, onset, end time and areal extent [9,22,30].

2.3. Desertification Classification Methodology

This section, firstly, presents the study area and the database used. Then, the two-stage methodology is presented. Specifically, the first stage consists of the initial assessment of desertification severity risk, which includes drought severity assessment, soil degradation assessment and initial classification of desertification risk. The second stage consists of the assessment of critical areas to desertification and includes the assessment of groundwater levels, water chemical and spatial analysis, and classification of the desertification risk.

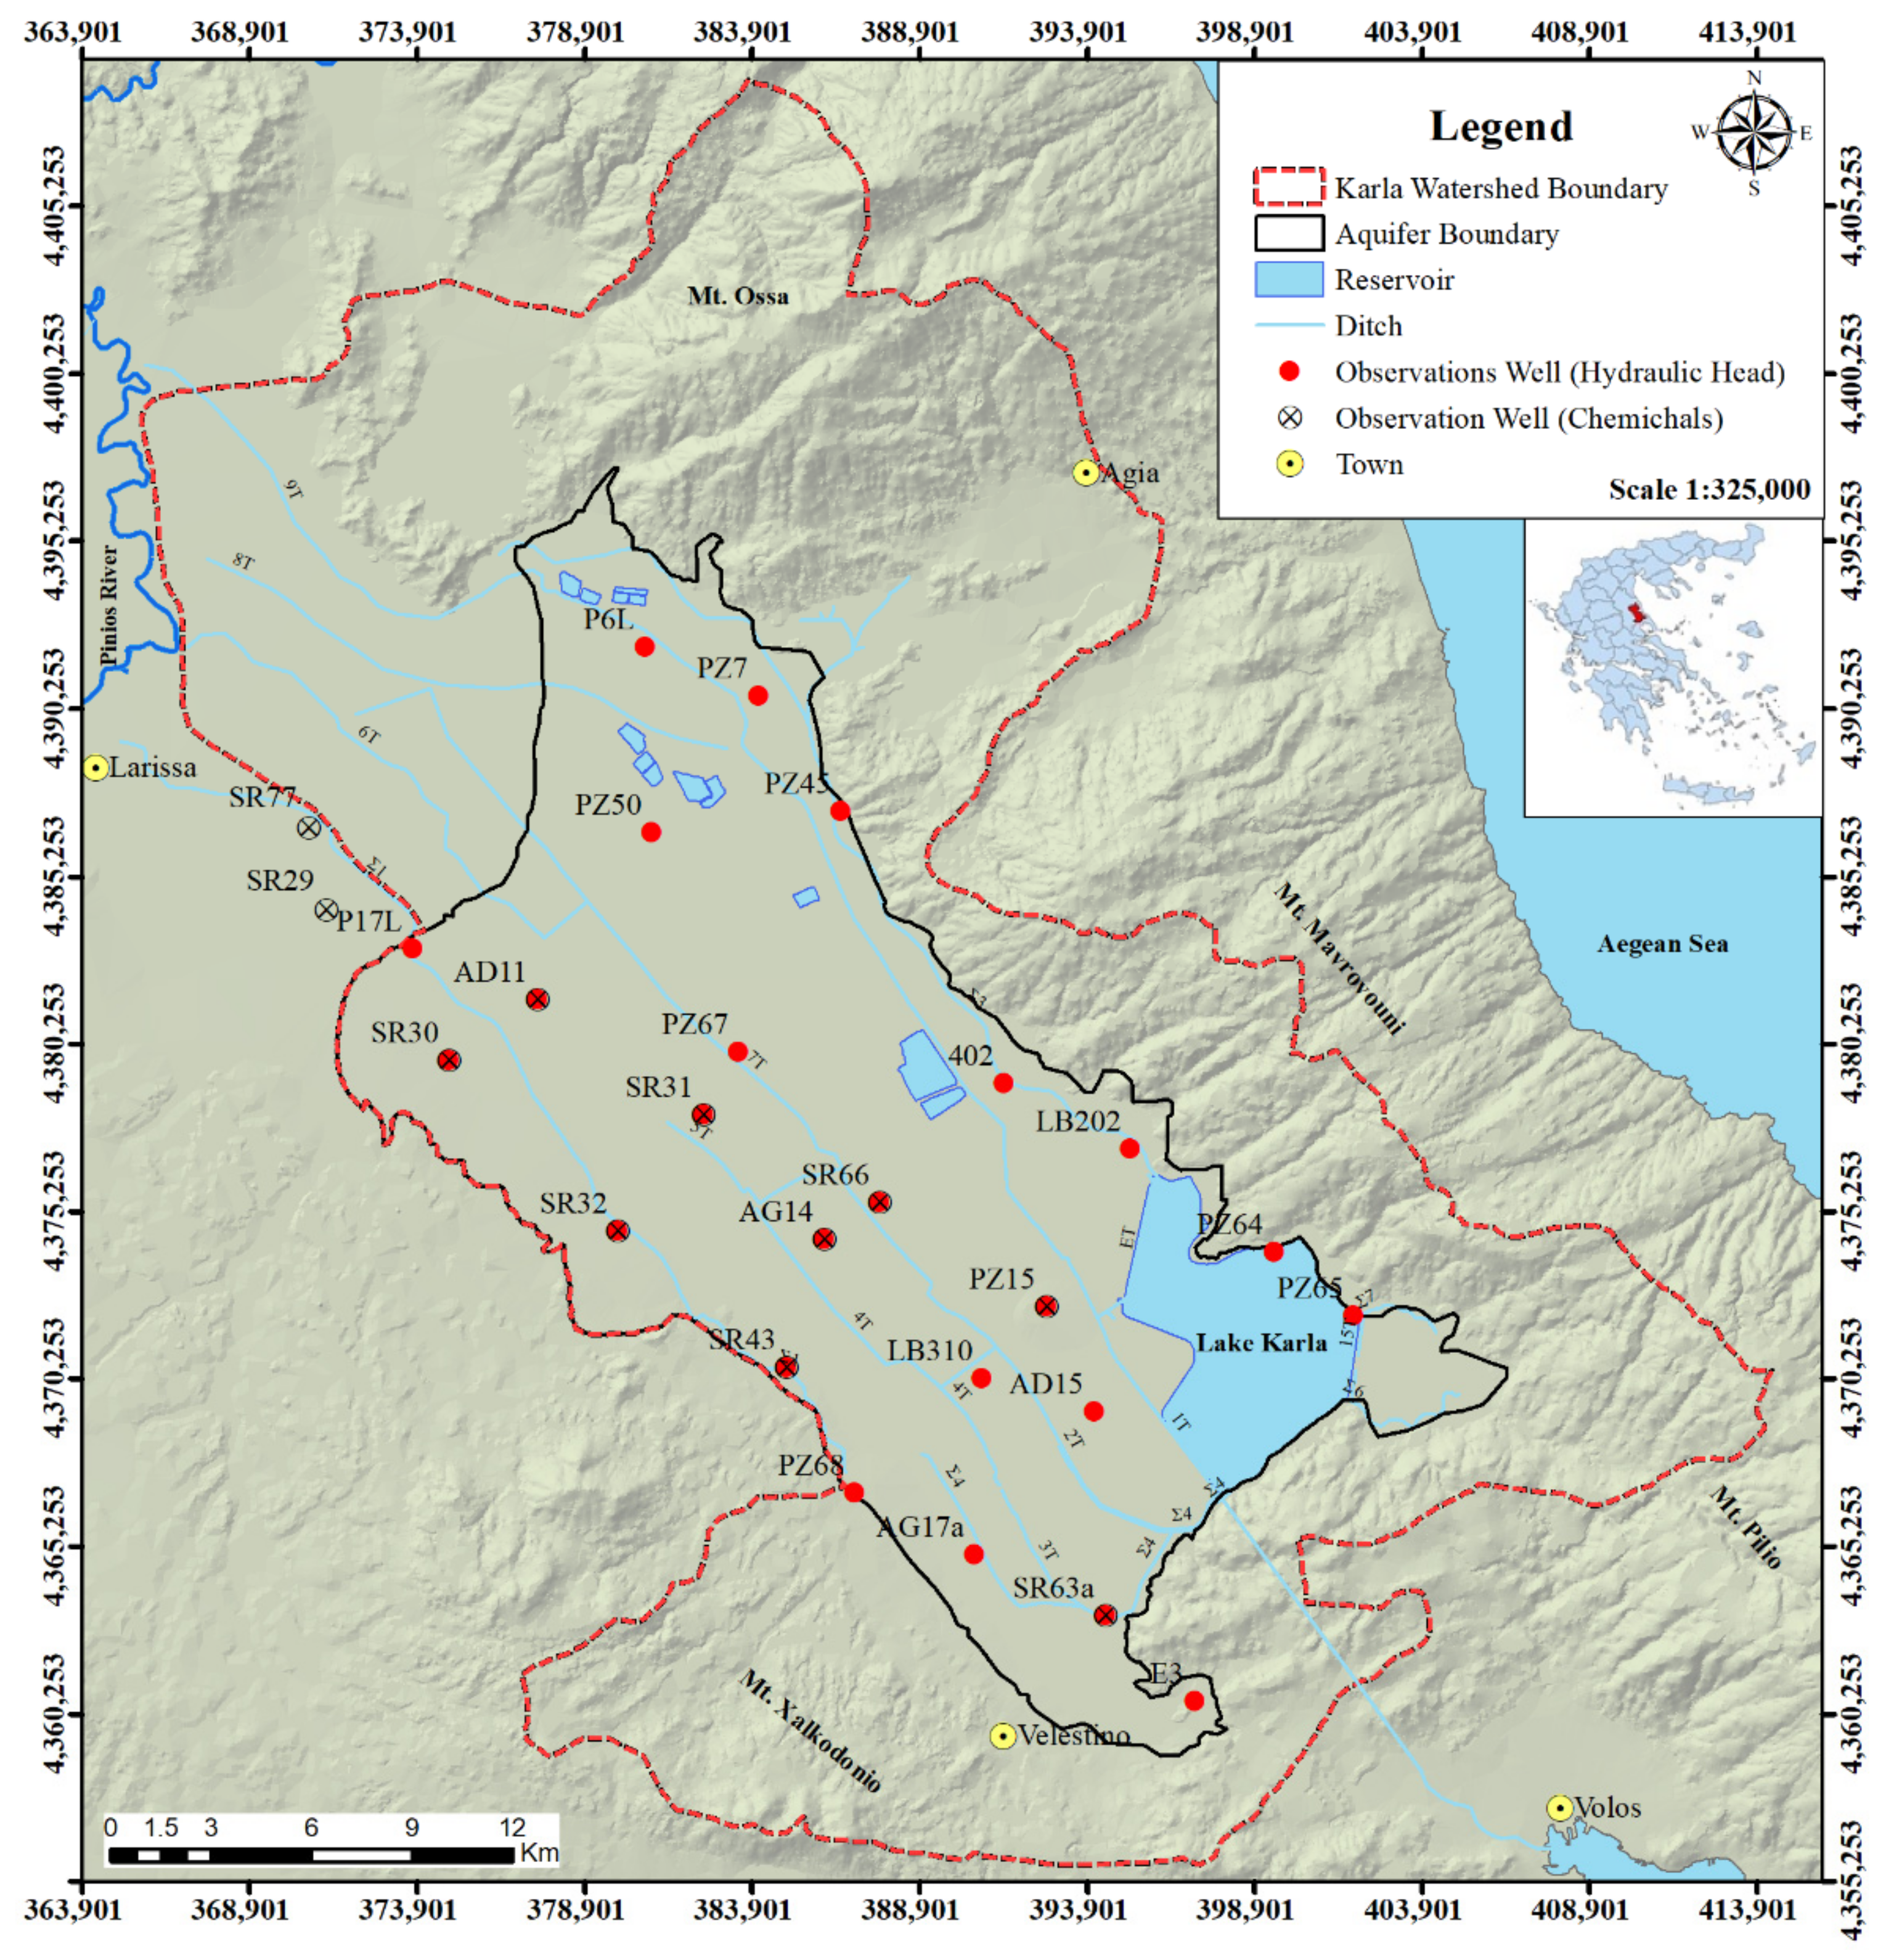
2.3.1. Study Area and Database

Thessaly is a region located in central Greece with an area of about 13,700 km2 and has a large central plain surrounded by mountains. The elevation varies from sea level at the east (Aegean Sea) to more than 2800 m at the eastern and western areas where mountains prevail. The mean elevation is approximately 500 m. The major basins of Thessaly are the Pinios River basin and the Lake Karla basin. The western and central parts of the region have continental climate with cold winters and hot and dry summers and the temperature difference between these two seasons is large. The climate is characterized as typical Mediterranean in the eastern part of Thessaly. Mean annual precipitation of the Thessaly region is about 700 mm and unevenly distributed in space and time. Mean annual precipitation ranges from 400 mm at the central plain to more than 1800 mm at the western mountains. From June to August, rainfall is usually rare.
The Thessaly plain is Greece’s most productive rural region with an area of approximately 4000 km2. Cotton, wheat, and maize are the main crops cultivated in the plain. Apricot, apple, cherry, grapes, and olive trees are cultivated at the eastern hills. Thessaly plain is crossed by Pinios River and its tributaries and extends to about 9500 km2. The water of Pinios River is mainly used for irrigation. The extensive and intense cultivation of cotton and maize crops has led to a significant increase in water demand, which is mostly covered by overexploitation of groundwater.
The grainy, phreatic aquifer of Lake Karla watershed consists of alluvial deposits, which are extended to great depths down to the aquitard rocks of impermeable marbles and schist. It is located at the furthermost eastern part of the Thessaly plain, between the cities of Volos and Larisa (Figure 1). The study area of 500 km2 is extensively cultivated with water demanding crops such as maize, cotton, and alfalfa. About 98% of the groundwater resources are used to cover the irrigation needs through unregistered private pumping wells [10]. At the north of the area, an old irrigation network exists which is consisted of small reservoirs and open channels. About 20 hm3/year of surface water is distributed through the irrigation network to the adjacent cultivations. This irrigation network has been built about 50 years ago [11]. Furthermore, high values of nitrogen pollutants have been observed in the groundwater, due to the intensive and extensive agricultural cultivation and the excessive application of fertilizers and pesticides, leading to groundwater qualitative degradation [12]. The former natural Lake Karla had been drained in the 1960s, causing serious environmental problems in the area. A reservoir for the restoration of Lake Karla has been recently constructed to reverse the bad environmental status. The Lake Karla reservoir project construction has been completed in 2018.
The water levels and the water quality of the Lake Karla aquifer have been monitored through a network of monitoring stations (Figure 1). The reasons for the implementation of the monitoring stations network are (i) the area has been characterized as a vulnerable zone, with respect to nitrogen pollution from agricultural run-offs, according to the requirements of the Directive 91/676/EEC (transposed into national legislation with Joint Ministerial Decision 161890/1335/1997), (ii) the area suffers from quantitative and qualitative degradation of groundwater. Twenty-four (24) well stations, in total, monitored groundwater levels from 1980 until 2015 (Figure 1). Groundwater chemicals are monitored from eleven (11) stations from 2000 until 2015 (Figure 1). The measurement time series are discontinuous with many missing values. Measurements after 2015 are not yet available from the responsible agencies.
Precipitation in the study area was assessed using the CHIRPS database (Climate Hazards Group InfraRed Precipitation with Station data). The CHIRPS database consists of daily precipitation data at spatial resolution of 0.05 and 0.25° for the quasiglobal coverage of 50° N–50° S from 1981 to present [31,32]. CHIRPS is a fusion of satellite images and data from rain-gauge stations. More detailed information on CHIRPS can be found in recent publications [32,33,34,35]. CHIRPS data perform well at the watershed scale. Monthly CHIRPS products at 0.05°, which corresponds to a spatial resolution of 5 km × 5 km, were used in this study for the period 1981–2019.

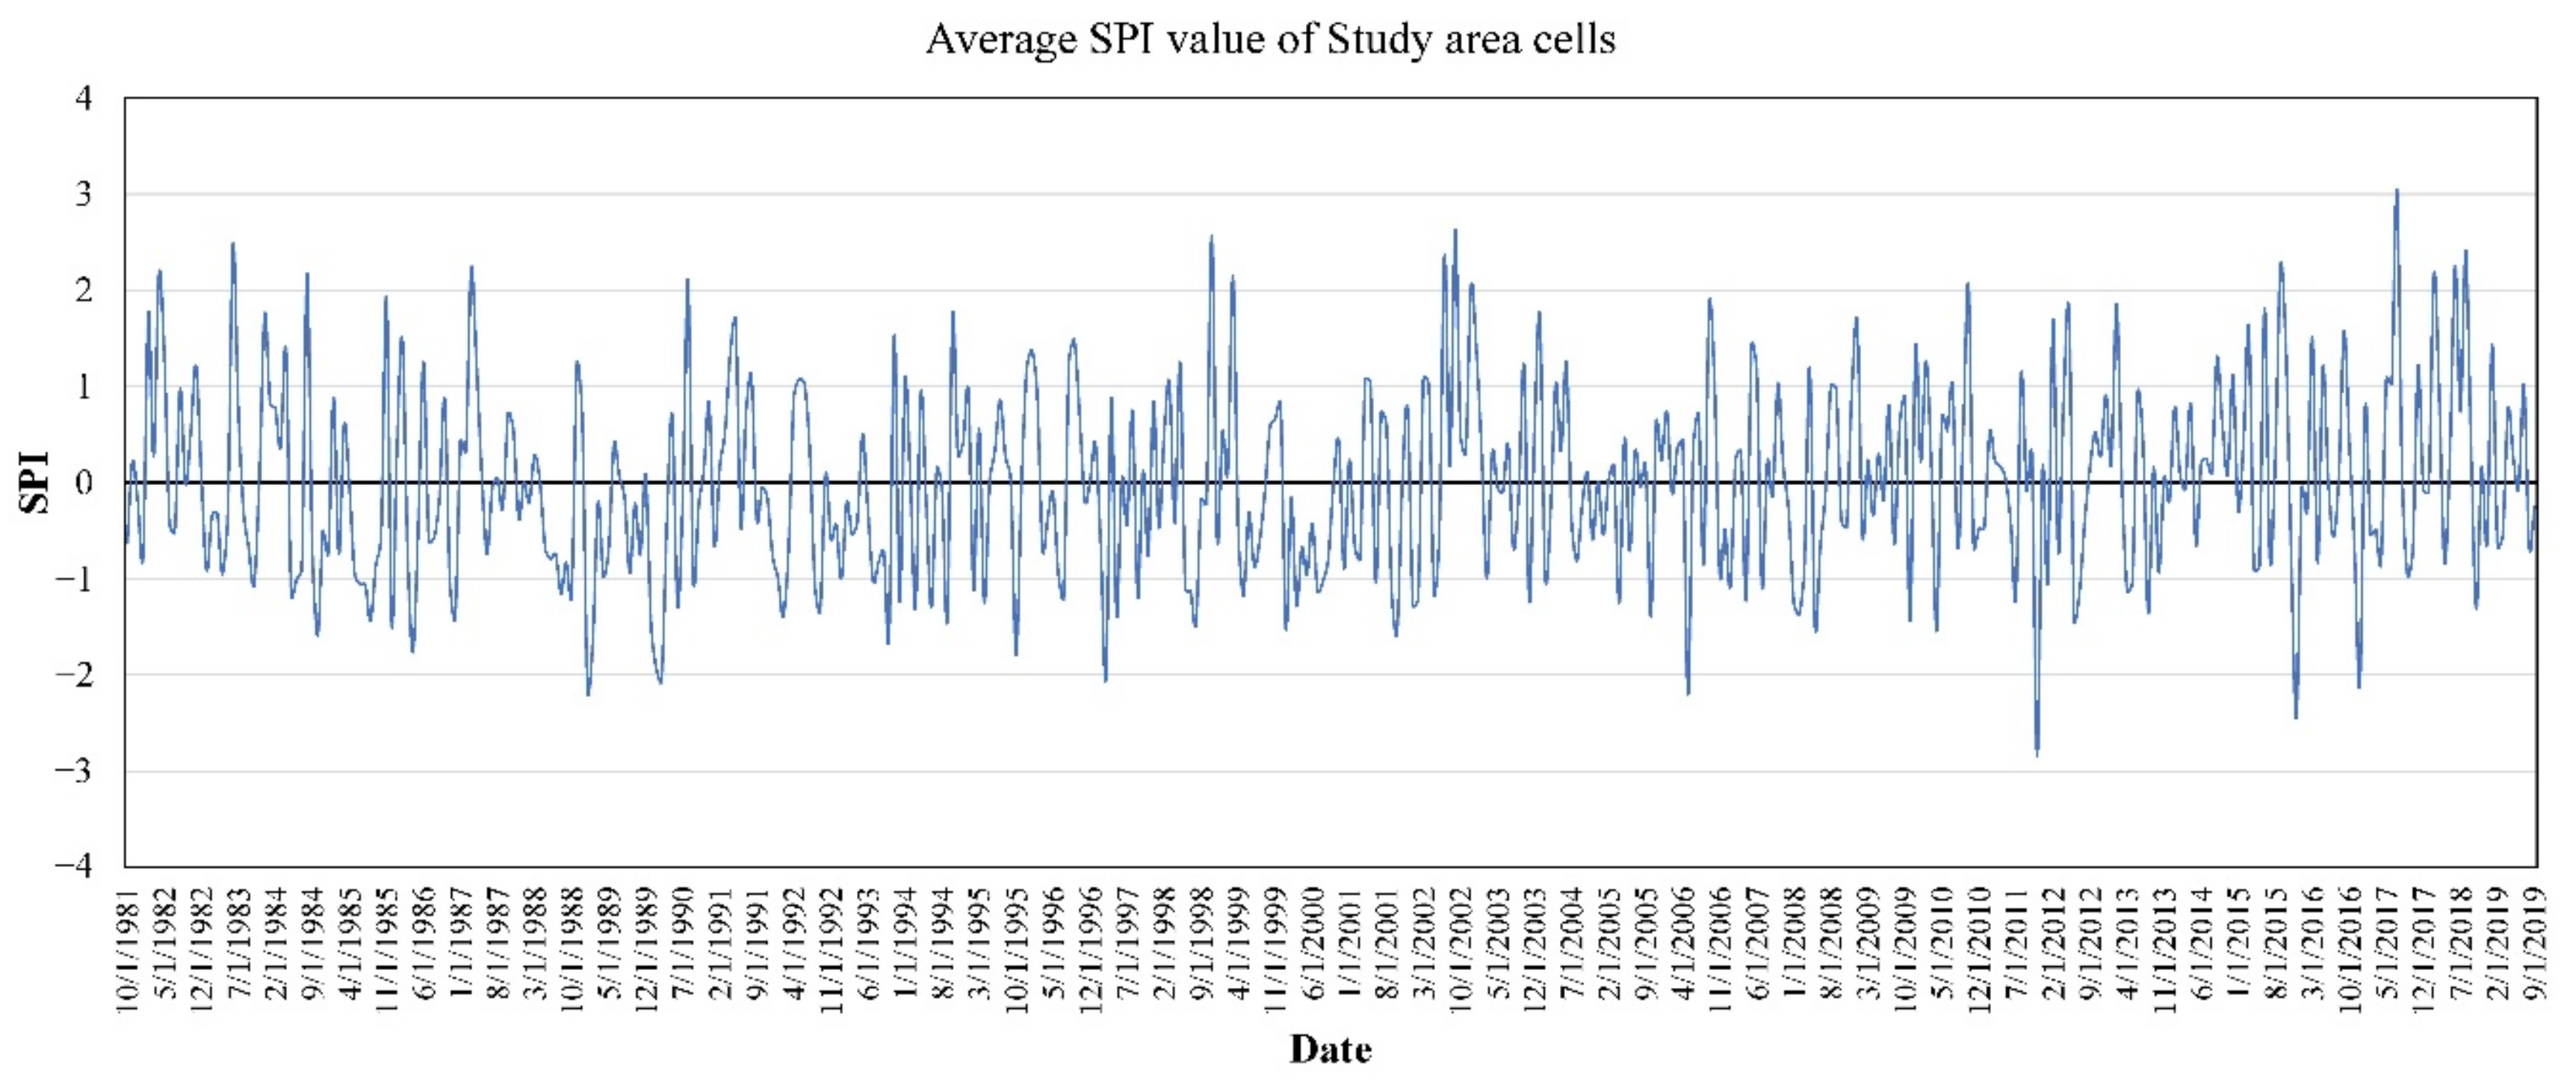
2.3.2. Drought Severity Assessment

Drought severity assessment is conducted with the use of the Standardized Precipitation Index (SPI) [36], which is based only on precipitation data. The SPI is based on standardized probability to quantify precipitation deficit for multiple time scales, such as for 3-, 6-, 9- and 12-month periods [22,27,36,37]. Based on historical long-term rainfall data, the maximum likelihood is used to estimate the gamma distribution parameters and fit a gamma distribution. Then, the cumulative probability is used for the inverse normal function, resulting in the SPI [38]. Specifically, the SPI is computed by dividing the difference between the normalized seasonal precipitation and its long-term seasonal mean by the standard deviation. A classification system is used to define SPI drought severities (Table 3). SPI negative values indicate drought and the event ends when the SPI becomes positive. The SPI is flexible and can be calculated for periods from 1 to 72 months, but it is mostly used for periods of 24 months or less. For the current application, a 1-month period is used. Seven classes of SPI are shown in Table 3 [22,37,39].
SPI is based on the normalized probability distribution (Figure 2), which can compare both the dryness and wetness in different regions. The numerical SPI value is extracted from a given probability distribution function [32,35,37]. Assume that x is the cumulated monthly precipitation in the selected time scale (1, 3, 6, 12 months), which fits a gamma probability density function g(x) as follows:
g x = 1 β a Γ a x α 1 e x β , x > 0
Γ x = 0 x a 1 e x d x
where x is the precipitation sum, Γ(x) is the gamma function. In Equations (3a) and (3b), a and b are the shape and scale parameter, respectively, which can be estimated by the maximum likelihood method [37,38] as follows:
α = 1 + 1 + 4 A 3 4 A ,   β = x a
A = ln x ¯ ln x n
where n is the length (months) of the time series. The resulting cumulative probability of precipitation x in the given time scale is expressed as:
G x = 0 x g x d x = 1 β α Γ x 0 x x a 1 e x / β d x
Let t = x/β and Equation (5) above transforms into an incomplete gamma function:
G x = 1 Γ α 0 x t a 1 e t d t
In order to consider the extreme situation when the cumulated monthly precipitation x = 0, then Equation (6) is modified as H(x):
H x = q + 1 q G x
where q is the probability of x = 0, i.e., the frequency of occurrence of x = 0 in the whole observation series. SPI is then transformed into the standardized normal distribution function and expressed as:
SPI = t c 0 + c 1 + c 2 t 2 1 + d 1 t + d 2 t 2 + d 3 t 3 , t = ln ( 1 H x 2 ) , 0 < H x 0.5 t c 0 + c 1 + c 2 t 2 1 + d 1 t + d 2 t 2 + d 3 t 3 , t = ln ( 1 1 H x 2 ) , 0.5 < H x < 1
where the constants c0 = 2.515517, c1 = 0.802853, c2 = 0.010328, d1 = 1.432788, d2 = 0.189269, d3 = 0.001308.

2.3.3. Soil Degradation Assessment

Assessment of the Land degradation in the study area is conducted from the output of the European Soil Data Centre (ESDAC) database [40]. The European Soil Data Centre (ESDAC) database has been developed by the Joint Research Centre of the European Commission to replace previous widely used methodologies (e.g., GLASOD). A high-resolution, spatially distributed, RUSLE-based modeling approach has been used to provide thorough estimates of soil erosion at the global scale taking into consideration the impacts of 21st century global land use change. Agricultural inventory data, along with satellite images, are used to combine types, extent, and spatial distribution of global croplands and forests in order to estimate land use and land cover changes between 2001 and 2012. Thus, the impacts of human activities in space are considered through the assessment of land use and land cover changes. The quantification of global rainfall erosivity patterns has been achieved using a methodology based on a time series of subhourly and hourly rainfall records (3625 stations covering 63 countries) spatialized through a Gaussian Process Regression (GPR) geostatistical model. The latest available ESDAC output map provides modelled soil erosion rates in metric tons ha−1 yr−1 and at a 5 km × 5 km grid resolution in ARC-grid format. In quantitative terms, to be compatible with SPI mapping, the range of Global Soil Erosion output values can be grouped into four classes.
Combination of the raster maps of SPI values and ESDAC annual soil loss rates by overlay analysis classifies the study area based on the risk of desertification. Invention of a classification scheme assigns cells into classes of sensitivity to desertification. Use of statistical sampling techniques for the selection of cells or group of cells at different sensitivity classes is conducted in order to investigate local hydrological conditions, namely groundwater levels and water chemistry, focusing on water salinity as an indicator of potential soil salinization and desertification. Then, assessment of hydrological conditions during summer months is considered, when the water deficit is the highest, to represent a ‘worst-case’ desertification risk scenario.

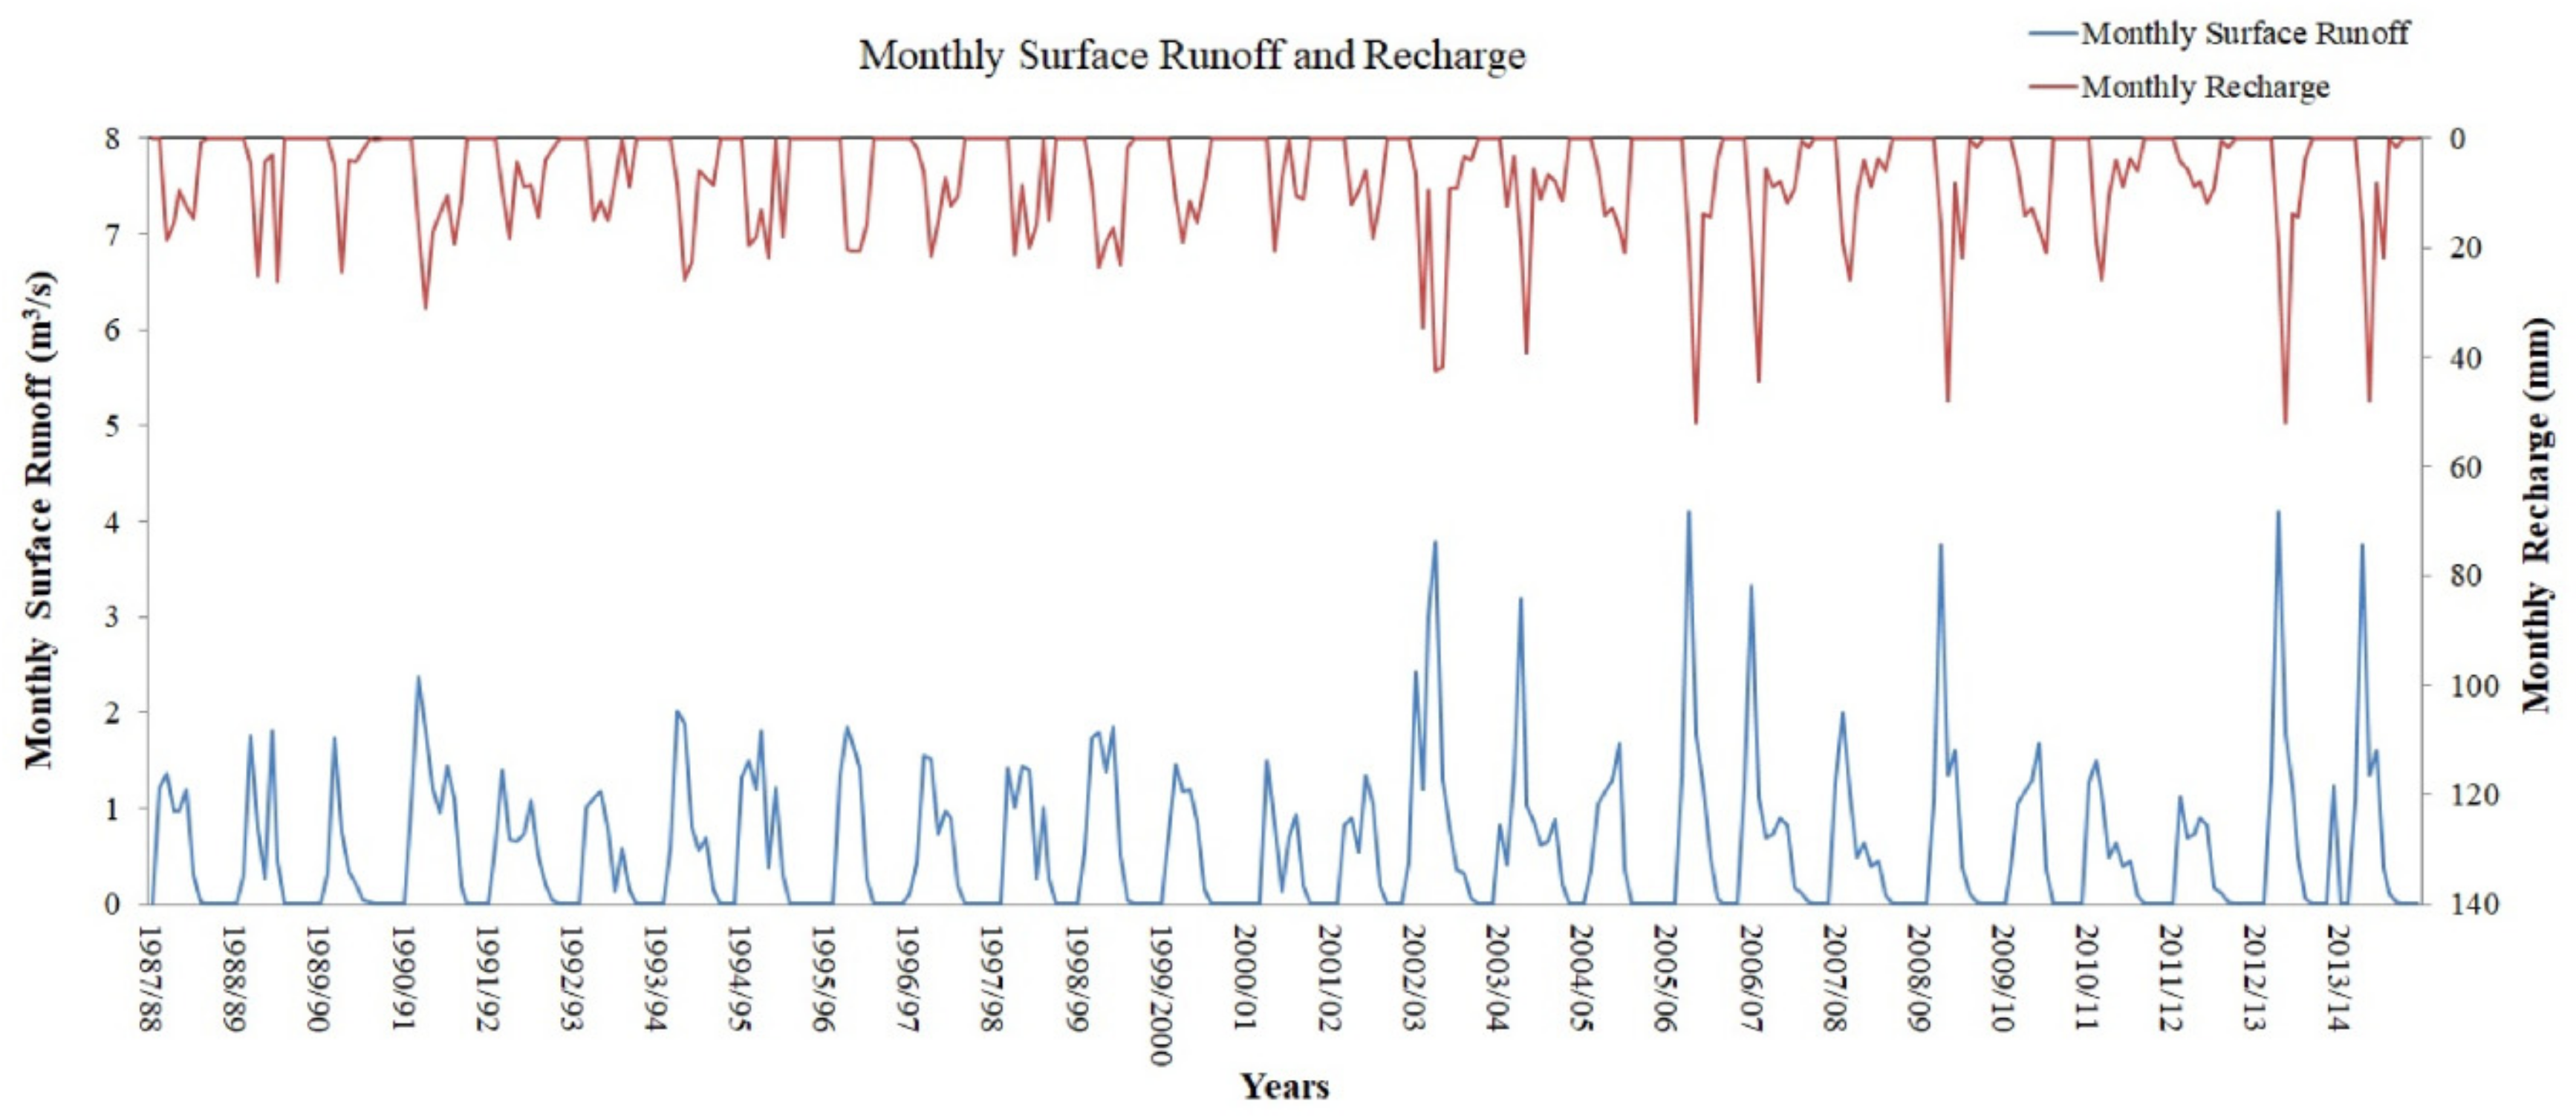
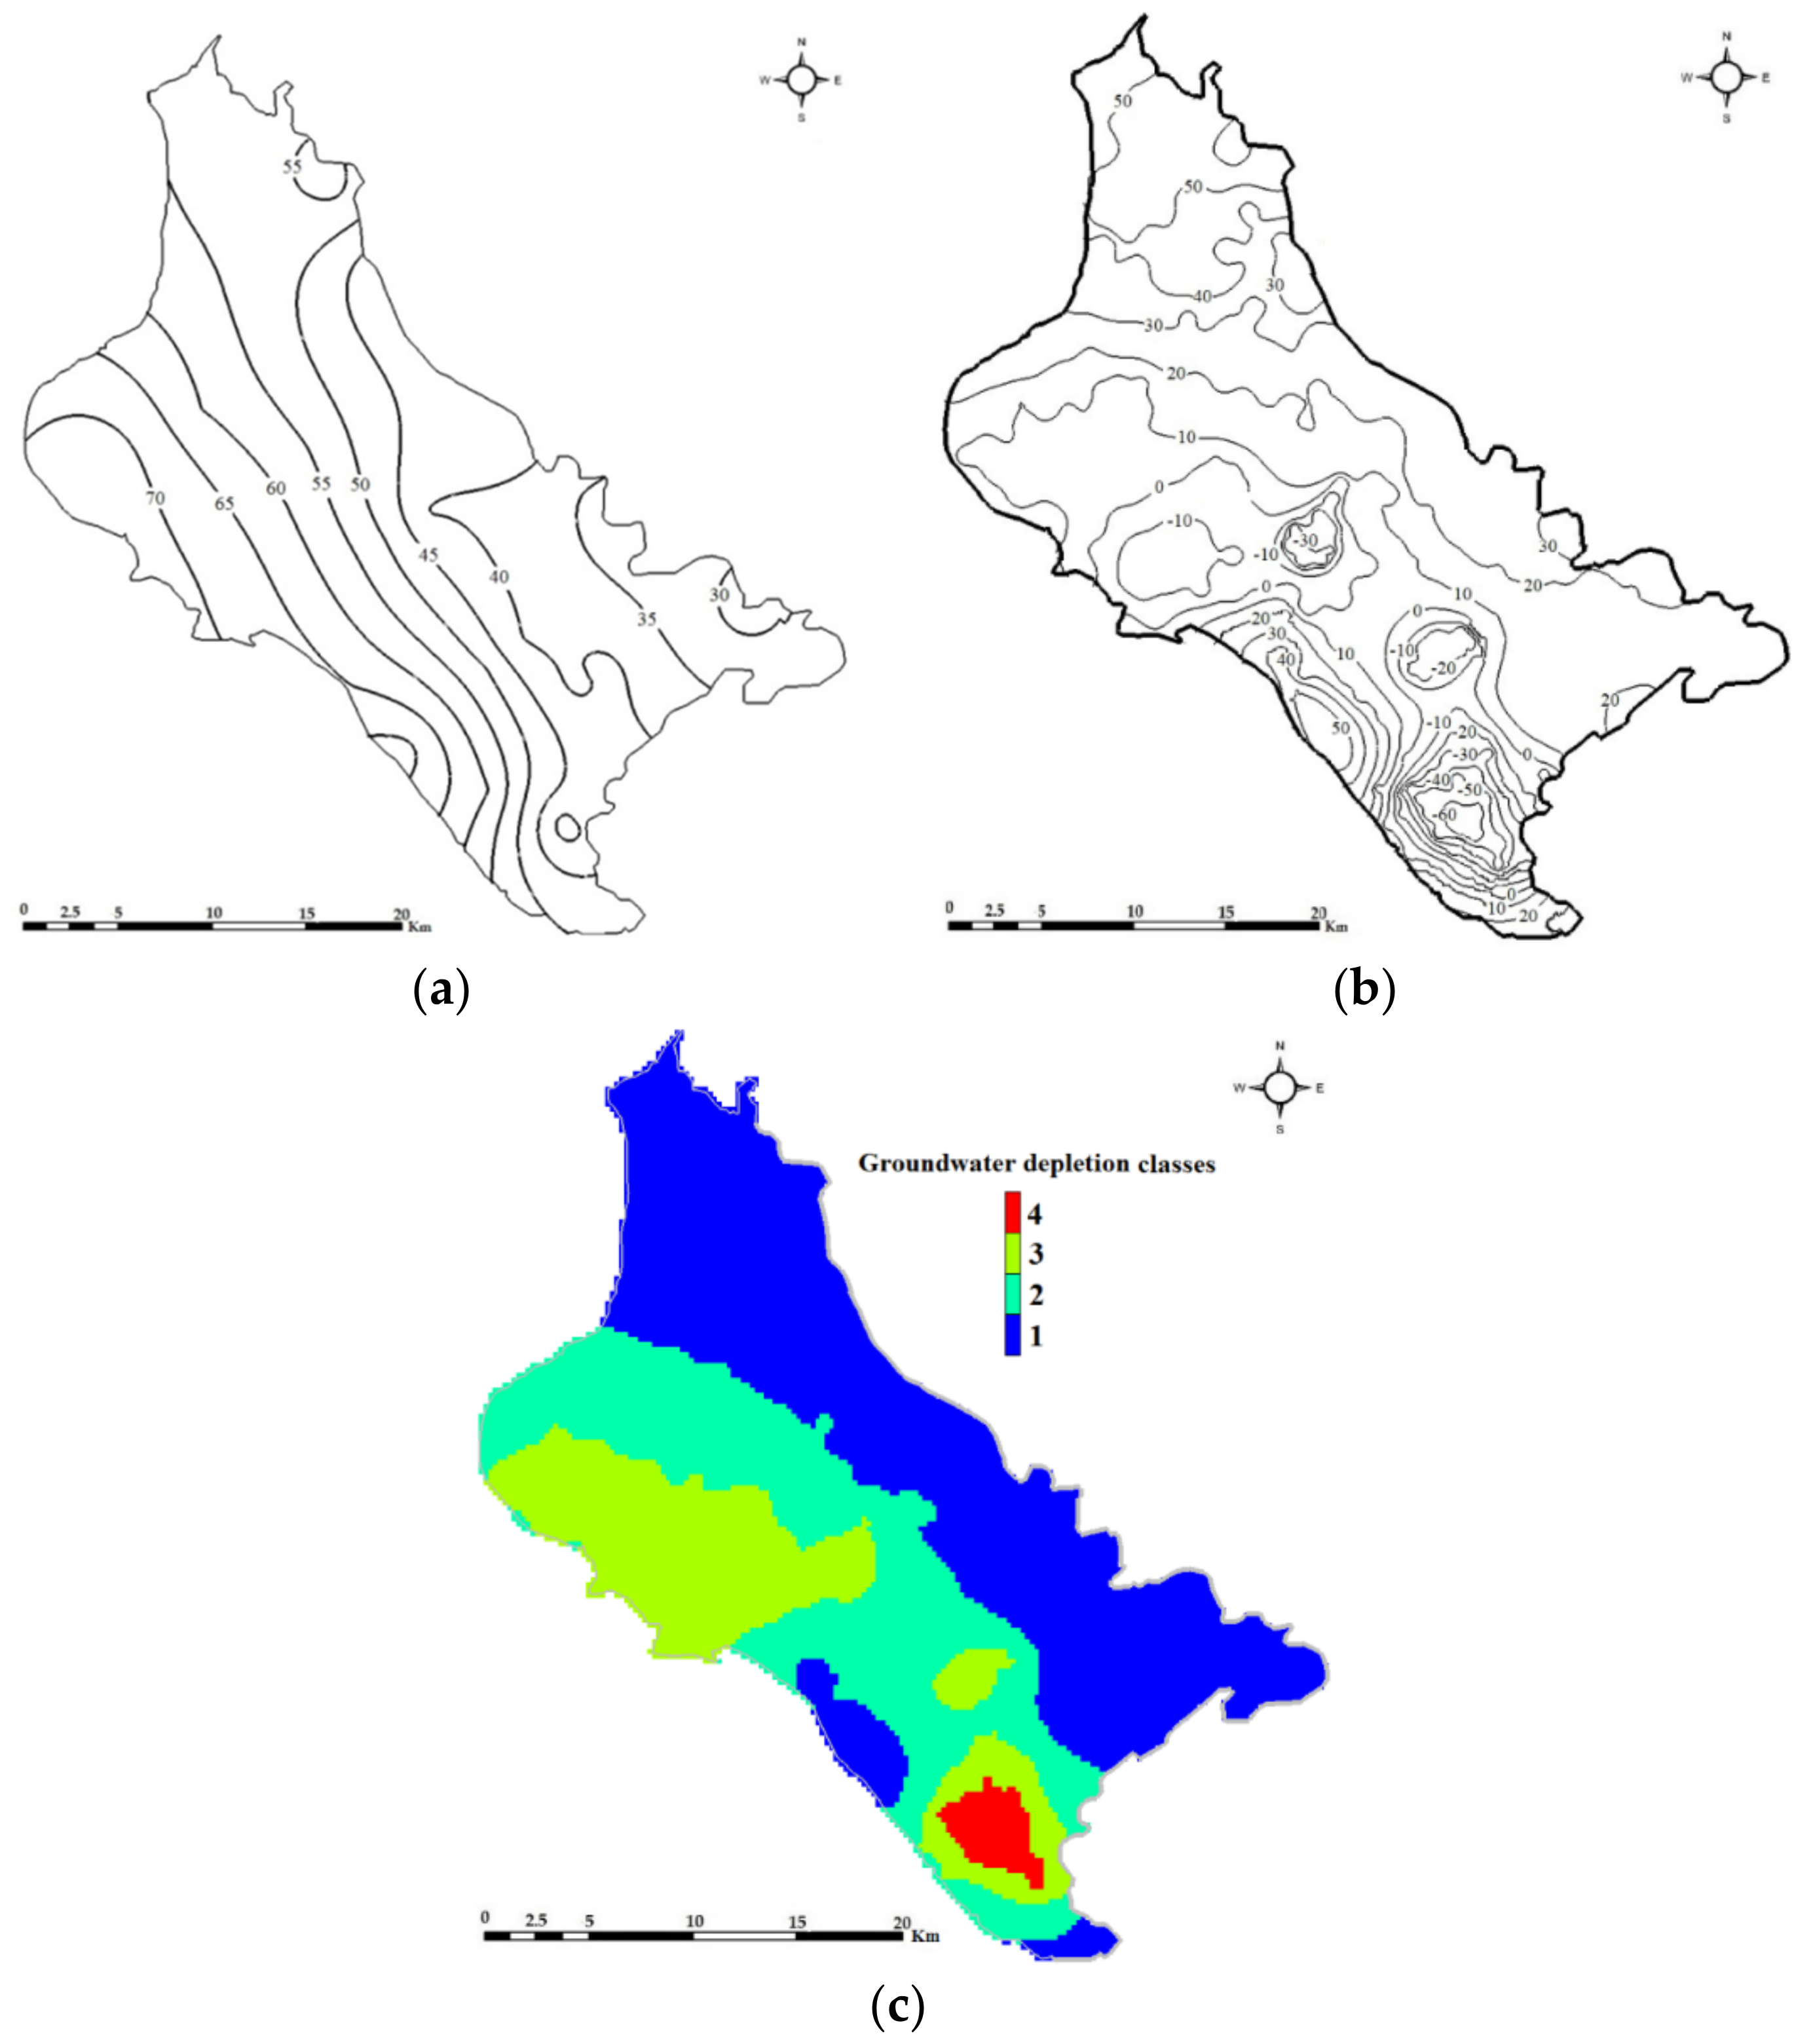
2.3.4. Assessment of Groundwater Levels

The assessment of Lake Karla aquifer’s groundwater levels has been achieved through simulation using the MODFLOW model [41]. MODFLOW uses the mass balance equation with Darcy’s law for saturated porous media to solve the groundwater flow equation (Equation (9)). It is a three-dimensional finite difference code for layered groundwater systems, and it has been widely used by engineers and modelers worldwide.
x K x x h x + y K y y h y + z K z z h z W = S ψ h t
where Kχχ, Kyy, and Kzz are the values of hydraulic conductivity on the coordinate axes x, y, and z [L2T−1]; H, the hydraulic head [L]; W, the water flow per time unit [LT−1]; Sψ, the specific storage of porous media [L−1]; t, the time step [T].
MODFLOW was applied in transient mode for the period 1987–2014. Due to the phreatic status of aquifer, the finite difference grid was approached with one layer and with 12,500 cells of 200 m × 200 m size. Interpolation with the simple kriging geostatistical technique of twenty-seven observed scatter data for 1987 defines the initial conditions. The General-Head boundary package was used to simulate the lateral flows at the west and southwest due to the hydraulic contact with the adjacent aquifer. No-flow conditions were assigned to the eastern and southeastern boundary of the aquifer, because of the presence of schist. The estimation of extracted groundwater volume from wells and its use have been analytically presented by [10]. The mean annual volume of water demand for irrigation needs is 124 hm3, and for domestic use is 3 hm3. The specific yield is uniform for the study area and equal to 0.1, which corresponds to the average value between fine sand and clay, according to [42]. Model calibration was achieved for spatially distributed hydraulic conductivity against twenty-seven (27) observation values of hydraulic heads for the decade 1997–1987. R2 and RMSE values of the calibration period were equal to 0.989 and 1.252, respectively. Validation was achieved with the use of four (4) statistical criteria (MAE = 1.003, RMSE = 1.65, γ = 0.985 and R2 = 0.993) on May 2002.
Groundwater recharge due to precipitation was extracted on a monthly basis from the UTHBAL model. UTHBAL is a monthly hydrological conceptual model used for the assessment of surface runoff [43]. The model inputs are time series of mean areal temperature, mean areal precipitation, and mean areal potential evapotranspiration. The model divides rainfall and snowfall into total precipitation, as this is necessary to accurately simulate runoff of snow-covered mountain areas. Using a soil moisture mechanism, the UTHBAL model divides the watershed runoff into three components: the surface runoff, the medium runoff, and the baseflow. The outputs are groundwater recharge, surface runoff, actual evapotranspiration, and soil moisture. There are six model parameters which ought to be optimized for the accurate estimation of the watershed runoff. Calibration was achieved with the use of the multistart Generalized Reduced Gradient algorithm and the split sample test against the observed monthly values of basin runoff to Pagasitikos Gulf for the historical period October 1960 to September 2002. The Nash–Sutcliffe Model Efficiency for model calibration and validation was equal to 0.66. UTHBAL model could be applied as a lumped, semidistributed, and fully distributed model. In this study, UTHBAL has been applied as a semidistributed model [44]. Lake Karla watershed was divided into two zones according to elevation: (i) the low elevation zone (elevation < 100 m) and the high elevation area (elevation > 100 m). The area of the aquifer is fully located in the low elevation area (Figure 1).

2.3.5. Water Chemical Analysis

Water sampling and analysis from the boreholes were conducted for pH, conductivity, and bare cations. In addition, assessment of the salinity of the irrigation water was considered, which can cause salinization in sensitive soils and, consequently, desertification. Moreover, the determination of water pH and conductivity was conducted in situ using a portable pH and conductivity meter. Furthermore, assessment of the spatial variability of water chemical concentrations of the analyzed parameters was considered with the use of the simple kriging method.

2.3.6. Classification of Desertification Risk

Multivariate statistical analysis were used (i.e., Principal Component Analysis and Cluster Analysis) to identify sources of variability. Grouping of the raster datasets was conducted using the drought severity, soil loss, and selected hydrological variables data. Moreover, quantitative assessment considered the relative importance of the main processes on the severity of desertification in the study area.
The combination of maps of drought severity, soil erosion rates, and groundwater depth was conducted using mapping techniques to produce composite maps and a spatial model for quantitatively assessing the risk of desertification. Reclassification of maps into desertification risk classes was conducted using a common classification scheme, which is based on the original raster values of each map. Application of weightings to the map layers was considered depending on the relative importance of each process for causing desertification, using the results of the multivariate analyses. Then, classification of the desertification severity risk of the study area was considered and risk classes were defined using standard statistical methods. Specifically, the quantitative scheme takes the following form:
D S R i = 1 N i = 1 N D i + S E i + G W i + W C i + + M i ,   i = 1   to   N
where DSR is the desertification severity risk to be estimated; M are the parameters considered, N is the number of parameters or components involved in the methodology; and i is the severity class index taking values within each class (from 1 to 4 classes) for each parameter, as explained previously. In this case, there are four parameters, namely drought (D), soil erosion (SE), ground water (GW), and water chemicals (WC), which are described above. Τhe factors, which cause desertification, are incorporated in the desertification severity risk model (Equation (10)) through the abovementioned parameters. Specifically, the factor of climate is considered through drought (D) assessment, the factor of soil and geology is considered through soil erosion (SE), the factor of hydrology is considered through ground water (GW), and the factor of biology is considered through water chemicals (WC), ground water (GW) and drought (D). The factor of human activities is more complex. Indeed, the outcome of the presented desertification severity risk model is expected to indicate the status of a region with regards to desertification, which indirectly involves the socioeconomic impacts of desertification and the required change of policies and governance, leading to change of land use.

3. Results and Discussion

The results of the application of the proposed methodology in Lake Karla watershed are presented, analyzed, and discussed in this section.

3.1. Drought Severity

The drought severity has been estimated using the SPI index at a grid base for the study area and the spatial average of SPI over the study area. The driest month of the last thirty years for the available time series of the study area is November 2011 (Figure 3) and has been selected as the reference period for the SPI index.
The droughts classes (negative SPI values), founded in the study area for the driest month, are four according to Table 3 and the ideal spatial resolution is 1 × 1 km, in order to be compatible with soil erosion and groundwater maps. Higher value of class corresponds to lower value of SPI (Figure 4a). The area is divided into classes of SPI: near normal-mild dry conditions at south and moderate dry conditions at north.

3.2. Soil Degradation

The Global Soil Erosion (SE) output values have been classified into four classes to be compatible with SPI maps. The classification reflects the soil degradation status of Greece. The highest value for Greece is a little more than 60 t ha−1 yr−1, so the four classes represent equal intervals of 20 t ha−1 yr−1 (i.e., 1st class 0 t ha−1 yr−1 < SE < 20 t ha−1 yr−1, 2nd class 20 t ha−1 yr−1 ≤ SE < 40 t ha−1 yr−1, 3rd class 40 t ha−1 yr−1 ≤ SE < 60 t ha−1 yr−1, 4th class SE ≥ 60 t ha−1 yr−1 (Table 4). Lake Karla aquifer area belongs to the first class indicating that the threat from erosion is low (Figure 4b).

3.3. Groundwater Levels

The semidistributed application of UTHBAL for the simulation period 1987–2014 gives, as results, the monthly time series of surface runoff and recharge volumes, presented in Figure 5.
MODFLOW receives as input the monthly recharge volumes and its application generates maps of aquifer’s hydraulic heads, groundwater flow vectors, and volumetric budgets. A map of spatially distributed groundwater levels depletion, for the 26 years of the simulation period, is created. The map shows the difference of the groundwater levels between the initial values of January 1987 (Figure 6a) and the values of April 2013 (Figure 6b). This map is at a 1 km × 1 km grid resolution to be consistent with the raster datasets of drought severity and soil erosion rates. The range of groundwater depletion output values is grouped into four equal-width classes in order to be compatible with SPI and Global Soil Erosion maps (Figure 6c) (Table 4). The greatest groundwater depletion is found at the southern part of the aquifer corresponding to the fourth class. The mean annual renewal of groundwater resources from natural recharge, which is the only groundwater renewal process, reaches up to about 42 hm3 per year. On the contrary, the mean annual extracted/pumped water volume from the aquifer reaches up to about 127 hm3. These figures indicate that about 85 hm3 per year are pumped from nonrenewable groundwater through overexploitation. This overexploitation justifies the significant depletion of the aquifer water table for the 26 years period of simulation, which reaches almost 100 m at the southern part of the aquifer (Figure 6b). Furthermore, we observed a distortion of the natural groundwater flow direction, due mainly to the extraction wells and their high pumping rates. The flow is being re-directed from the initial west–east direction to the north–central and south–southeast direction.

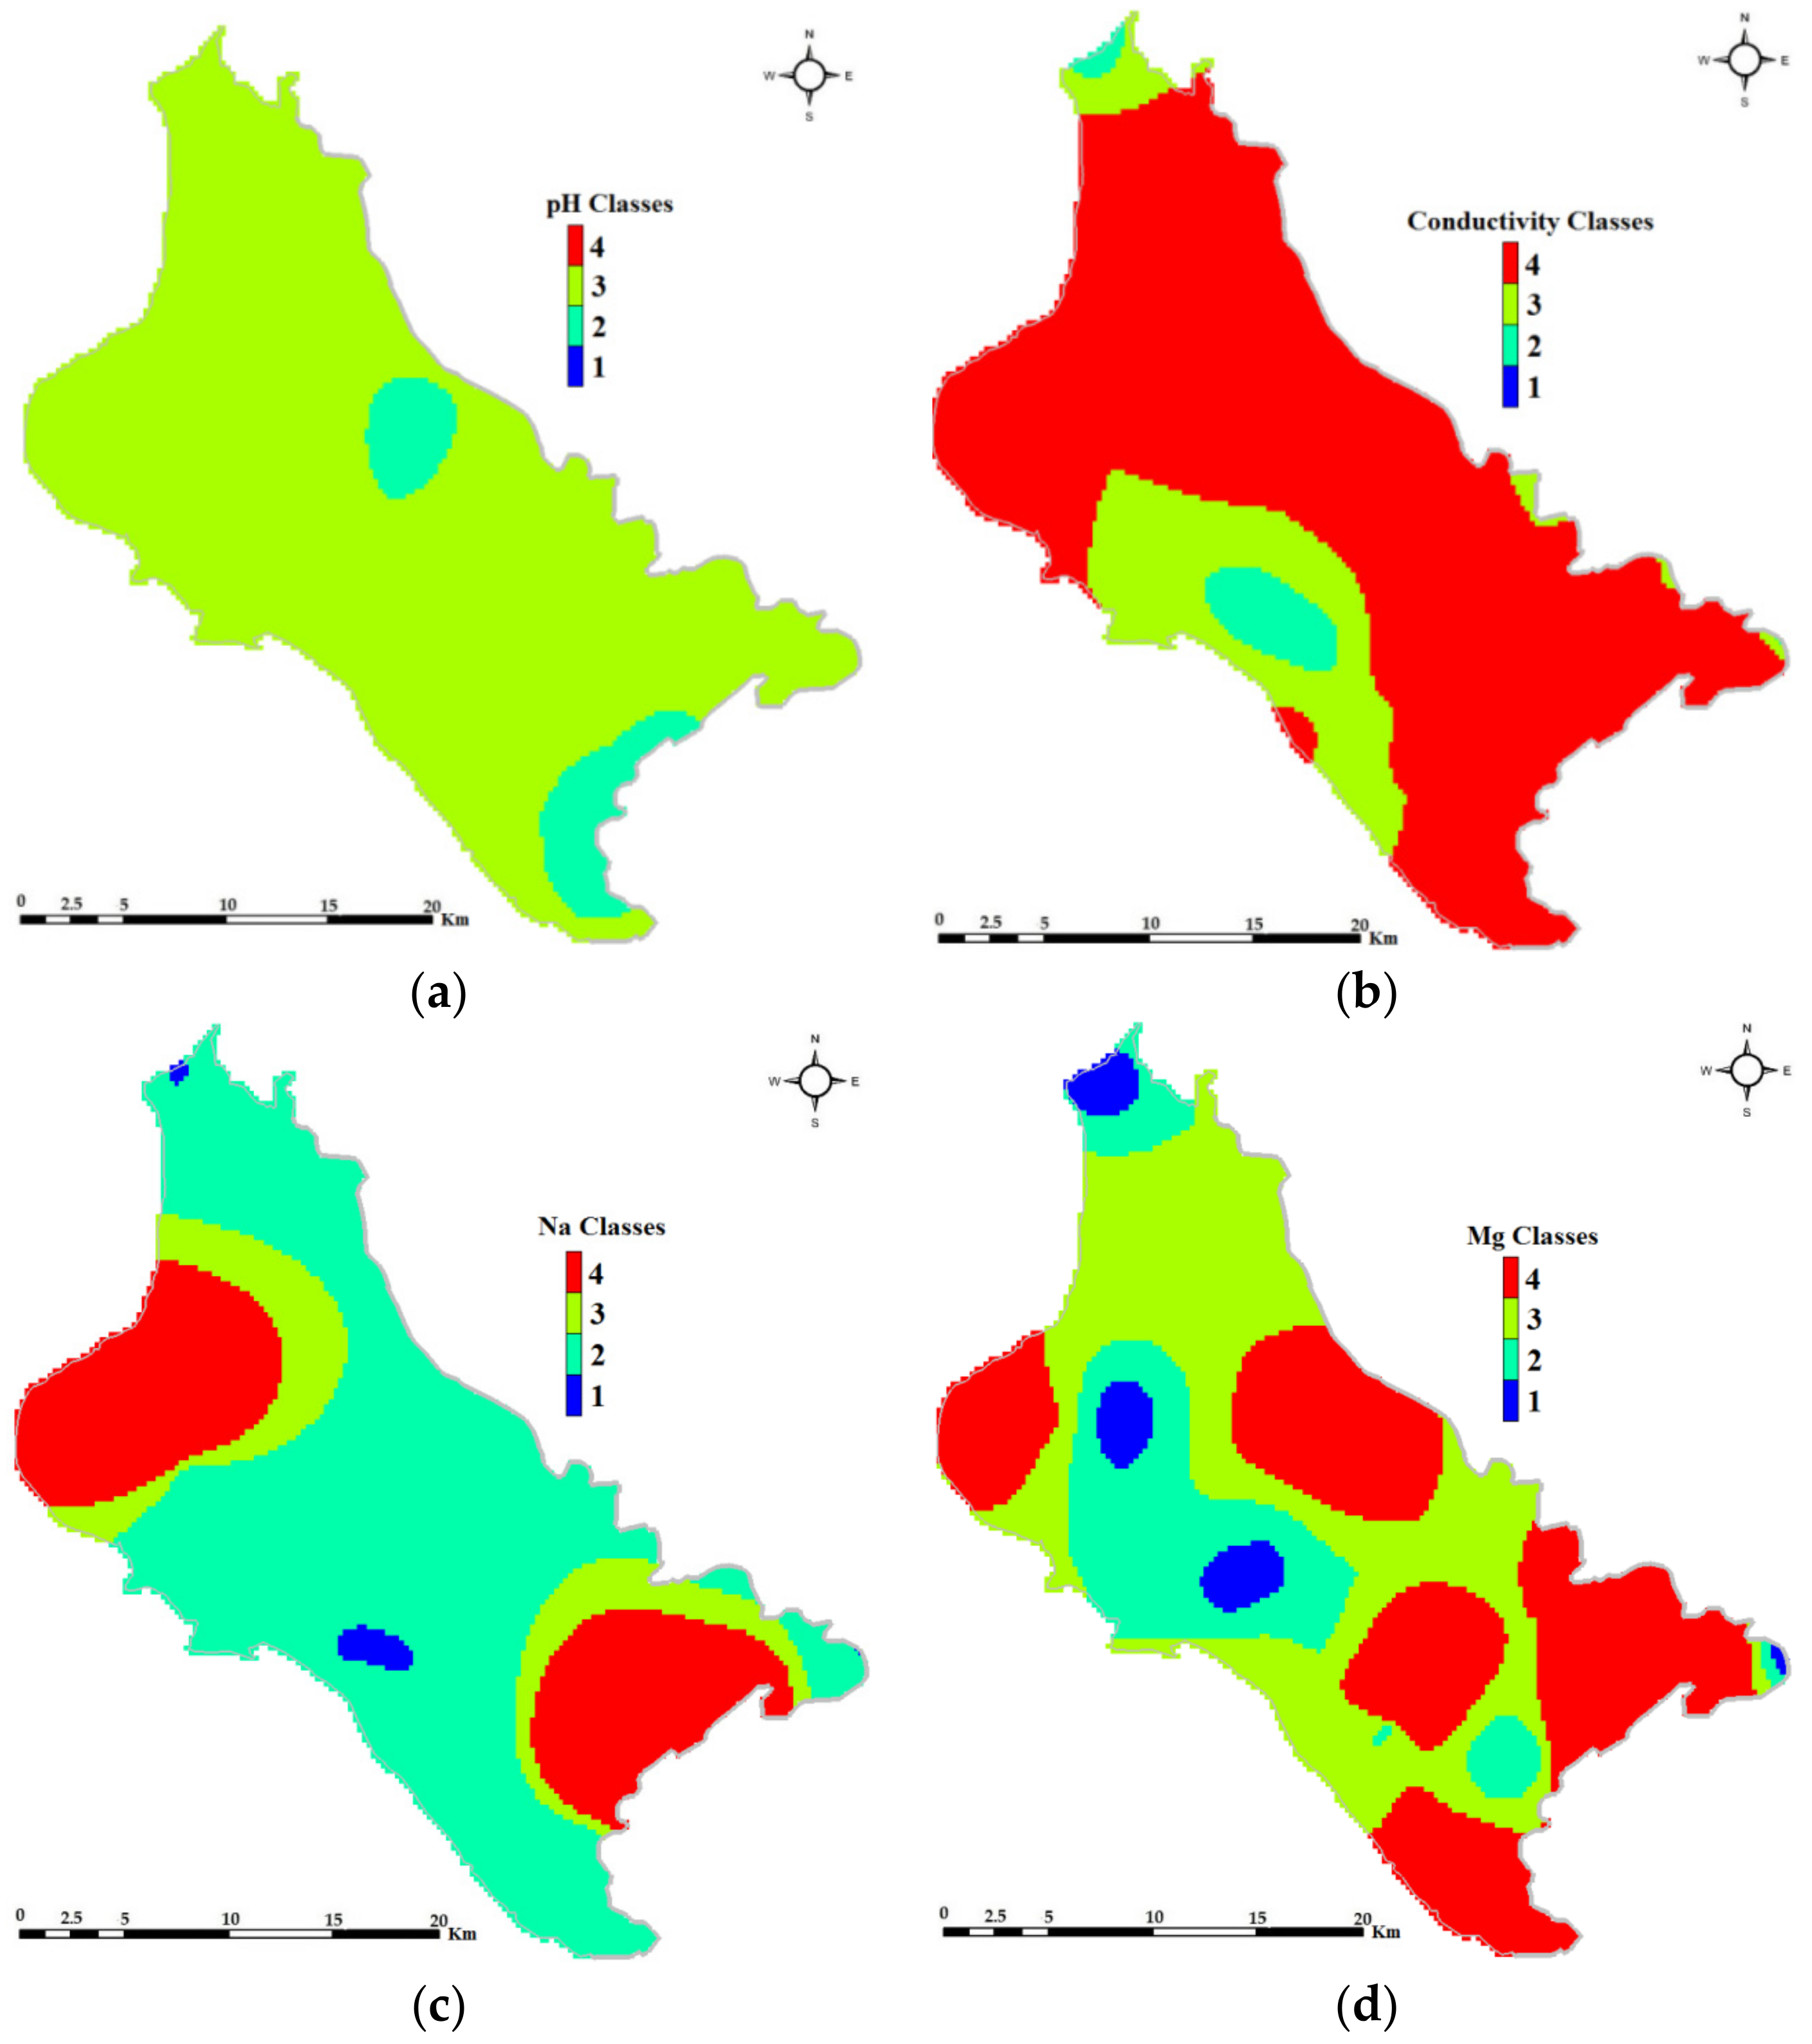
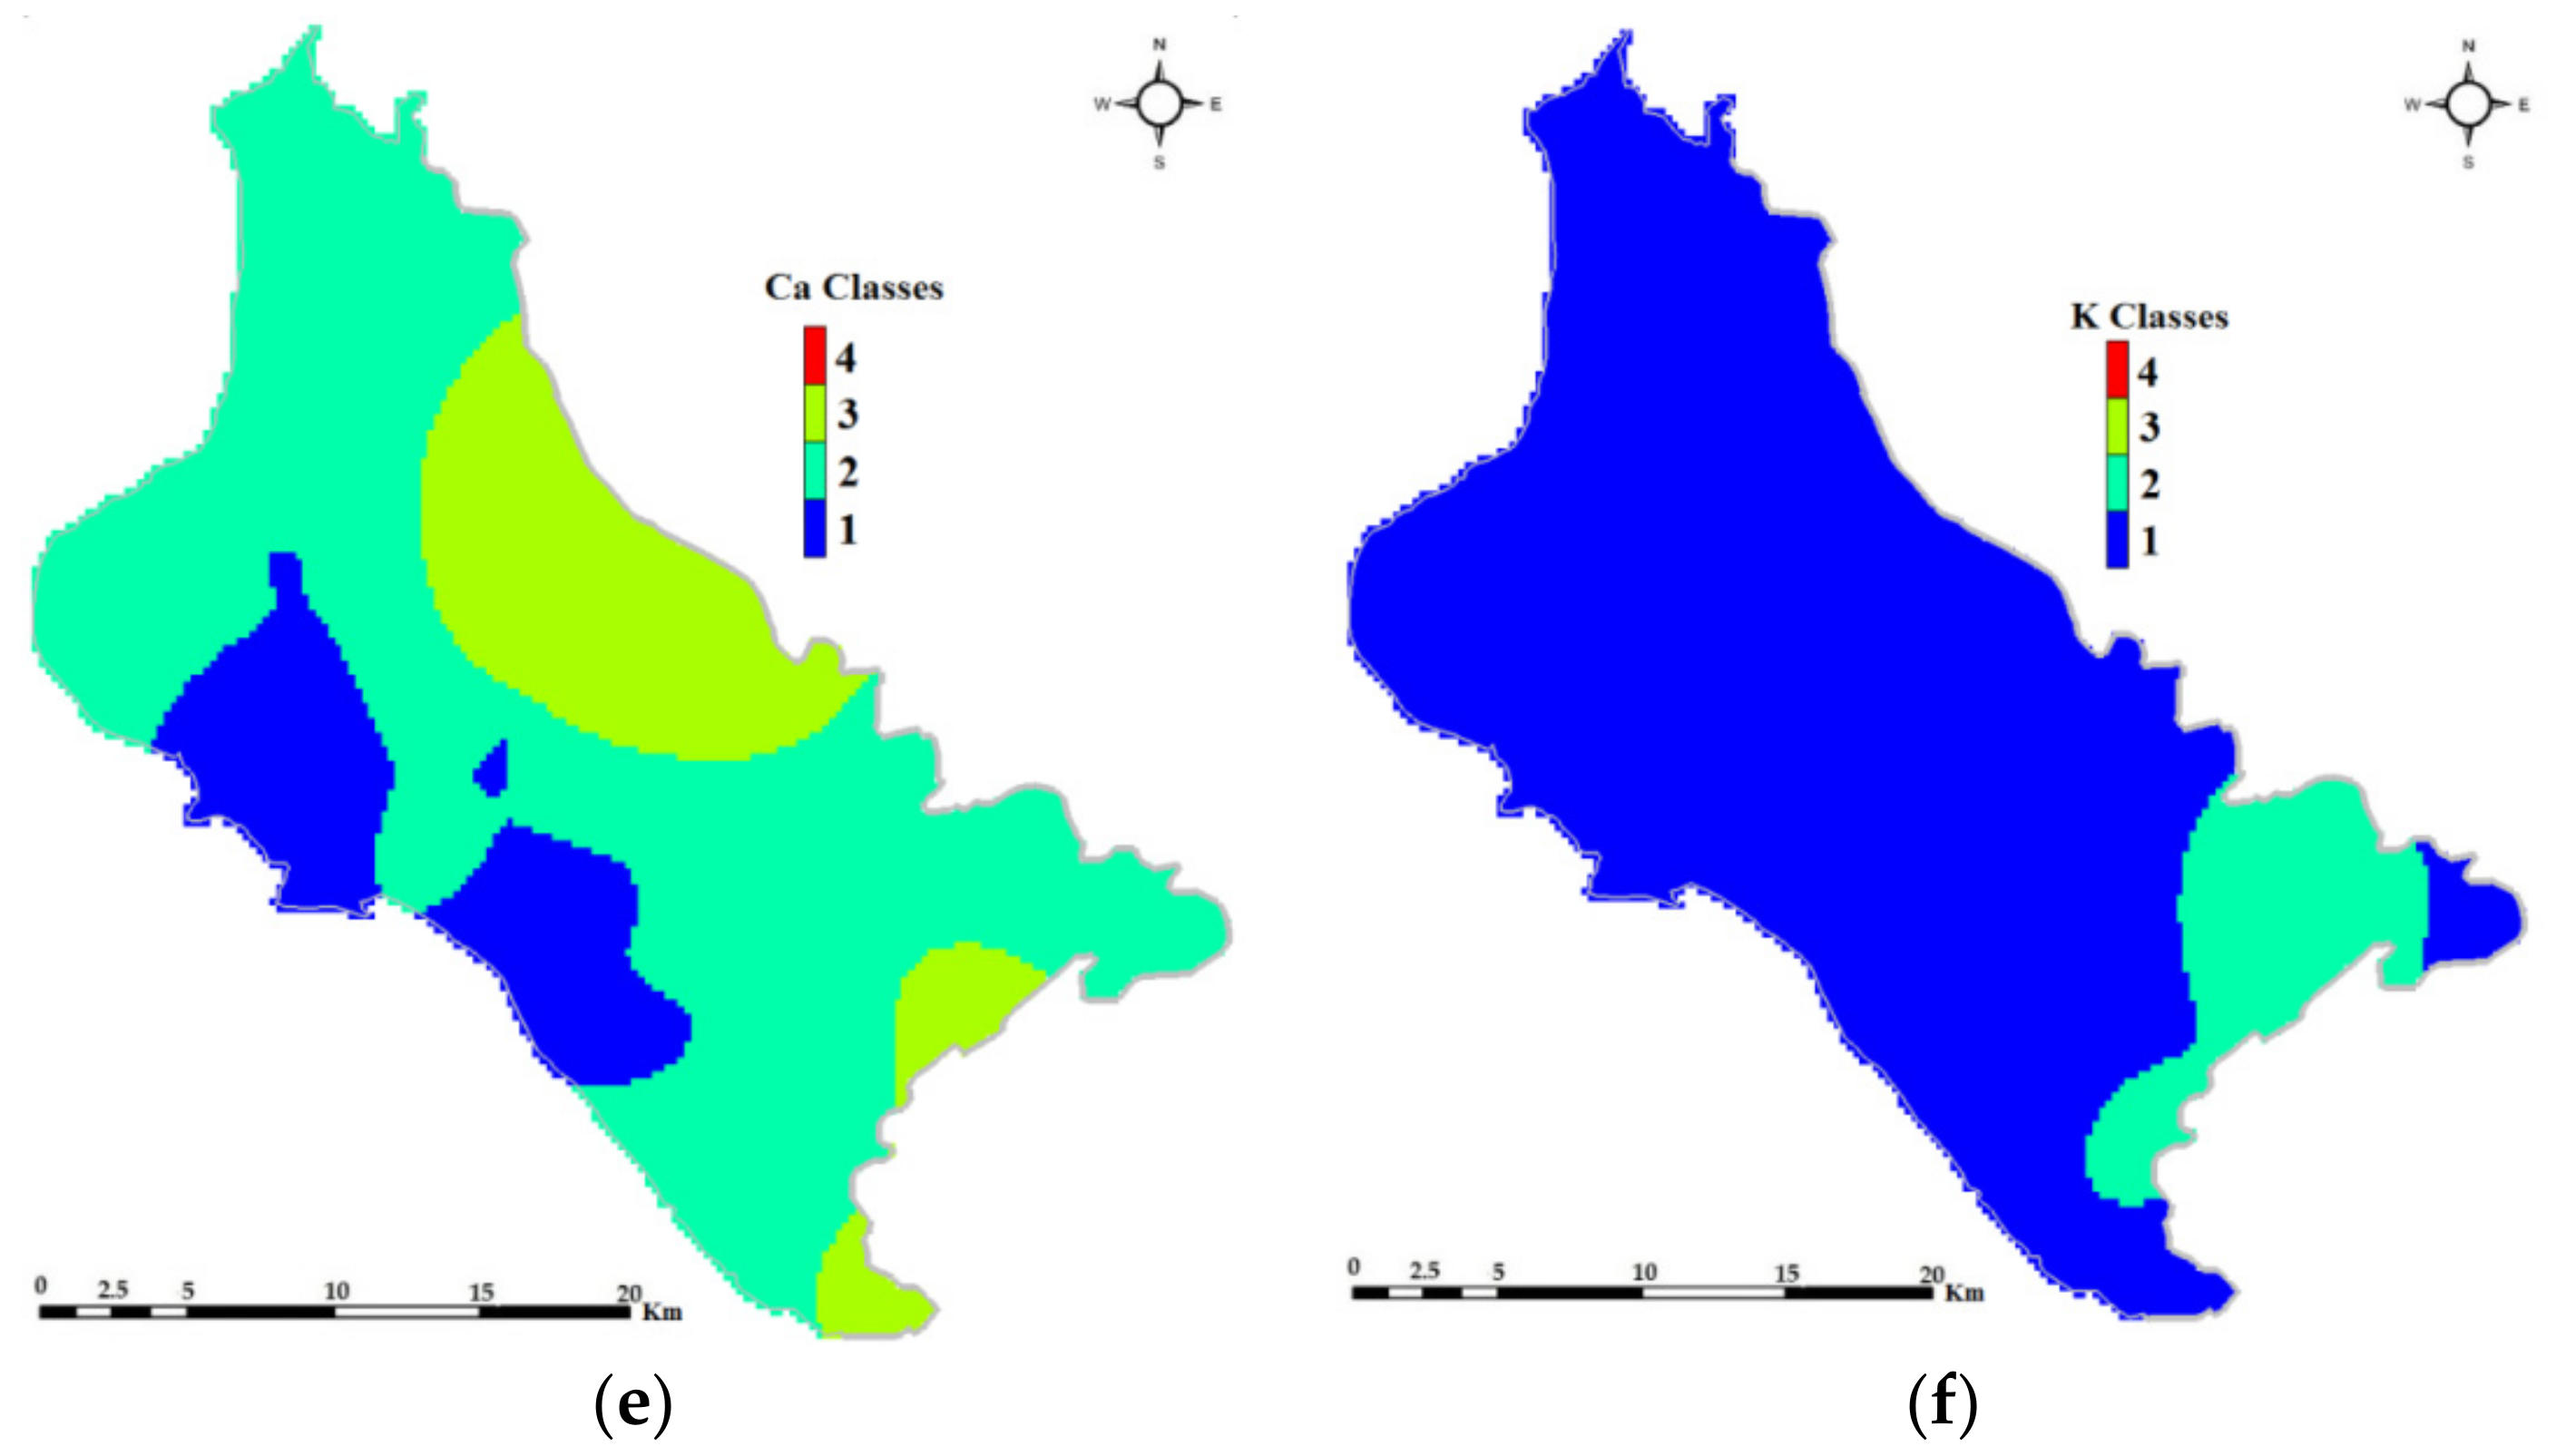
3.4. Water Chemicals

Water chemicals data are purchased from the Institute of Geological and Mining Research. The range of spatially distributed water quality parameters output values is grouped into four classes to be compatible with the classes of the other factors (Table 4). Each class represents the water quality according to [45]. Maps of groundwater chemical concentrations spatial resolution are produced at 1 km × 1 km grid cell for April of 2013 (Figure 7a–f). Regarding pH, almost the entire area falls into class 3. This means that the groundwater is characterized as alkaline. Figure 7b shows that with the exception of the western part of the aquifer, the remaining area falls into class 4 characterizing the groundwater quite hard. The presence of natrium in groundwater varies in the aquifer area, as high values of its concentration prevail at the southeastern and northwestern part (class 3 and 4), while in the remaining areas, the values seem to be lower (class 1 and 2). The map of magnesium concentration distribution reveals high spatial variability. Higher values of magnesium concentration are measured at the southern, eastern, western areas, and at the central areas of the aquifer. Calcium concentration is, in general, not a severe problem for the study aquifer. The greatest area of the aquifer is characterized by low values of calcium concentrations. Nevertheless, high values of calcium concentrations have been measured at the southeastern and northwestern areas of the aquifer, making the groundwater very hard and inappropriate in these areas. Finally, the concentrations of potassium are low for the entire aquifer area classified into the first two classes.
Table 4 summarizes the methodologies, analysis results and the classes which are used for the assessment of desertification risk parameters.

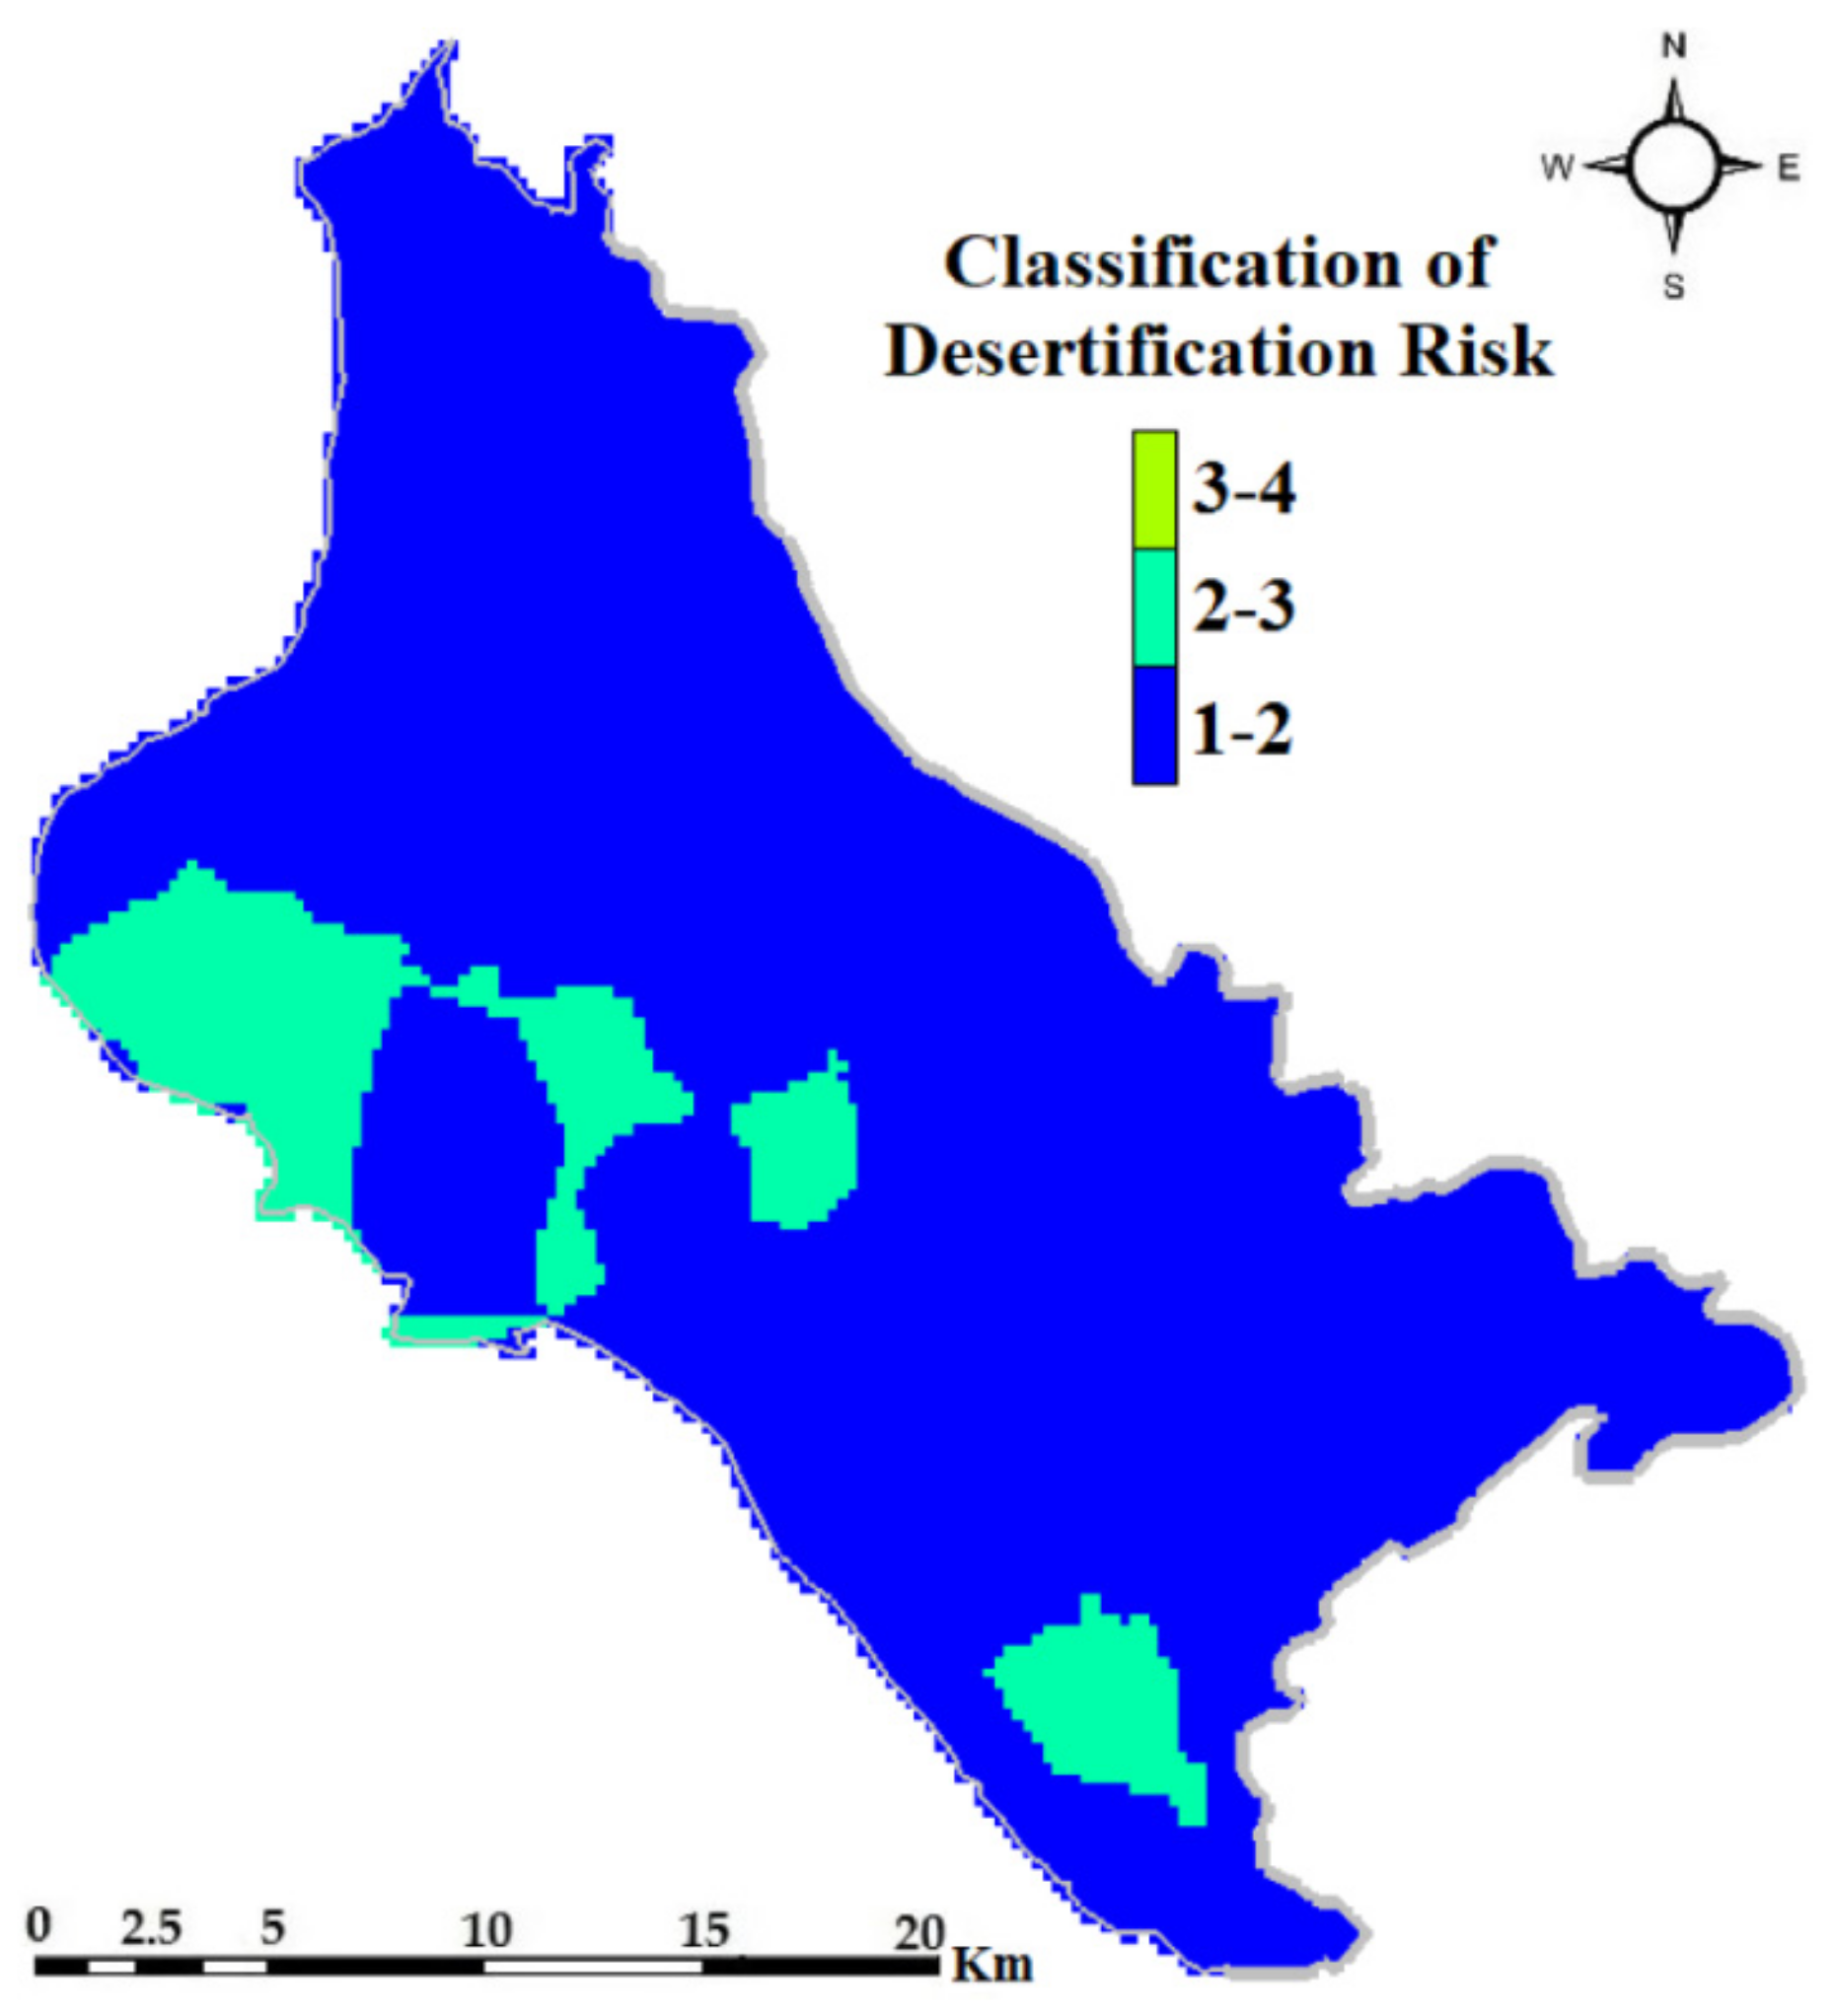
3.5. Spatial Analysis and Classification of Desertification Risk

The contribution of wind erosion to desertification is not considered in this study and the proposed model. The reason for that is that the study area is a plain area with very small ground elevation and ground slope. Thus, the wind contribution to soil erosion and desertification is considered negligible. The various indicators have not been weighted in Equation (10), in order the desertification threat of each factor to be equally weighted giving an unbiased and objective result. Since the water chemical parameters are six, their sum is multiplied with a weighting factor equal to 0.1667 ( = 1 6 ) and the final form for Equation (10) referring to the area of Lake Karla aquifer is
D S R i = 1 4 i = 1 4 D i + S E i + G W i + 0.1667 j = 1 6 ( W C j ) i
and the Classification of Desertification Risk for Lake Karla aquifer is presented in Figure 8.
The results presented in Figure 8 indicates low to medium values of desertification risk for the study area since for the 88.77% of the area the DSR is between 1 and 2 and for the remaining 11.23% of the area is between 2 and 3. Although the parameters of drought and soil erosion in Equation (11) present low values in desertification risk, the parameters of groundwater and water chemicals are characterized by high values for some parts of the study area. This means that groundwater degradation is the most important threat for the area’s desertification risk. Comparing Figure 5a,b,d,e, Figure 6c, and Figure 8, it can be seen that the significant groundwater quality and quantity degradation largely affects the desertification risk. Moreover, the areas with DSR values higher than 2 (Figure 8) are the same with the areas of the greatest groundwater depletion of Figure 6c. A description ought to be done for the relationship of the analysis results and the desertification factors. As it has been stated in Section 2.3.6, the desertification factors that are considered through groundwater and water chemical parameters are the hydrology, biology, and human activities. Hence, the cause must be sought above these three factors. Hydrology is a desertification cause for the study area. Natural Lake Karla was drained in 1962. There are not any other surface water body was in the watershed with the exception of small irrigation reservoirs in the north. In 2018, the Lake Karla reservoir was constructed. Biology cannot be characterized as a cause since the study area is an agricultural basin and the vegetative cover consists mainly by cultivated crops. Human activities represent the most responsible factor for the desertification threat in the area, because the intensification of agriculture started in middle of the previous century and has been increasing until today. This fact in combination with the lack of a surface water body has led to groundwater degradation which, finally, is the major threat for the area’s desertification. Focus must be given to the areas with DSR values higher than 2, since if one parameter of drought or soil erosion or groundwater is changed to a higher class, this will increase the values of DSR making these areas potentially vulnerable to desertification risk. According to Sidiropoulos et al. [12], groundwater depletion at the southern part of the aquifer will continue to increase as long as a sustainable water resources management strategy is not applied.

4. Summary and Conclusions

A conceptual and comprehensive description of desertification over a region with degraded groundwater resources is presented including causes, factors, stages, assessment methods and mitigation. This is followed by a brief description of drought concepts, types, quantification, indices and features. Then, a two-stage methodology for the quantitative classification of desertification severity is presented. The methodology, firstly, assesses the drought and, then, quantifies the desertification severity through classification. Specifically, drought severity, soil erosion rates and groundwater depth maps are combined to produce composite maps of desertification risk and evaluate its spatial variability. Then, classification of the desertification severity risk of the study area is considered and the risk classes are defined using standard statistical methods.
This classification of desertification severity constitutes a very useful contribution, since it allows a better understanding of desertification factors and causes, leading to potentially effective mitigation measures. The presented methodology of desertification classification offers generality, since it can be implemented not only in large-scale regions, but also in meso-scales, and incorporates key factors, as compared to other existing methods, such as MEDALUS, a widely used approach for large-scale regions, which does not take into consideration groundwater depletion and groundwater chemical status. Indeed, the value of the presented methodology is to highlight that desertification risk is highly affected by quantitative and qualitative groundwater degradation in the examined region and, although the desertification threat of other factors, such as climate or soil erosion, might be low, the significant groundwater depletion and the groundwater chemical status are such that they lead to higher desertification risk values. Moreover, consideration was taken for the criteria of classes for SPI, soil degradation assessment, groundwater levels assessment, and water chemicals analysis, since the objective was to use the same number of classes leading to a unified and easily usable approach based on existing data. Similarly, equal weights of the equation components were used to achieve unbiased and objective results. Specifically, a thorough consideration of the weights was taken by testing different weights for any of the four classification components, which has led to overweighted class of DSR, an indication of biased results. Furthermore, the contribution of wind erosion to desertification is not considered in the model, since the study area has quite small ground slopes as a plain, leading to the conclusion that the wind contribution is negligible to soil erosion and desertification. Finally, although climate change and impact of desertification on agricultural production is beyond the scope of this research effort, it is stated that climate change affects the hydrological potential of a region and agricultural production is threatened by groundwater depletion and worsening of water quality in semiarid regions. For the specific case study of the degraded aquifer of Lake Karla watershed, the regions with the high desertification risk suffer from severe groundwater depletion as many studies around the world have mentioned [46,47,48]. Nevertheless, with nearly one in six people worldwide presently at risk from the impacts of land degradation, much work remains in terms of monitoring and preventing desertification, understanding causal interactions, and education.

Author Contributions

P.S., N.R.D., A.L., N.M. and N.A. designed and applied the research; P.S. and N.R.D. wrote the original draft; M.S., I.N.F. and S.S. acquired the data; N.R.D., A.L. and N.M. reviewed and edited the manuscript, provided technical help, and proposed significant additions to the model and manuscript. All authors have read and agreed to the published version of the manuscript.

Funding

This research received no external funding.

Data Availability Statement

Not applicable.

Acknowledgments

This research was funded through the research projects HubIS (from the EU-PRIMA 2019 program) and EXTREMES (from the program RESEARCH-INNOVATION, jointly funded by EU and GSRT of Greece). Water chemicals data are purchased from the Institute of Geological and Mining Research: “Recording and evaluation of the hydrogeological characteristics of the groundwater systems of the country, Basement of the Aquatic Potential of Thessaly, (WD 08)”.

Conflicts of Interest

The authors declare no conflict of interest.

References

  1. Johnson, D.L.; Lewis, L.A. Land Degradation: Creation and Destruction, 2nd ed.; Rowman and Littlefield: Lanham, MD, USA; Boulder, CO, USA; New York, NY, USA; Toronto, ON, Canada; Oxford, UK, 2007. [Google Scholar]
  2. Dalezios, N.R.; Eslamian, S. Environmental Impacts of Drought to Desertification Classification. In Handbook of Drought and Water Scarcity, 1st ed.; Eslamian, S., Eslamian, F., Eds.; Taylor and Francis: Boca Raton, FL, USA, 2017; Volume 2, pp. 45–63. [Google Scholar]
  3. Archer, S.; Stokes, C. Stress, disturbance and change in rangeland ecosystems. In Rangeland Desertification; Arnalds, O., Archer, S., Eds.; Springer: Dordrecht, The Netherlands, 2000; Volume 19, pp. 17–38. [Google Scholar] [CrossRef]
  4. Food and Agriculture Organization of the United Nations (FAO). The world’s drylands. In Carbon Sequestration in Dryland Soils; World Soil Resources Report No. 102; FAO: Rome, Italy, 2004; pp. 7–17. [Google Scholar]
  5. United Nations. Managing fragile ecosystems: Combating desertification and drought. In Proceedings of the United Nations Conference on Environment and Development, Rio de Janeiro, Brazil, 3–14 June 1992. [Google Scholar]
  6. Sivakumar, M.V.K.; Wilhite, D.A.; Svoboda, M.D.; Hayes, M.; Motha, R. Drought and Meteorological Droughts. In Global Assessment Report: GAR 2011 on Disaster Risk Reduction; UNISDR: Lincoln, NE, USA, 2010; pp. 1–26. [Google Scholar]
  7. Xiaoping, Y. Desertification and land degradation in arid and semi-arid regions. In Geomorphological Hazards and Disaster Prevention; Alcántara-Ayala, I., Goudie, A., Eds.; Cambridge University Press: Cambridge, UK, 2010; pp. 189–198. [Google Scholar] [CrossRef]
  8. Dalezios, N.R.; Blanta, A.; Spyropoulos, N.V. Assessment of remotely sensed drought features in vulnerable agriculture. Nat. Hazards Earth Syst. Sci. 2012, 12, 3139–3150. [Google Scholar] [CrossRef] [Green Version]
  9. Dalezios, N.R.; Blanta, A.; Spyropoulos, N.V.; Tarquis, A.M. Risk Identification of Agricultural Drought for Sustainable Agroecosystems. Nat. Hazards Earth Syst. Sci. 2014, 14, 2435–2448. [Google Scholar] [CrossRef] [Green Version]
  10. Mylopoulos, N.; Sidiropoulos, P. A stochastic optimization framework for the restoration of an over-exploited aquifer. Hydrol. Sci. J. 2016, 61, 1691–1706. [Google Scholar] [CrossRef] [Green Version]
  11. Sidiropoulos, P.; Mylopoulos, N.; Loukas, A. Stochastic Simulation and Management of an Over-Exploited Aquifer Using an Integrated Modeling System. Water Resour. Manag. 2015, 29, 929–943. [Google Scholar] [CrossRef]
  12. Sidiropoulos, P.; Tziatzios, G.; Vasiliades, L.; Mylopoulos, N.; Loukas, A. Groundwater Nitrate Contamination Integrated Modeling for Climate and Water Resources Scenarios: The Case of Lake Karla Over-Exploited Aquifer. Water 2019, 11, 1201. [Google Scholar] [CrossRef] [Green Version]
  13. Kosmas, C.; Kirkby, M.J.; Geeson, N. Medalus Project: Mediterranean Desertification and Land Use. Manual on Key Indicators of Desertification and Mapping Environmentally Sensitive Areas; Publication of European Union: Brussels, Belgium, 1999; pp. 1–94. [Google Scholar]
  14. Karamesouti, M.; Panagos, P.; Kosmas, C. Model-based spatio-temporal analysis of land desertification risk in Greece. Catena 2018, 167, 266–275. [Google Scholar] [CrossRef]
  15. Dalezios, N.R. Environmental Hazards Methodologies for Risk Assessment and Management, 1st ed.; IWA: London, UK, 2017; pp. 1–534. [Google Scholar]
  16. Sheikh, B.A.; Soomro, G.H. Desertification: Causes, consequences and remedies. Pak. J. Agric. 2006, 22, 44–51. [Google Scholar]
  17. Dalezios, N.R.; Loukas, A.; Vasiliades, L.; Liakopoulos, E. Severity-Duration-Frequency Analysis of Droughts and Wet Periods in Greece. Hydrol. Sci. J. 2000, 45, 751–770. [Google Scholar] [CrossRef]
  18. Geist, H.J.; Lambin, E.F. Dynamic causal patterns of desertification. Bioscience 2004, 54, 817–829. [Google Scholar] [CrossRef] [Green Version]
  19. Heim, R.R., Jr. A Review of Twentieth-Century Drought Indices Used in the United States. Bull. Am. Meteorol. Soc. 2002, 83, 1149–1165. [Google Scholar] [CrossRef] [Green Version]
  20. Wilhite, D.A.; Hayes, M.J.; Kinutson, C.; Smith, K.H. Planning for drought: Moving from crisis to risk management. J. Am. Water Resour. Assoc. 2000, 36, 697–710. [Google Scholar] [CrossRef]
  21. Dalezios, N.R.; Angelakis, A.N.; Eslamian, S. Water Scarcity Management: Part 1: Methodological Framework. Int. J. Glob. Environ. Issues 2018, 17, 1–40. [Google Scholar] [CrossRef]
  22. Dalezios, N.R.; Dercas, N.; Eslamian, S. Water Scarcity Management: Part 2: Satellite-based Composite Drought Analysis. Int. J. Glob. Environ. Issues 2018, 17, 267–295. [Google Scholar] [CrossRef]
  23. Keyantash, J.; Dracup, J.A. The Quantification of Drought: An Evaluation of Drought Indices. Bull. Am. Meteorol. Soc. 2002, 83, 1167–1180. [Google Scholar] [CrossRef]
  24. McVicar, T.R.; Jupp, D.L.B. The Current and Potential Operational Uses of Remote Sensing to Aid Decisions on Drought Exceptional Circumstances in Australia: A Review. Agric. Syst. 1998, 57, 399–468. [Google Scholar] [CrossRef]
  25. Mishra, A.K.; Singh, V.P. A Review of Drought Concepts. J. Hydrol. 2010, 39, 202–216. [Google Scholar] [CrossRef]
  26. Choi, M.; Jacobs, J.M.; Anderson, C.M.; Bosch, D.D. Evaluation of drought indices via remotely sensed data with hydrological variables. J. Hydrol. 2013, 476, 265–273. [Google Scholar] [CrossRef]
  27. Steinemann, A.; Hayes, M.A.; Cavalcanti, L. Drought Indicators and Triggers. In Drought and Water Crises: Science Technology and Management Issues; Wilhite, D.A., Ed.; Taylor and Francis: Abingdon, UK, 2005; Volume 4, pp. 71–90. [Google Scholar]
  28. Mckee, T.B.; Doesken, N.J.; Kleist, J. The relationship of drought frequency and duration to time scales. In Proceedings of the Eighth Conference on Applied Climatology, Anaheim, CA, USA, 17–22 January 1993. [Google Scholar]
  29. Kogan, F.N. Application of vegetation index and brightness temperature for drought detection. Adv. Space Res. 1995, 15, 91–100. [Google Scholar] [CrossRef]
  30. Darkoh, M.B.K. Population, environment and sustainable development: Desertification in Africa. Desertif. Control Bull. 1994, 25, 20–26. [Google Scholar]
  31. Climate Hazard Group Releases New Version of CHIRPS. Available online: https://geog.ucsb.edu/climate-hazard-group-releases-new-version-of-chirps/ (accessed on 2 July 2018).
  32. Duan, Z.; Liu, J.; Tuo, Y.; Chiogna, G.; Disse, M. Evaluation of eight high spatial resolution gridded precipitation products in Adige Basin (Italy) at multiple temporal and spatial scales. Sci. Total Environ. 2016, 573, 1536–1553. [Google Scholar] [CrossRef] [PubMed] [Green Version]
  33. Nguyen, P.; Ombadi, M.; Sorooshian, S.; Hsu, K.; AghaKouchak, A.; Braithwaite, D.; Ashouri, H.; Thorstensen, A.R. The PERSIANN family of global satellite precipitation data: A review and evaluation of products. Hydrol. Earth Syst. Sci. 2018, 22, 5801–5816. [Google Scholar] [CrossRef] [Green Version]
  34. Chen, Z.; Lin, X.; Xiong, C.; Chen, N. Modeling the Relationship of Precipitation and Water Level Using Grid Precipitation Products with a Neural Network Model. Remote Sens. 2020, 12, 1096. [Google Scholar] [CrossRef] [Green Version]
  35. Ayoub, A.B.; Tangang, F.; Juneng, L.; Mou Leong Tan, M.L.; Chung, J.X. Evaluation of Gridded Precipitation Datasets in Malaysia. Remote Sens. 2020, 12, 613. [Google Scholar] [CrossRef] [Green Version]
  36. World Meteorological Organization (WMO). Standardized Precipitation Index. User Guide; WMO: Geneva, Switzerland, 2012. [Google Scholar]
  37. Qin, Y.; Yang, D.; Lei, H.; Xu, K.; Xu, X. Comparative analysis of drought based on precipitation and soil moisture indices in Haihe basin of North China during the period of 1960–2010. J. Hydrol. 2015, 525, 55–67. [Google Scholar] [CrossRef]
  38. Guttman, N.B. Accepting the Standardized Precipitation Index: A calculation algorithm. J. Am. Water Resour. Assoc. 1999, 35, 311–322. [Google Scholar] [CrossRef]
  39. World Meteorological Organization. Agricultural Drought Indices—Proceedings of an Expert meeting. In Proceedings of the WMO/UNISDR Expert Group Meeting on Agricultural Drought Indices, Murcia, Spain, 2–4 June 2010. [Google Scholar]
  40. Borrelli, P.; Robinson, D.A.; Fleischer, L.R.; Lugato, E.; Ballabio, C.; Alewell, C.; Meusburger, K.; Modugno, S.; Ferro, V.; Schütt, B.; et al. An assessment of the global impact of 21st century land use change on soil erosion. Nat. Commun. 2017, 8, 2013. [Google Scholar] [CrossRef] [Green Version]
  41. Harbaugh, A.W.; McDonald, M.G. User’s Documentation for MODFLOW-2000, an Update to the U.S. Geological Survey Modular Finite-Difference Ground-Water Flow Model; United States Government Printing Office: Washington, DC, USA, 2000.
  42. Johnson, A.I. Specific Yield—Compilation of Specific Yields for Various Materials; U.S. Government Printing Office: Washington, DC, USA, 1967; pp. 13–15. [CrossRef]
  43. Loukas, A.; Mylopoulos, N.; Vasiliades, L. A Modelling System for the Evaluation of Water Resources Management Scenarios in Thessaly, Greece. Water Resour. Manag. 2007, 21, 1673–1702. [Google Scholar] [CrossRef]
  44. Loukas, A.; Mylopoulos, N.; Kokkinos, K.; Sidiropoulos, P.; Vasiliades, L.; Liakopoulos, A. The effect of spatial discretization in integrated modeling of surface and groundwater hydrology through OpenMI. In Proceedings of the International Interdisciplinary Conference on Predictions for Hydrology, Ecology and Water Resources Management: Using Data and Models to Benefit Society, Prague, Czech Republic, 15–18 September 2008. [Google Scholar]
  45. Ministry of Interior; Ministry of Finance and Development; Ministry of Environment and Energy. Official Journal of the Government 3282/B’/19-09-2017: Water Quality of Human Consumption in Compliance with the Provisions of Directive 98/83/EC of the Council of Europe of 3rd November 1998 as Amended by Directive (EU) 2015/1787 (L260, 7.10.2015); Greek Government: Athens, Greece, 2017; pp. 39381–39396.
  46. Emadodin, I.; Reinsch, T.; Taube, F. Drought and Desertification in Iran. Hydrology 2019, 6, 66. [Google Scholar] [CrossRef] [Green Version]
  47. Habibi, V.; Ahmadi, H.; Jafari, M.; Moeini, A. Application of nonlinear models and groundwater index to predict desertification case study: Sharifabad watershed. Nat. Hazards 2019, 99, 715–733. [Google Scholar] [CrossRef]
  48. Martinez-Valderrama, J.; Guirado, E.; Maestre, F.T. Unraveling Misunderstandings about Desertification: The Paradoxical Case of the Tabernas-Sorbas Basin in Southeast Spain. Land 2020, 9, 269. [Google Scholar] [CrossRef]
Figure 1. Map of Lake Karla watershed, aquifer, and locations of groundwater monitoring stations.
Hydrology 08 00047 g001
Figure 2. The normalized distribution applied by the SPI: (a) fitted gamma distribution for the cumulated monthly precipitation in Equations (5) and (6); (b) standardized normal distribution for SPI in Equation (8). Wetness is expressed by positive SPI values while dryness by negative values.
Hydrology 08 00047 g002
Figure 3. The average value of SPI of the 63 cells located in the study area for the last thirty-eight years.
Hydrology 08 00047 g003
Figure 4. Maps of aquifer indicating the spatially distributed classes of: (a) Standardized Precipitation Index for November 2011, (b) Soil erosion for the period 2001–2012.
Hydrology 08 00047 g004
Figure 5. Graph of surface runoff and recharge monthly values generated by UTBAL model.
Hydrology 08 00047 g005
Figure 6. Maps of: (a) initial hydraulic heads contours of aquifer for 1987, (b) simulated hydraulic heads contours for April 2013, and (c) groundwater depletion classes of Karla watershed aquifer.
Hydrology 08 00047 g006
Figure 7. Maps of aquifer indicating the spatially distributed classes of: (a) pH, (b) conductivity, (c) Na, (d) Mg, (e) Ca, (f) K.
Hydrology 08 00047 g007aHydrology 08 00047 g007b
Figure 8. Map of Classification of Desertification Risk for Lake Karla aquifer.
Hydrology 08 00047 g008
Table 1. Dryland classes.
Aridity Index: P/PETRainfall (mm)Classification
PET > P Desert climate
<0.03<200Hyperarid
0.03–0.2<200 (winter)Arid
<400 (summer)
0.2–0.5200–500 (winter)Semiarid
400–600 (summer)
0.5–0.65500–700 (winter)Dry subhumid
500–700 (summer)
>0.65 No desertification
Table 2. Typical rainfed crops grown in drylands.
ClassificationGrowing Season (days)Typical Crops
Hyperarid0No crop, no paster
Arid1–59No crops, marginal pasture
Semiarid60–119Bulrush millet, sorghum, sesame
Dry subhumid120–179Maize, beans, groundnut, peas, barley, wheat
Table 3. Standardized Precipitation Index classification scale.
Standardized Precipitation Index ValueMoisture Level
+2.0 and greaterExtremely wet
+1.5 to 1.99Very wet
+1.0 to 1.49Moderately wet
−0.99 to 0.99Near normal–mild dry
−1.0 to −1.49Moderately dry
−1.5 to −1.99Severely dry
−2.0 and lessExtremely dry
Table 4. Characteristics of parameters classes’ generation methodology.
ParameterReference PeriodNo of Scatter DataMethodologyClasses
DroughtNovember 2011-SPI1. 0.99 ≤ SPI > −0.99
2. −1.5 < SPI ≤ 1
3. −2.0 < SPI ≤ −1.5
4. SPI ≤ −2.0
Soil Degradation Assessment (t ha−1 yr−1)2012-European Soil Data Centre database1. 0 t ha−1 yr−1 < SE < 20
2. 20 ≤ SE < 40
3. 40 ≤ SE < 60
4. SE ≥ 60
Groundwater depletion (m)April 2013-Simulation with Modflow code1. 0 ≤ Depletion < 30
2. 30 ≤ Depletion < 60
3. 60 ≤ Depletion < 90
4. Depletion ≥ 90
pHApril 201327Simple kriging1. 5 ≤ pH < 6
2. 6 ≤ pH < 7.5
3. 7.5 ≤ pH < 8.5
4. pH ≥ 8.5
Conductivity (μs/cm)April 201331Simple kriging1. 0 < Cond. < 300
2. 300 ≤ Cond. < 640
3. 640 ≤ Cond. < 840
4. Cond. ≥ 840
Natrium (mg/L)April 201327Simple kriging1. 0 < Na < 20
2. 20 ≤ Na < 150
3. 150 ≤ Na < 200
4. Na ≥ 200
Magnesium (mg/L)April 201328Simple kriging1. 0 < Mg < 30
2. 30 ≤ Mg < 40
3. 40 ≤ Mg < 50
4. Mg ≥ 50
Calcium (mg/L)April 201328Simple kriging1. 0 < Ca< 40
2. 40 ≤ Ca < 100
3. 100 ≤ Ca < 1000
4. Ca ≥ 1000
Kalium (mg/L)April 201326Simple kriging1. 0 < K < 5
2. 5 ≤ K < 10
3. 10 ≤ K < 12
4. K ≥ 12
Publisher’s Note: MDPI stays neutral with regard to jurisdictional claims in published maps and institutional affiliations.

