Article

Using Environmental Tracers to Characterize Groundwater Flow Mechanisms in the Fractured Crystalline and Karst Aquifers in Upper Crocodile River Basin, Johannesburg, South Africa

School of Geosciences, University of the Witwatersrand, Private Bag X3, Johannesburg P.O. Box Wits 2050, South Africa
*
Author to whom correspondence should be addressed.
Current Affiliation: Department of Geography and Environmental Science, Faculty of Science and Technology, National University of Lesotho, Maseru P.O. Roma 180, Lesotho
Submission received: 21 January 2021 / Revised: 3 March 2021 / Accepted: 11 March 2021 / Published: 19 March 2021

Abstract

:
Environmental isotope tracers were applied in the Upper Crocodile River Basin, Johannesburg, South Africa, to understand the groundwater recharge conditions, flow mechanisms and interactions between surface and subsurface water. Stable isotope analysis indicated that recharge into the fractured quartzite aquifer occurs through direct mechanisms. The high variability in the stable isotope signature of temporal samples from Albert Farm spring indicated the importance of multiple samples for groundwater characterization, and that using a single sample may be yielding biased conclusions. The observed inverse relationship between spring discharge and isotope signature indicated the traces of rainfall amount effect during recharge, thereby suggesting piston groundwater flow. It is deduced that a measured discharge value can be used in this relationship to calculate the isotopic signature, which resembles effective rainfall. In the shallow alluvial deposits that overlie the granitic bed-rock, piezometer levels and stable isotopes revealed an interaction between Montgomery stream and interflow, which regulates streamflow throughout the year. This suggests that caution should be taken where hydrograph separation is applied for baseflow estimates, because the stream flow that overlies such geology may include significant interflow. The hydrochemistry evolution was observed in a stream fed by karst springs. As pH rises due to CO2 degassing, CaCO3 precipitates, thereby forming travertine moulds. The values of saturation indices that were greater than zero in all samples indicated supersaturation by calcite and dolomite and hence precipitation. Through 14C analysis, groundwater flow rate in the karst aquifer was estimated as 11 km/year, suggesting deep circulation in karst structures.

1. Introduction

Groundwater plays a central role in socio-economic development of regions with semi-arid/arid climate [1,2]. Moreover, its continual discharge through springs and river beds contributes to stream flow, and apart from the melting of snow in cold regions [3,4], groundwater discharge, also called baseflow, is often the main reason why perennial streams are able to sustain flows in dry seasons [5,6]. However, baseflow occurrence is quite uncommon in arid and semi-arid regions because of the difficulty of direct recharge [1,7,8]. The difficulty is caused by high evapotranspiration of water that has infiltrated the soil, thereby limiting percolation, such that actual recharge becomes restricted to line and point surface water channels such as streambeds and reservoir basins [1,9]. Partly due to unfavoured direct recharge, the water table is usually deep, thereby enhancing focused recharge on any surface water, leading to ephemeral streams [1,10]. Because baseflow occurrence is not often expected in arid and semi-arid regions, the existence of perennial springs and streams in this climatic setting calls for a need to assess recharge and flow mechanisms associated with them, in order to support decision making for sustainable groundwater management of the aquifer.
The discharge of water from perennial springs contributes to stream flows in the form of baseflow. However, like all other terrestrial water resources, the spring flows are dependent on rainfall as a source of recharge, either as diffuse (direct) recharge from rainfall or as focused (indirect) recharge from a surface water body [7,10]. In some cases, the physical nature of the recharge area and the aquifer play a more significant role than the amount of rainfall in controlling the amount of recharge [2]. Horton [11] indicated that during a rainfall event, the amount of infiltration decreases with time until a constant infiltration rate is reached. The constant rate depends on the type of soil, such that clay soils attain a lower constant infiltration rate, while the open-textured sandy soils have a higher constant rate [11]. Once a constant rate is reached, any changes in rainfall, such as increase in intensity and amount, will not cause an increase in infiltration but will contribute to ponding and formation of overland flow [11,12]. On the other hand, infiltration that occurs through the fractures of a geological outcrop may occur rapidly and attain a much higher constant infiltration rate.
The projected changes in climate variables indicate a decreased rainy season [13] and increased intensity of daily rainfall, which in its nature, often enhances runoff rather than recharge [14], although in some cases it may promote rather than restrict recharge [15]. It therefore becomes necessary to understand how recharge would behave locally under the extremely high-intensity daily rainfall, in particular, by assessing the extent of recharge dependence on rainfall amount. Such assessments have been done using longterm groundwater levels and rainfall data in various parts of the world with different geological settings [15,16,17]. In this study, the stable isotopes of water (δ18O and δ2H) are used to understand the recharge mechanism, air temperatures at the time of recharge and the dependence of recharge amount and spring discharge on the amount of rainfall. Additionally, the physicochemical parameters are used to understand the morphology of the streambed downstream of the karst springs.
Chemical and environmental isotope tracers have been found to be quite useful in determining the provenance of water [18,19]. Stable isotopes, in particular, are able to maintain their signature once recharge occurs and to store information about the atmospheric conditions that existed prior to recharge [19]. The d-excess, which is the extent of deviation from the meteoric water line (MWL) or Y-intercept, is able to provide information about the temperature and humidity conditions at the sea surface during primary evaporation, humidity along the moisture trajectory and the occurrence of secondary evaporation (re-evaporation) in the sub-cloud [18,20].
The aim of this study is to understand the groundwater recharge conditions, the flow mechanisms and the interaction between surface and subsurface water in the crystalline and karst aquifers. Additionally, the evolution of hydrochemistry and travel time in the karst aquifers are assessed using the physicochemical parameters and 14C, respectively. The results from this study shall be useful to water researchers interested in the use of environmental and chemical isotopes to assess groundwater recharge and its interaction with surface water.

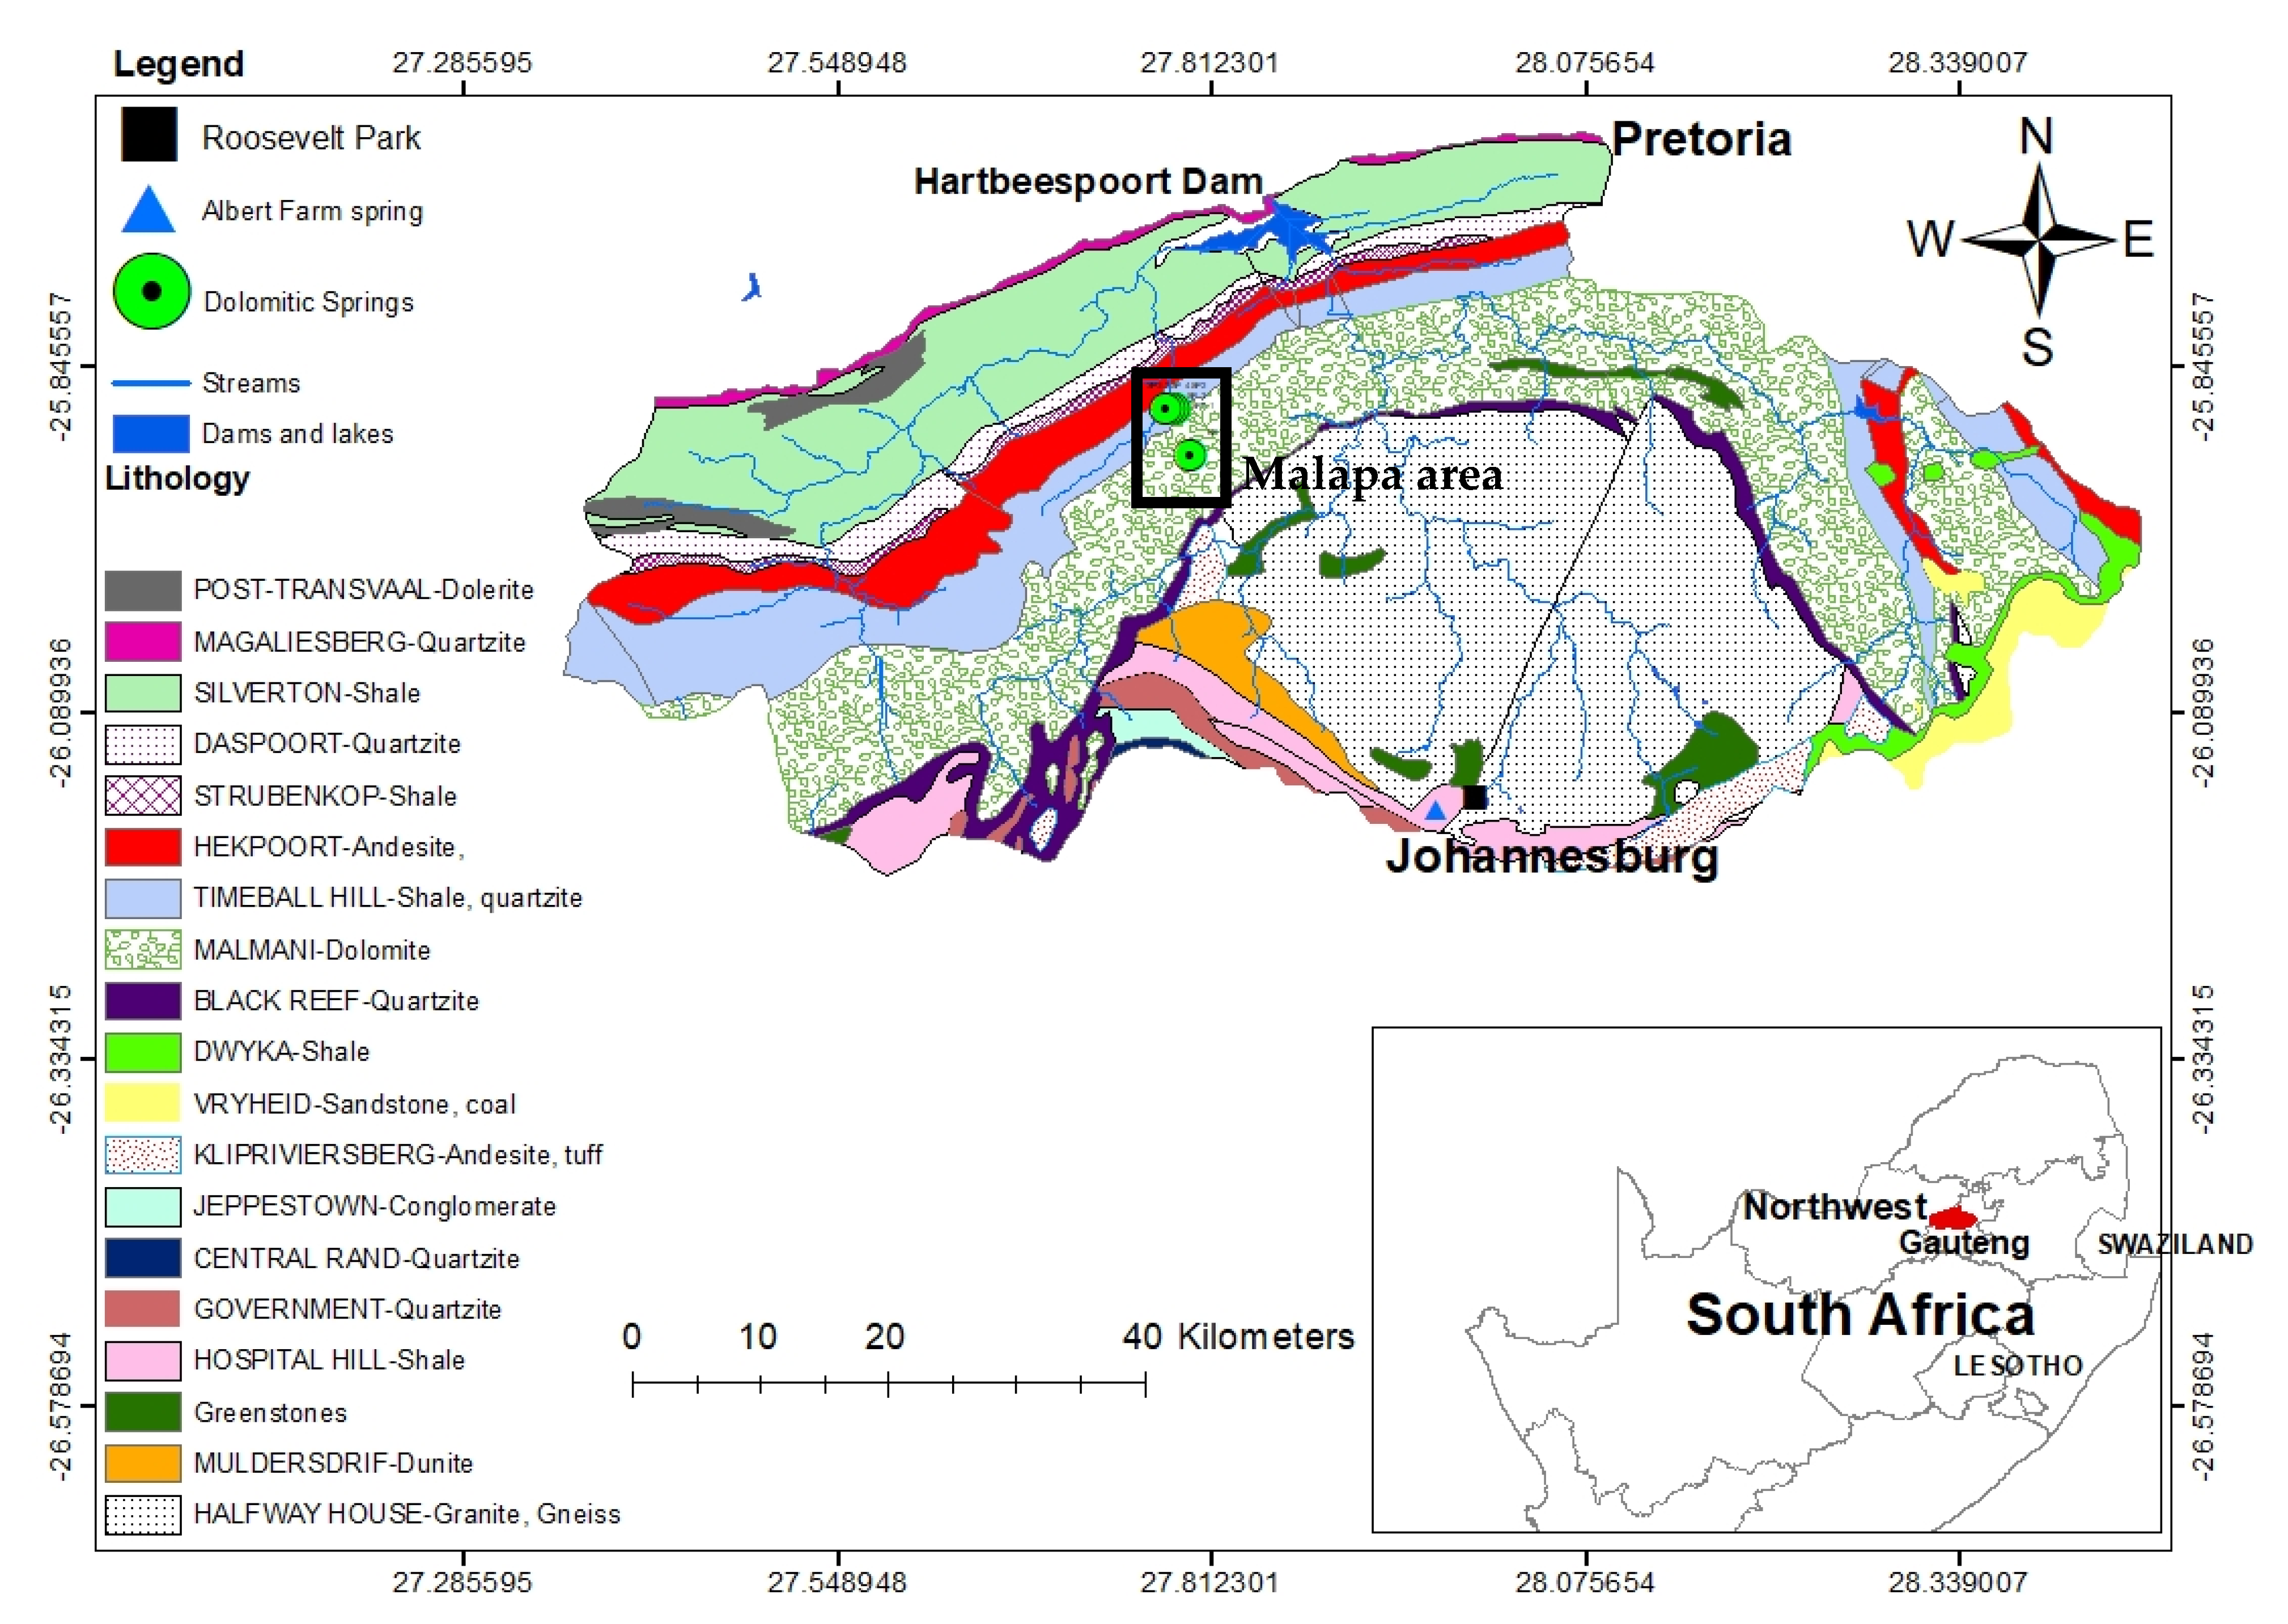
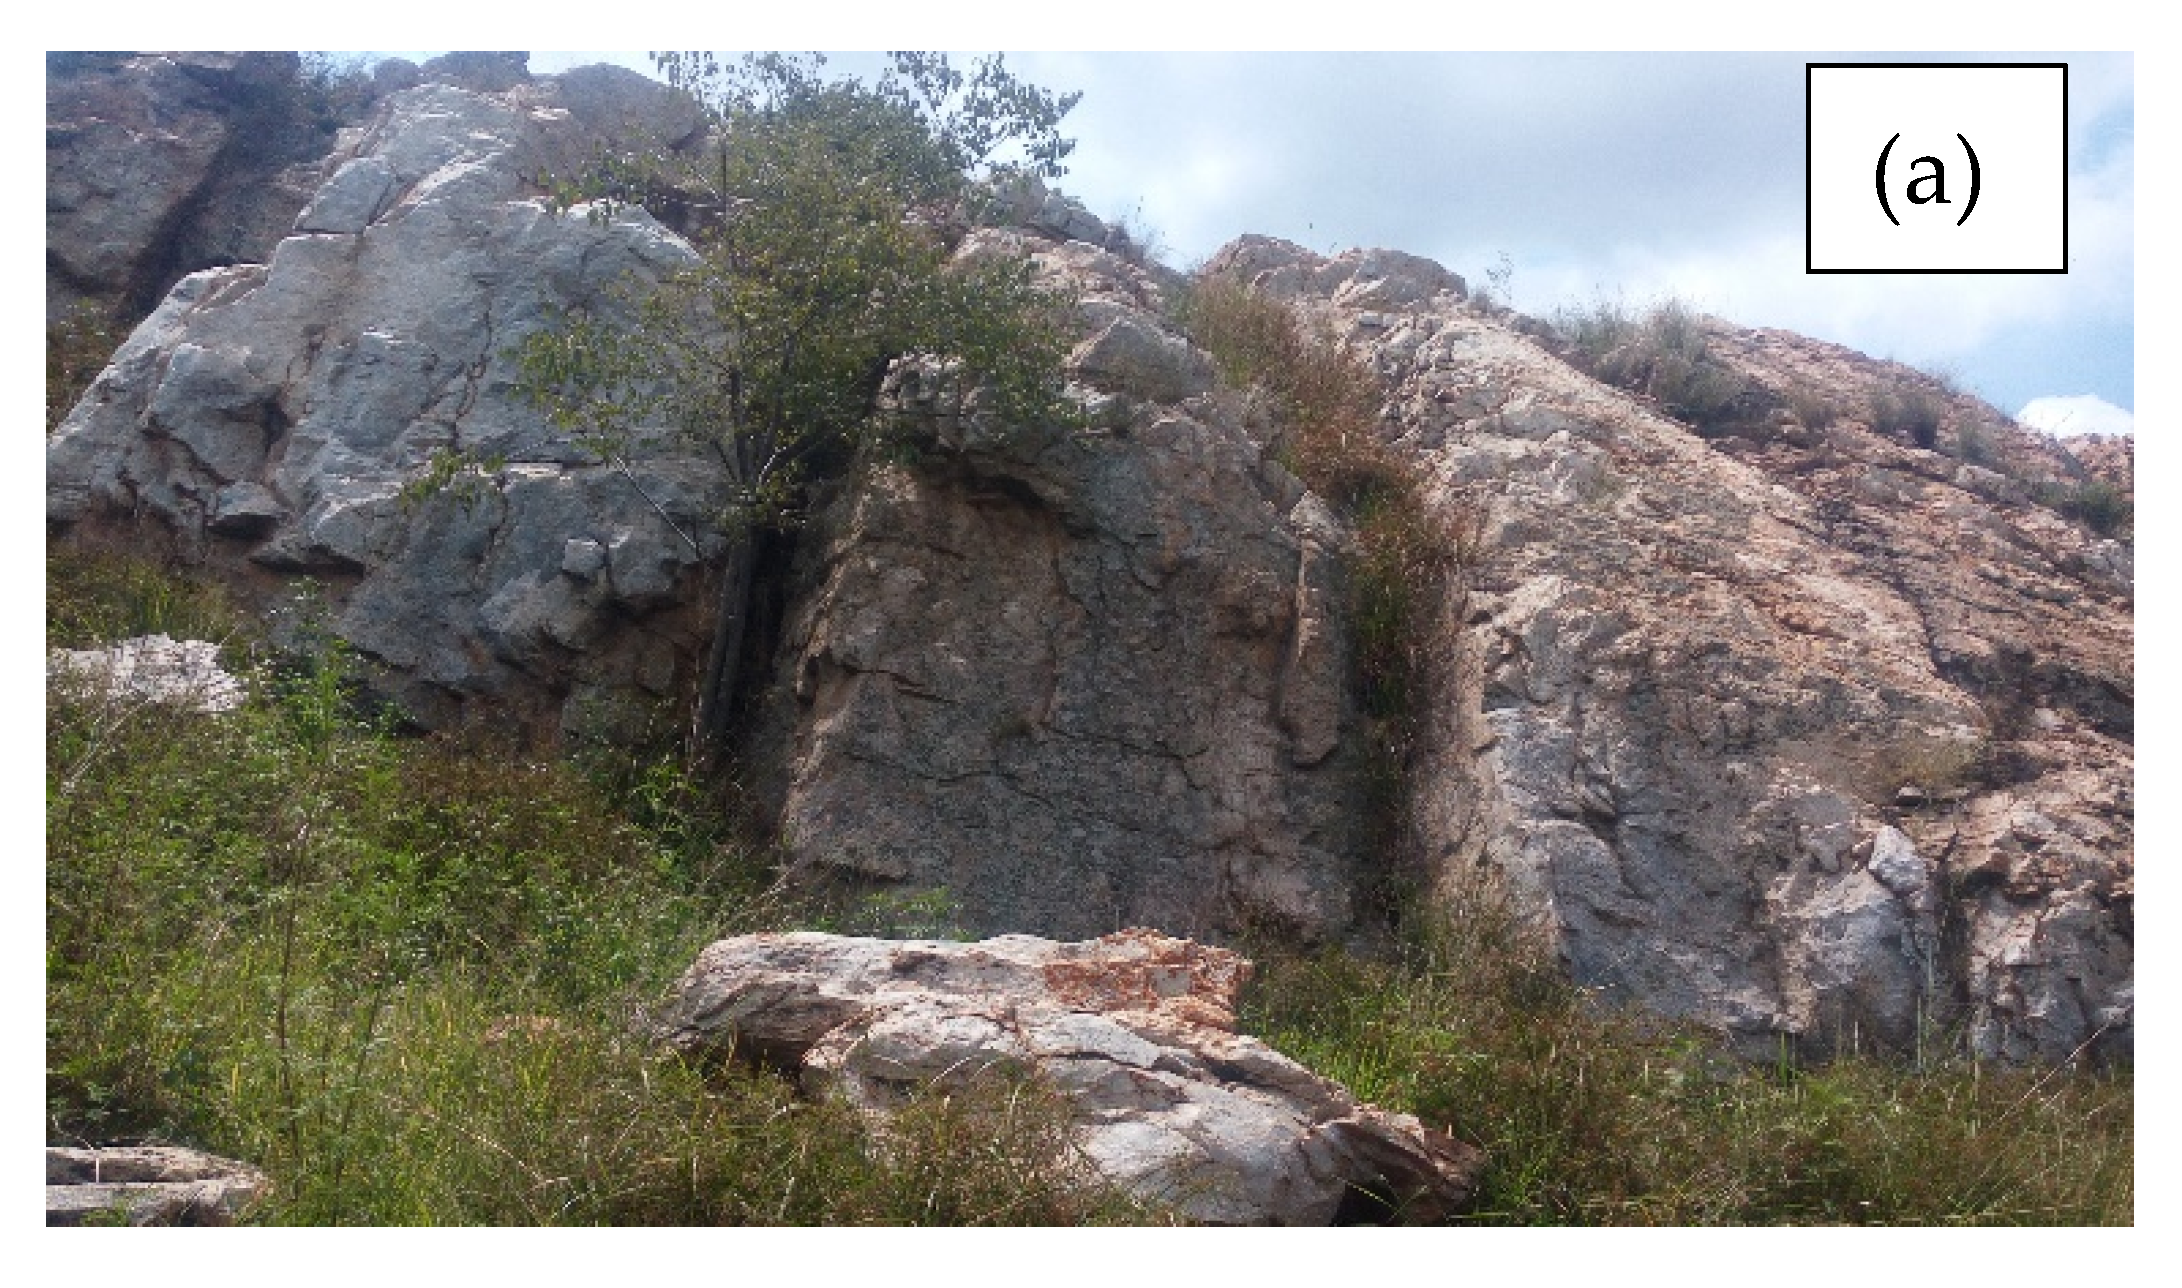
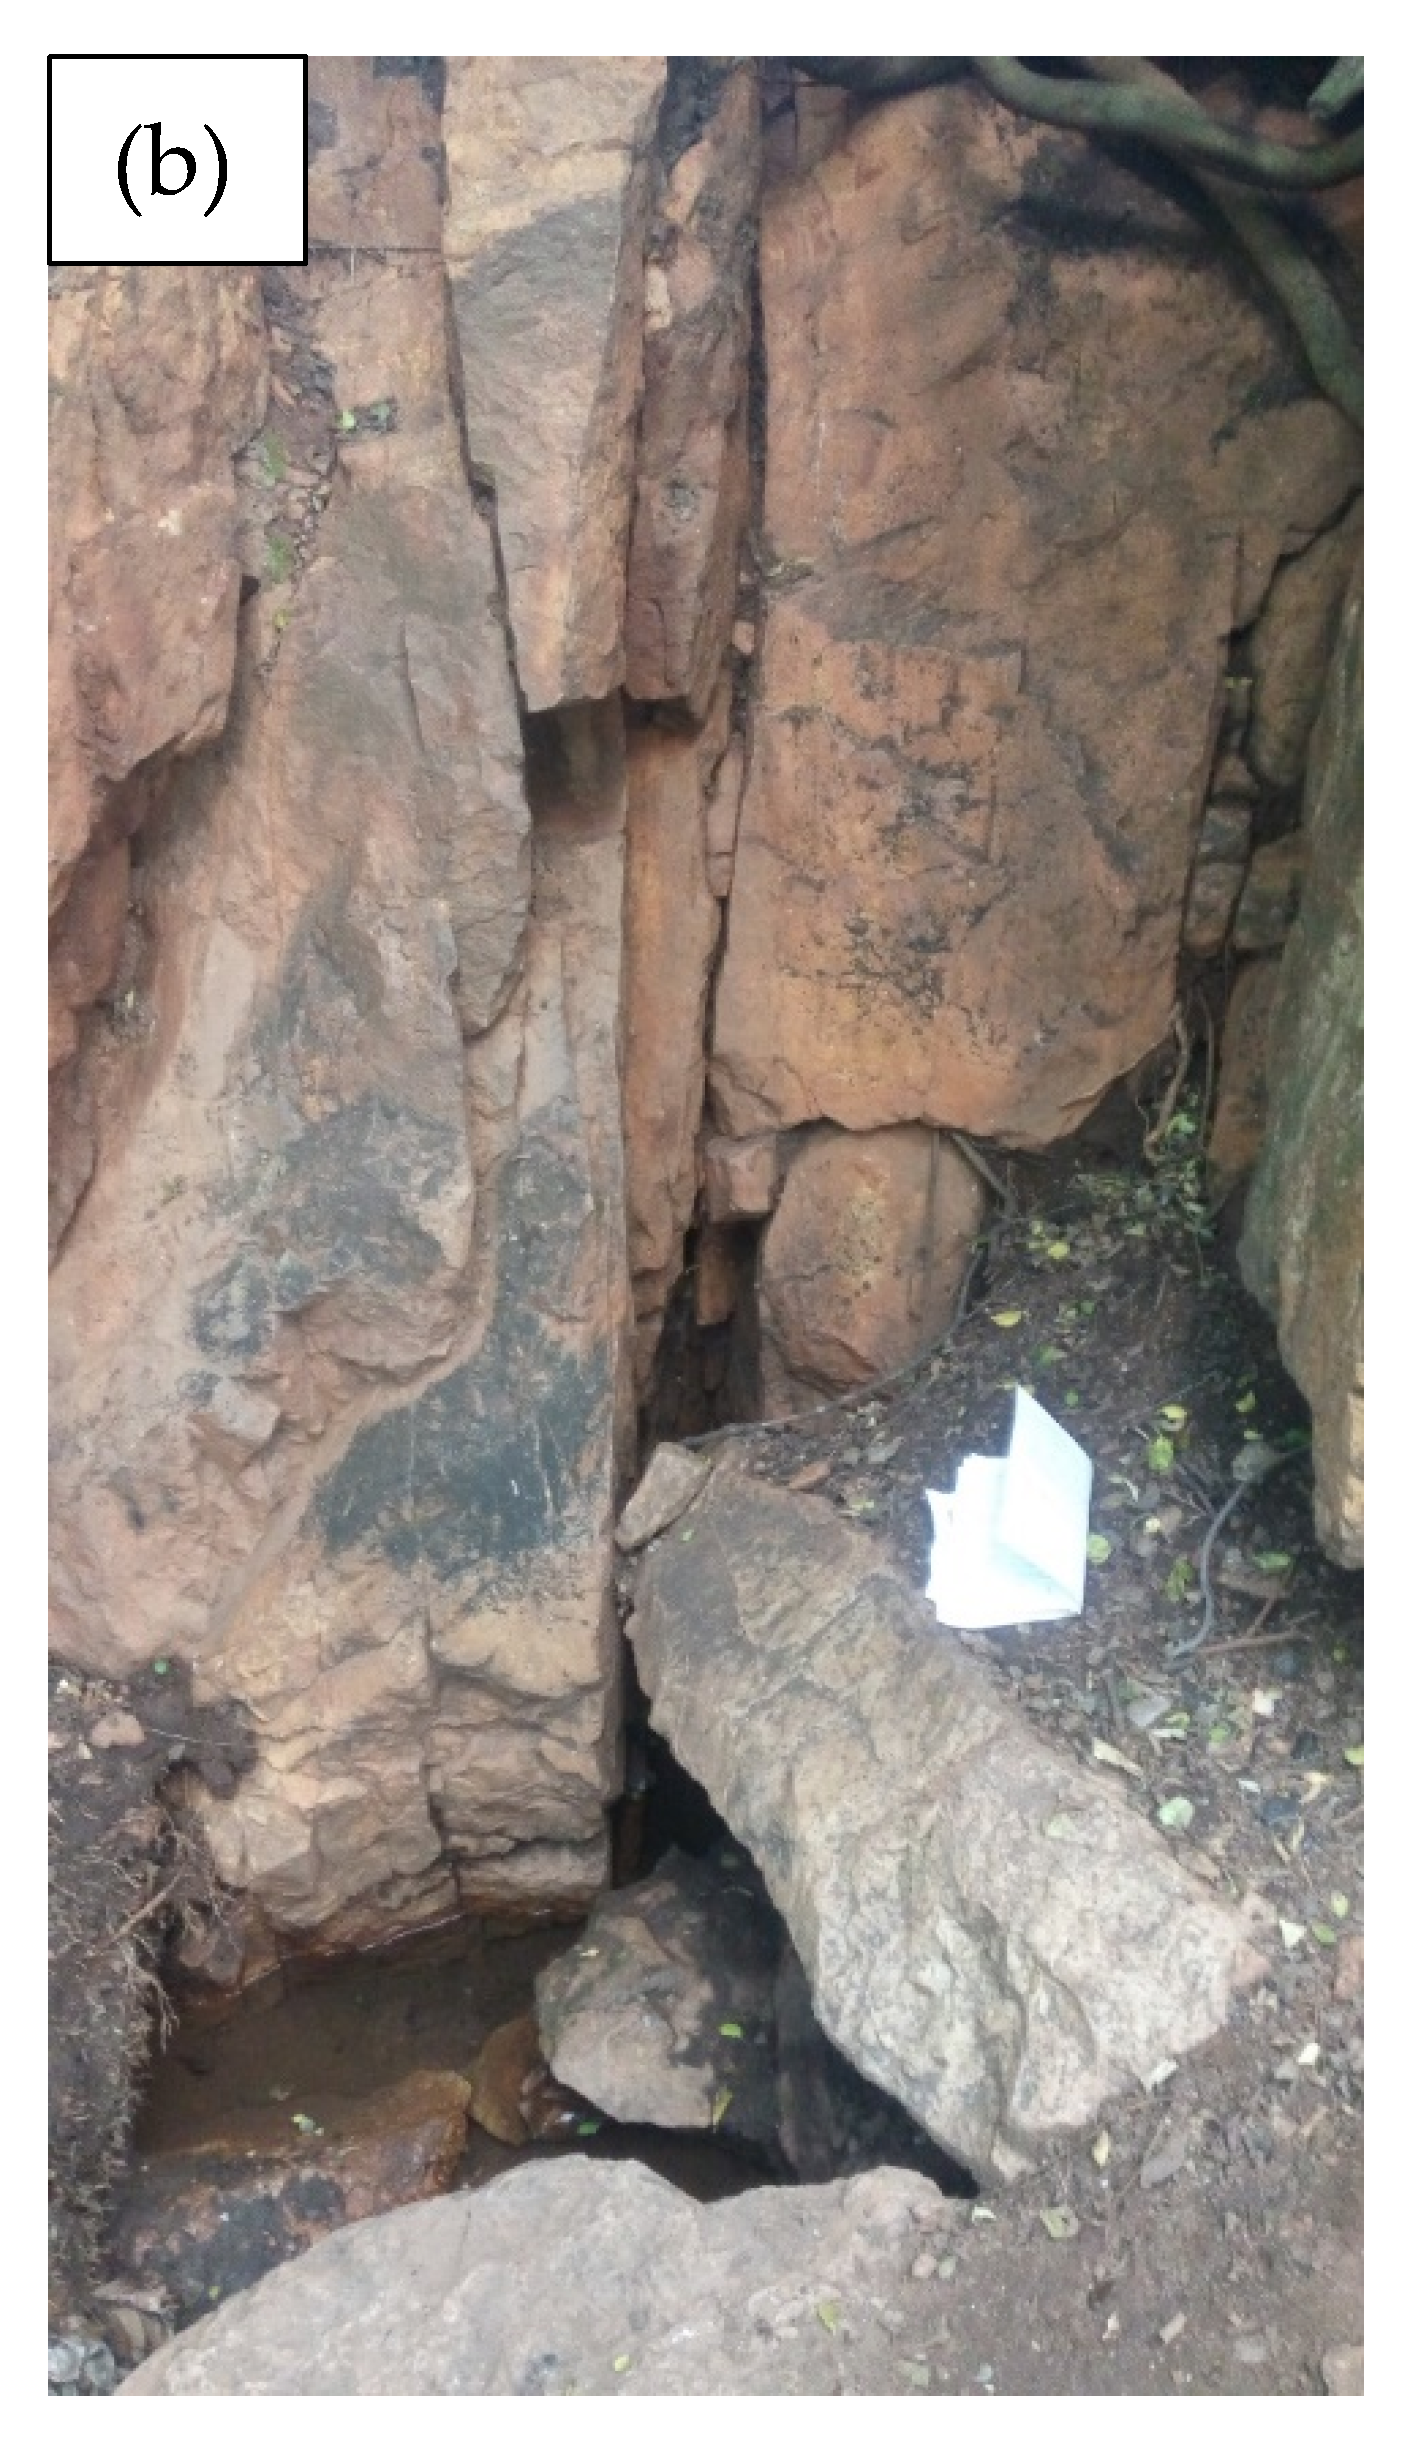
2. Description of the Study Area

The study area is located in the Upper Crocodile River Basin (UCRB) with the city of Johannesburg located in the south at the head waters of the catchment (Figure 1). The annual rainfall computed from the Johannesburg Botanical garden weather station (JHB Bot Tuin weather station; Figure 1) ranged between 380 mm and 907 mm for the period between 1997 and 2016, while the mean annual air temperature ranged between 15.2 °C and 18.9 °C for the same period. The UCRB predominantly receives rainfall in summer (October to April) in the form of convective rainfall, with a prevalence of cumulonimbus thundershowers and occasional frontal rainfall [21]. Tyson et al. [22] stated that the different origins of rainfall moisture for Southern Africa are the semi-permanent anticyclones that are located in the Atlantic Ocean and the Indian Ocean and the Intertropical Convergence Zone (ITCZ), while White and Peterson [23] and Renwick [24] also identified the high latitudes towards the Antarctic region. Additionally, van Wyk et al. [25] indicated that rainfall in the Southern African region mainly originates from the ITCZ in summer and the Atlantic Ocean in winter.
The regional geology (Figure 1) consists of the rocks from Witwatersrand Supergroup, Ventersdorp Supergroup, Karoo Supergroup and Transvaal Supergroup overlying the Basement Complex (granite, gabbro, serpentinite). The UCRB consists of three experimental sites, which are the Albert Farm spring in Johannesburg city, Roosevelt Park along the Montgomery stream and the Malapa area within the Cradle of Human Kind World Heritage site, which is located about 40 km north of Johannesburg.
As can be seen in Figure 1, the Albert Farm spring is underlain by the rocks of the West Rand Group (Hospital Hill Formation) from the Witwatersrand Supergroup. The West Rand group consists of quartzites, reddish and ferruginous magnetic shales, gritty quartzites and conglomerate horizons [26,27]. Figure 2a shows the typical fractures that are located on the southern boundary of the UCRB from which the Albert Farm spring discharges. These fractures are common in the area, and they spread across the catchment boundary. The local geology at the Albert Farm spring consists of the highly fractured quartzites where the spring emerges under gravity at the contact between the overlying fractured quartzite (Figure 2b) and the underlying low permeability shale. The Albert Farm spring is a perennial source of water, and it discharges into the Montgomery stream, which in turn discharges into the Jukskei River flowing to the north direction and draining the city of Johannesburg (Figure 1). Because of the insignificant primary porosity and permeability of quartzite [28], it is evident that the perennial flows from Albert Farm spring rely on secondary porosity that is characterized by the intense tectonically induced and fold-associated fractures that stretch regionally.
Roosevelt Park is located about 4 km downstream of Albert Farm spring in an area that is underlain by the granites of the Basement Complex, which is a massive dome-like structure made of weathered and fractured Archaean granitic bodies [26,29]. It is intersected by fractures, and together with the weathered zones, fractures form areas of high hydraulic conductivity. The deposition of sand and gravel on the granite bedrock has formed a shallow intergranular aquifer along the river banks [26].
The Malapa area is underlain by Transvaal Supergroup, which consists of the Malmani dolomites that have formed karst aquifers, and the Timeball Hill shale and quartzites (Figure 1). The hydraulic conductivity is highly enhanced by the presence of karsts in the dolomites. There are numerous springs (Figure 3) that can be seen as wet patches within the depressions and the big springs that are characterized by high yields (the Nash Farm and Nouklip springs). The upslope spring is Nash Farm spring (SP1), which yields about 130 L/s with a catchment area of about 11.6 km2 [30]. Figure 3 presents an extract of the geological map in the Malapa area and the locations of the dolomitic springs. Water flows from Nash Farm spring into Grootvlei stream for about 200 m and finally forms a pool at SP2 and then flows for about 250 m, after which it infiltrates through a sinkhole. At 2.2 km downstream is Nouklip spring (SP3). Nouklip spring is the highest-yielding spring in the area with about 143 L/s [30]. The downstream springs include SP4, which has a yield of 4.5 L/s and other smaller springs whose yields range from 0.05 L/s to 1 L/s, all discharging into the Grootvlei stream. Moulds of travertine of about 1.5 m thickness are observed 100 m downstream of Nouklip spring on Grootvlei stream bed. The springs SP6 to SP9 are located downstream of the travertine moulds.

3. Materials and Methods

The Albert Farm spring (Figure 1) was sampled for stable isotope (δ18O and δ2H) analysis on monthly basis over a period of 25 months between June 2016 and June 2018. The periodic samples were collected to assess temporal variability of the stable isotope signature in the fractured quartzite aquifer. The stable isotope samples were collected in 10 mL glass bottles and carefully capped to ensure that there were no entrapped air bubbles, which can cause sample evaporation. The surface velocity method [6,31] was used to estimate the discharge of the spring using a styrofoam piece as a surface floater. The discharge measurement was done over a period of 14 months between February 2017 and May 2018. Because the channel is underlain by an irregular hard and fresh quartzite, the maximum length of the straight channel that was available for measurements was less than 2 m. In order to account for the roughness and size of the stream, the discharge calculated from the surface velocity method was adjusted by multiplying it with a correction factor of 75% [6].
Two piezometers were constructed in Roosevelt Park along the Montgomery stream (Figure 1). Piezometer PZ1 was constructed to the east and PZ2 on the western side of the Montgomery stream. Both were 3 m away from the stream channel. The piezometers penetrated the alluvial sand and gravel, reaching a depth of 2.5 m. The water levels were measured in the piezometers and in the stream channel, in both cases using the height of the piezometers as a reference point. Measurements were done once a month between June 2016 and September 2016, and each time, a 10 mL sample was collected for stable isotope analysis from the piezometers and the stream. Sampling from Roosevelt Park was done on the same day as Albert Farm spring. This analysis was specifically done during the dry period because the focus was to determine if there is a contribution of subsurface flow to stream flow during dry periods, and also because wet seasons are prone to flooding, which can destroy the piezometers and disrupt the monitoring program.
In the Malmani dolomites, water samples were collected from the six springs (SP1-SP4, SP6 and SP7) for analysis of major ions and the physical parameters were measured on-site in all nine springs prior to sampling using a multiparameter meter. The physicochemical analysis was done to understand the evolution of water as it flows along the flow path in the dolomitic terrain. Major ions were measured using a Dionex Ion Chromatograph, while the total alkalinity test was performed through titration with a 0.02 N HCl solution to an endpoint pH of 4.5. Additionally, sampling for 14C was done in SP1 and SP3 to determine the rate of groundwater flow between the two springs. The field sampling procedure for carbon isotopes involved filling a 50 L drum with water and adding carbonate-free NaOH to raise the pH to enhance precipitation of CO32- compound. A dash of phenolphthalein was added as a pH indicator. BaCl2 was then added to allow a reaction between Ba2+ and CO32− in solution to precipitate barium carbonate (BaCO3). The BaCO3 precipitate was then stored in 500 mL bottles for delivery to the laboratory.
The analysis for the stable isotopes (δ18O and δ2H) was done at the University of the Witwatersrand, Johannesburg, using the Liquid Water Isotope Analyser-model 45-EP. This machine is able to provide accurate results with a precision of approximately 1‰ for δ2H and 0.2‰ for δ18O in liquid water samples. The analysis was done against five standards of different known isotopic signatures. The 14C analysis was done at iThemba Laboratories in Johannesburg, South Africa, using a Hewlett Packard TriCarb liquid scintillation spectrometer.
A plot of Johannesburg Local Meteoric Water Line (JLMWL) [32] and monthly stable isotopes of Albert Farm spring was constructed to deduce the mechanism that is responsible for recharging the fractured quartzite aquifer. Using the monthly stable isotope and discharge data from Albert Farm spring, a plot of discharge versus isotope signature was constructed to determine the traces of rainfall amount effect in groundwater. The traces of amount effect were identified by the high spring yields that had a depleted isotopic signature and low yields that had an enriched isotopic signature, which indicated a high dependence of recharge on rainfall amount. In addition, based on the temperature effect, the Johannesburg air temperature-δ18O relationship for daily rainfall that was deduced by Leketa and Abiye [33] was applied to determine the air temperature at the time of recharge using δ18O from Albert Farm spring as a data input.
The plots of pH, electrical conductivy (EC), oxidation reduction potential (ORP) and saturation index versus distance along the flow path were created to visualise the variation of hydrochemistry. A hydrogeochemical modelling tool for Windows called PHREEQC [34] was used to calculate saturation indices of calcite and dolomite in each sample. This was done to investigate the formation of travertine that was observed downstream of SP3. Saturation index is a parameter used to deduce the level of saturation of a specific mineral in a water sample [35,36]. It is calculated using the formula presented on Equation (1) [37]:
S I =   log I A P K
where IAP is the ion activity product of the dissociated chemical species in solution and K is the equilibrium solubility product for the chemicals involved at the sample temperature [35,38]. A saturation index that is less than zero indicates that the water is undersaturated with respect to a mineral and is capable of dissolving more of the mineral during water–rock interaction. On the other hand, a saturation index greater than zero indicates a water sample that is supersaturated and, therefore, incapable of dissolving more of the mineral during water–rock interaction but ready to undergo precipitation [35,38].

4. Results and Discussions

4.1. Recharge Assessment and Subsurface Flow Mechanisms in the Basement Complex and the Witwatersrand Supergroup Quartzites

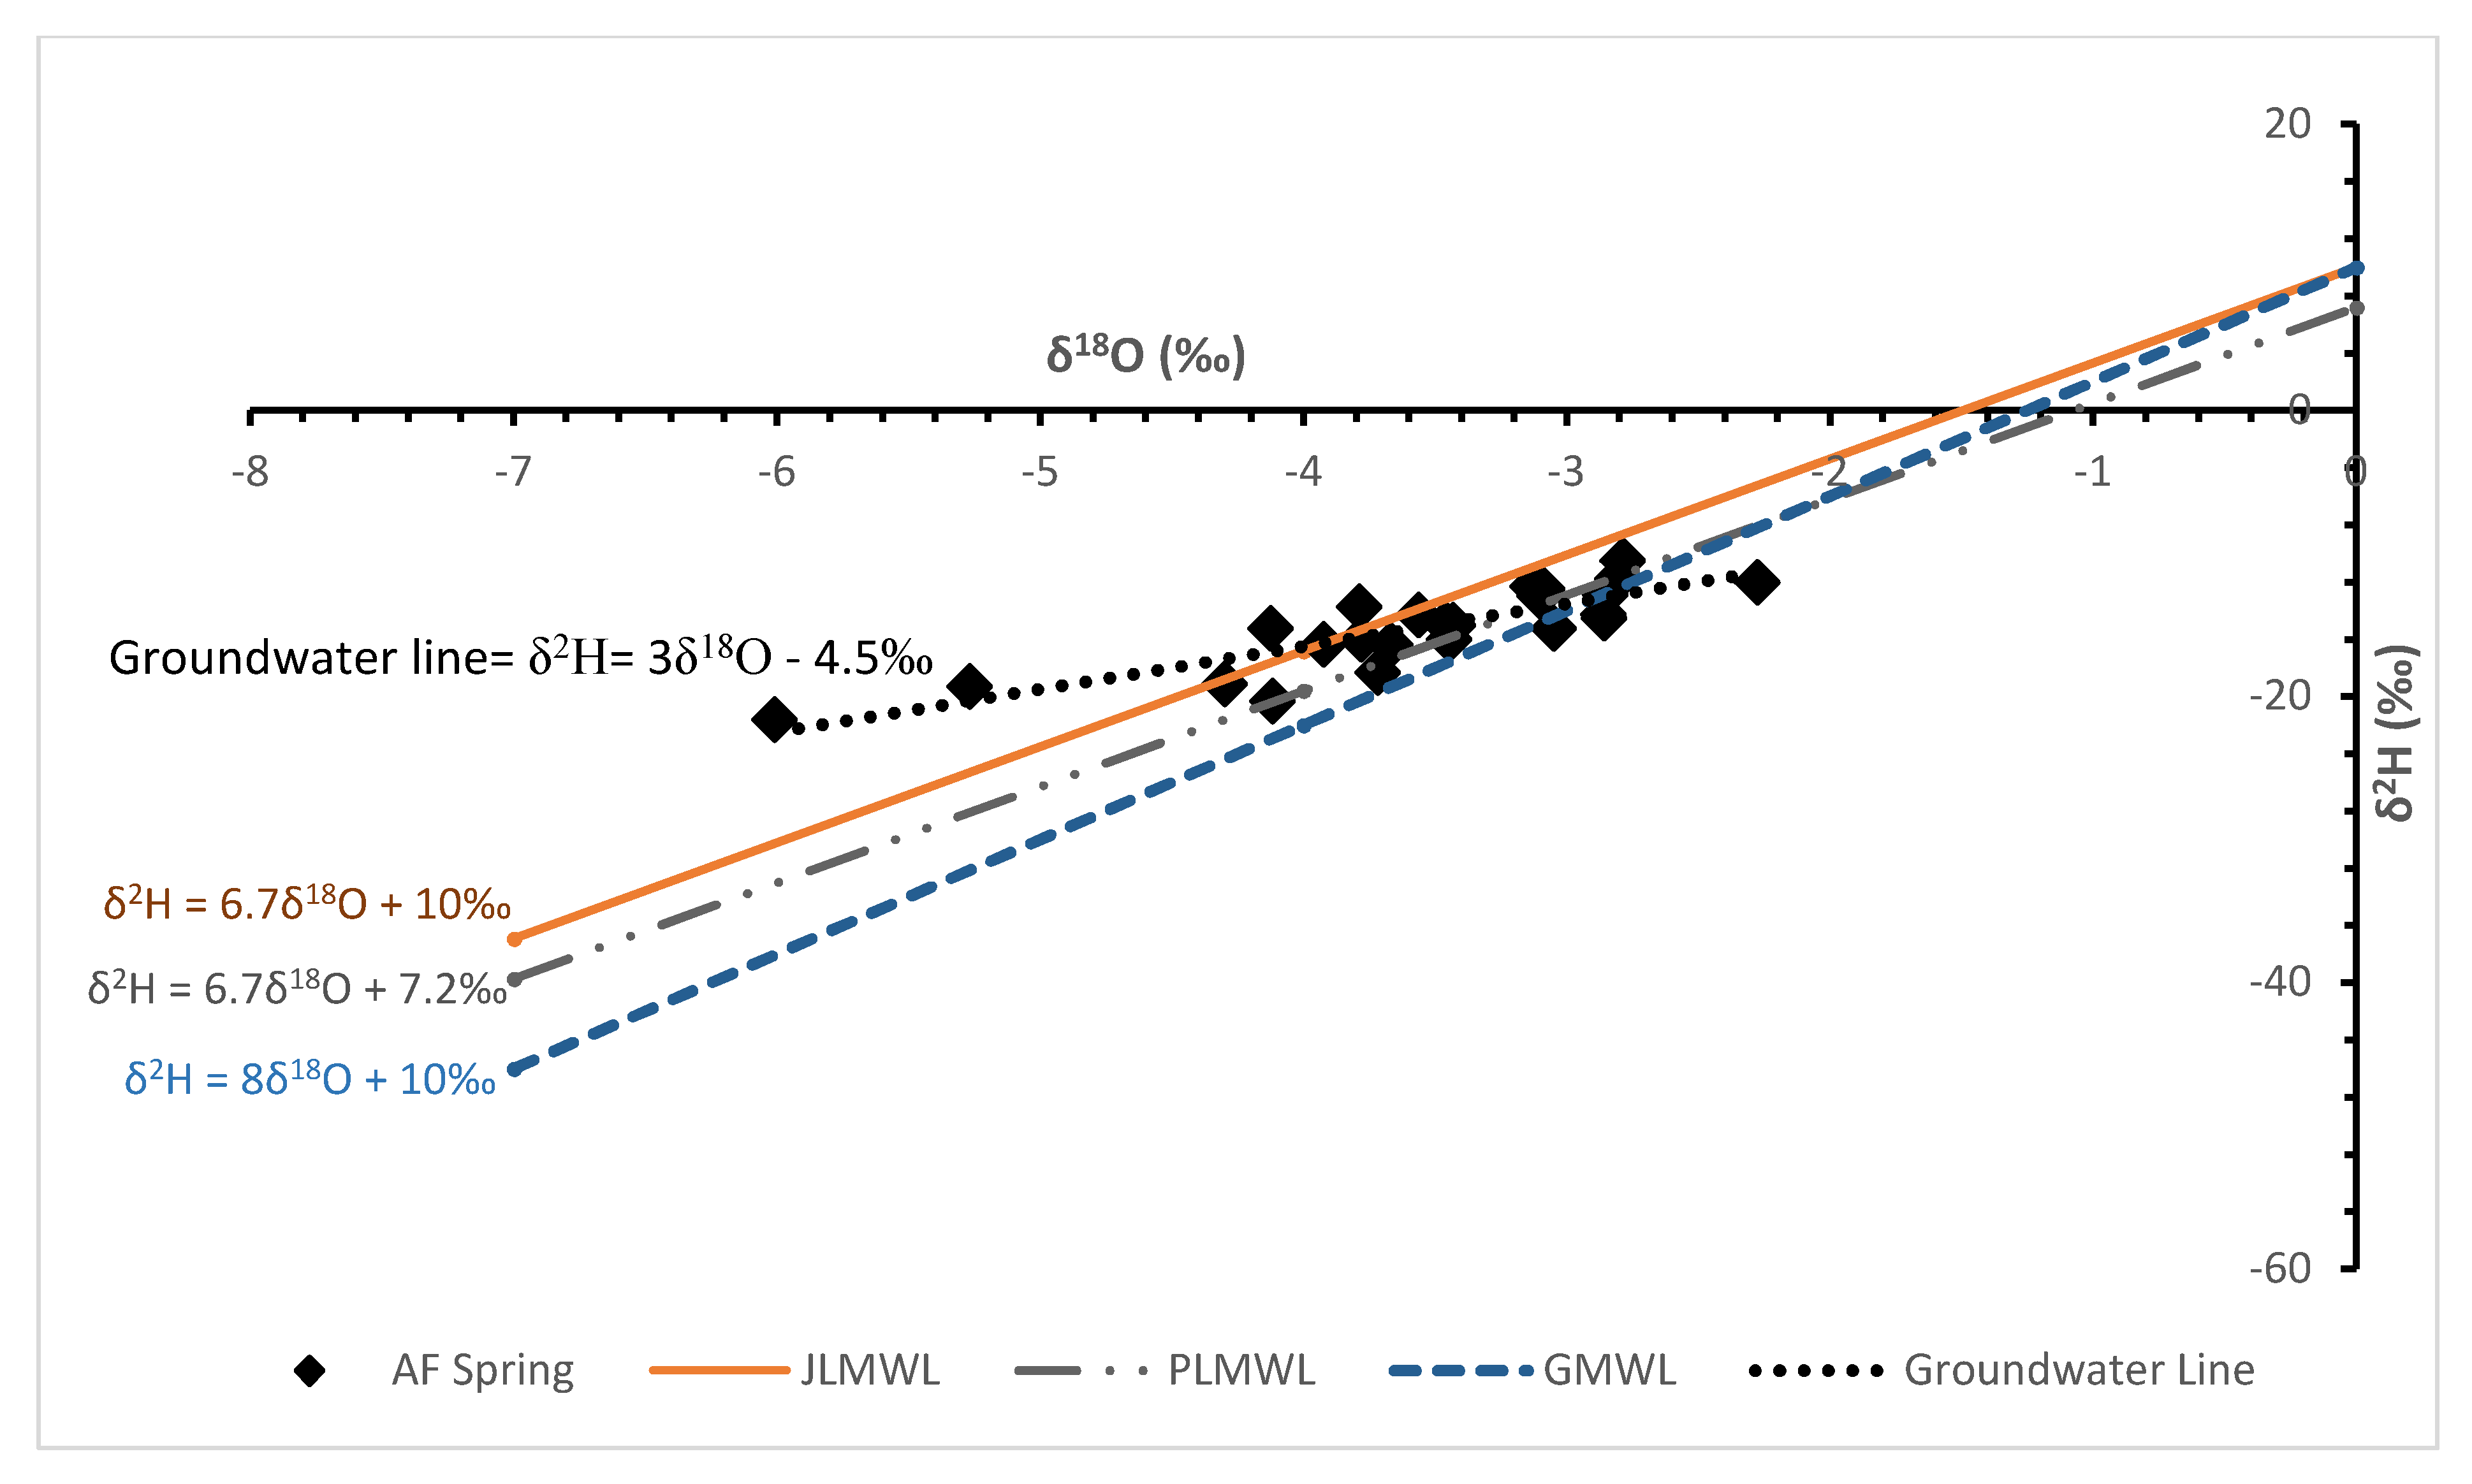
4.1.1. Recharge Assessment

The 25 months stable isotope data for Albert Farm spring are presented in Table 1. The d-excess values computed using the JLMWL [32] for each sample are also shown. The monthly stable isotope values for Albert Farm spring over the review period range from −6.01‰ to −2.28‰ for δ18O and from −21.6‰ to −10.5‰ for δ2H, while the d-excess ranges from +3.2‰ to +18.7‰. Only 16% of the Albert Farm samples have d-excess values greater than 10‰, which is a d-excess value for the JLMWL [32].
Figure 4 shows the stable isotope plot of Albert Farm spring samples with respect to the JLMWL, Pretoria Local Meteoric Water Line (PLMWL) and the Global Meteoric Water Line (GMWL). It can be observed in Figure 4 that over the 25-month period, the Albert Farm spring displayed a highly variable stable isotope signature and the majority of the samples plotted along the JLMWL with slight deviations characterized by a slope that is less than 6.7 of the JLMWL. Figure 4 also shows a groundwater line, which is a regression for the Albert Farm spring samples.
The position of Albert Farm spring samples along the JLMWL indicates that recharge occurs rapidly without undergoing extreme evaporation. This possibly occurs through the vertical fractures that are exposed along the catchment boundary made of quartzite (Figure 2). Figure 5 shows the plot of δ18O versus d-excess for Albert Farm spring samples. Despite the fact that all the samples are plotted along the JLMWL, 84% of the samples have d-excess values less than 10‰ and the groundwater stable isotope line has a lower slope of about 3 compared to 6.7 for the JLMWL. These conditions indicate possibilities of minor isotopic enrichment [20] from the low-humidity atmosphere. Figure 4 and Figure 5 reveal that although the spring samples represent a single sample location, there was high variability over the 25 month sampling period. This suggests that since recharge occurs without undergoing prior extreme evaporation (groundwater generally has an isotopic signature similar to rainfall), the observed high variability in the spring’s isotopic signature is a reflection of the variability in rainfall isotopic signature, rather than the variability in recharge mechanisms. It then becomes practical to use the variability in d-excess values for groundwater samples in Albert Farm spring to infer the conditions of the moisture source where evaporation occurred and of the atmosphere along the trajectory.
Figure 4. Stable isotopes of Albert Farm spring in comparison to the Johannesburg Local Meteoric Water Line, Pretoria (LMWL (δ2H = 6.7δ18O + 7.2‰ GNIP-IAEA) and Global MWL (δ2H = 8δ18O + 10‰) [39].
Hydrology 08 00050 g004
A d-excess value in precipitation depends on the temperature and humidity conditions at the sea surface where evaporation took place and the humidity along the moisture trajectory [20,40,41]. A high variation that is observed in the plot of δ18O versus d-excess (Figure 5) indicates that the aquifer that feeds the Albert Farm spring is recharged by rainfall events that were generated under different humidity conditions, or from different moisture sources, i.e., the local surface water bodies, warmer Indian Ocean, cooler Atlantic Ocean or the high-latitude cold Antarctica. In an investigation of stable isotope effects and moisture trajectories for rainfall in Johannesburg, Leketa and Abiye [33] reported high variability in stable isotopes of Johannesburg rainfall for the period between November 2016 and October 2018. Through the use of a Hybrid Single Particle Lagrangian Integrated Trajectory model (HYSPLIT; https://www.ready.noaa.gov/HYSPLIT.php accessed on 3 January 2021), they further determined the dependence of Johannesburg rainfall isotopic signature on the trajectory and residence time of moisture over the Indian versus the Atlantic Ocean en route to Johannesburg. The trajectory of rainfall with low d-excess displays an anticlockwise circulation with the longest residence time above the Indian Ocean where it experienced conditions that altered its isotopic signature. The moisture for rainfall with high d-excess had longer residence time above the higher latitudes south of the South African coastline, after which it experienced a semi-direct trajectory to Johannesburg. Therefore, the observed variability is likely a reflection of the moisture trajectories and residence times above the Indian Ocean.
The majority of the samples in Table 1 have d-excess lower than 10‰, possibly indicating groundwater that was recharged by rainfall whose moisture experienced long-term circulation in the warm atmosphere en route to Johannesburg, such as above the Indian Ocean [33]. On the other hand, samples with high d-excess could indicate groundwater that was recharged by rainfall events that experienced long-term circulation in the cooler regions or had limited residence above the warm Indian Ocean. The high amount of d-excess could also be due to continental and altitude effects that become effective during washing out of heavy isotopes from incoming moisture, thereby leading to a highly depleted rainfall further inland in Johannesburg. Additionally, it can be caused by the occurrence of sub-cloud re-evaporation from light rainfall [18,20].
This study presents an improved understanding and implications of the temporal variability in δ18O/δ2H signature from one groundwater source. The varying isotopic signature that is observed at the same sample location is a good indication that the use of one sample for isotopic characterization of groundwater is not a good practice, as this may erroneously yield interpretations that are biased towards that single sample. This implies that during groundwater recharge assessment in a sub-tropical region that receives rainfall from different moisture sources, it is necessary to collect multiple samples from each groundwater source, possibly in different seasons rather than deducing interpretations from a single sample.

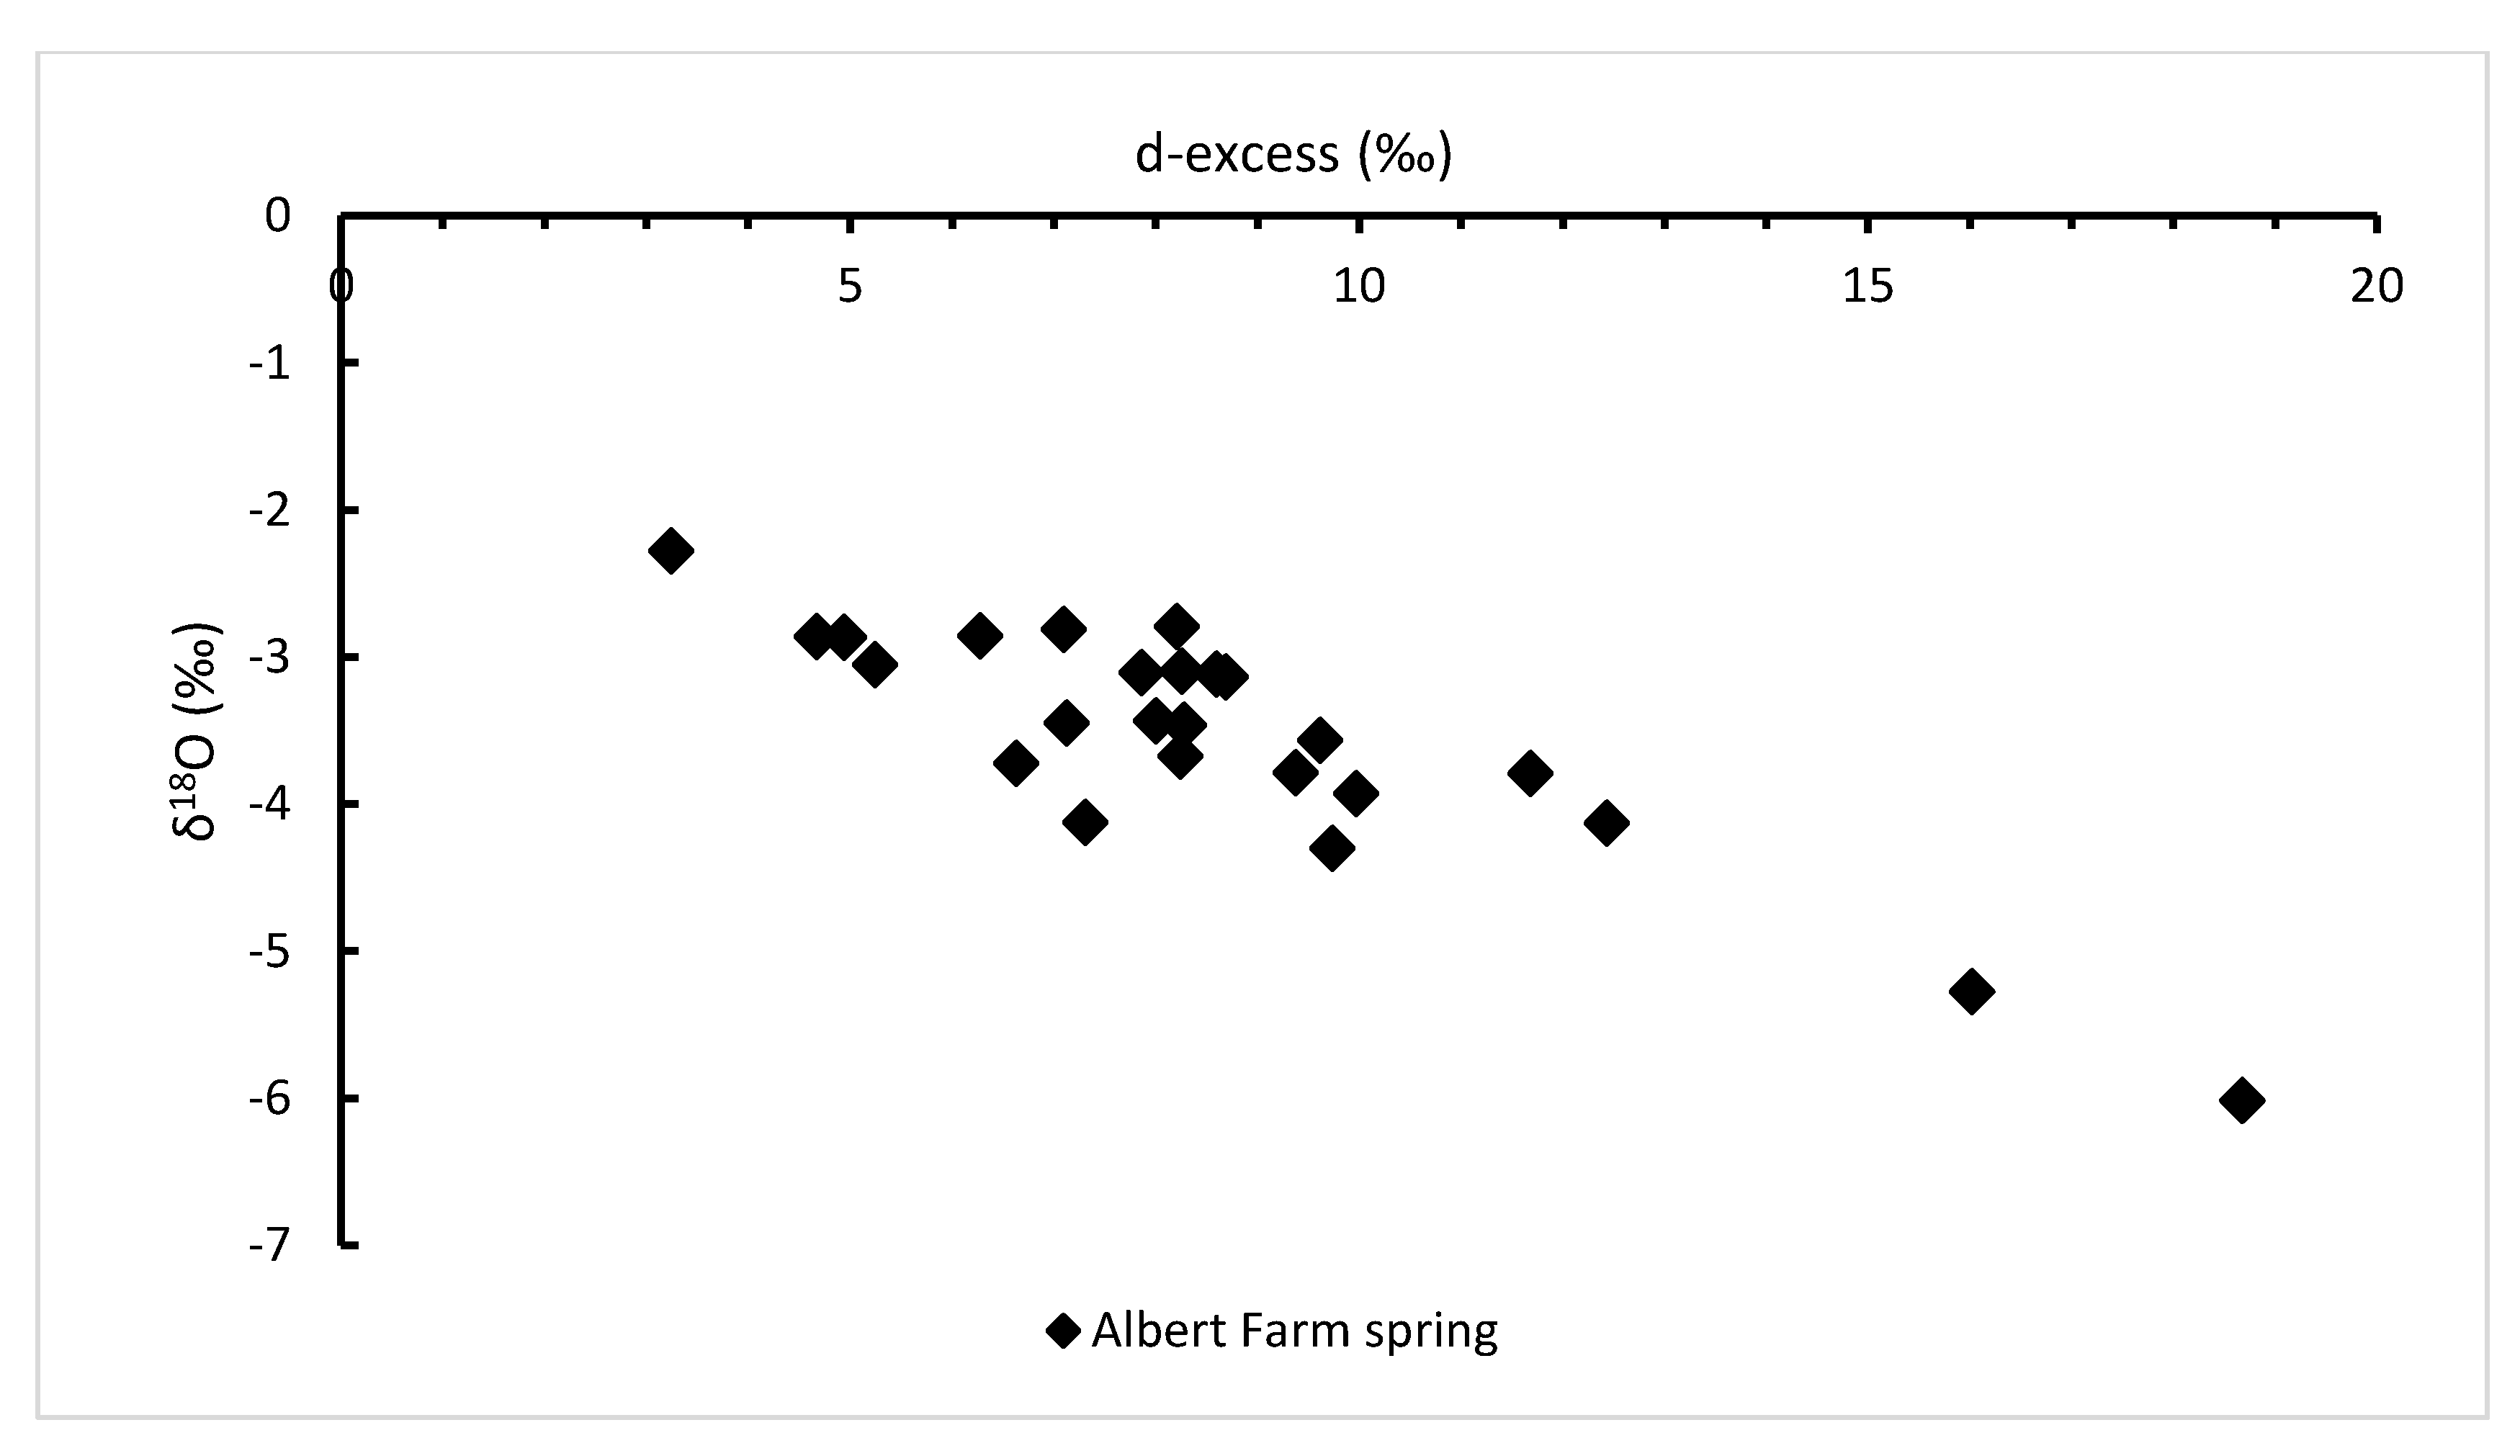
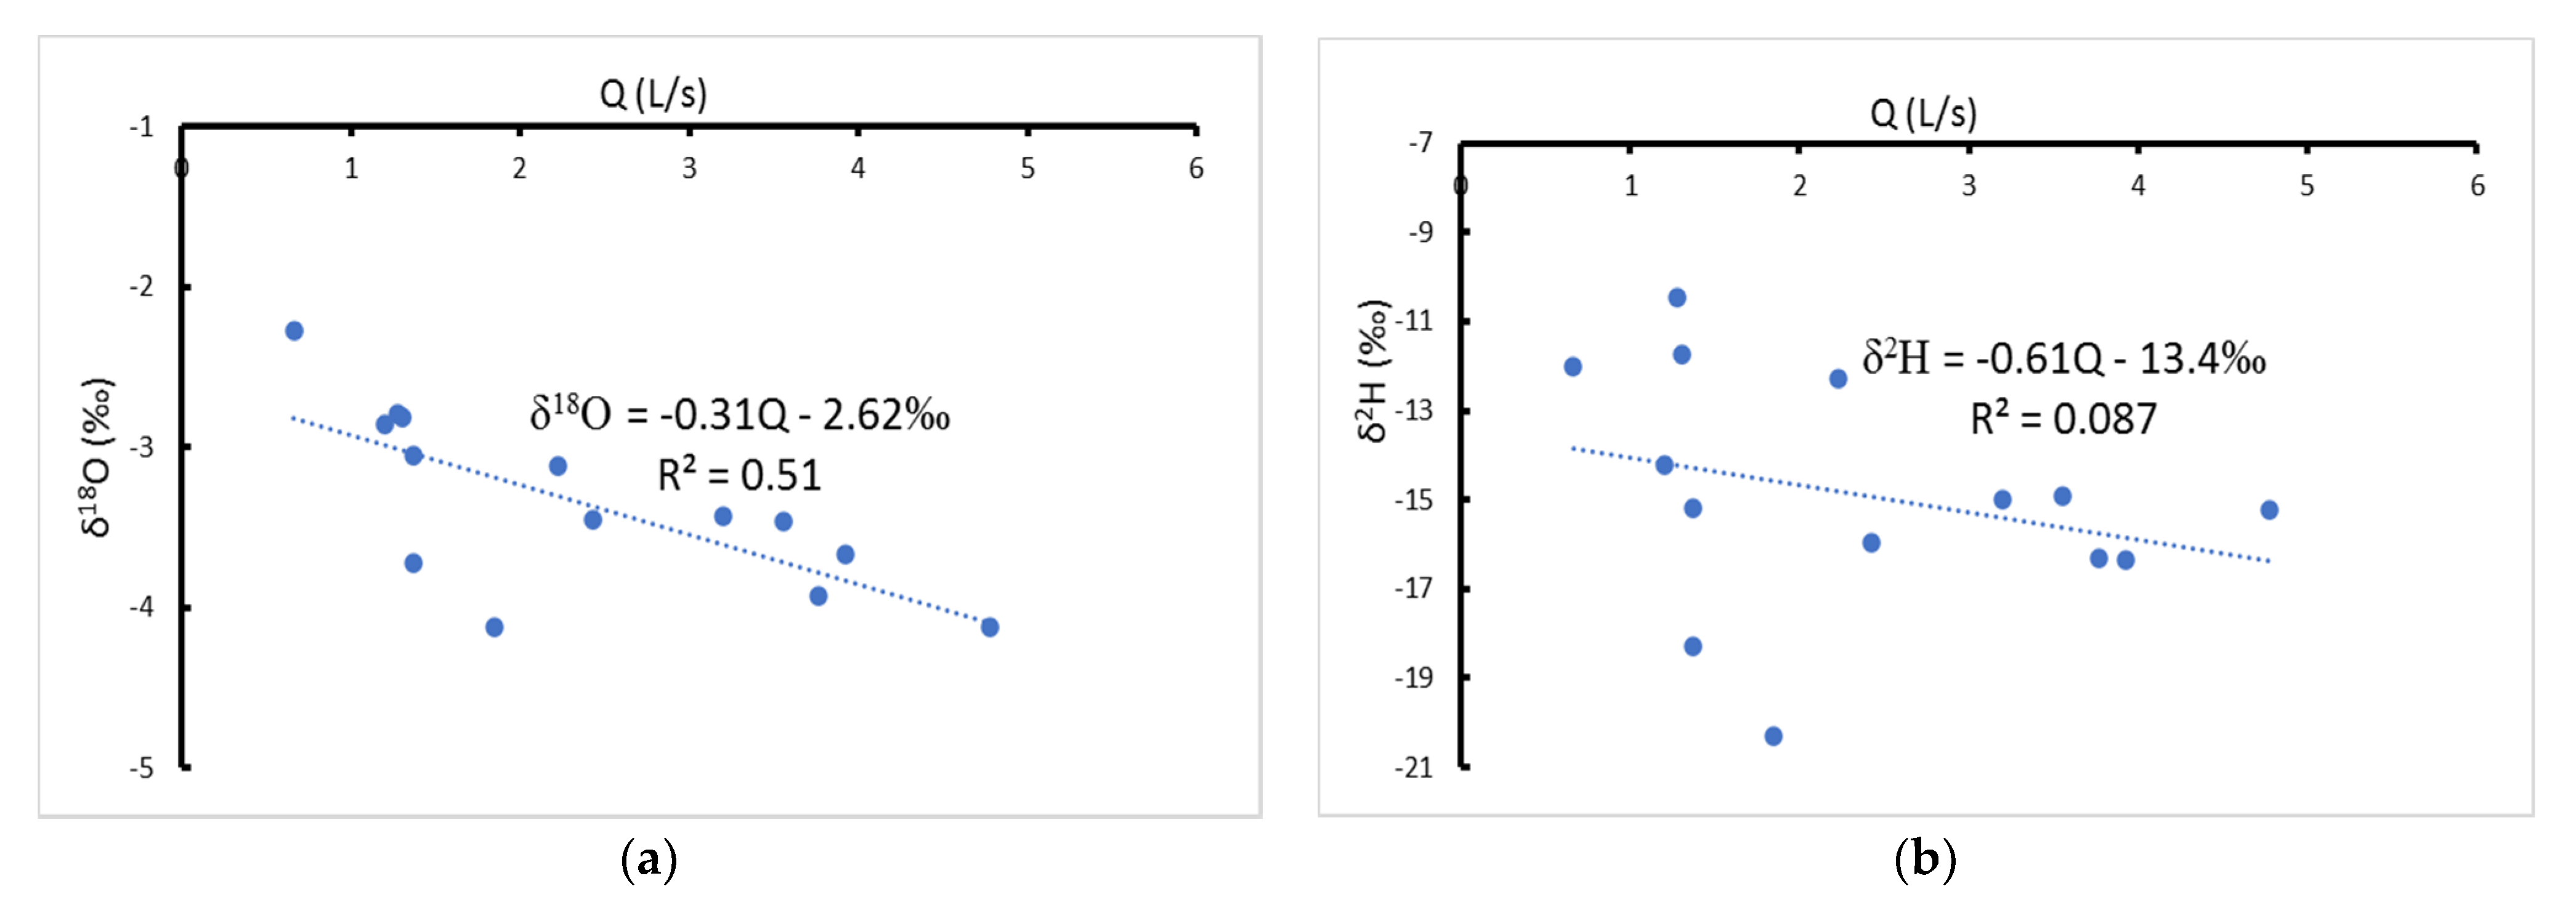
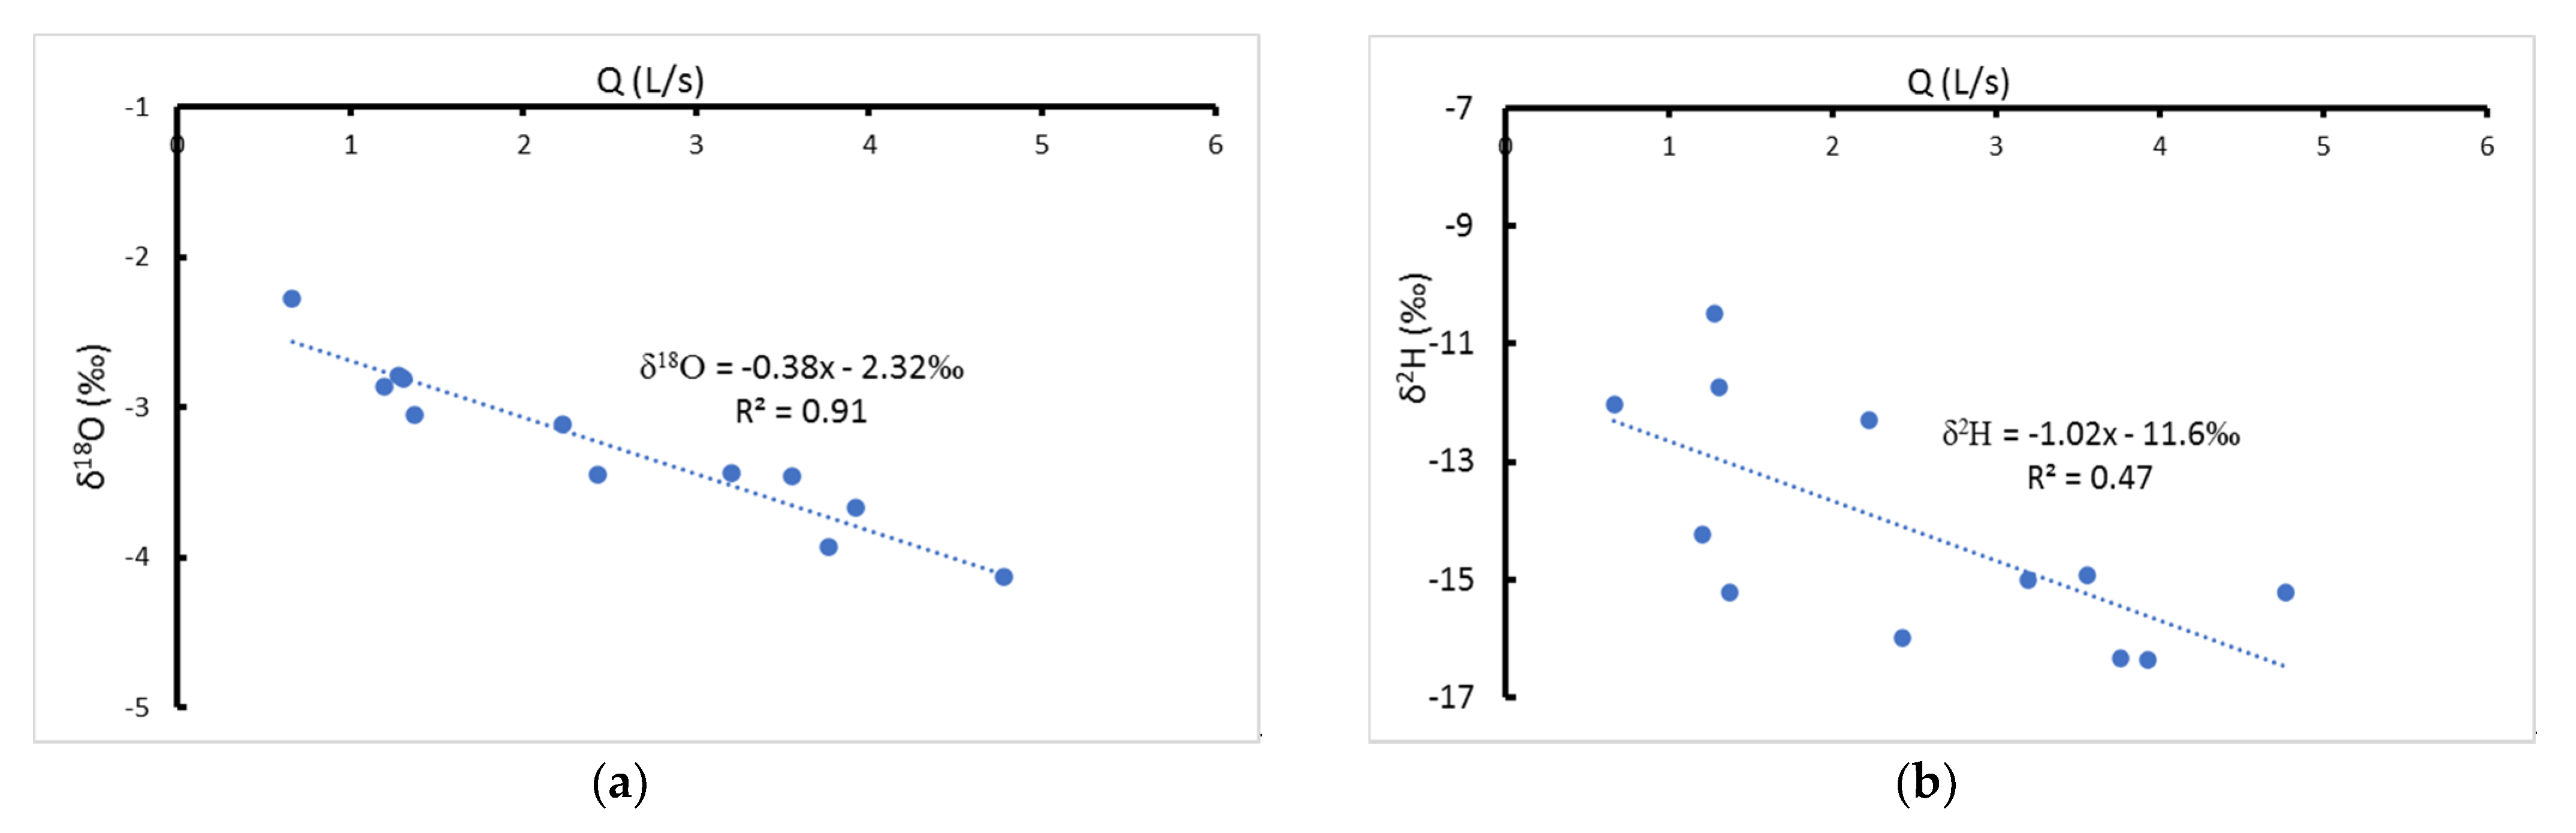
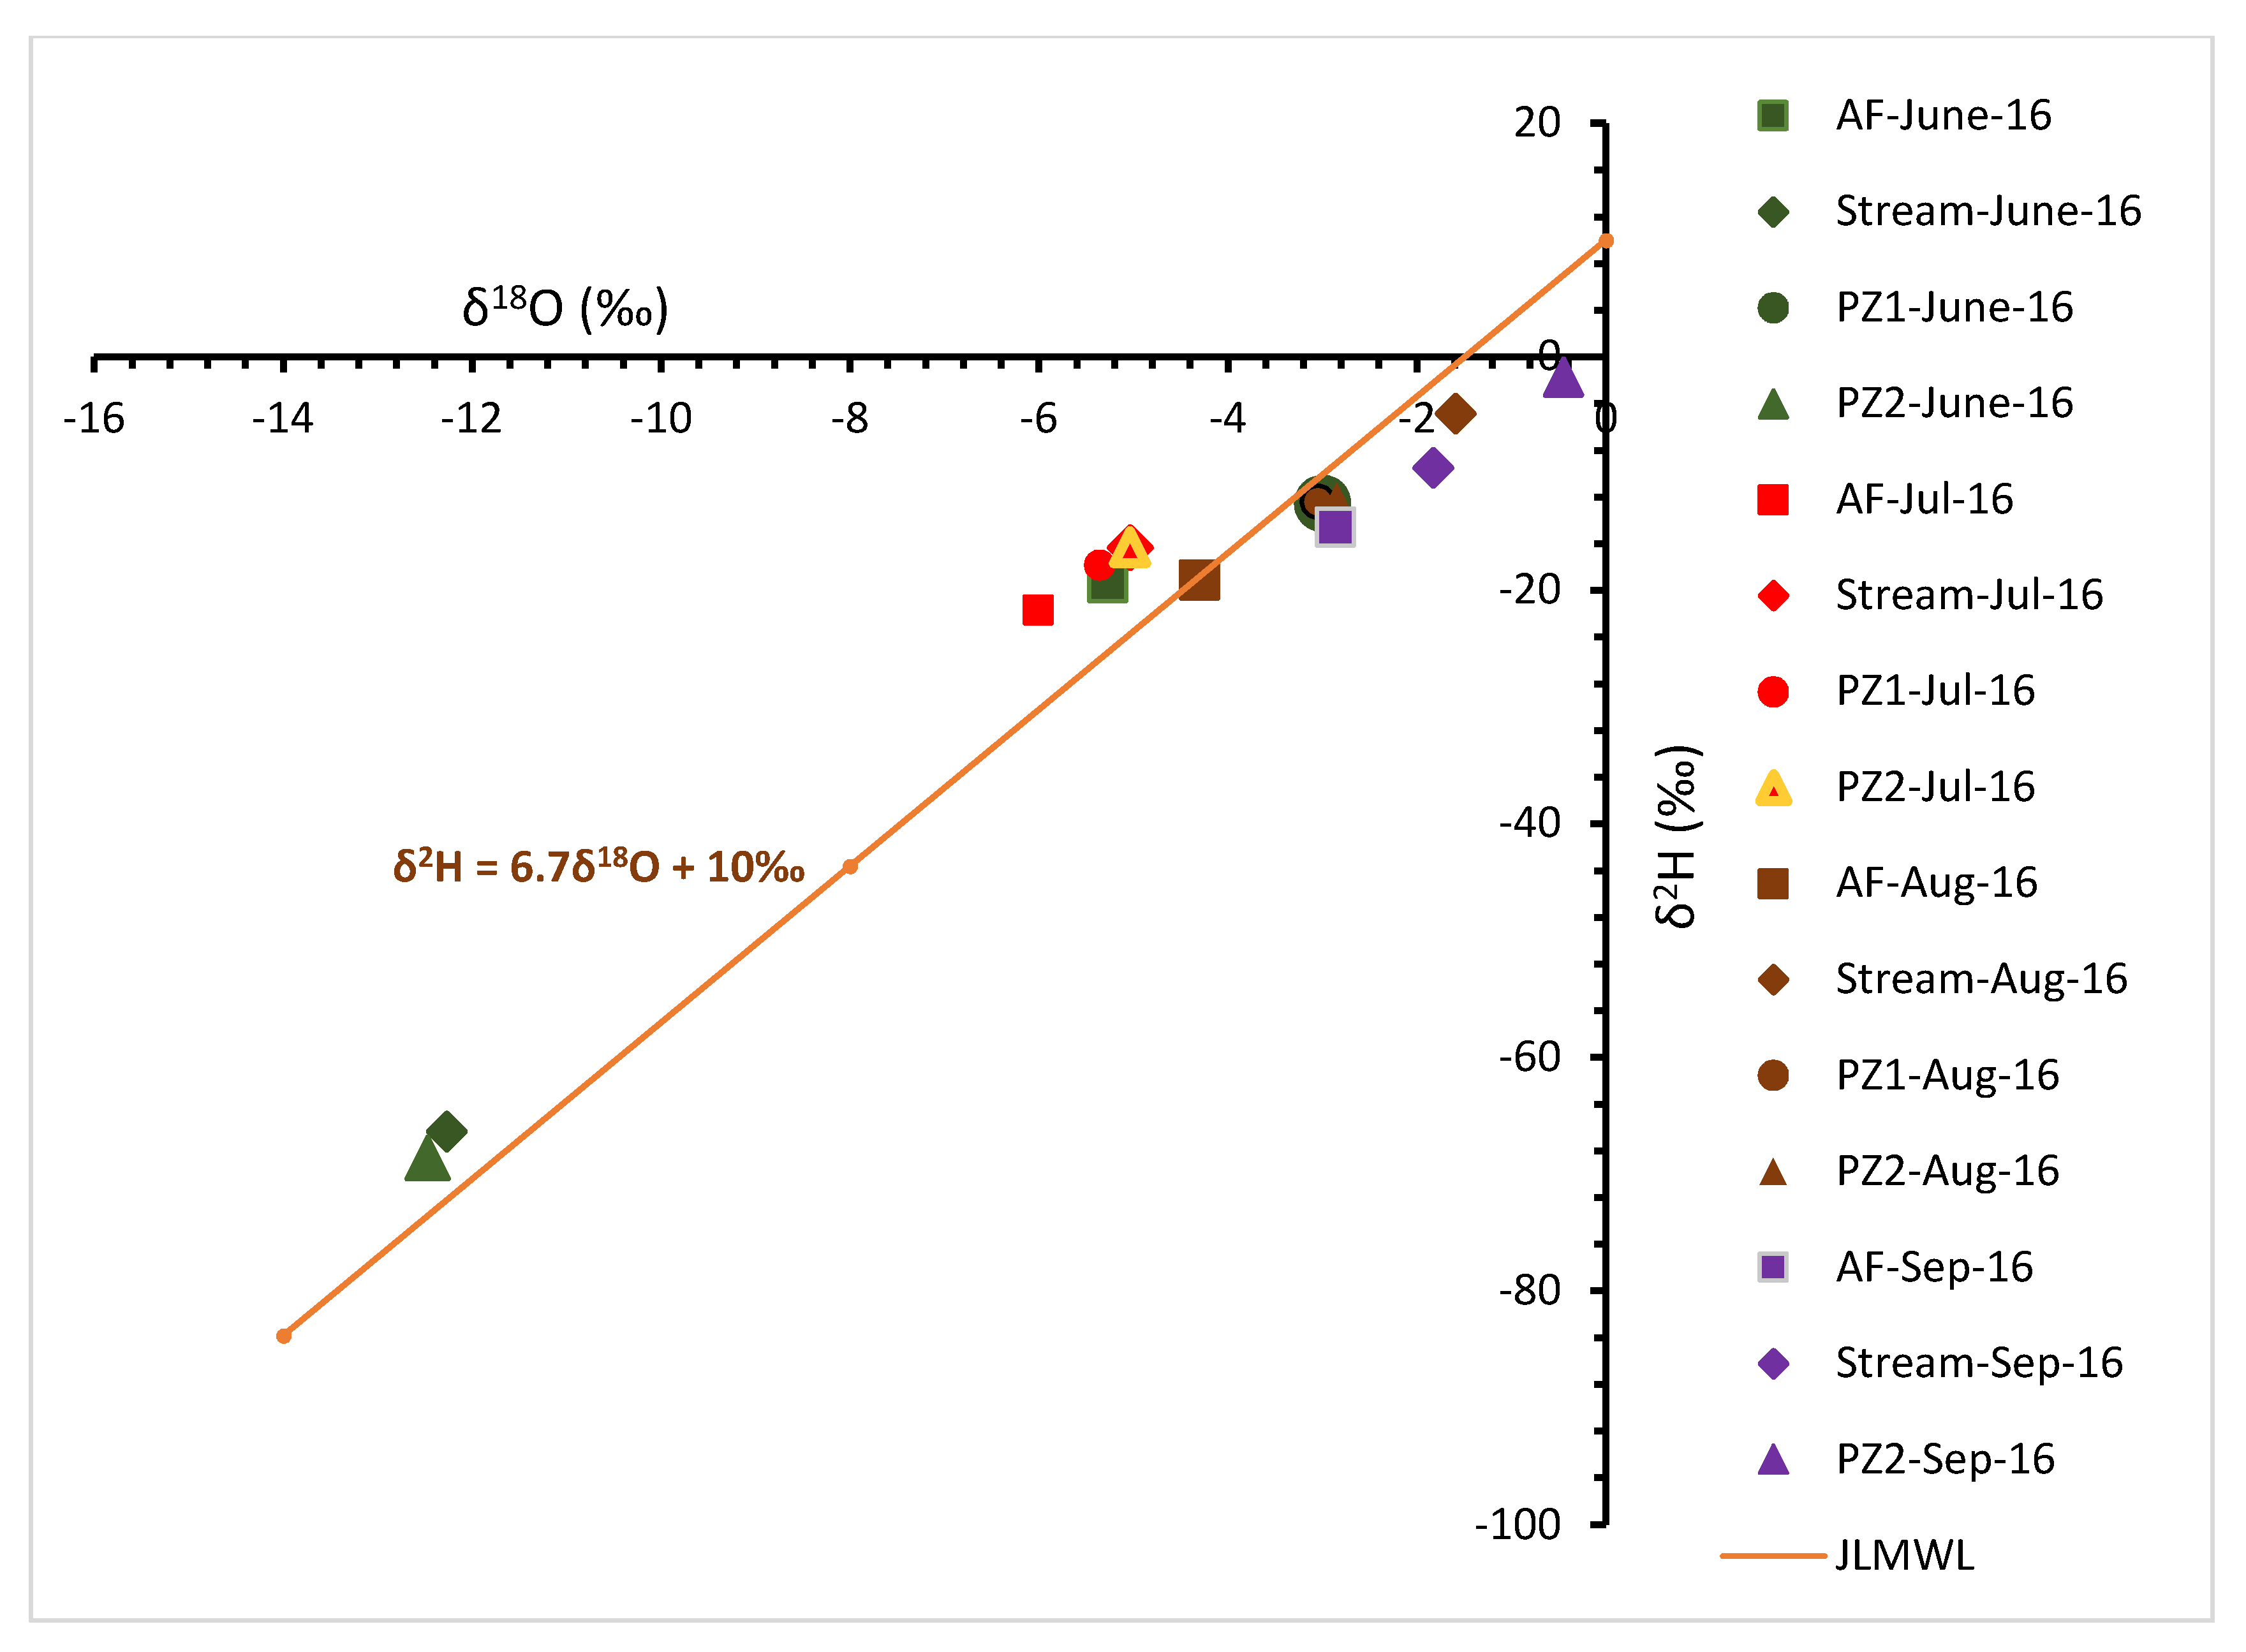
4.1.2. Assessing the Traces of Rainfall Amount Effect in Spring Discharge

Leketa and Abiye [33] identified the traces of amount and temperature effects in the Johannesburg rainfall. Since heavy rainfall is generally characterized by depleted stable isotopes and the light rainfall is enriched, having established from the δ18O versus δ2H plot (Figure 4) that the fractured aquifer that feeds the Albert Farm spring is recharged directly by rainfall, and with the understanding that heavy rainfall leads to both a high amount of recharge and a rise in groundwater level, it could be hypothesized that in a fracture-controlled gravity spring where piston or preferential flow prevails, the high spring discharge is isotopically depleted and the low spring discharge is enriched.
Table 2 presents the 14 months stable isotope data (δ18O, δ2H) and the spring discharge data for the Albert Farm spring. Over this period, the discharge ranged between 0.66 L/s and 4.8 L/s.
Figure 6 shows the plots of spring yield versus stable isotopes. The correlation values of 0.51 and 0.087 were obtained for yield versus δ18O and δ2H, respectively. The figure also shows that high flows are generally depleted and low flows are enriched. This agrees well with the given hypothesis. The correlation, however, seems to be most suitable at a higher yield, while the low-yield part of the plot seems to include highly depleted water as seen by the encircled outlier samples that have low yield but more depleted relative to the general trend. The outlier samples could be a result of highly depleted rainfall events originating from the cold regions. This was observed by Leketa and Abiye [33], who identified a light rainfall, which was, however, isotopically depleted (defying amount effect) and had a longer residence time above the Atlantic Ocean.
Figure 7 shows the plots of yield versus stable isotope signature with the outlier samples excluded. In these plots, a correlation of 0.91 is observed between the yield and δ18O, while δ2H has a correlation of 0.47 with the regression lines shown in Equations (2) and (3). Despite the low correlation that is still observed in Figure 7b, the observed negative slope indicates the traces of rainfall amount effect in spring discharge, which suggests the extent of dependence of recharge amount on the rainfall amount, additionally giving an indication of piston flow occurrence. The low R2 value in spring yield can be explained by the fact that the regression lines of amount effect in Johannesburg rainfall also had low R2 values of 0.21 for δ18O versus rainfall amount and 0.10 for δ2H versus rainfall amount [33]. It can be observed that regressions for stable isotope versus rainfall amount are lower than those for stable isotopes versus spring yields. It is also observed that the spring discharge has a higher correlation in higher yields than in low yields (Figure 6). This can be explained by the occurrence of preferential recharge by heavy rainfall as compared to very light rainfall that most likely becomes soil moisture storage and eventually evaporation. Since Leketa and Abiye [33] already observed a higher correlation in the heavy rainfall as compared to light rainfall, it is deduced that the preferential recharge by heavy rainfall produces a higher correlation in spring discharge.
δ 18 O = 0.38 Q 2.32 ,   R 2 =   0.91
δ 2 H = 1.02 Q 11.6 ,   R 2 =   0.47
where Q is yield in L/s.
The regressions in Equations (2) and (3) are also presented in Equations (4) and (5), respectively, using the SI units of m3/s. It can be deduced that once the long-term spring yield versus δ18O regression line has been established for Albert Farm spring, a measured spring discharge can be used as input data into the regression to estimate the stable isotope signature of the discharge and, therefore, of effective rainfall.
δ 18 O = 377 Q 2.32
δ 2 H = 1019.5 Q 11.6
where Q is yield in m3/s.

4.1.3. Assessing the Air Temperature Conditions at the Time of Recharge

Once recharge has occurred, a stable isotope signature of water is maintained and the signature carries with it information about the atmosphere that the water interacted with prior to direct recharge [18]. The relationship between air temperature and rainfall stable isotope signature, referred to as temperature effect, was first observed by Dansgaard [42] using data acquired from North Atlantic stations. The temperature effect by Dansgaard [42] was represented by a regression shown in Equation (6). Using the isotope signature of daily rainfall and the air temperature for Johannesburg, Leketa and Abiye [33] deduced the Johannesburg air-temperature–δ18O relationship for daily rainfall presented in Equation (7).
δ 18 O   = 0.695 T a 13.6
where Ta is mean annual temperature.
δ 18 O   = 0.552 T d 14.1   n   =   88 ,   R 2   =   0.21 ,   p - v a l u e   =   0.002
where Td is daily air temperature.
Based on the understanding that recharge into the fractured quartzite aquifer in the study area occurs without extreme isotopic alteration by evaporation, and that where such recharge occurs, groundwater maintains the stable isotope signature of effective rainfall [18,43], an isotopic signature of groundwater was used in Equations (6) and (7) to estimate the annual and daily air temperatures, respectively, at the time when recharge occurred. The monthly δ18O values of the Albert Farm spring were used in both equations. These estimated air temperatures are presented in Table 3.
As shown in Table 3, the estimated annual air temperatures at the time of recharge range between 10.9 °C and 16.3 °C, while the estimated daily air temperatures range between 14.7 °C and 21.4 °C.
According to the South African Weather Service (SAWS), the daily air temperatures that were measured on the rainfall days at the Johannesburg Botanical Garden weather station (JHB Bot. Tuin; Figure 1) between November 2016 and October 2018 ranged from 7.5 °C to 25 °C. This indicates that the calculated daily air temperatures are within the range of the measured daily air temperatures. On the other hand, the annual air temperatures that were measured at the same weather station between 1997 and 2016 were between 15.5 °C and 18.9 °C. This indicates that the calculated annual air temperatures are slightly below the range of the current (1997 to 2016) annual air temperatures.
The reasons for similarities in the range of calculated daily air temperatures and the measured daily air temperatures could be that the daily air temperature represents the actual temperature on the day of rainfall, which is the temperature responsible for fractionation during condensation and sub-cloud re-evaporation during precipitation [18,20]. The measured annual temperature, on the other hand, includes all the days in a year (1996 to 2016), even days without rainfall, so they could be a reflection of both the dry and wet air temperatures; hence, they are higher than the calculated temperatures. The lower calculated annual temperature could also indicate two possibilities:
(1)
The Dansgaard [42] equation is only applicable in the northern-hemisphere stations (where temperatures are cooler) where the equation was established and may not be applicable in the Johannesburg climate setting.
(2)
If the Dansgaard [42] is applicable in the Johannesburg climate setting, then the variation could indicate that at the time of recharge, the climate was characterized by annual temperatures that are colder than the present.

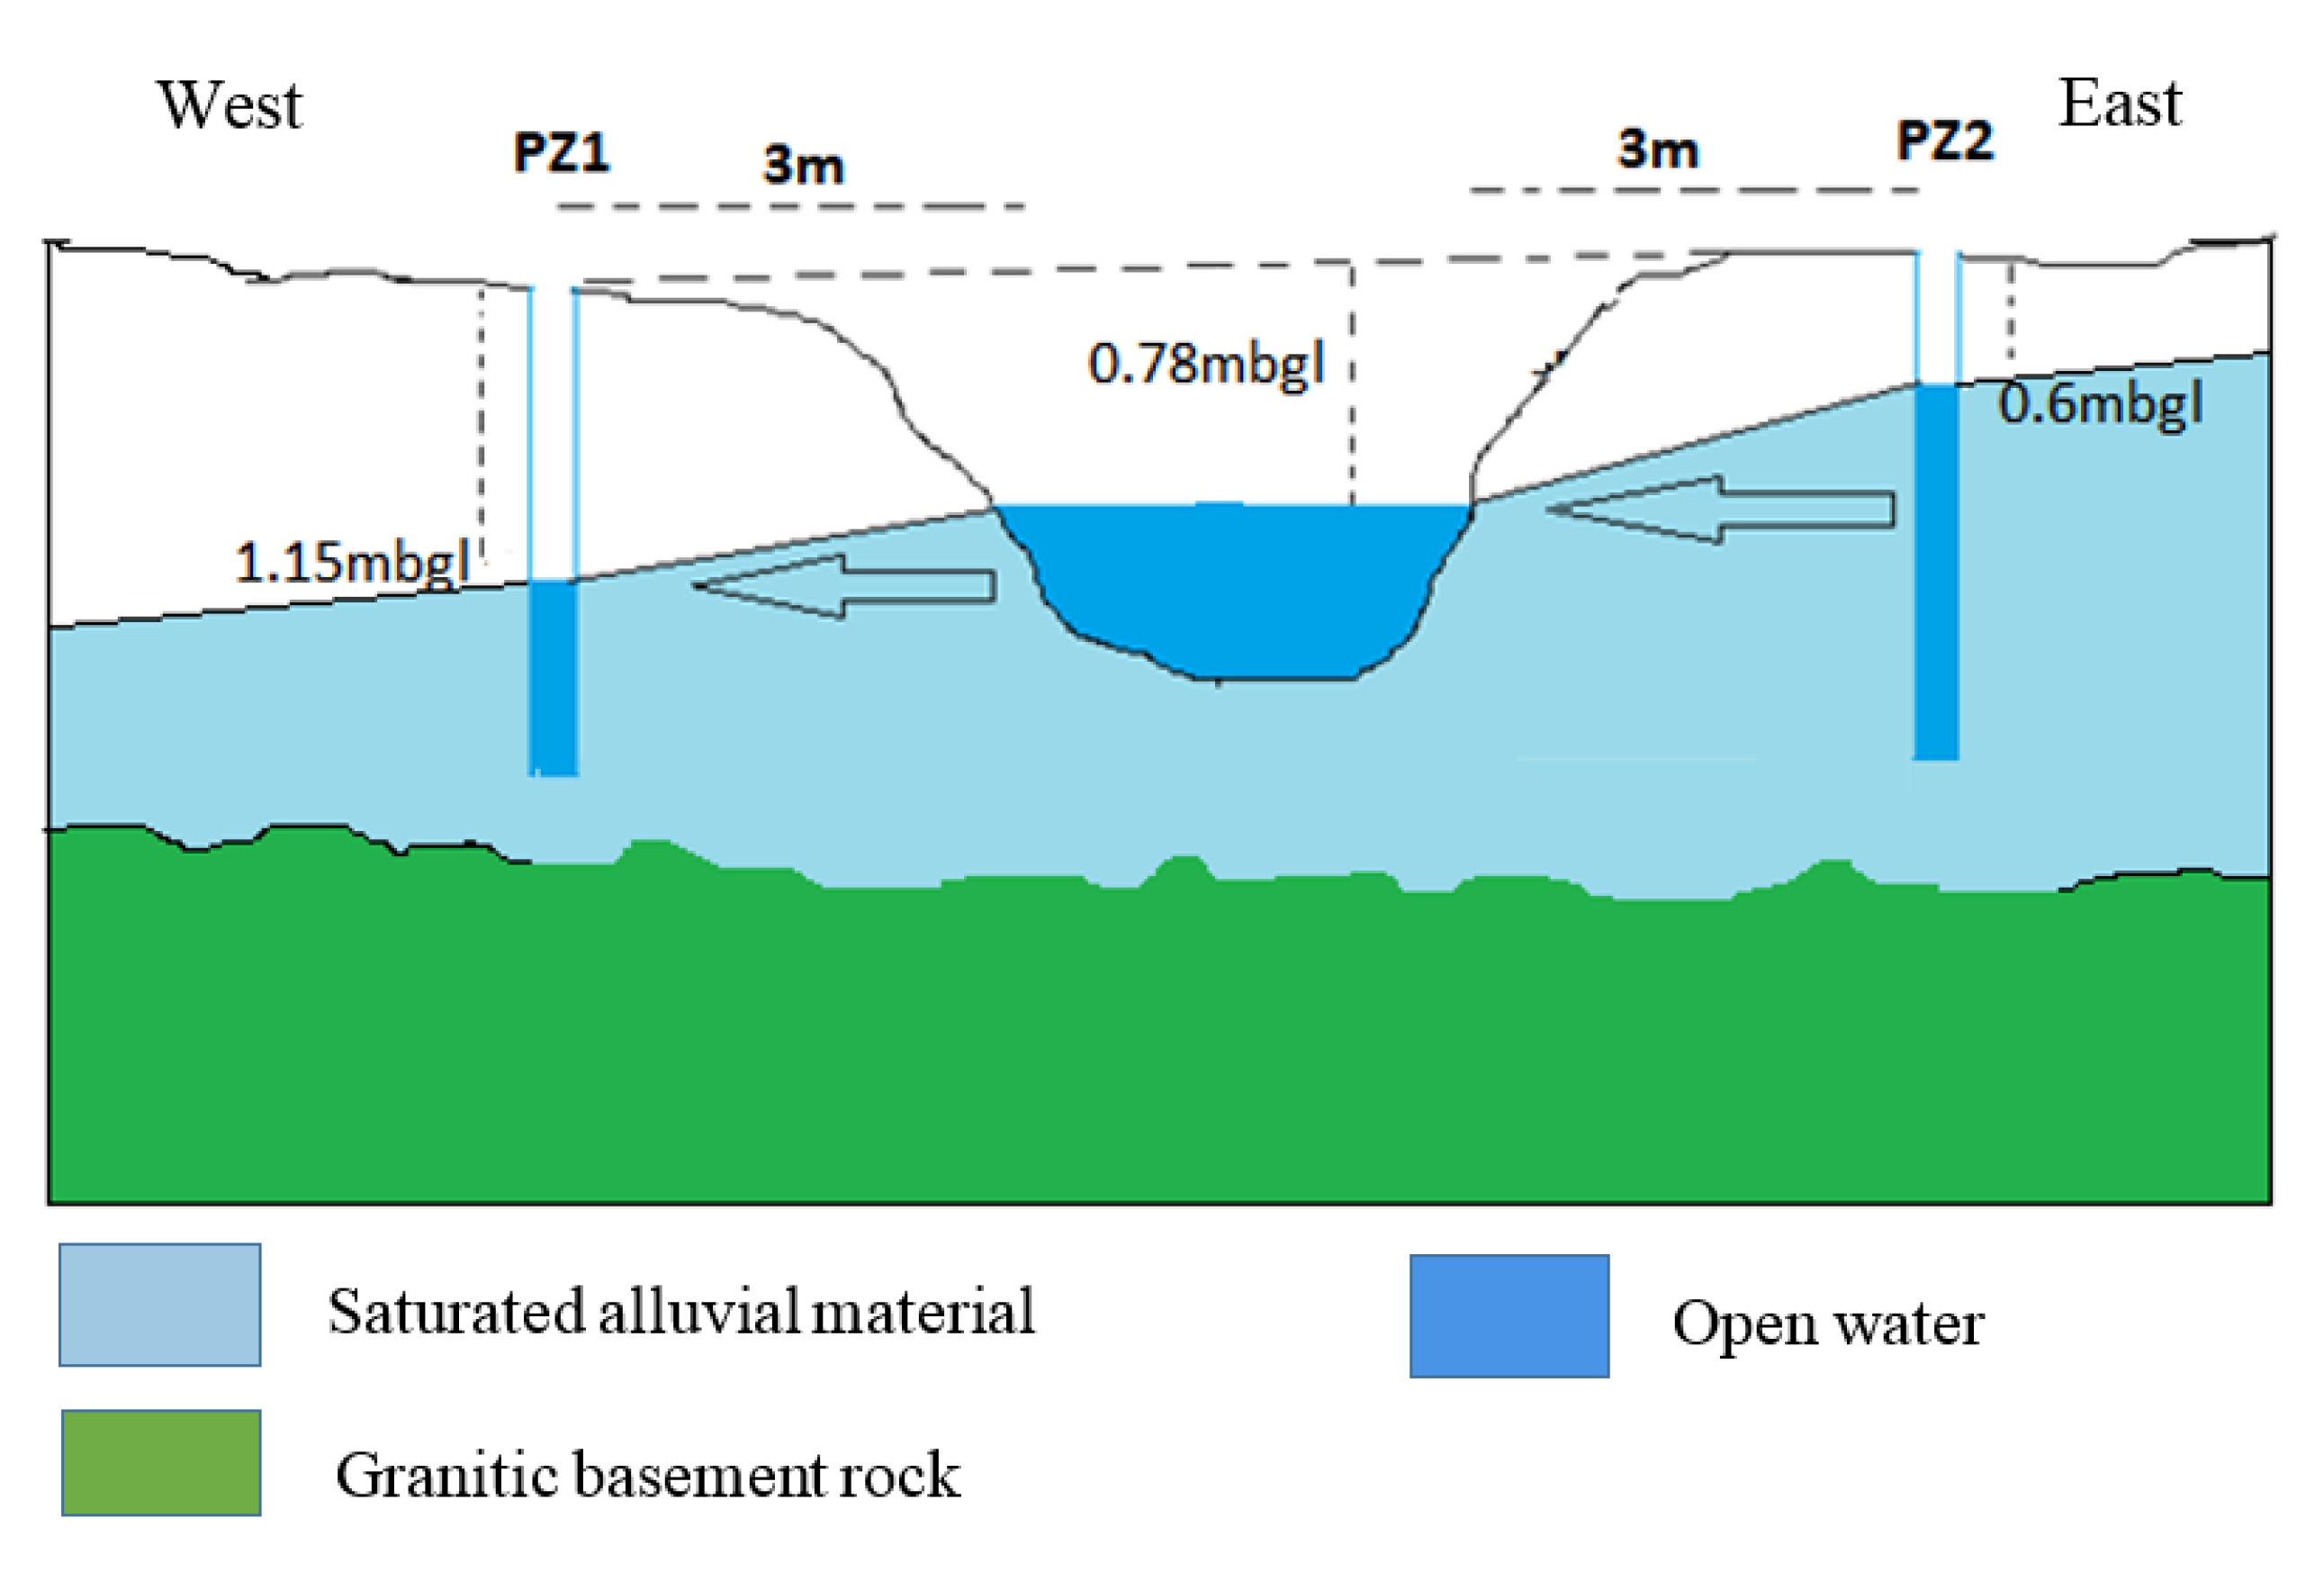
4.1.4. Interflow Assessment in the Stream Underlain by the Basement Complex

Table 4 presents the water levels in units of meters below ground level (mbgl) and stable isotope data for the two piezometers and Montgomery stream over the four month period. Table 4 also shows elevations of the piezometer in meters above sea level (masl) and their coordinates.
As shown in Table 4, PZ2 consistently has a higher water level compared to both PZ1 and Montgomery streams. It is evident from this observation that the Montgomery stream gains from the eastern side and loses to the western side, as shown in Figure 8, which presents the average water levels over the period of review.
Figure 9 shows the four-month stable isotope (δ18O versus δ2H) plot for piezometers and stream samples against the JLMWL [32]. It can be observed from this plot that there are a loss and a gain of water from the stream. With time, the samples seem to generally shift towards the most enriched part of the plot. The June samples are generally most depleted, becoming more enriched towards September. Albert Farm spring is one of the sources of water to the Montgomery stream; however, there are numerous small impoundments and swampy areas downstream of Albert Farm spring but upstream of the piezometers study area. With the exception of June 2016, the Albert Farm samples are the most depleted in each month, indicating possibilities of enrichment by evaporation as the water flows from Albert Farm spring to the piezometers site. Since there was no rainfall in that period, this behaviour shows a water source that is constantly being exposed to evaporation, thereby continuously getting enriched with time. A combination of interpretations from the water levels and stable isotopes indicates that while it is clear that the stream is fed by Albert Farm spring via the upstream impoundments, the piezometers could also be fed by interflow that is patched in the unsaturated zone above the granite bedrock. The interflow possibly comes from the open upstream water bodies or rainfall that had infiltrated during the rainy season. This could explain the situation in June 2016, when the PZ2 and the stream were more depleted than the source Albert Farm and PZ1. Both the water levels and stable isotope interpretations revealed that there is an interaction between Montgomery stream and subsurface flow that is monitored from the piezometers.

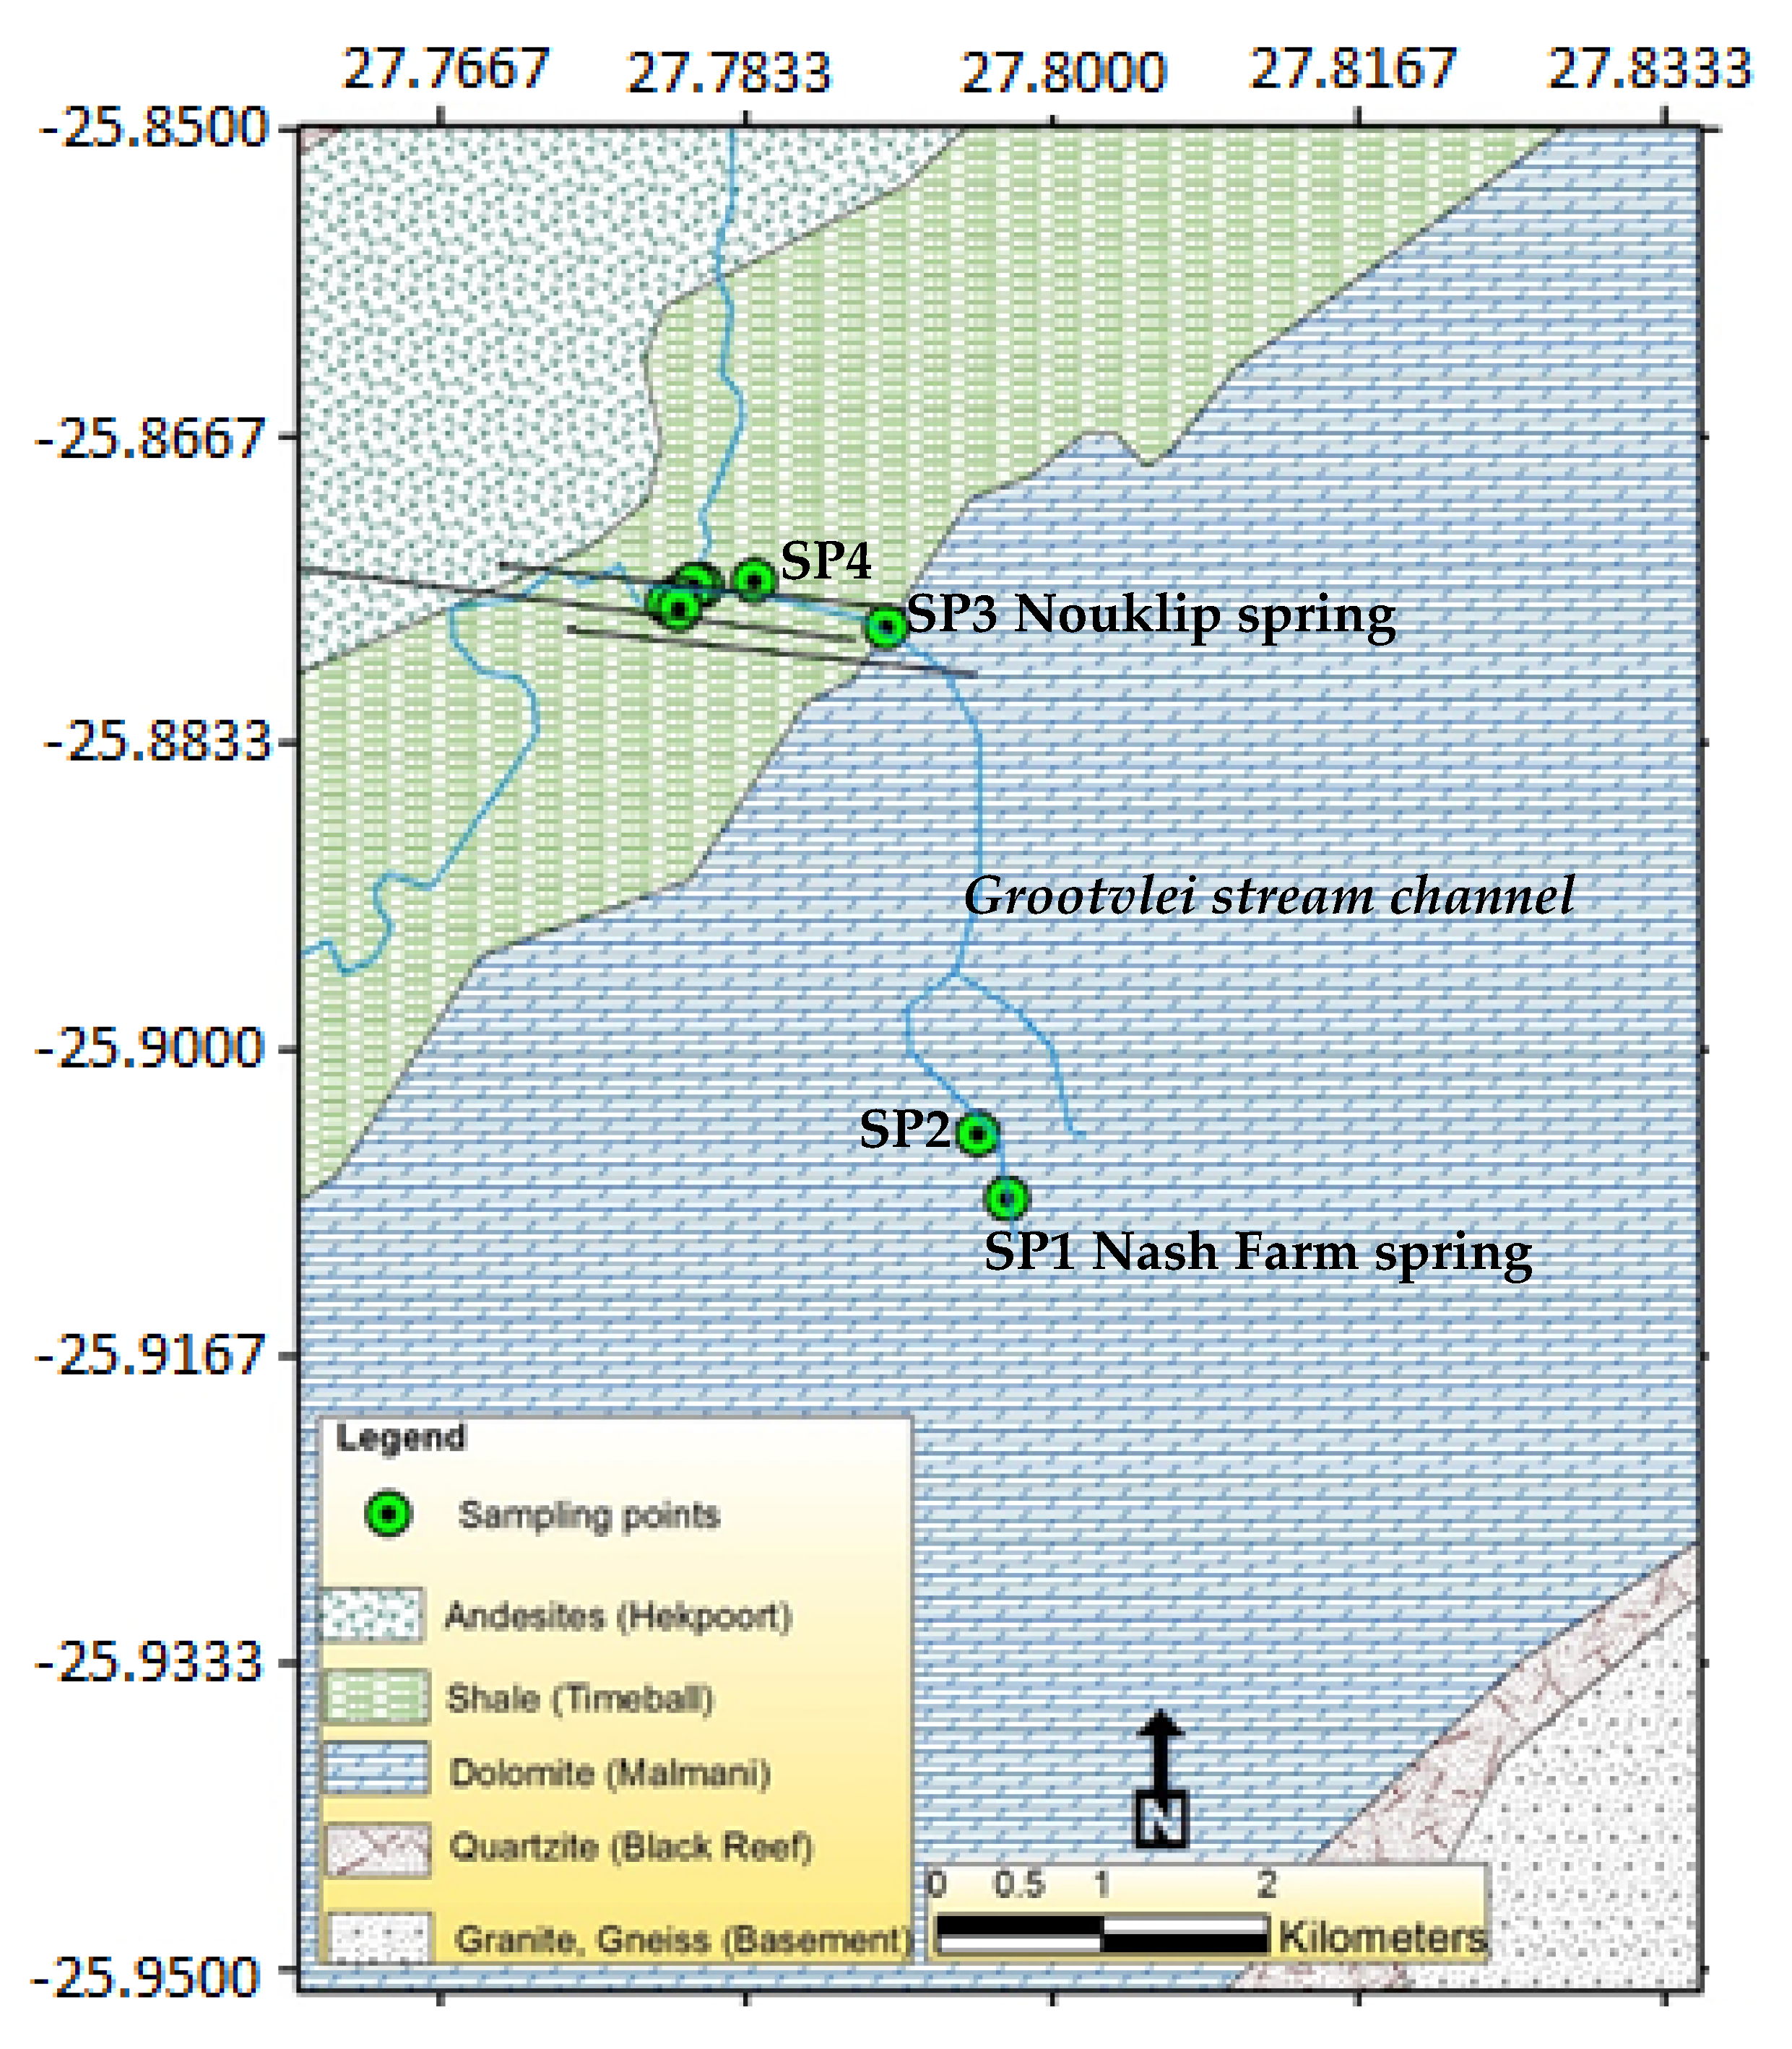
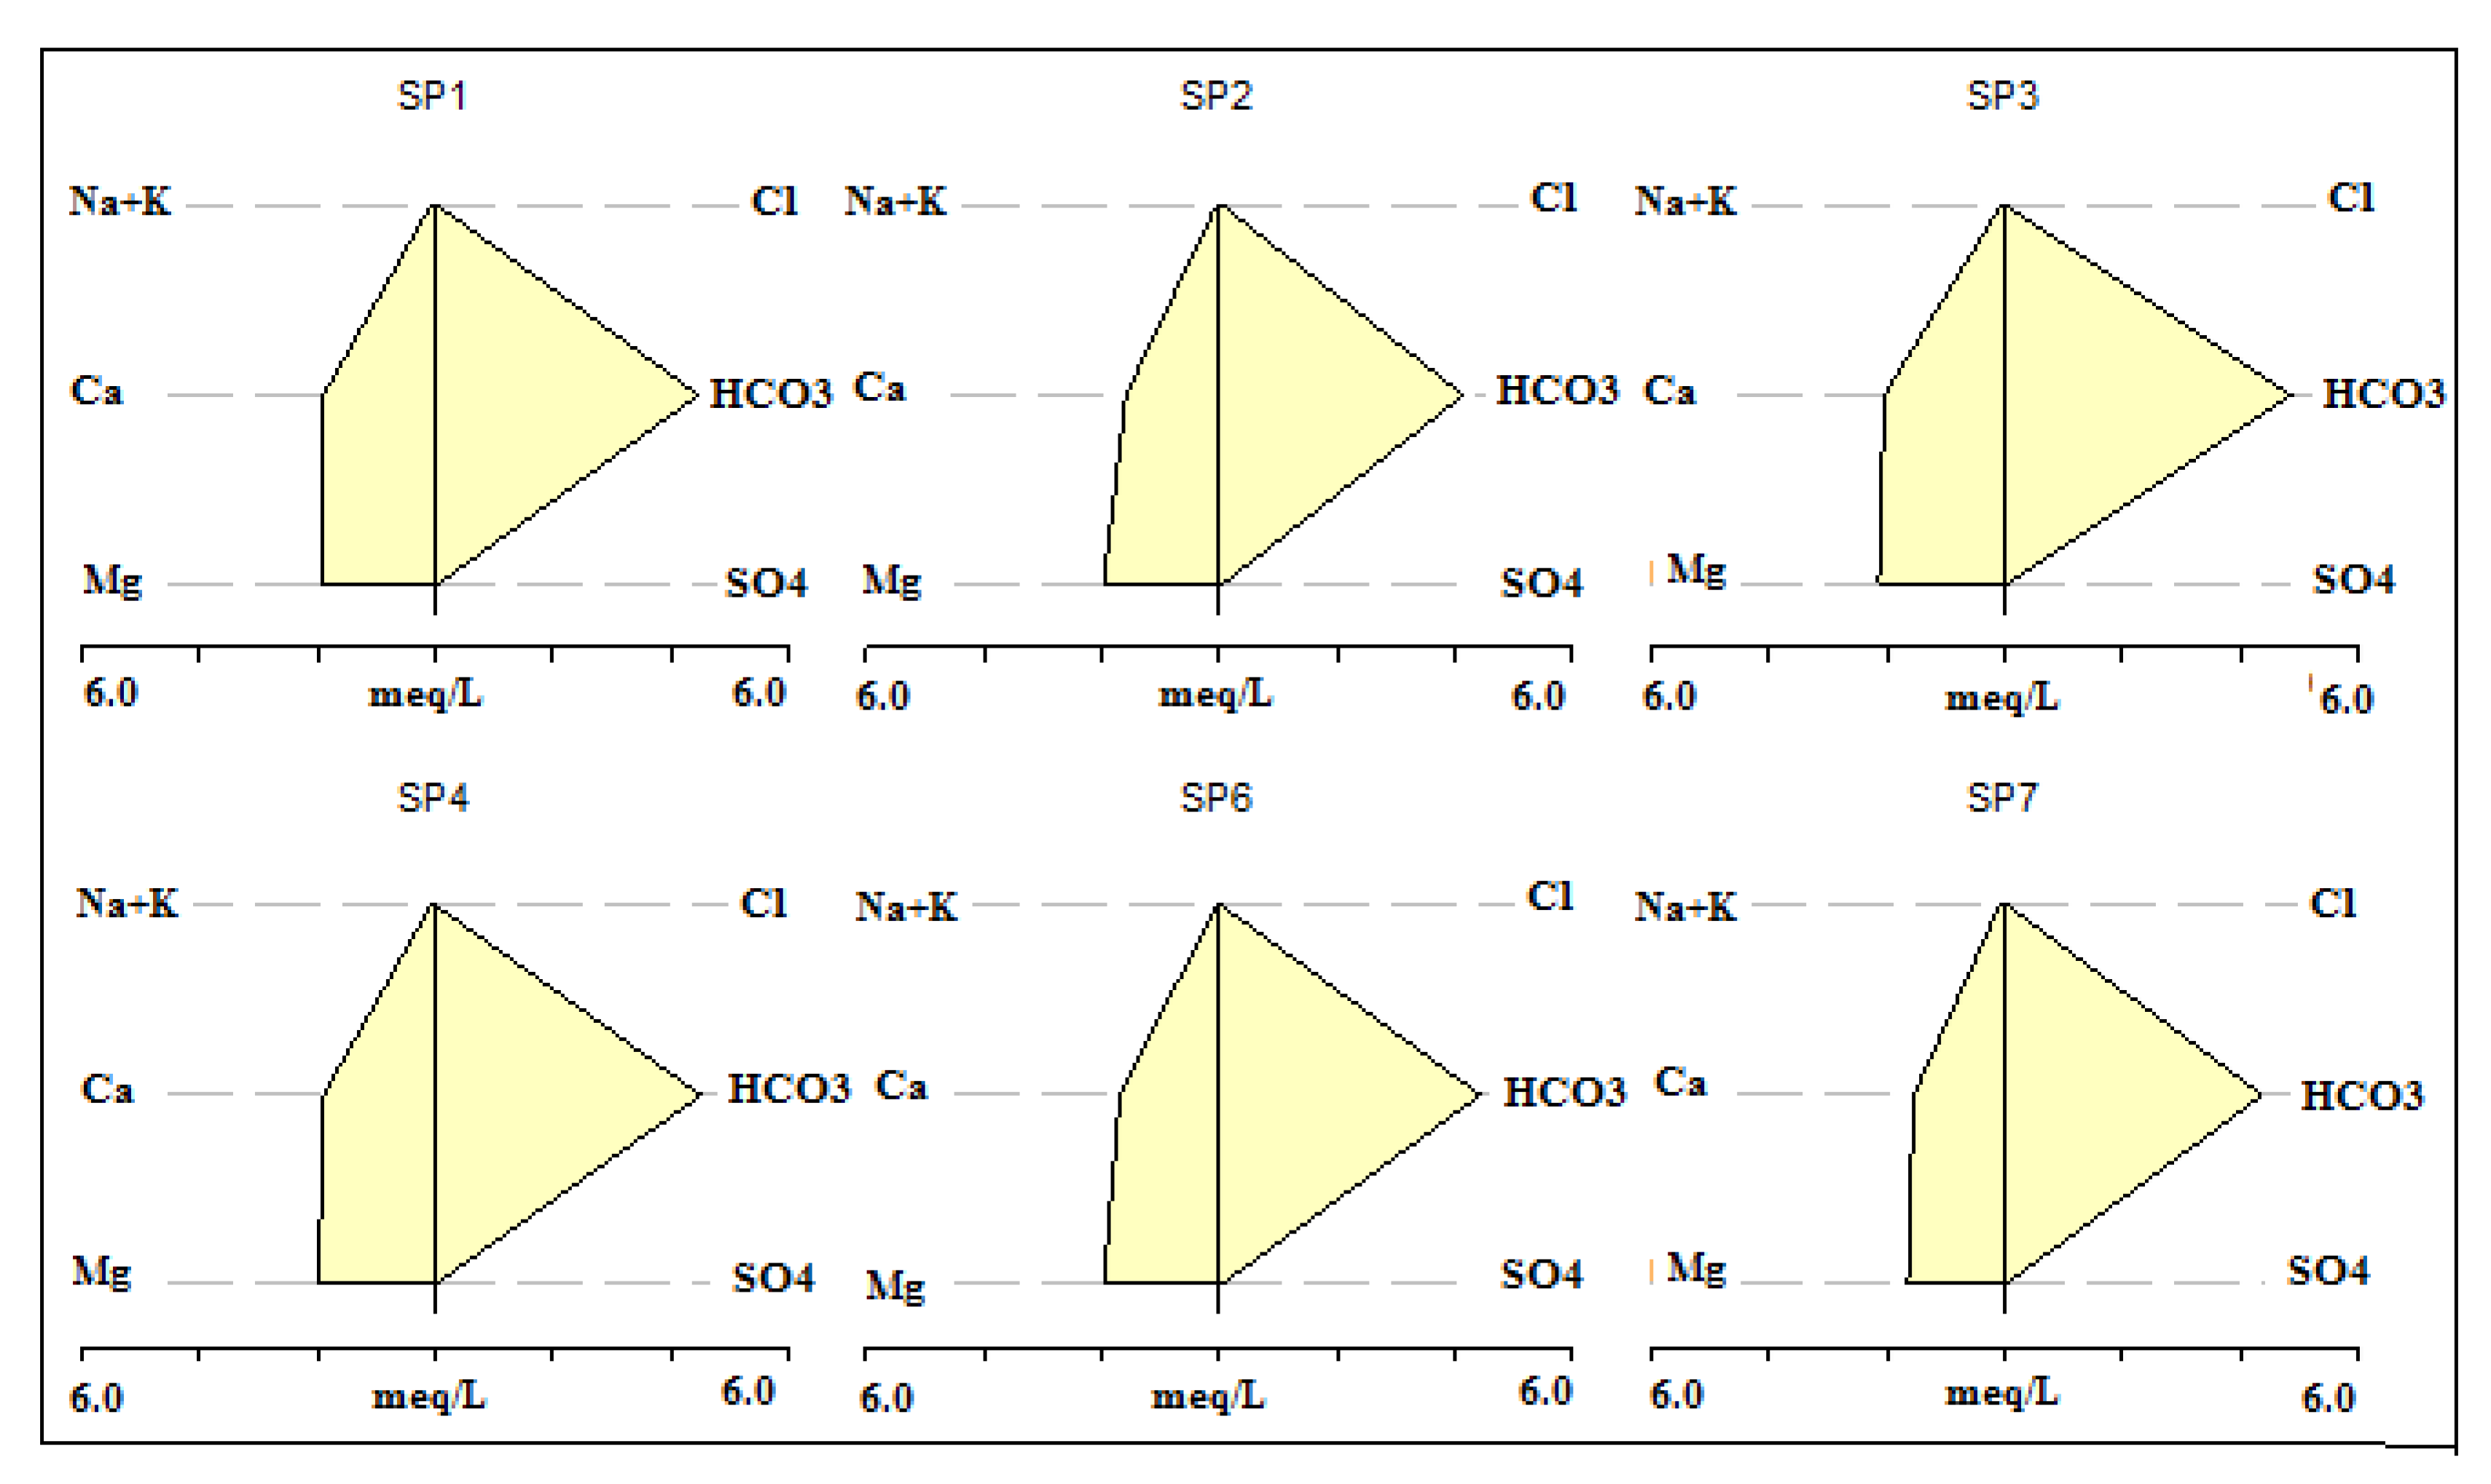
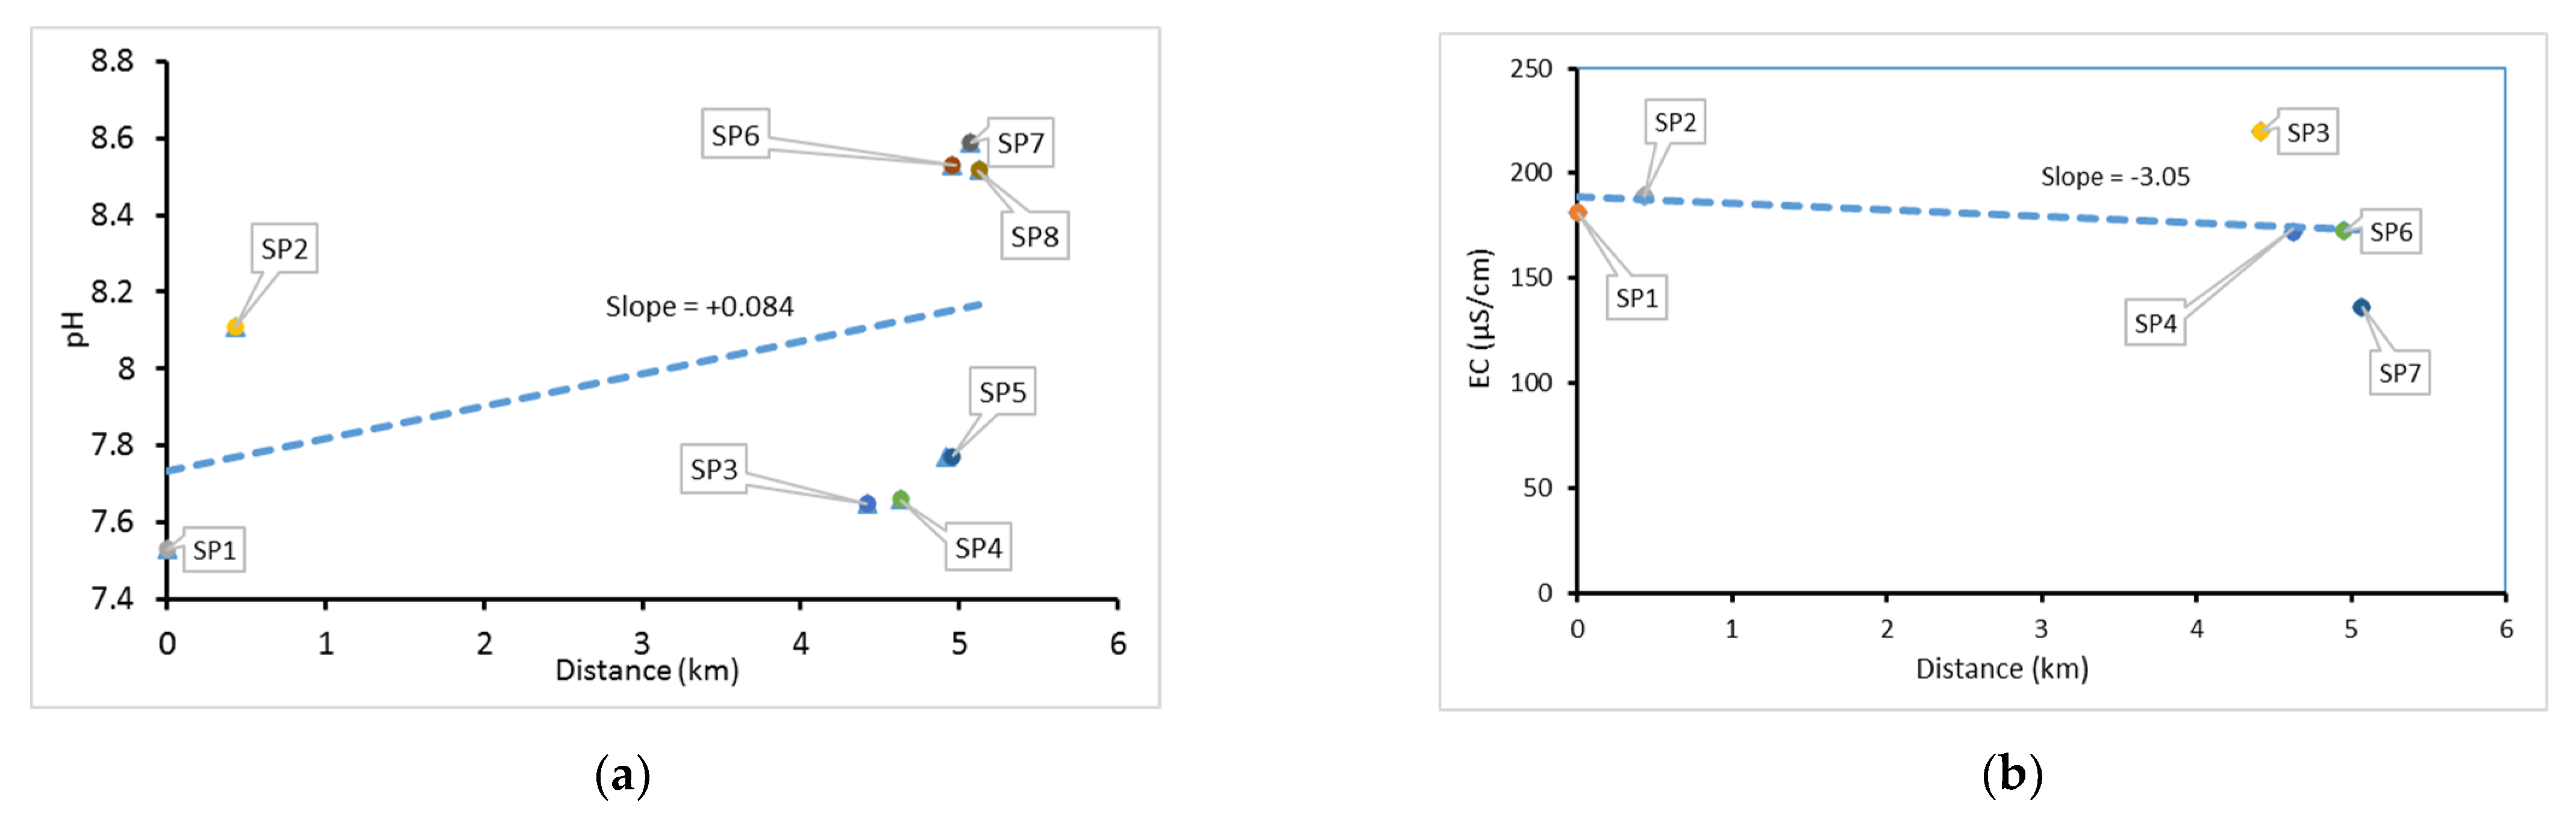
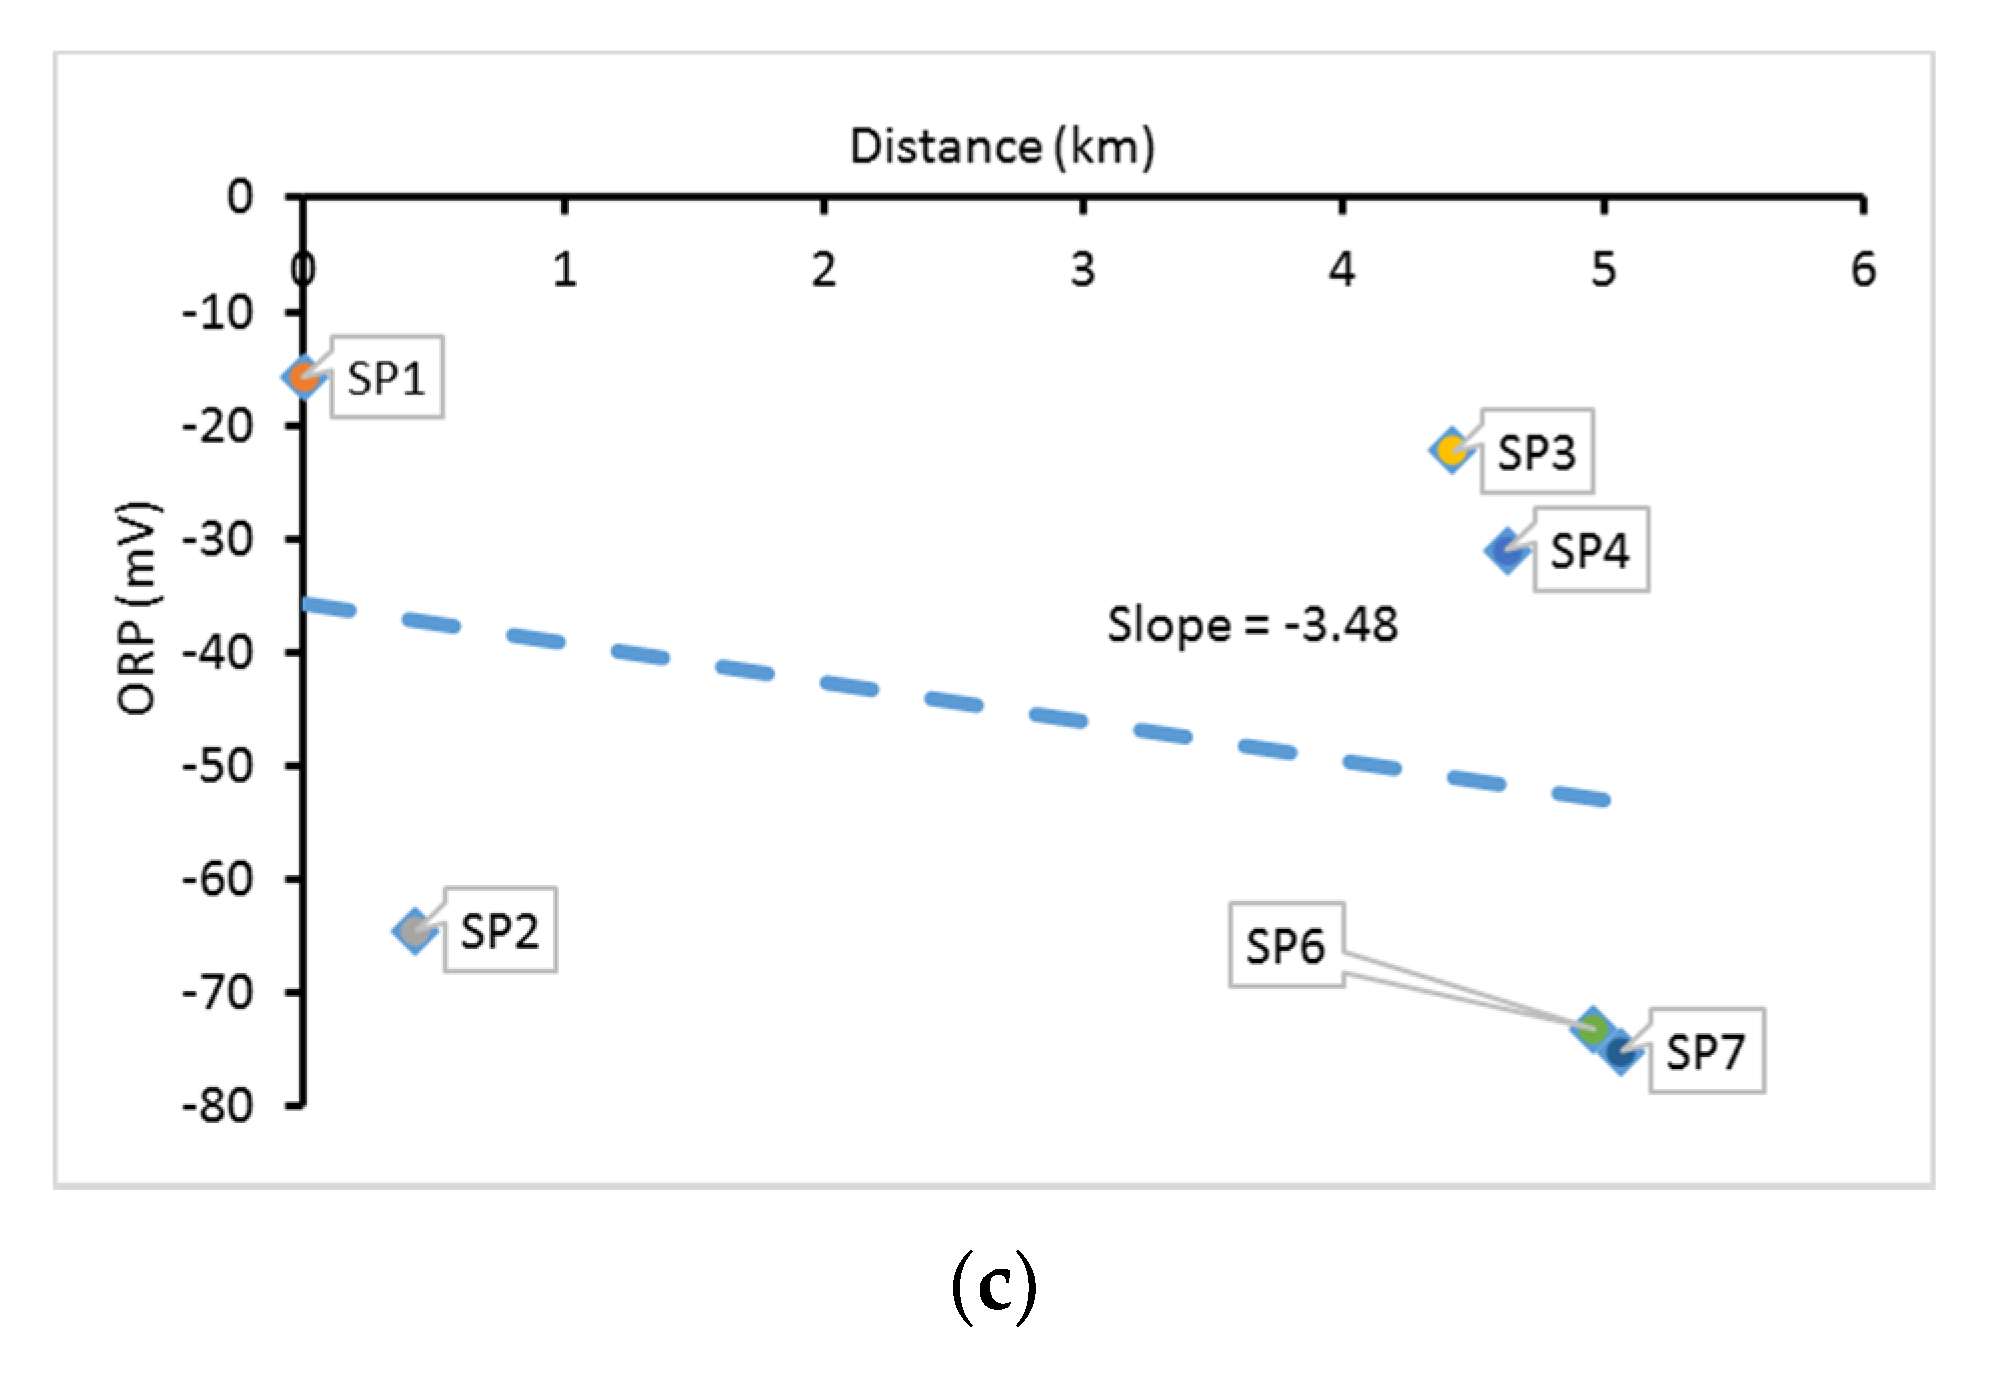
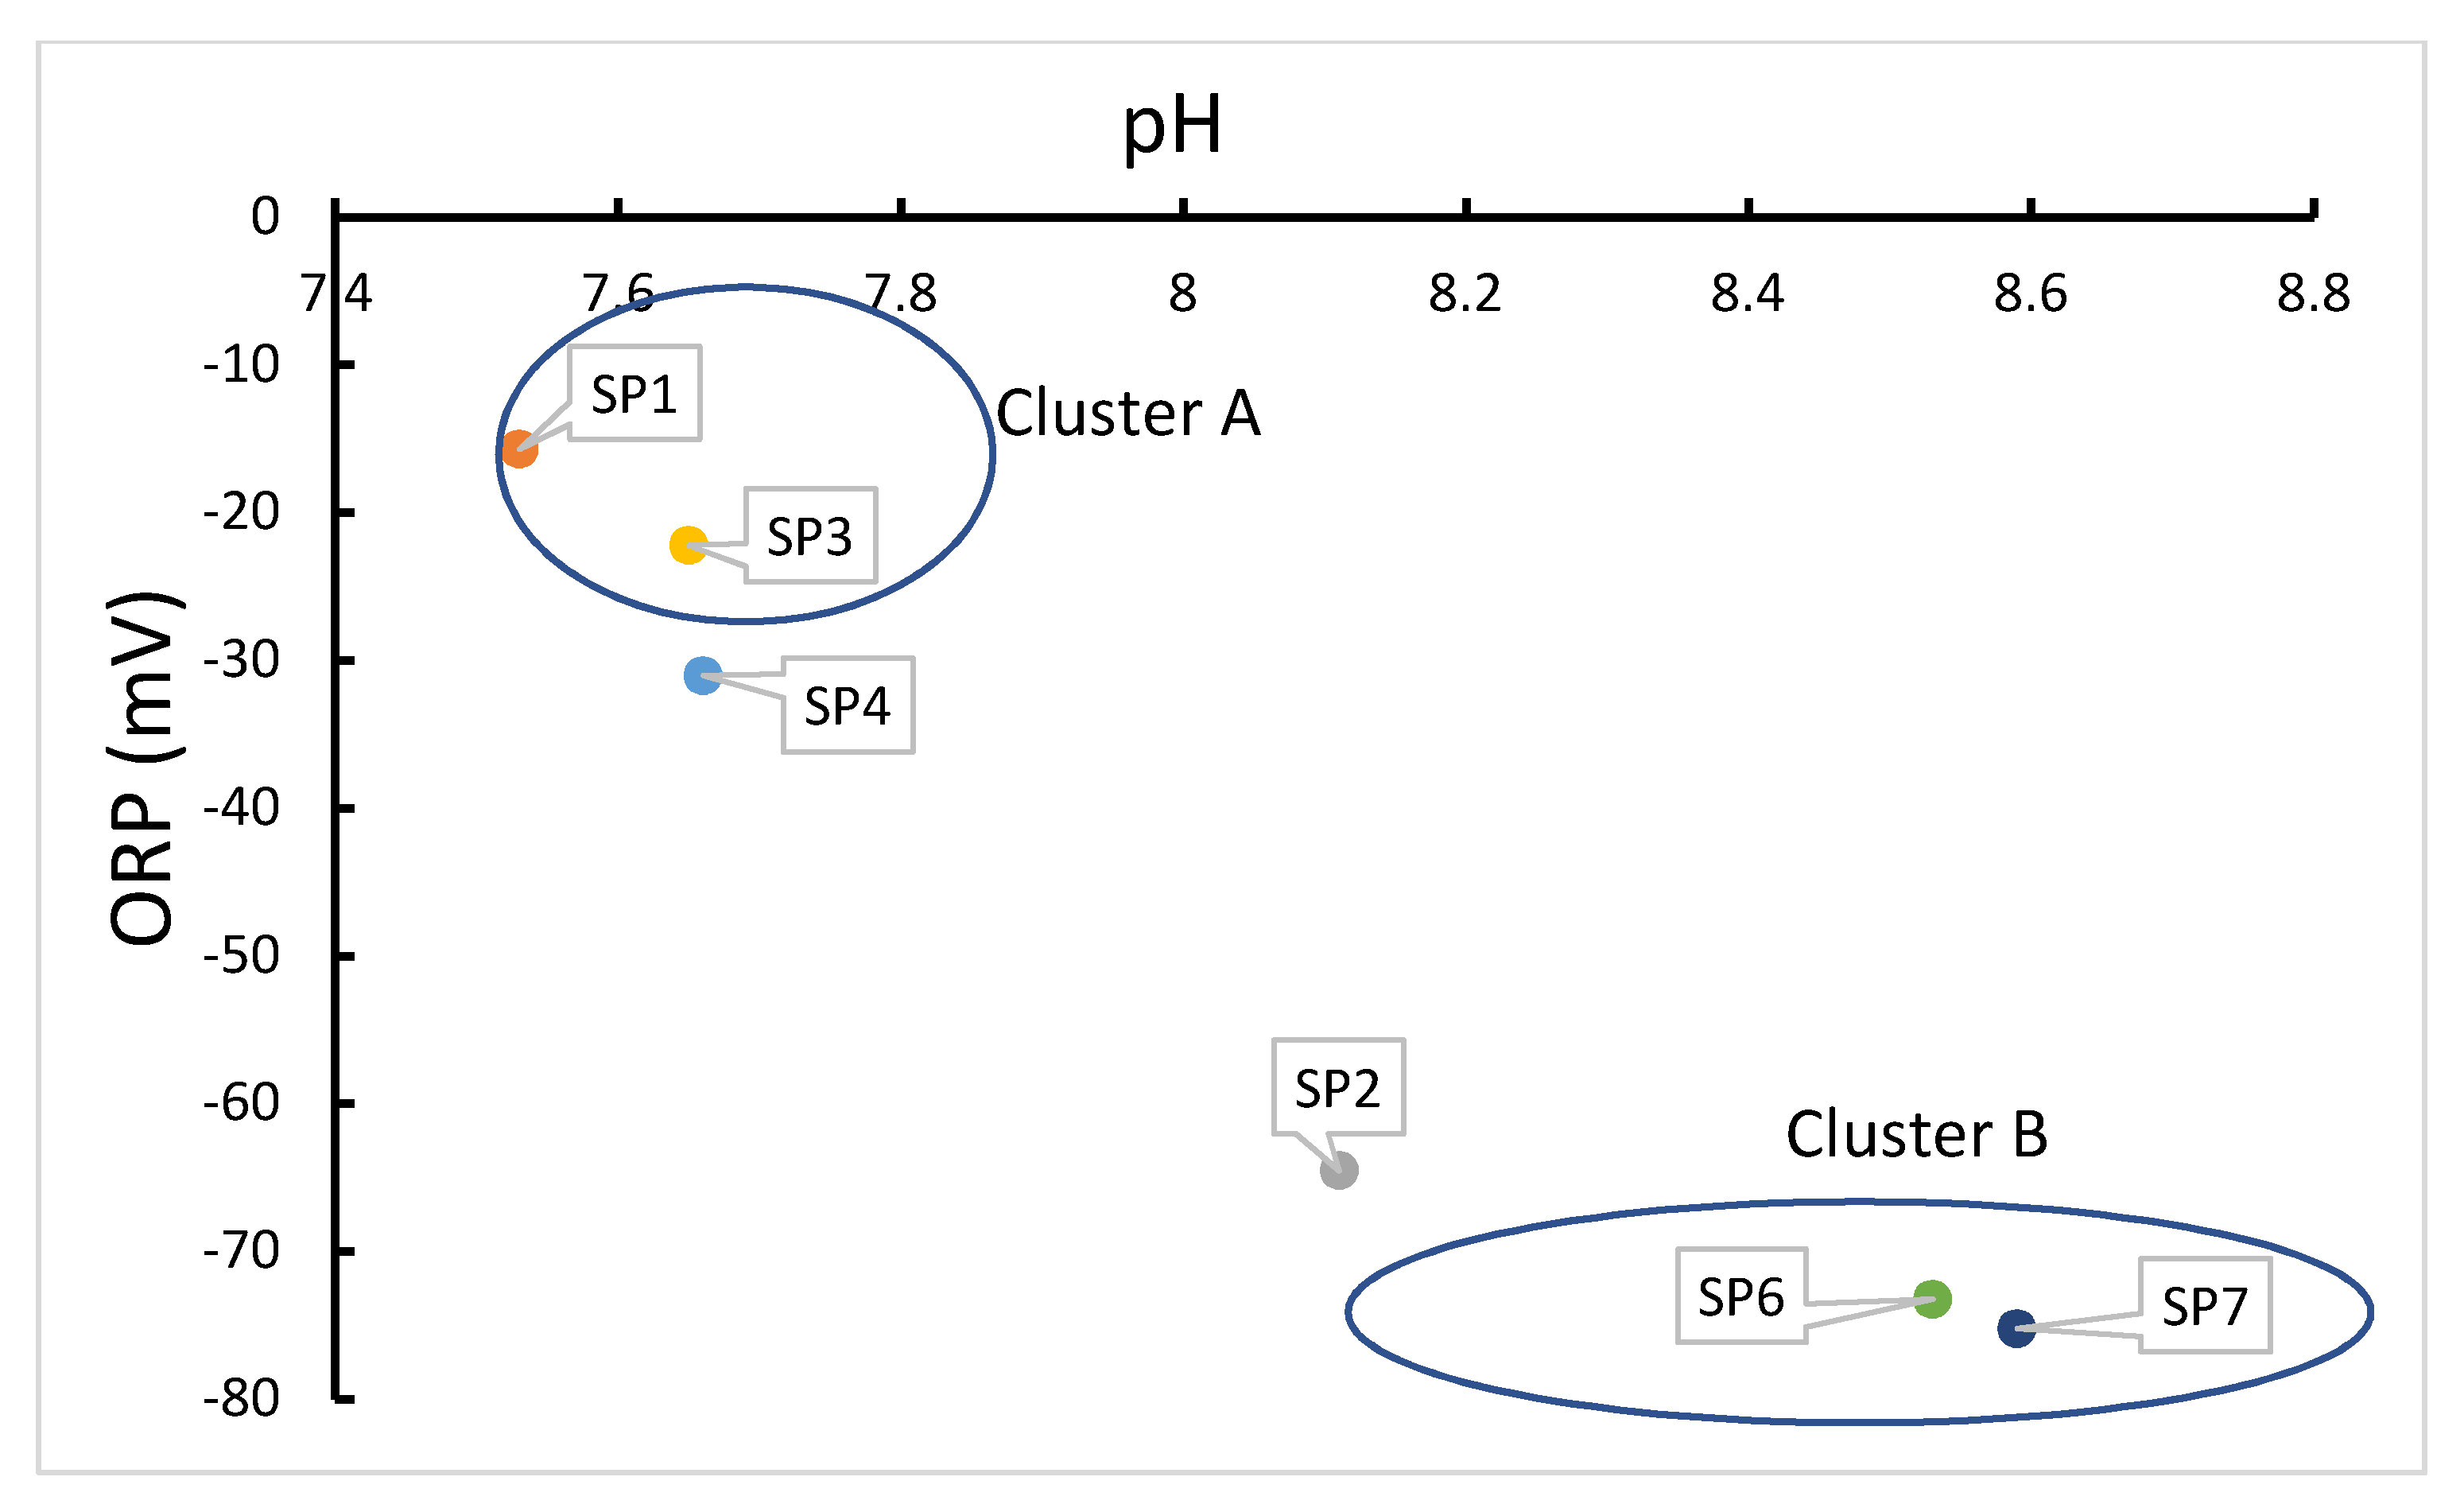
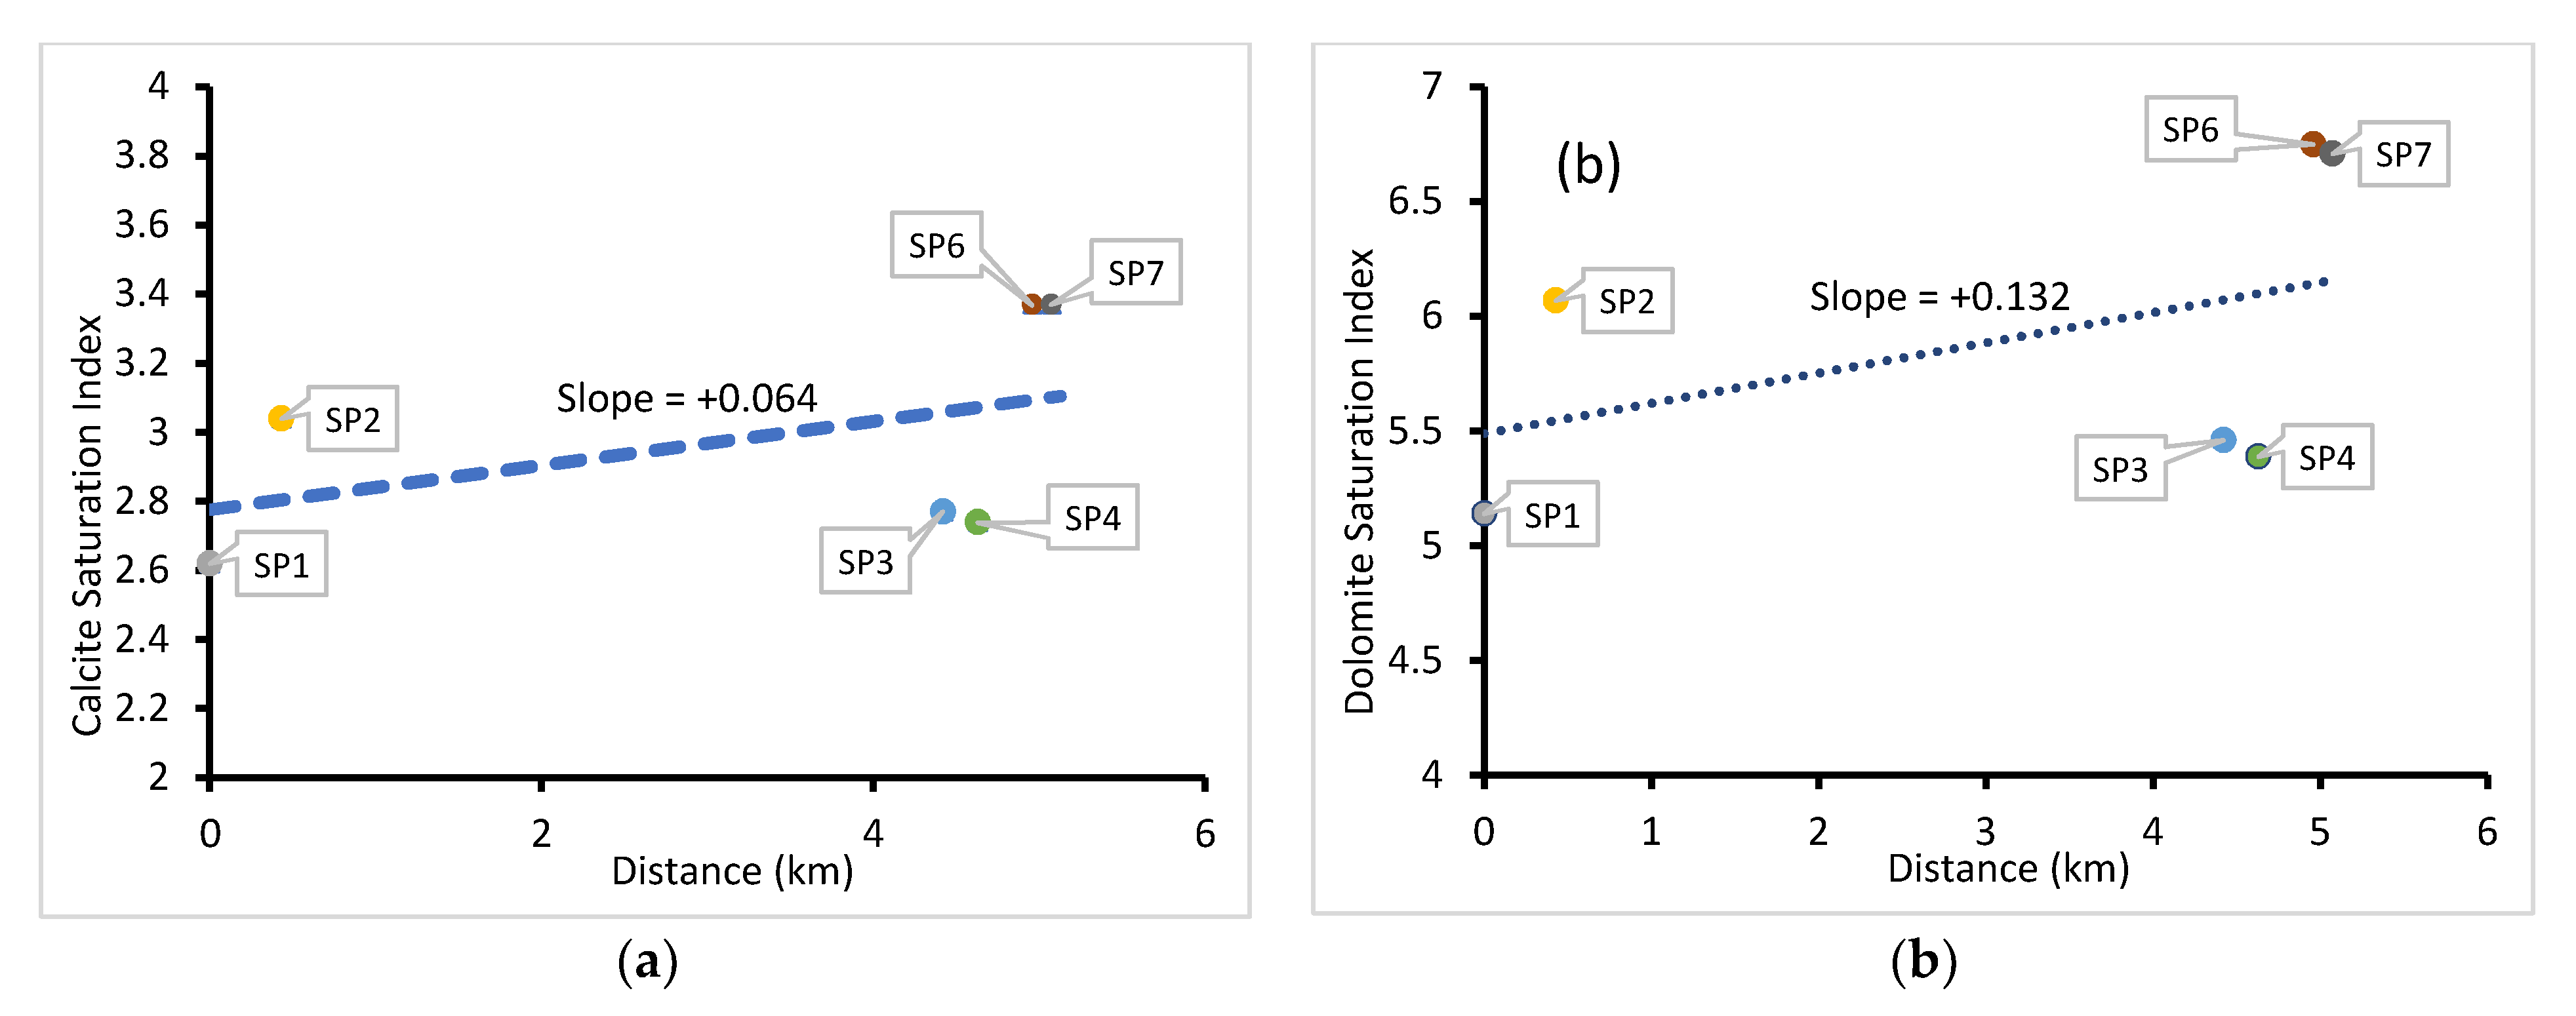
4.2. Hydrogeological Characterization of the Karst Aquifers

Table 5 presents the hydrochemical data for the Malmani dolomite springs. The EC values range between 136.5 µS/cm and 220 µS/cm; the pH of all samples is slightly basic, ranging between 7.53 and 8.59; and ORP ranges between −75.2 mV and −15.7 mV, indicating reducing conditions in all samples. Figure 10 presents the Stiff diagrams for the springs. The major cations are Ca2+ and Mg2+, while the major anion is HCO3. Figure 11 presents the changes in physicochemical parameters along the flow path. It can be observed that there is a general decrease in EC and ORP and an increase in pH as water flows downslope to the lower reaches of the valley (Figure 12). These are observed by the slopes on the plots, which are negative for EC and ORP and positive for pH (Figure 11). Table 6 presents the calcite saturation indices that were calculated for all samples using PHREEQC for Windows [34]. Among the minerals whose saturation indices were calculated by PHREEQC, those that are made up of ions that are dominant in the Malapa area (Figure 10) are anhydrite (CaSO4), aragonite and calcite (CaCO3), dolomite (CaMg(CO3)2) and gypsum (CaSO4:H2O). Only the saturation indices of calcite and dolomite were selected to be presented in Figure 13 due to their compositions of both the cation and anion species (Ca2+, Mg2+ and HCO3). This was to show how the saturation indices change with distance down the flow path.
The carbonate concentrations in groundwater are derived from the dissolution of carbonate-rich aquifers when they interact with water that is subsaturated with calcite, often due to the presence of weak carbonic acid caused by dissolution of CO2 [35,44]. As rainwater containing weak carbonic acid (H2CO3) infiltrates the soil, it dissolves CO2 from the soil zone, and as it percolates further, it causes dissolution of carbonate minerals [44,45]; hence the groundwater samples in the Malapa area are dominated by Ca2+, Mg2+ and HCO3 (Figure 10). The chemical reaction is thus:
3CaCO3·2MgCO3+5H2CO3 → 3Ca (HCO3)2 + 2Mg (HCO3)2
Dolomite + Carbonic acid → Calcium-bicarbonate + Magnesium-bicarbonate.
As water flows out of SP3, it has a higher carbon dioxide partial pressure (pCO2), which gives rise to a low pH, and due to lower atmospheric pCO2, CO2 in solution begins to degas [45]. As degassing continues, the pH of water begins to rise. Since the solubility of carbonates decreases with a rise in pH [35,36], as pH increases, precipitation of carbonate minerals (e.g., calcite and dolomite) is induced, thereby forming rapids caused by travertine deposition [45]. The saturation index values on Table 6 show that all samples are supersaturated with calcite and dolomite and are, therefore, incapable of further dissolving carbonates from the aquifer and bedrock, rather suitable for precipitation [35]. Figure 13 shows that there is a further progressive increase in saturation indices downstream as pH also increases.
Therefore, the formation of travertine along the stream is possibly the cause of the evolving hydrochemistry. The samples can be classified into two clusters as shown in Figure 12. Cluster A represents water at the sources where calcite has not precipitated, and cluster B represents water in the stream after the deposition of travertine. Precipitation of carbonate minerals leads to a decrease in EC, ORP and total dissolved solids (TDS) in the water, hence the observed general trends along the flow path (Figure 10).
The temporal concentrations of silica (Si) in Nouklip spring ranged from 4.2 to 6 mg/L between 1980 and 2006 (Department of Water and Sannitation, South Africa). Silicates often react sluggishly in water [35] such that equilibrium is seldom reached within the short residence time of water in a silicate aquifer (particularly at low temperatures). This means that for groundwater to have a significant amount of dissolved Si, it may have had a significant residence time in a silicate-rich aquifer. This could suggest that besides the dolomites, water may also interact with the overlying or surrounding quartzite, shale and chert layers, possibly during recharge or along the deeper groundwater flow path.
The 14C ages for SP1 and SP3 were used to assess the approximate travel time and rate of circulation between the infiltration point downstream of SP1 and SP3 where water re-emerges. The water samples from SP1 and SP3 had residence times of 1641 ± 10 years and 1855 ± 10 years, respectively. Considering the separation distance of 2.2 km and a residence time difference of 200 years, the rate of groundwater circulation in the aquifer was estimated as 11 m/year. In this assessment, the main assumption taken into consideration is that the seepage from SP1 travels through a preferential pathway within the dolomite that has limited porosity. This indicates a slow rate of groundwater flow, which is possibly accompanied by a deeper circulation system. The long residence time agrees well with the deduction made from the high silica concentration, which indicates a long period of water–rock interaction.

5. Conclusions

The stable isotope analysis indicates that the fractured quartzite aquifer that feeds Albert Farm spring is recharged via direct recharge mechanisms. This occurs rapidly through the vertical fractures on the southern boundary of the UCRB. It is deduced that, similar to rainfall events in Johannesburg, which have multiple moisture sources, the variability of stable isotope signatures and d-excess in Albert Farm spring is a reflection of variations in rainfall moisture sources rather than the variations in recharge mechanisms. These variations imply that for groundwater recharge assessment in a sub-tropical region that receives rainfall from different moisture sources, it is necessary to collect multiple samples from each groundwater source, possibly in different seasons, rather than the common practice of deducing interpretations from a single sample. There are traces of an amount effect in Albert Farm spring characterised by high flows that are depleted and low flows that are generally enriched. This condition indicates the dependence of recharge amount on rainfall amount in the fractured Witwatersrand quartzite aquifer. It also indicates that there is minimal mixing of different recharge episodes, thereby suggesting piston or preferential flow. Any measured Albert Farm spring yield in m3/s can be used as input in the established discharge-δ18O regression to estimate its isotopic signature and, therefore, that of effective rainfall. Although assessment of recharge dependence on rainfall amount has commonly been done using long-term rainfall and groundwater level data, this study presents new findings on the use of spring yield versus stable isotope signature for assessing the dependence and the traces of rainfall amount effect in spring yield.
Air temperatures that were calculated using temperature-δ18O regression lines for the time when recharge occurred were lower than the present annual temperatures indicating possibilities of a shift in climate. Stable isotope analysis from shallow piezometers indicated an interaction between the alluvial deposits and the Montgomery stream that is underlain by the massive granites. The interaction is important in regulating the streamflows throughout the year. This interflow contribution indicates that caution should be taken in the application of surface water methods during the estimation of recharge because the estimates from Baseflow Separation method in areas underlain by granites may include a significant amount of interflow even in dry seasons long after rainfall has occurred. The chemical and isotopic tracers revealed how the evolution of hydrochemistry and formation of thick travertine moulds have altered the streambed as CO2 degassing occurs downstream. Through 14C analysis, groundwater travel time in the dolomites has been estimated at 11 km/year, suggesting a deep groundwater circulation through the karst structures.

Author Contributions

Conceptualization: K.L. and T.A.; methodology, K.L.; software, K.L.; validation, T.A.; formal analysis, K.L.; investigation, K.L. and T.A.; resources, T.A.; data curation, K.L. and T.A.; writing—original draft preparation, K.L.; writing—review and editing, K.L. and T.A.; visualization, K.L. and T.A.; supervision, T.A.; project administration, K.L. and T.A.; funding acquisition, T.A. Both authors have read and agreed to the published version of the manuscript.

Funding

This research was funded in whole or part by the United States Agency for International Development (USAID) and the National Academies of Sciences, Engineering, and Medicine (NAS) through Partnership for Enhanced Engagement in Research (PEER) under cooperative agreement number AID-OAA-A-11-00012 Sub-Grant Number: 2000006304 and the Department of Science and Technology (DST), South Africa (UID: 101594). This is where the GRECHLIM project entitled “Understanding recharge in the Limpopo River Basin, South Africa” has been implemented. Any opinions, findings, conclusions, and recommendations expressed in this article are those of the authors alone and do not necessarily reflect the views of USAID or the NAS, and DST.

Institutional Review Board Statement

Not applicable.

Data Availability Statement

Not applicable.

Acknowledgments

We would like to thank the Johannesburg City Parks for allowing us to undertake research at the Albert Farm spring and South African Weather Services for providing us with climate data. Many thanks to the School of Geosciences, the University of the Witwatersrand for logistic support. We would also like to thank Sipho Nyebelele from the University of the Witwatersrand for assistance with spring yield measurements.

Conflicts of Interest

The authors declare no conflict of interest.

References

  1. Scanlon, B.R.; Keese, K.E.; Flint, A.L.; Flint, L.E.; Gaye, C.B.; Edmunds, W.M.; Simmers, I. Global synthesis of groundwater recharge in semiarid and arid regions. Hydrol. Process. 2006, 20, 3335–3370. [Google Scholar] [CrossRef]
  2. Abiye, T.A. Synthesis on groundwater recharge in Southern Africa: A supporting tool for groundwater users. Groundw. Sustain. Dev. 2016, 2–3, 182–189. [Google Scholar] [CrossRef]
  3. Julander, R.P.; Clayton, J.A. Determining the proportion of streamflow that is generated by cold season processes versus summer rainfall in Utah, USA. J. Hydrol. Reg. Stud. 2018, 17, 36–46. [Google Scholar] [CrossRef]
  4. Jenicek, M.; Ledvinka, O. Importance of snowmelt contribution to seasonal runoff and summer low flows in Czechia. Hydrol. Earth Syst. Sci. 2020, 24, 3475–3491. [Google Scholar] [CrossRef]
  5. Miller, M.P.; Buto, S.G.; Susong, D.D.; Rumsey, C. The importance of base flow in sustaining surface water flow in the Upper Colorado River Basin. Water Resour. Res. 2016, 52, 3547–3562. [Google Scholar] [CrossRef]
  6. Shaw, E.M. Hydrology in Practice; Routledge: Oxford, UK, 2005; p. 569. [Google Scholar]
  7. Lerner, D.N.; Issar, A.S.; Simmers, I. Groundwater Recharge: A Guide to Understanding and Estimating Natural Recharge; Heise: Hannover, Germany, 1990. [Google Scholar]
  8. Gee, G.W.; Hillel, D. Groundwater recharge in arid regions: Review and critique of estimation methods. Hydrol. Process. 1988, 2, 255–266. [Google Scholar] [CrossRef]
  9. Xu, Y.; Beekman, H. Groundwater Recharge Estimation in Southern Africa; UNESCO: Paris, France, 2003; p. 207. [Google Scholar]
  10. Healy, R.W. Estimating Groundwater Recharge; Cambridge University Press: Cambridge, UK, 2010; p. 245. [Google Scholar]
  11. Horton, E.R. The Rôle of infiltration in the hydrologic cycle. Eos Trans. Am. Geophys. Union 1933, 14, 446–460. [Google Scholar] [CrossRef]
  12. Freeze, R.A.; Cherry, A.J. Groundwater; Prentice-Hall: Englewood Cliffs, NJ, USA; London, UK, 1979. [Google Scholar]
  13. Shongwe, M.E.; van Oldenborgh, G.J.; van den Hurk, B.J.J.M.; de Boer, B.; Coelho, C.A.S.; van Aalst, M.K. Projected Changes in Mean and Extreme Precipitation in Africa under Global Warming. Part I: Southern Africa. J. Clim. 2009, 22, 3819–3837. [Google Scholar] [CrossRef]
  14. New, M.; Hewitson, B.; Stephenson, D.B.; Tsiga, A.; Kruger, A.; Manhique, A.; Gomez, B.; Coelho, C.A.S.; Masisi, D.N.; Kululanga, E.; et al. Evidence of trends in daily climate extremes over southern and west Africa. J. Geophys. Res. Atmos. 2006, 111. [Google Scholar] [CrossRef]
  15. Owor, M.; Taylor, R.G.; Tindimugaya, C.; Mwesigwa, D. Rainfall intensity and groundwater recharge: Empirical evidence from the Upper Nile Basin. Environ. Res. Lett. 2009, 4, 035009. [Google Scholar] [CrossRef]
  16. Kotchoni, D.O.V.; Vouillamoz, J.-M.; Lawson, F.M.A.; Adjomayi, P.; Boukari, M.; Taylor, R.G. Relationships between rainfall and groundwater recharge in seasonally humid Benin: A comparative analysis of long-term hydrographs in sedimentary and crystalline aquifers. Hydrogeol. J. 2019, 27, 447–457. [Google Scholar] [CrossRef] [Green Version]
  17. Taylor, R.G.; Todd, M.C.; Kongola, L.; Maurice, L.; Nahozya, E.; Sanga, H.; MacDonald, A.M. Evidence of the dependence of groundwater resources on extreme rainfall in East Africa. Nat. Clim. Chang. 2013, 3, 374. [Google Scholar] [CrossRef] [Green Version]
  18. Clark, I.D.; Fritz, P. Environmental Isotopes in Hydrogeology; Lewis Publishers: Boca Raton, FL, USA, 1997; p. 352. [Google Scholar]
  19. IAEA. Environmental Isotopes in the Hydrological Cycle; International Atomica Energy Agency: Paris, France; Vienna, Austria, 2000; p. 185. [Google Scholar]
  20. Guan, H.; Zhang, X.; Skrzypek, G.; Sun, Z.; Xu, X. Deuterium excess variations of rainfall events in a coastal area of South Australia and its relationship with synoptic weather systems and atmospheric moisture sources. J. Geophys. Res. Atmos. 2013, 118, 1123–1138. [Google Scholar] [CrossRef]
  21. Department of Water Affairs and Forestry. Crocodile River (West) and Marico Water Management Area: Internal Strategic Perspective of the Crocodile River (West) Catchment; Department of Water Affairs and Forestry: Pretoria, South Africa, 2004.
  22. Tyson, P.D.; Tyson, P.D.; Preston-Whyte, R.A. The Weather and Climate of Southern Africa; Oxford University Press: Oxford, UK, 2000. [Google Scholar]
  23. White, W.B.; Peterson, R.G. An Antarctic circumpolar wave in surface pressure, wind, temperature and sea-ice extent. Nature 1996, 380, 699–702. [Google Scholar] [CrossRef]
  24. Renwick, J.A. Southern Hemisphere Circulation and Relations with Sea Ice and Sea Surface Temperature. J. Clim. 2002, 15, 3058. [Google Scholar] [CrossRef]
  25. van Wyk, E.; van Tonder, G.J.; Vermeulen, D. Characteristics of local groundwater recharge cycles in South African semi-arid hard rock terrains: Rainfall–groundwater interaction. Water SA 2012, 38, 747–754. [Google Scholar] [CrossRef] [Green Version]
  26. Barnard, H.C. An Explanation of the 1:500,000 General Hydrogeological Map; Department of Water Affairs and Forestry: Pretoria, South Africa, 2000; p. 84.
  27. Pretorius, D.A. The Nature of the Witwatersrand Gold-Uranium Deposits, ch 2; Elsevier: Amsterdam, The Netherlands, 1976. [Google Scholar]
  28. Judson, S.; Deffeyes, K.S.; Hargraves, R.B. Physical Geology; Prentice-Hall: Englewood Cliffs, NJ, USA; London, UK, 1976. [Google Scholar]
  29. Poujol, M.; Anhaeusser, C.R. The Johannesburg Dome, South Africa: New single zircon U–Pb isotopic evidence for early Archaean granite–greenstone development within the central Kaapvaal Craton. Precambrian Res. 2001, 108, 139–157. [Google Scholar] [CrossRef]
  30. Hobbs, P.J. Situation Assessment of the Surface Water and Groundwater Resource Environments in the Cradle for Human Kind World Heritage Site. Report Prepared for the Management Authority; Department of Economic Development: Johannesburg, South Africa, 2011.
  31. Subramanya, K. Engineering Hydrology, 3rd ed.; Tata McGraw-Hill: New Delhi, India, 2008. [Google Scholar]
  32. Leketa, K.; Abiye, T.; Butler, M. Characterisation of groundwater recharge conditions and flow mechanisms in bedrock aquifers of the Johannesburg area, South Africa. Environ. Earth Sci. 2018, 77, 727. [Google Scholar] [CrossRef]
  33. Leketa, K.; Abiye, T. Investigating stable isotope effects and moisture trajectories for rainfall events in Johannesburg, South Africa. Water SA 2020, 46, 429–437. [Google Scholar]
  34. Parkhurst, D.; Appelo, T. User’s Guide to PHREEQC Version 3—A Computer Program for Speciation, Batch-Reaction, One-Dimensional Transport, and Inverse Geochemical Calculations; United States Geological Survey: Reston, VA, USA, 1999; Volume 99. [Google Scholar]
  35. Appelo, C.A.; Postma, D. Geochemistry, Groundwater and Pollution, 2nd ed.; Balkema: Leiden, The Netherlands; New York, NY, USA, 2005. [Google Scholar]
  36. Eby, G.N. Principles of Environmental Geochemistry; Thomson-Brooks/Cole: Pacific Grove, CA, USA, 2004. [Google Scholar]
  37. Garrels, R.M.; Mackenzie, F.T. Origin of the Chemical Compositions of Some Springs and Lakes. In Equilibrium Concepts in Natural Water Systems; American Chemical Society: Washington, DC, USA, 1967; Volume 67, pp. 222–242. [Google Scholar]
  38. Aghazadeh, N.; Chitsazan, M.; Golestan, Y. Hydrochemistry and quality assessment of groundwater in the Ardabil area, Iran. Appl. Water Sci. 2017, 7, 3599–3616. [Google Scholar] [CrossRef] [Green Version]
  39. Craig, H. Isotopic Variations in Meteoric Waters. Science 1961, 133, 1702–1703. [Google Scholar] [CrossRef] [PubMed]
  40. Fritz, P.; Drimmie, R.J.; Frape, S.K.; O’shea, K. The Isotope Composition of Precipitation and Groundwater in Canada. In Proceedings of the Symposium, Vienna, Austria, 30 March–3 April 1987; IAEA and UNESCO: Vienna, Austria, 1987; pp. 539–549. [Google Scholar]
  41. IAEA. Isotopic Composition of Precipitation in the Mediterranean Basin in Relation to Air Circulation Patterns and Climate; International Atomic Energy Agency: Vienna, Austria, 2005. [Google Scholar]
  42. Dansgaard, W. Stable isotopes in precipitation. Tellus 1964, 16, 436–468. [Google Scholar] [CrossRef]
  43. Sami, K. Recharge mechanisms and geochemical processes in a semi-arid sedimentary basin, Eastern Cape, South Africa. J. Hydrol. 1992, 139, 27–48. [Google Scholar] [CrossRef]
  44. Hiscock, K.M. (Ed.) Hydrogeology: Principles and Practice; Blackwell: Malden, MA, USA; Oxford, UK, 2005. [Google Scholar]
  45. Krešić, N. Hydrogeology and Groundwater Modeling, 2nd ed.; CRC Press: London, UK; Taylor & Francis: Boca Raton, FL, USA, 2007. [Google Scholar]
Figure 1. Location map of the study area in the Upper Crocodile River Basin and the South African map also showing the positions of Albert Farm spring and the isotope sampling points.
Hydrology 08 00050 g001
Figure 2. The quartzite on the southern boundary of the UCRB (a) and the fractured quartzite rocks that host the Albert Farm spring (b).
Hydrology 08 00050 g002aHydrology 08 00050 g002b
Figure 3. Geological map of the Malapa area showing some of the dolomitic springs (SP1, SP2, SP3 and SP4).
Hydrology 08 00050 g003
Figure 5. Plot of d-excess versus δ18O for the monthly Albert farm spring samples.
Hydrology 08 00050 g005
Figure 6. Plots of Albert Farm spring yield versus (a) δ18O with a correlation of 0.51 and (b) δ2H with a very poor correlation 0.087.
Hydrology 08 00050 g006
Figure 7. Plots of spring yield versus stable isotopes excluding outlier samples with (a) showing a correlation between yield and δ18O and (b) showing 0.47 between yield and δ2H.
Hydrology 08 00050 g007
Figure 8. Schematic of stream gain and stream loss at the Montgomery Stream, which is underlain by the granites.
Hydrology 08 00050 g008
Figure 9. Stable isotope plot of piezometers, Montgomery stream and the selected Albert Farm spring samples plotted against the Johannesburg Local Meteoric Water Line (JLMWL).
Hydrology 08 00050 g009
Figure 10. Stiff diagrams showing hydrochemistry of the dolomitic springs.
Hydrology 08 00050 g010
Figure 11. pH (a), EC (b) and ORP (c) variation along the flow path.
Hydrology 08 00050 g011aHydrology 08 00050 g011b
Figure 12. ORP and pH variation along the flow path showing cluster A before calcite precipitation and cluster B after calcite precipitation.
Hydrology 08 00050 g012
Figure 13. Variation of saturation indices for calcite (a) and dolomite (b) along the flow path.
Hydrology 08 00050 g013
Table 1. Monthly stable isotope data for Albert Farm spring.
ID Latitude (DD) Longitude (DD)δ2H (‰)2H StDevδ18O (‰)18O StDevd-Excess (‰)
June 2016−26.161627.9703−19.30.2−5.270.1+16.0
July 2016−26.161627.9703−21.60.3−6.010.1+18.7
August 2016−26.161627.9703−19.10.1−4.300.1+9.7
September 2016−26.161627.9703−14.50.0−2.860.0+4.7
October 2016−26.161627.9703−13.71.3−3.790.1+11.7
November 2016−26.161627.9703−16.00.3−3.780.1+9.4
December 2016−26.161627.9703−14.30.0−3.570.1+9.6
January 2017−26.161627.9703−12.50.5−3.090.0+8.3
February 2017−26.161627.9703−15.00.8−3.430.0+8.0
March 2017−26.161627.9703−16.40.6−3.670.1+8.2
April 2017−26.161627.9703−15.20.7−4.130.2+12.4
May 2017−26.161627.9703−12.30.5−3.110.1+8.6
June 2017−26.161627.9703−14.90.4−3.460.0+8.3
July 2017−26.161627.9703−16.31.2−3.920.2+9.9
August 2017−26.161627.9703−15.20.3−3.050.1+5.2
September 2017−26.161627.9703−18.30.3−3.720.1+6.6
October 2017−26.161627.9703−20.30.3−4.120.1+7.3
November 2017−26.161627.9703−12.00.4−2.280.1+3.2
December 2017−26.161627.9703−11.71.5−2.810.1+7.1
January 2018−26.161627.9703−10.52.2−2.790.2+8.2
February 2018−26.161627.9703−14.20.5−2.860.1+5.0
March 2018−26.161627.9703−16.01.3−3.450.1+7.2
April 2018−26.161627.9703−12.90.8−3.100.1+7.9
May 2018−26.161627.9703−12.32.8−3.130.4+8.7
June 2018−26.161627.9703−12.91.1−2.850.1+6.3
Table 2. The stable isotope and spring discharge data for the Albert Farm spring over the 14 month period.
Dateδ18O (‰)δ2H (‰)Spring Discharge: Q (L/s)
February 17−3.43−15.03.2
March 17−3.67−16.43.9
April 17−4.13−15.24.8
May 17−3.11−12.32.2
June 17−3.46−14.93.6
July 17−3.92−16.33.8
August 17−3.05−15.21.4
September 17−3.72−18.31.4
October 17−4.12−20.31.9
November 17−2.28−12.00.66
December 17−2.81−11.71.3
January 18−2.79−10.51.3
February 18−2.86−14.21.2
March 18−3.45−16.02.3
Table 3. The estimated mean annual and daily air temperatures at the time of recharge for the Albert Farm spring samples over the 25 months.
Sample DateEstimated Annual Air Temp. (°C) on the Year of RechargeEstimated Daily Air Temperature during Recharge (°C)
June 201612.016.0
July 201610.914.7
August 201613.417.8
September 201615.520.4
October 201614.118.7
November 201614.118.7
December 201614.419.1
January 201715.119.9
February 201714.619.3
March 201714.318.9
April 201713.618.1
May 201715.119.9
June 201714.619.3
July 201713.918.4
August 201715.220.0
September 201714.218.8
October 201713.618.1
November 201716.321.4
December 201715.520.5
January 201815.620.5
February 201815.520.4
March 201814.619.3
April 201815.119.9
May 201815.119.9
June 201815.520.4
Average14.519.1
MIN10.914.7
MAX16.321.4
Table 4. Stable isotope and water level data for the piezometers and the stream.
Site IDDate Water Level (mbgl)δ2H (‰)±2H StDevδ18O (‰)±18O StDev
PZ16 June 20161.12−12.50.33−3.000.06
PZ26 June 20160.64−68.50.13−12.470.09
River head6 June 20160.72−66.30−12.270
PZ113 July 20161.12−17.80−5.360
PZ213 July 20160.52−16.30−5.040
River head13 July 20160.75−9.80−3.880
PZ112 August 20161.17−12.40.22−3.050.05
PZ212 August 20160.58−12.30.16−2.850.07
River head12 August 20160.72−4.90.24−1.590.06
PZ16 September 2016PZ dry no samplePZ dry no samplePZ dry no samplePZ dry no samplePZ dry no sample
PZ26 September 20160.66−1.70.22−0.450.05
Stream head6 September 20160.92−9.50.65−1.830.02
PZ1 -26.149247 DD Lat, 27.997857 DD Long, 1593 masl Elev, 1.2mbgl PZ depth
PZ2 -26.149333 DD Lat, 27.997868 DD Long, 1593 masl Elev, 2.15mbgl PZ depth
Table 5. Hydrochemical data for the Malmani Dolomite springs.
Sample IDLatitudeLongitude Elev.EC Temp.pHTDS ORPCa2+Mg2+Na+K+HCO3CO32−Cl-SO42−Electrical Balance
DDDDmaslμS/cm°C mg/LmVmg/Lmg/Lmg/Lmg/Lmg/Lmg/Lmg/Lmg/L%
SP1-Nash Farm spring−25.9080627.797551450181.422.17.53116.2−15.738231.60.522402.42.91.3
SP2−25.9045527.795961440188.921.38.11120.7−64.532241.50.220712.42.41.7
SP3-Nouklip spring−25.8751527.78574132322021.67.65140.2−22.241261.50.424301.42.12.7
SP4−25.8744827.783781319172.321.37.66110−3138241.50.3226210.62.1
SP5−25.8747127.78091320-21.57.77----------
SP6−25.8747227.780481300172.621.58.53110.6−73.234241.30.322141.41.9−0.9
SP7−25.8754127.779591290136.520.88.5987.4−75.231201.80.4219521−7.4
SP8−25.8756927.779131313-21.108.52----------
SP9−25.8759827.779681316-19.208.38----------
Table 6. Calcite saturation indices.
Sample IDSaturation Indices
Calcite (CaCO3)Dolomite (CaMg(CO3)2)
SP12.625.14
SP23.046.07
SP32.775.46
SP42.745.39
SP63.376.75
SP73.376.71
Publisher’s Note: MDPI stays neutral with regard to jurisdictional claims in published maps and institutional affiliations.

