
Pressures and Status of the Riparian Vegetation in Greek Rivers: Overview and Preliminary Assessment

 ,
, 
 ,
,  ,
, 

Abstract
:1. Introduction
1.1. Riparian Zones and WFD
1.2. Riparian Vegetation and Hydromorphological Alterations
2. Materials and Methods
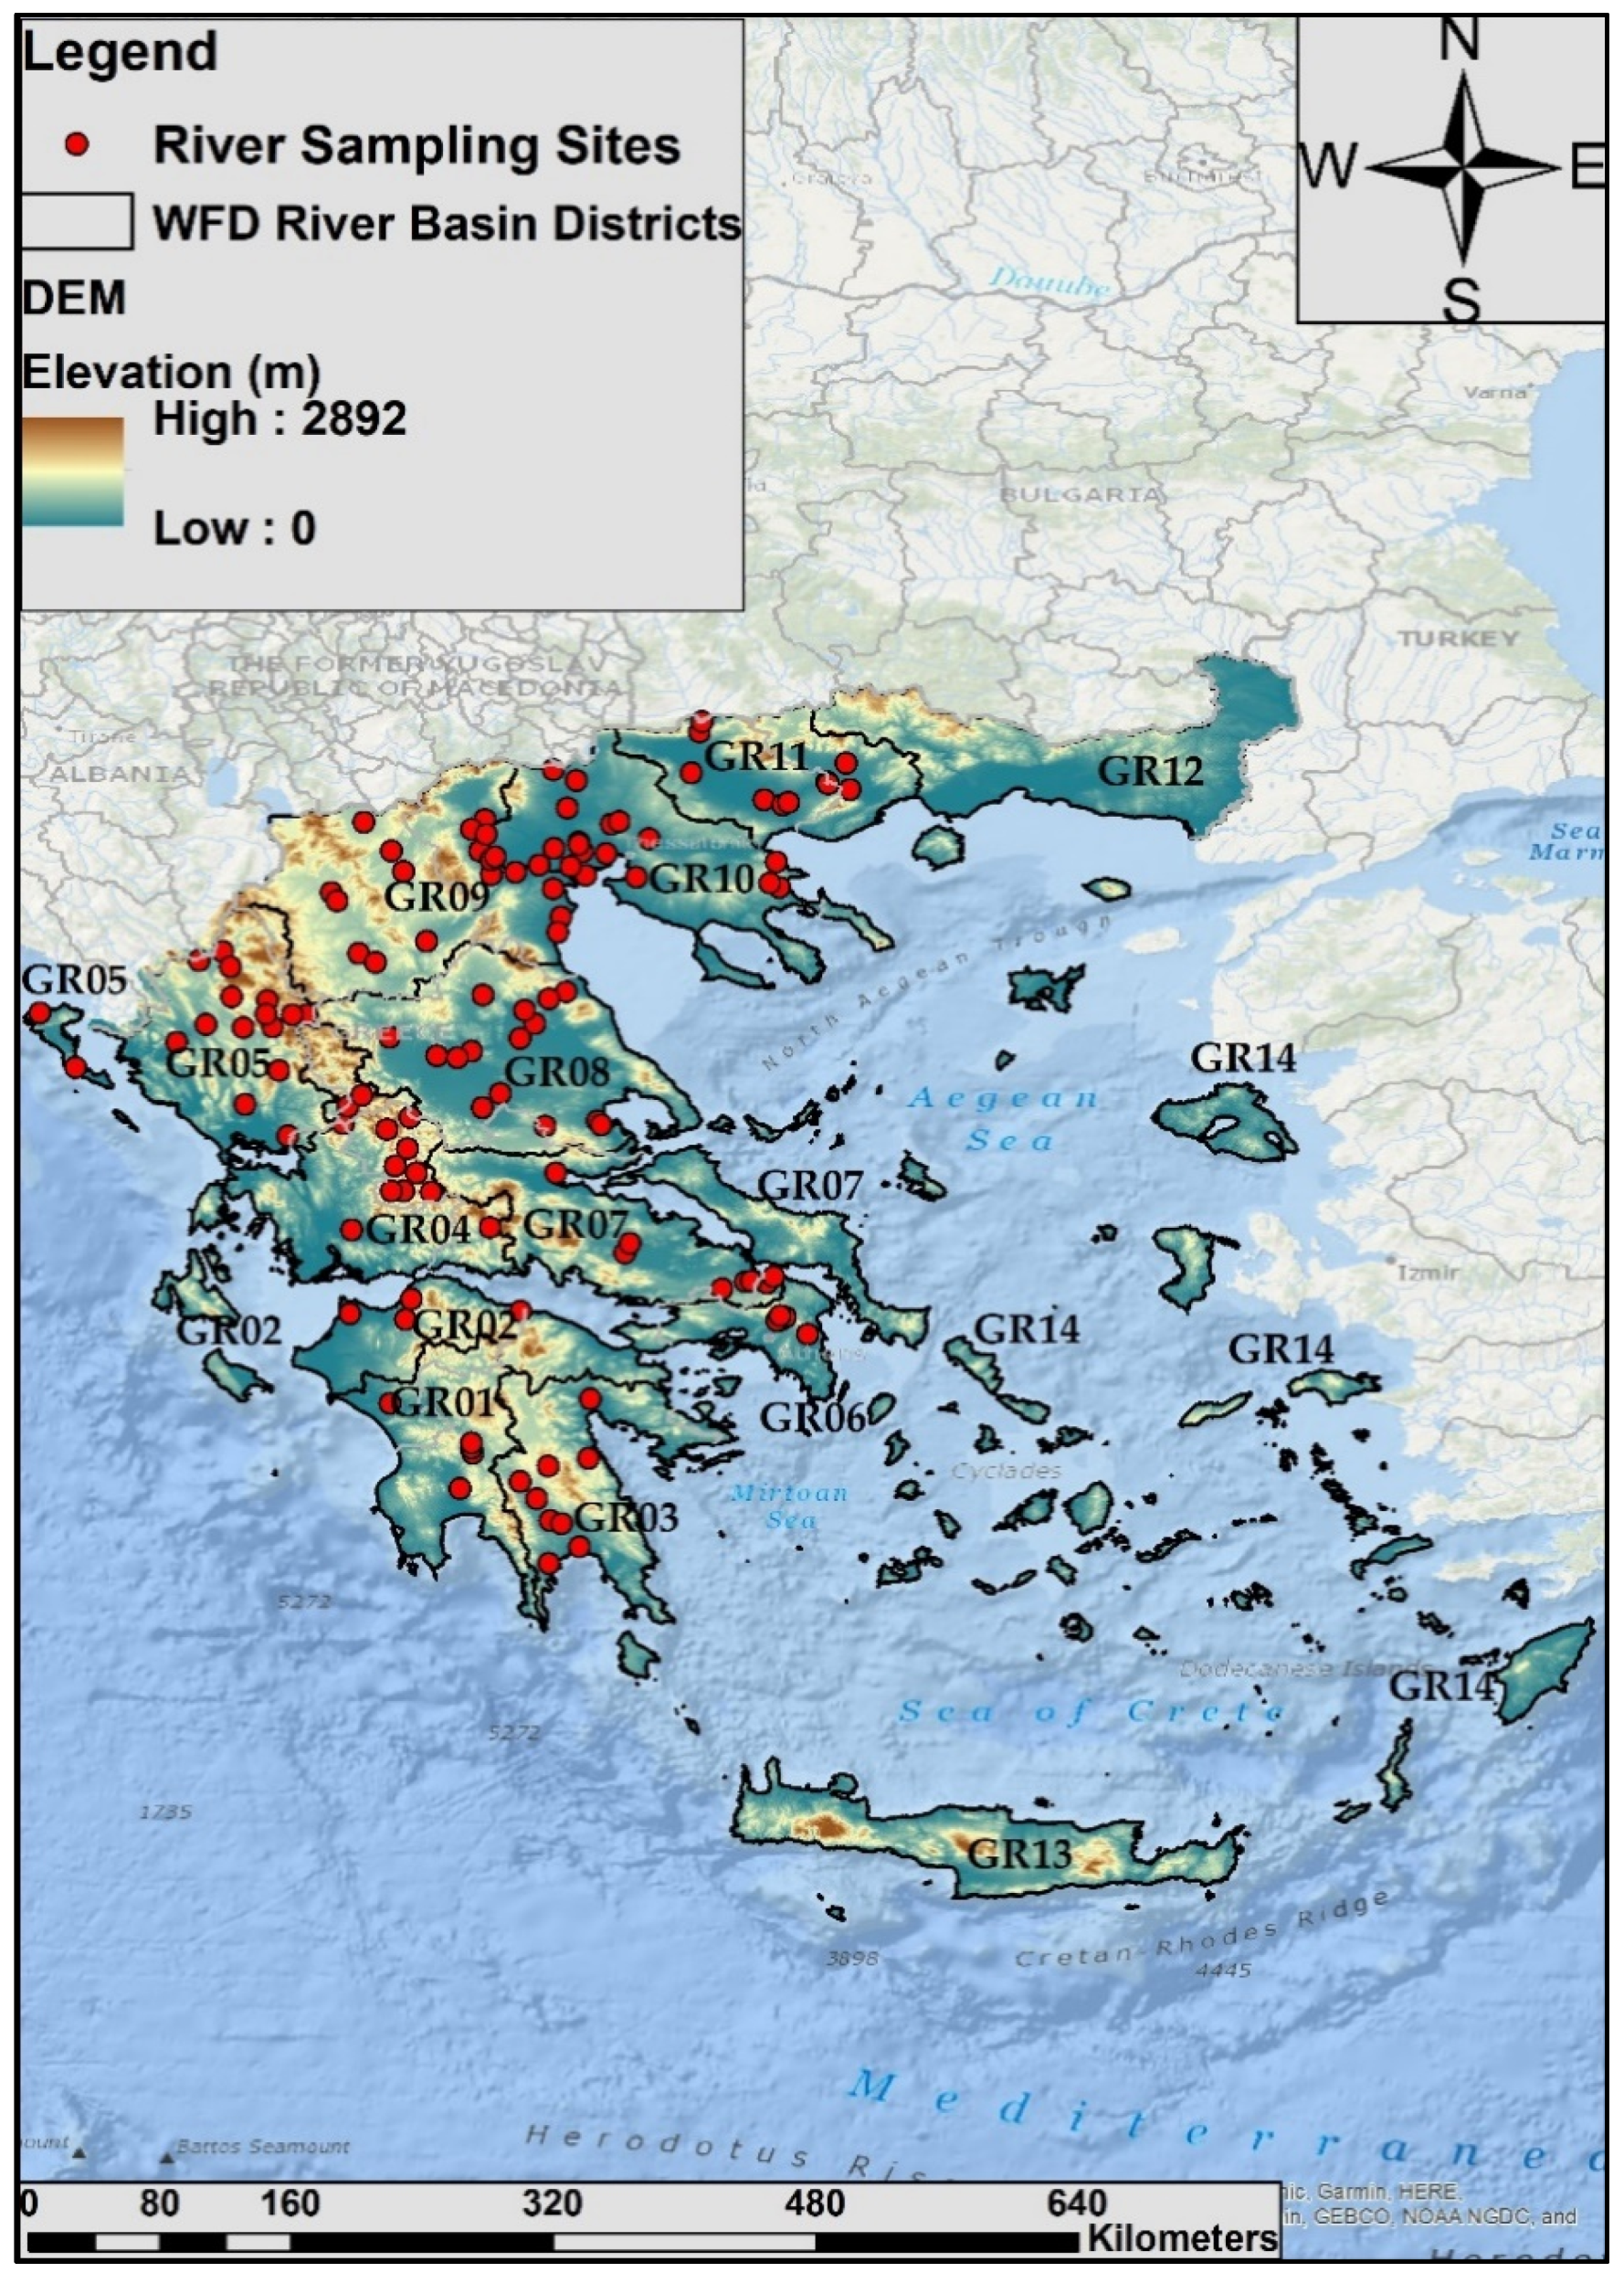
2.1. Description of the Study Area
2.2. Methods and Tools for the Evaluation of Riparian Vegetation Quality and Hydromorphological Assessment
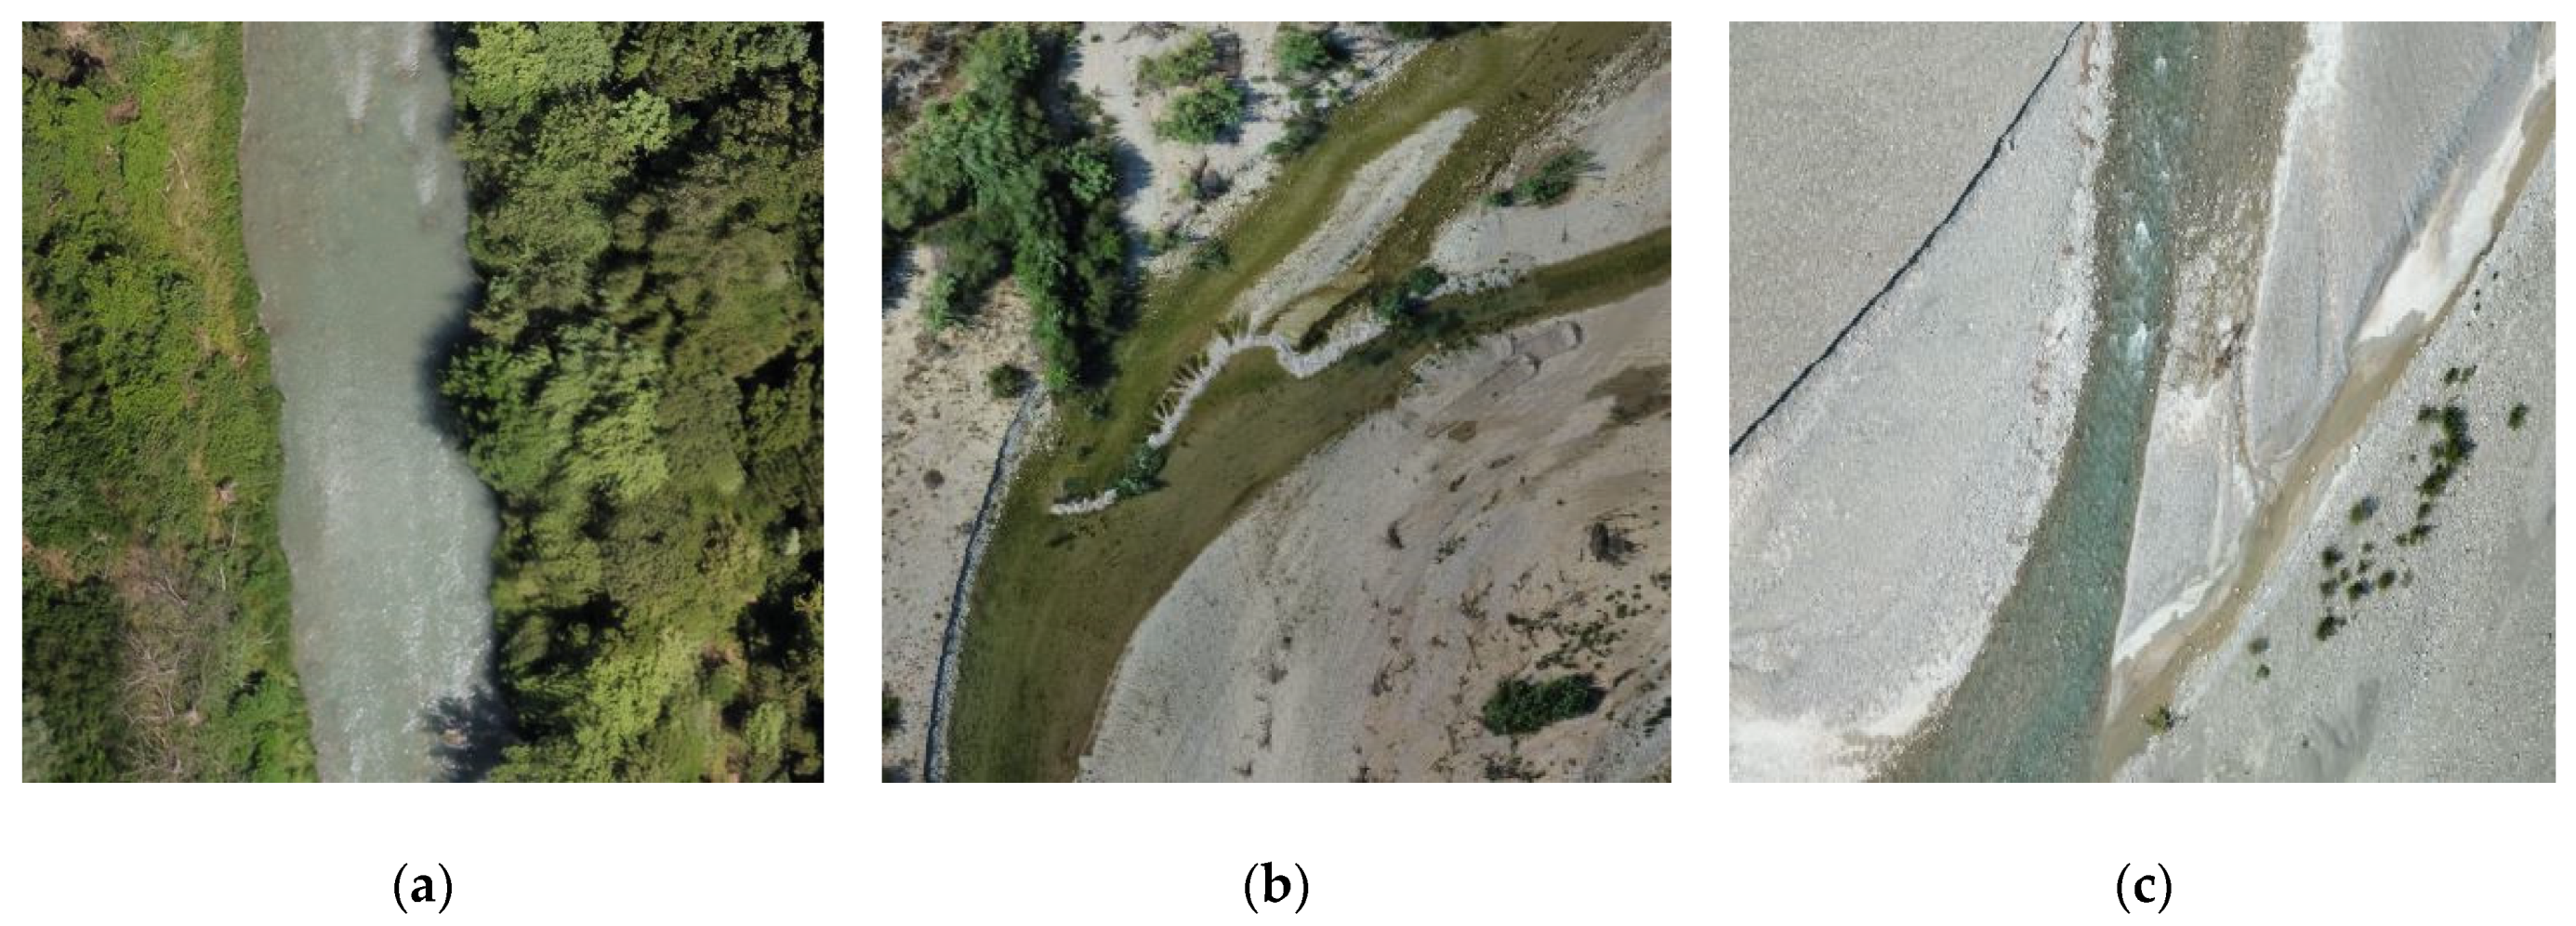
2.3. Drone Flights
2.4. Watershed Delineation and Definition of Main Land Uses
2.5. Statistical Analysis
3. Results and Discussion
4. Conclusions
Author Contributions
Funding
Data Availability Statement
Conflicts of Interest
References
- Matono, P. Effects of Agricultural Land Use on the Ecohydrology of Small-Medium Mediterranean River Basins: Insights from a Case Study in the South of Portugal; Batista, T., Ed.; IntechOpen: Rijeka, Croatia, 2019; pp. 29–51. ISBN 978-1-78985-704-7. [Google Scholar]
- Stefanidis, K.; Papaioannou, G.; Markogianni, V.; Dimitriou, E. Water quality and hydromorphological variability in Greek Rivers: A nationwide assessment with implications for management. Water 2019, 11, 1680. [Google Scholar] [CrossRef] [Green Version]
- European Parliament and the Council of the European Union. Directive 2000/60/EC of the European parliament and of the council of 23 October 2000 establishing a framework for community action in the field of water policy. Off. J. Eur. Communities 2000, 327, 1–73. [Google Scholar]
- Del Tánago, M.G.; De Jalón, D.G. Riparian Quality Index (RQI): A methodology for characterising and assessing the environmental conditions of riparian zones. Limnetica 2011, 30, 235–254. [Google Scholar] [CrossRef]
- Stefanidis, K.; Latsiou, A.; Kouvarda, T.; Lampou, A.; Kalaitzakis, N.; Gritzalis, K.; Dimitriou, E. Disentangling the main components of hydromorphological modifications at reach scale in rivers of Greece. Hydrology 2020, 7, 22. [Google Scholar] [CrossRef] [Green Version]
- Stefunkova, Z.; Neruda, M.; Vasekova, B. Impact Evaluation of riparian vegetation on aquatic habitat quality of rivers. IOP Conf. Ser. Earth Environ. Sci. 2019, 221. [Google Scholar] [CrossRef]
- Zaimes, G.N.; Iakovoglou, V. Assessing riparian areas of Greece—An overview. Sustainability 2021, 13, 309. [Google Scholar] [CrossRef]
- Chatzinikolaou, Y.; Ntemiri, K.; Zogaris, S. River riparian zone assessment using a rapid site-based index in Greece. Fresenius Environ. Bull. 2011, 20, 296–302. [Google Scholar]
- Walton, C.R.; Zak, D.; Audet, J.; Petersen, R.J.; Lange, J.; Oehmke, C.; Wichtmann, W.; Kreyling, J.; Grygoruk, M.; Jabłońska, E.; et al. Wetland Buffer zones for nitrogen and phosphorus retention: Impacts of soil type, hydrology and vegetation. Sci. Total Environ. 2020, 727, 138709. [Google Scholar] [CrossRef]
- Valkama, E.; Usva, K.; Saarinen, M.; Uusi-Kämppä, J. A meta-analysis on nitrogen retention by buffer zones. J. Environ. Qual. 2019, 48, 270–279. [Google Scholar] [CrossRef] [Green Version]
- Stutter, M.I.; Chardon, W.J.; Kronvang, B. Riparian Buffer strips as a multifunctional management tool in agricultural landscapes: Introduction. J. Environ. Qual. 2012, 41, 297–303. [Google Scholar] [CrossRef] [Green Version]
- Lind, L.; Hasselquist, E.M.; Laudon, H. Towards ecologically functional riparian zones: A meta-analysis to develop guidelines for protecting ecosystem functions and biodiversity in agricultural landscapes. J. Environ. Manag. 2019, 249, 109391. [Google Scholar] [CrossRef] [PubMed]
- Cole, L.J.; Stockan, J.; Helliwell, R. Managing riparian buffer strips to optimise ecosystem services: A review. Agric. Ecosyst. Environ. 2020, 296, 106891. [Google Scholar] [CrossRef]
- Broadmeadow, S.B.; Jones, J.G.; Langford, T.E.L.; Shaw, P.J.; Nisbet, T.R. The influence of riparian shade on lowland stream water temperatures in Southern England and their viability for brown trout. River Res. Appl. 2011, 27, 226–237. [Google Scholar] [CrossRef]
- Kalny, G.; Laaha, G.; Melcher, A.; Trimmel, H.; Weihs, P.; Rauch, H.P. The influence of riparian vegetation shading on water temperature during low flow conditions in a medium sized river. Knowl. Manag. Aquat. Ecosyst. 2017, 418, 5. [Google Scholar] [CrossRef] [Green Version]
- Hornbach, D.J.; Beckel, R.; Hustad, E.N.; McAdam, D.P.; Roen, I.M.; Wareham, A.J. The influence of riparian vegetation and season on stream metabolism of valley creek, minnesota. J. Freshw. Ecol. 2015, 30, 569–588. [Google Scholar] [CrossRef]
- Burrell, T.K.; O’Brien, J.M.; Graham, S.E.; Simon, K.S.; Harding, J.S.; McIntosh, A.R. Riparian shading mitigates stream eutrophication in agricultural catchments. Freshw. Sci. 2014, 33, 73–84. [Google Scholar] [CrossRef]
- Gasith, A.; Resh, V.H. Streams in mediterranean climate regions: Abiotic influences and biotic responses to predictable seasonal events. Annu. Rev. Ecol. Syst. 1999, 30, 51–81. [Google Scholar] [CrossRef] [Green Version]
- Bonada, N.; Resh, V.H. Mediterranean-climate streams and rivers: Geographically separated but ecologically comparable freshwater systems. Hydrobiologia 2013, 719, 1–29. [Google Scholar] [CrossRef] [Green Version]
- Hershkovitz, Y.; Gasith, A. Resistance, resilience, and community dynamics in mediterranean-climate streams. Hydrobiologia 2013, 719, 59–75. [Google Scholar] [CrossRef]
- Kumar, A.; Lakhera, K.; Vyas, V. Status of riparian zone of river narmada in the central zone using QBR index. Int. J. Adv. For. Sci. Manag. 2019, 3, 55–60. [Google Scholar] [CrossRef]
- Díaz-Pascacio, E.; Ortega-Argueta, A.; Castillo-Uzcanga, M.M.; Ramírez-Marcial, N. Influence of land use on the riparian zone condition along an urban-rural gradient on the sabinal river, Mexico. Bot. Sci. 2018, 96, 180–199. [Google Scholar] [CrossRef]
- Colwell, S.R.; Hix, D.M. Adaptation of the QBR index for use in riparian forests of central ohio. Chapter: Forest Biometrics and Modeling. In Proceedings of the 16th Central Hardwoods Forest Conference, West Lafayette, IN, USA, 8–9 April 2008; pp. 331–340. [Google Scholar]
- Valerio, C.; De Stefano, L.; Martínez-Muñoz, G.; Garrido, A. A machine learning model to assess the ecosystem response to water policy measures in the tagus river basin (Spain). Sci. Total Environ. 2021, 750, 141252. [Google Scholar] [CrossRef] [PubMed]
- Ferreira, J.; Pádua, J.; Hughes, S.J.; Cortes, R.M.; Varandas, S.; Holmes, N.; Raven, P. Adapting and adopting river habitat survey: Problems and solutions for fluvial hydromorphological assessment in Portugal. Limnetica 2011, 30, 263–272. [Google Scholar] [CrossRef]
- Blondel, J. The “Design” of mediterranean landscapes: A millennial story of humans and ecological systems during the historic period. Hum. Ecol. 2006, 34, 713–729. [Google Scholar] [CrossRef]
- New, T.; Xie, Z. Impacts of large dams on riparian vegetation: Applying global experience to the case of china’s three gorges dam. Biodivers. Conserv. 2008, 17, 3149–3163. [Google Scholar] [CrossRef]
- Zogaris, S.; Chatzinikolaou, Y.; Dimopoulos, P. Riparian woodland flora in upland rivers of western Greece. Mediterr. Mar. Sci. 2008, 9, 87. [Google Scholar] [CrossRef] [Green Version]
- Burdon, F.J.; Ramberg, E.; Sargac, J.; Forio, M.A.E.; de Saeyer, N.; Mutinova, P.T.; Moe, T.F.; Pavelescu, M.O.; Dinu, V.; Cazacu, C.; et al. Assessing the benefits of forested riparian zones: A qualitative index of riparian integrity is positively associated with ecological status in European streams. Water 2020, 12, 1178. [Google Scholar] [CrossRef] [Green Version]
- Grantham, T.E.; Figueroa, R.; Prat, N. Water management in mediterranean river basins: A comparison of management frameworks, physical impacts, and ecological responses. Hydrobiologia 2013, 719, 451–482. [Google Scholar] [CrossRef]
- Hughes, F.; Richards, K.; Girel, J.; Moss, T.; Muller, E.; Nilsson, C.; Rood, S. The Flooded Forest: Guidance for Policy Makers and River Managers in Europe on the Restoration of Floodplain Forests; Department of Geography, University of Cambridge: Cambridge, UK, 2003. [Google Scholar]
- Yon, D.; Tendron, G. Alluvial Forests of Europe; Council of Europe: Strasbourg, France, 1981; ISBN 9789287107046. [Google Scholar]
- Van de Bund, W. Water Framework Directive Intercalibration Technical Report. Part 1: Rivers; Office for Official Publications of the European Communities: Luxembourg, 2009. [Google Scholar]
- Lazaridou, M.; Ntislidou, C.; Karaouzas, I.; Skoulikidis, N. Harmonisation of a new assessment method for estimating the ecological quality status of greek running waters. Ecol. Indic. 2018, 84, 683–694. [Google Scholar] [CrossRef]
- Munné, A.; Prat, N.; Solà, C.; Bonada, N.; Rieradevall, M. A Simple field method for assessing the ecological quality of riparian habitat in rivers and streams: QBR index. Aquat. Conserv. Mar. Freshw. Ecosyst. 2003, 13, 147–163. [Google Scholar] [CrossRef]
- Raven, P.J.; Dawson, F.H.; Everard, M. Quality assessment using river habitat survey data. Aquaic Conserv. 1998, 499, 477–499. [Google Scholar] [CrossRef]
- Hammond, D.; Mant, J.; Holloway, J.; Elbourne, N.; Janer, M. Practical River Restoration Appraisal Guidance for Monitoring Options (PRAGMO); The River Restoration Centre: Cranfield, UK, 2011. [Google Scholar]
- Vaitis, M.; Feidas, H.; Symeonidis, P.; Kopsachilis, V.; Dalaperas, D.; Koukourouvli, N.; Simos, D.; Taskaris, S. Development of a spatial database and web-GIS for the climate of Greece. Earth Sci. Inform. 2019, 12, 97–115. [Google Scholar] [CrossRef]
- Ministry of Environment and Energy-Special Secretariat for Water (MEE-SSW). River Basin Management Plans: Approved River Basin Management Plans. Available online: http://wfdver.ypeka.gr/en/management-plans-en/approved-management-plans-en/ (accessed on 18 January 2021).
- Stefanidis, K.; Panagopoulos, Y.; Psomas, A.; Mimikou, M. Assessment of the natural flow regime in a mediterranean river impacted from irrigated agriculture. Sci. Total Environ. 2016, 573, 1492–1502. [Google Scholar] [CrossRef] [PubMed]
- Wiatkowski, M.; Tomczyk, P. Comparative Assessment of the hydromorphological status of the rivers odra, bystrzyca, and ślȩza using the RHS, LAWA, QBR, and HEM methods above and below the hydropower plants. Water 2018, 10, 855. [Google Scholar] [CrossRef] [Green Version]
- Environment Agency. River Habitat Survey in Britain and Ireland—Field Survey Guidance Manual: 2003 Version; Environment Agency: Bristol, UK, 2003. [Google Scholar]
- Ourloglou, O.; Stefanidis, K.; Dimitriou, E. Assessing nature-based and classical engineering solutions for flood-risk reduction in urban streams. J. Ecol. Eng. 2020, 21, 46–56. [Google Scholar] [CrossRef]
- Dimitriou, E.; Stavroulaki, E. Assessment of riverine morphology and habitat regime using unmanned aerial vehicles in a mediterranean environment. Pure Appl. Geophys. 2018, 175, 3247–3261. [Google Scholar] [CrossRef]
- European Union; Copernicus Land Monitoring Service 2020; European Environment Agency (EEA) CORINE Land Cover 2018. Available online: https://land.copernicus.eu/pan-european/corine-land-cover/clc2018 (accessed on 21 April 2020).
- European Environment Agency (EEA). Water and Agriculture: Towards Sustainable Solutions; Publications Office of the European Union: Copenhagen, Denmark, 2020. [Google Scholar]
- Kazoglou, Y.; Fotiadis, G.; Koutseri, I.; Vrahnakis, M. Assessment of structural components of riparian forest vegetation of the prespa basin with the means of the QBR index. In Proceedings of the BALWOIS Conference on Water Observation and Information System for Decision Support, Ohrid, Fyrom, 25–29 May 2010; pp. 1–8. [Google Scholar]


| Riparian Habitat Quality Level | QBR |
|---|---|
| Riparian habitat in natural condition | ≥95 |
| Some disturbance, good quality | 75–90 |
| Disturbance important, fair quality | 55–70 |
| Strong alteration, bad quality | 30–50 |
| Extreme degradation, very bad quality | ≤25 |
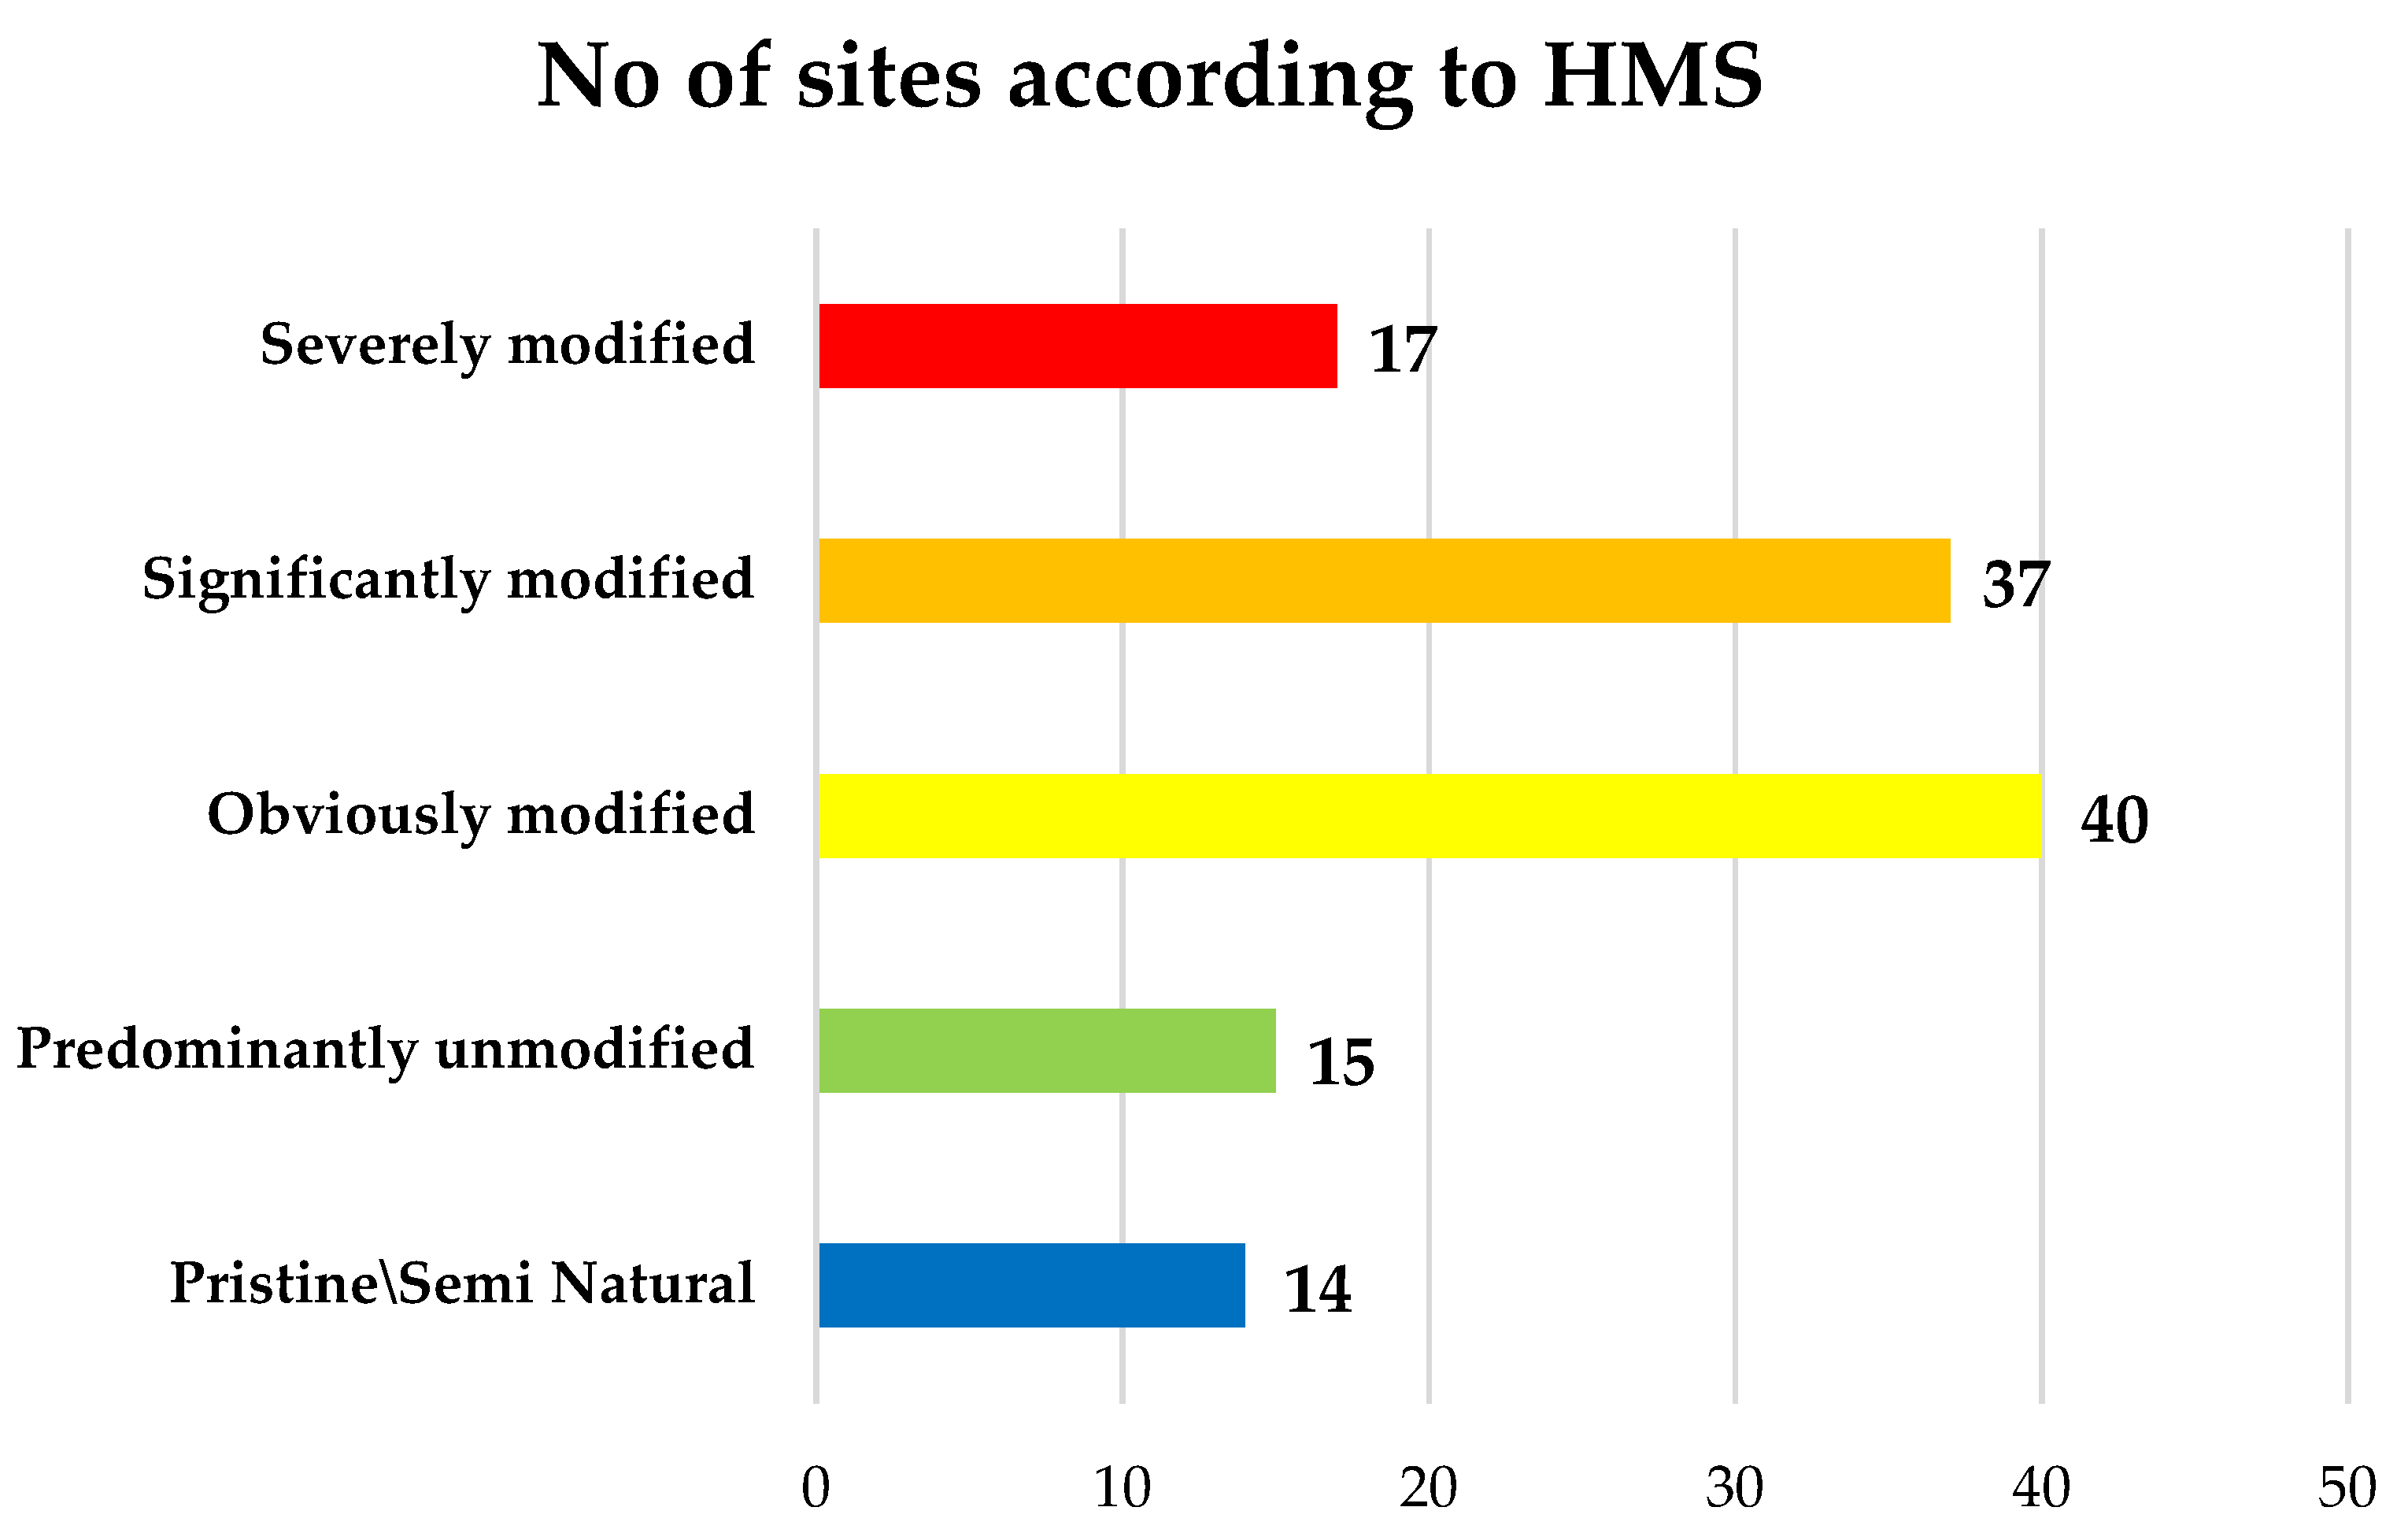
| Habitat Modification Score | Ecological Quality Classes | Description |
|---|---|---|
| 0–16 | High | Pristine/Semi natural |
| 17–199 | Good | Predominantly unmodified |
| 200–499 | Moderate | Obviously modified |
| 500–1399 | Poor | Significantly modified |
| >1400 | Bad | Severely modified |
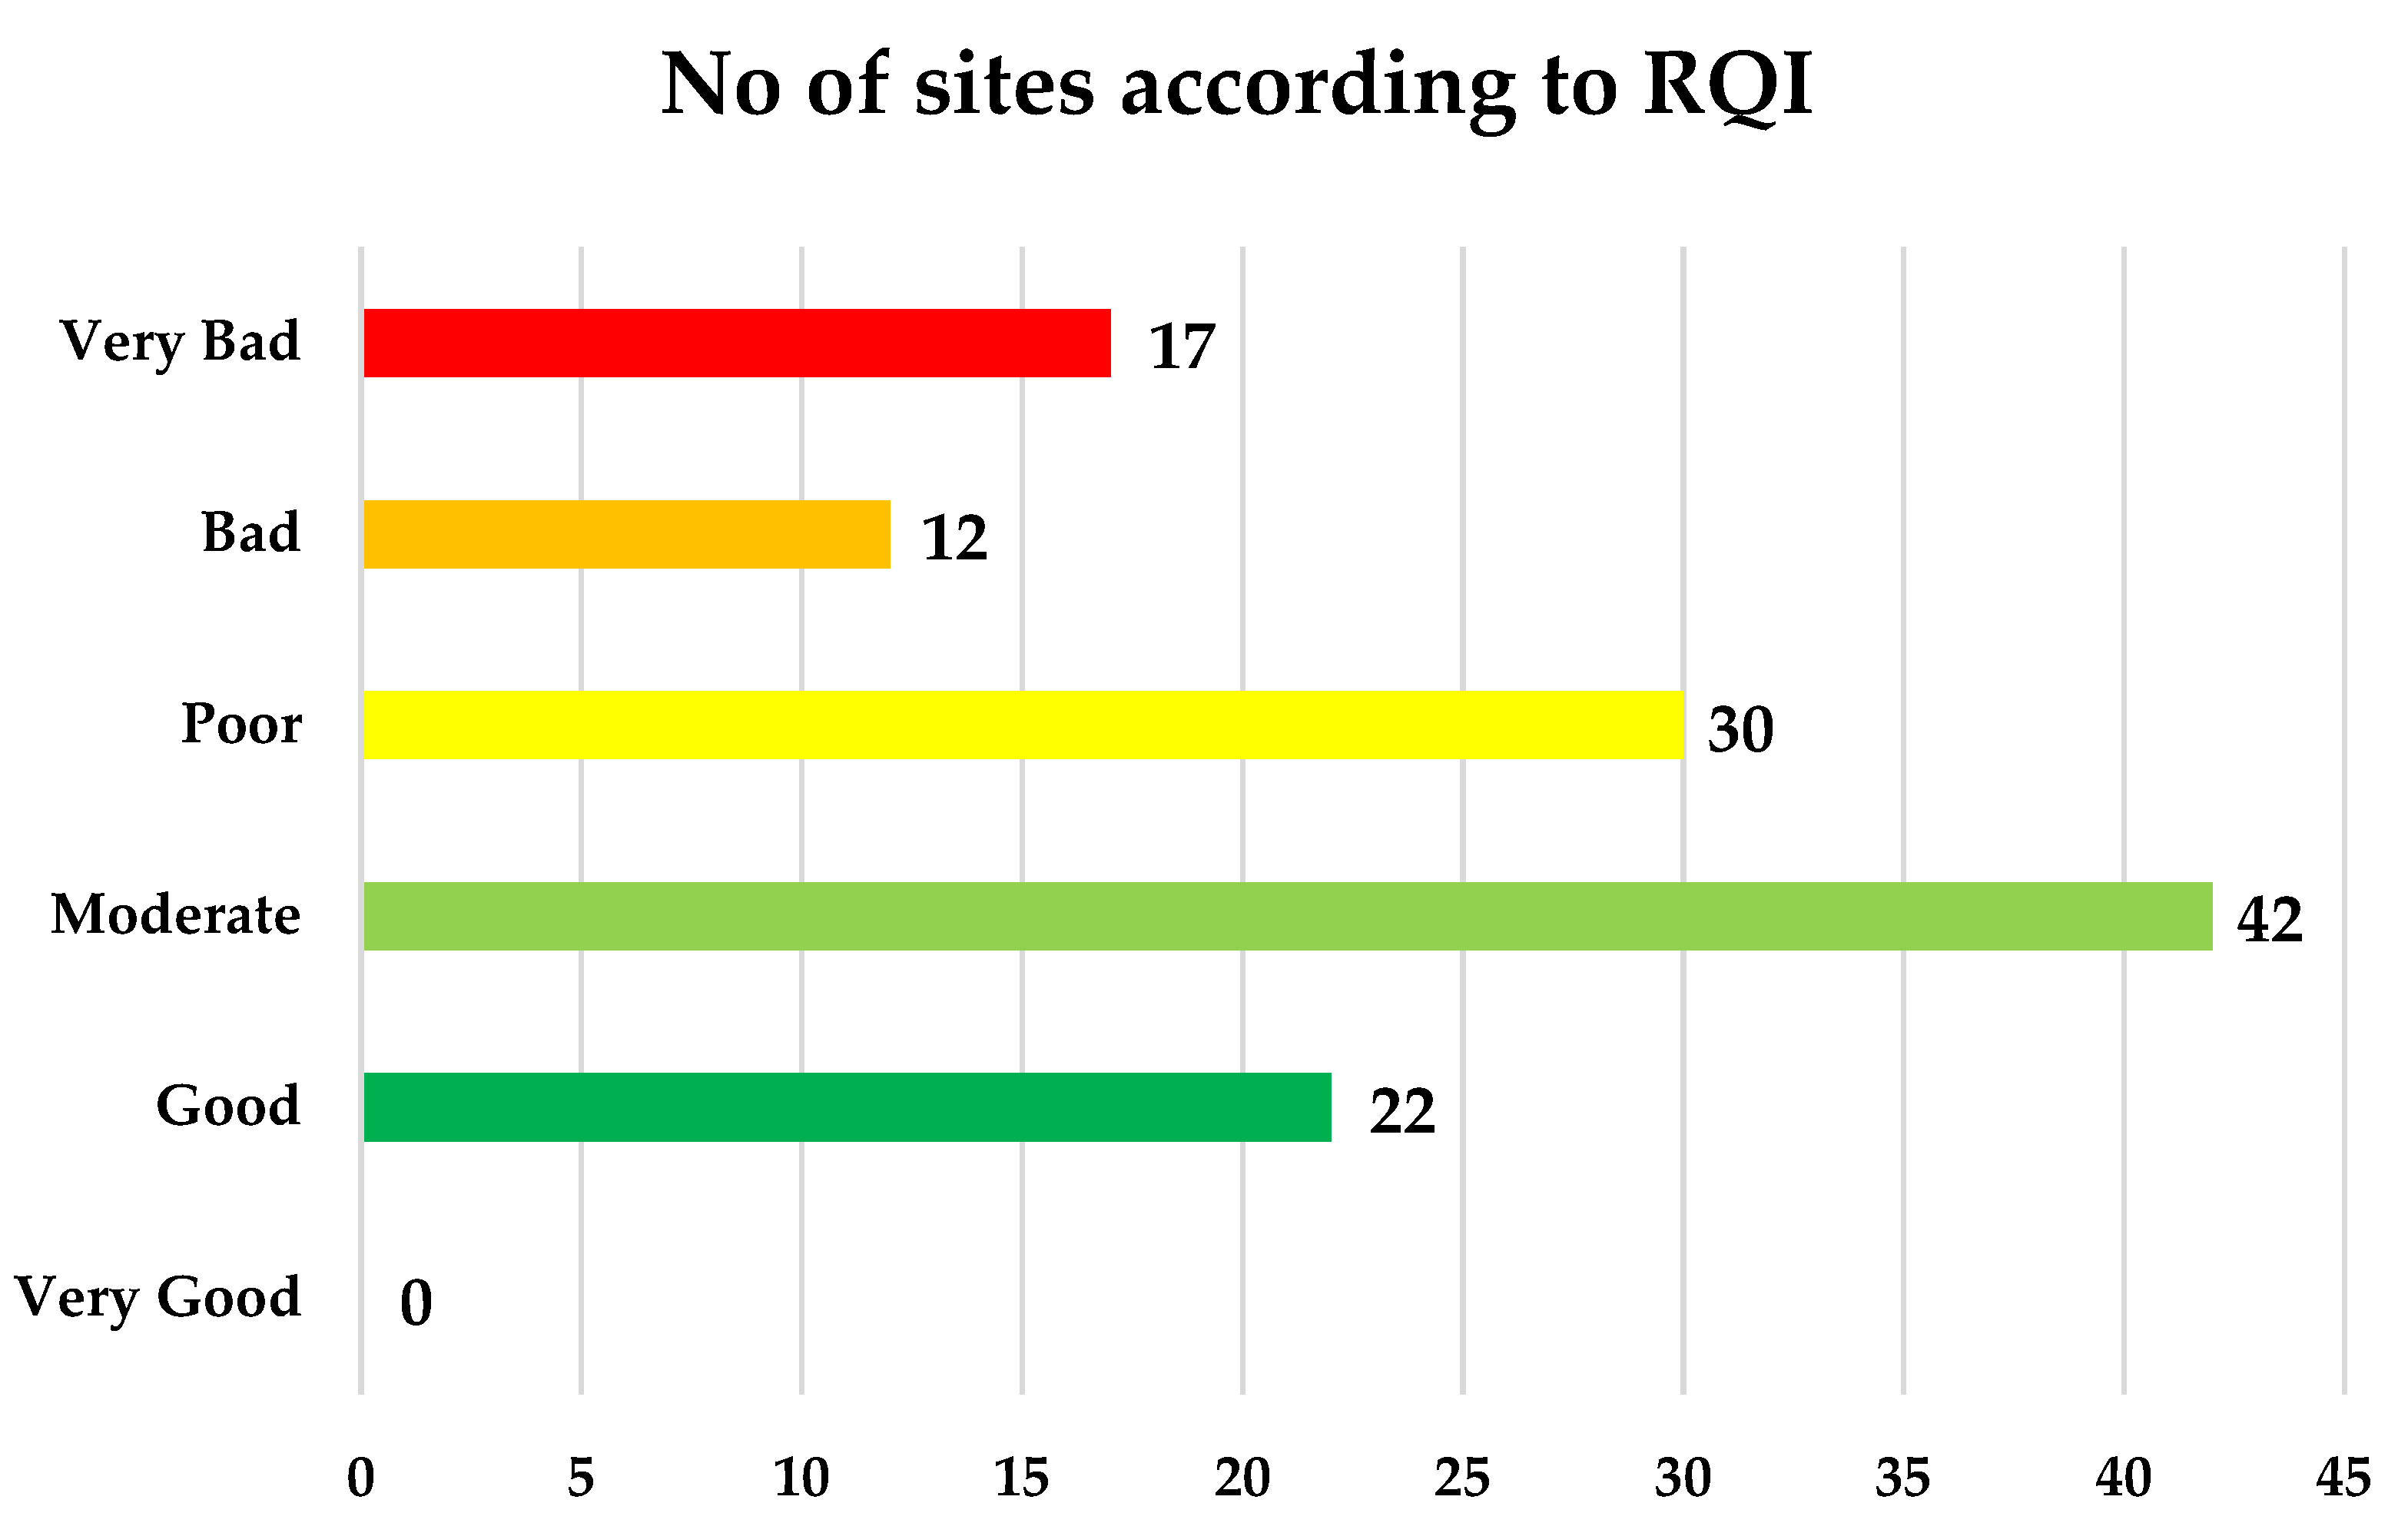
| RQI Scores | Riparian Status | Description |
|---|---|---|
| 150–130 | Very good | Attributes in natural conditions without threats in their functioning |
| 129–100 | Good | Attributes in good or very good conditions and one or two can be altered |
| 99–70 | Moderate | Several attributes are moderately altered |
| 69–40 | Poor | Most attributes are moderately altered |
| 39–10 | Bad | Several attributes are poorly altered |
| <10 | Very bad | Most of the attributes are poorly altered |
| Water Districts | Sites | Mediterranean River Types | RHS\HMS | RQI | QBR | Near Natural (%) | Artificial (%) | Urban (%) | Agriculture (%) |
|---|---|---|---|---|---|---|---|---|---|
| GR(01) | 5 | RM1:2 RM2:2 RM3:1 | 120–598 | 88–117 | 0–70 | 48.38–68.43 | 1.42–5.05 | 0–1.03 | 27.02–47.1 |
| GR(02) | 4 | RM1:1 RM2:2 RM5:1 | 1380–4810 | 20–81 | 0–50 | 19.61–78.14 | 0–1.55 | 0–1.55 | 21.02–78.84 |
| GR(03) | 9 | RM2:2 RM3:1 RM4:1 RM5:5 | 0–530 | 42–110 | 25–95 | 55.39–88.09 | 0–2.05 | 0–1.3 | 3.54–44.03 |
| GR(04) | 13 | RM1:1 RM2:2 RM3:2 RM4:7 RM5:1 | 0–1120 | 32–100 | 30–100 | 66.77–96.65 | 0–5.7 | 0–5.31 | 2.81–21.04 |
| GR(05) | 17 | RM1:5 RM2:7 RM3:2 RM4:2 RM5:1 | 0–7450 | 16–116 | 5–100 | 10.2–100 | 0–10.25 | 0–7.65 | 0–87.3 |
| GR(06) | 5 | RM1:4 RM5:1 | 60–740 | 39–80 | 30–100 | 39.07–71.85 | 10.36–46.23 | 9.5–38.2 | 3.02–17.84 |
| GR(07) | 8 | RM1:1 RM2:4 RM5:3 | 60–3660 | 54–100 | 20–90 | 27.32–83.69 | 0–6.48 | 0–5.77 | 15.97–69.82 |
| GR(08) | 15 | RM1:1 RM2:3 RM3:4 RM4:3 RM5:2 VL:2 | 0–3700 | 8–114 | 10–95 | 17.61–98.06 | 0–5.07 | 0–5.07 | 1.93–77.33 |
| GR(09) | 20 | RM1:1 RM2:7 RM3:5 RM4:2 RM5:3 VL:2 | 0–2105 | 0–119 | 10–95 | 27.23–82.47 | 0.63–12.43 | 0.63–3.46 | 15.17–71.09 |
| GR(10) | 17 | RM1:3 RM2:7 RM3:1 RM5:1 VL:5 | 0–855 | 0–93 | 15–90 | 3.56–98.63 | 0–5.51 | 0–5.3 | 0.7–94.16 |
| GR(11) | 10 | RM2:4 RM3:2 VL:4 | 120–1570 | 0–104 | 10–70 | 31.5–78.76 | 1.08–4.74 | 0–4.23 | 17.81–61.49 |
| HMS | Altitude | % Near Natural LUs | % Artificial LUs | % Agriculture LUs | RQI | QBR | Urban | |
|---|---|---|---|---|---|---|---|---|
| Min | 0 | 0 | 0 | 0 | 0 | 0 | 0 | 0 |
| 25th Percentile | 200 | 39.37 | 42.49 | 0.813 | 15.35 | 40 | 35 | 0.465 |
| Median | 730.18 | 166.7 | 56.20 | 3.54 | 39.69 | 69.30 | 52.86 | 4.18 |
| 75th Percentile | 755 | 366 | 79.04 | 3.62 | 51.08 | 92 | 80 | 2.52 |
| Max | 7450 | 936.03 | 100 | 87.74 | 100 | 120 | 100 | 4.43 |
| HMS | Altitude | % Near Natural LUs | % Artificial LUs | % Agriculture LUs | RQI | |
|---|---|---|---|---|---|---|
| Altitude | −0.073 | 1 | ||||
| % Near Natural LUs | −0.116 | 0.439 ** | 1 | |||
| %Artificial LUs | 0.109 | −0.109 | −0.575 ** | 1 | ||
| % Agriculture LUs | 0.103 | −0.515** | −0.934 ** | 0.392 ** | 1 | |
| RQI | −0.196 ** | 0.129 | 0.219 * | −0.165 | −0.179 | 1 |
| QBR | −0.507 ** | 0.491 ** | 0.369 ** | −0.164 | −0.422 ** | 0.274 ** |
Publisher’s Note: MDPI stays neutral with regard to jurisdictional claims in published maps and institutional affiliations. |
© 2021 by the authors. Licensee MDPI, Basel, Switzerland. This article is an open access article distributed under the terms and conditions of the Creative Commons Attribution (CC BY) license (http://creativecommons.org/licenses/by/4.0/).
Share and Cite
Latsiou, A.; Kouvarda, T.; Stefanidis, K.; Papaioannou, G.; Gritzalis, K.; Dimitriou, E. Pressures and Status of the Riparian Vegetation in Greek Rivers: Overview and Preliminary Assessment. Hydrology 2021, 8, 55. https://0-doi-org.brum.beds.ac.uk/10.3390/hydrology8010055
Latsiou A, Kouvarda T, Stefanidis K, Papaioannou G, Gritzalis K, Dimitriou E. Pressures and Status of the Riparian Vegetation in Greek Rivers: Overview and Preliminary Assessment. Hydrology. 2021; 8(1):55. https://0-doi-org.brum.beds.ac.uk/10.3390/hydrology8010055
Chicago/Turabian StyleLatsiou, Anna, Theodora Kouvarda, Konstantinos Stefanidis, George Papaioannou, Konstantinos Gritzalis, and Elias Dimitriou. 2021. "Pressures and Status of the Riparian Vegetation in Greek Rivers: Overview and Preliminary Assessment" Hydrology 8, no. 1: 55. https://0-doi-org.brum.beds.ac.uk/10.3390/hydrology8010055