
Evaluating the Performance of Water Quality Indices: Application in Surface Water of Lake Union, Washington State-USA


Laboratory of Geoenvironmental Science and Environmental Quality Assurance, Department of Civil Engineering, University of West Attica, 250 Thivon & P. Ralli Str., 12241 Athens, Greece
*
Author to whom correspondence should be addressed.
Hydrology 2022, 9(7), 116; https://0-doi-org.brum.beds.ac.uk/10.3390/hydrology9070116
Submission received: 27 May 2022
/
Revised: 16 June 2022
/
Accepted: 24 June 2022
/
Published: 27 June 2022
Abstract
:Water quality indices (WQIs) are practical and versatile instruments for assessing, organizing, and disseminating information about the overall quality status of surface water bodies. The use of these indices may be beneficial in evaluating aquatic system water quality. The CCME (Canadian Council of Ministers of the Environment) and NSF (National Science Foundation) WQIs were used for the assessment of surface water (depth = 1 m) in Lake Union, Washington State. These WQIs were used in surface water at Lake Union, Seattle. The modified versions of the applied WQIs incorporate a varied number of the investigated parameters. The two WQIs were implemented utilizing specialized, publicly accessible software tools. A comparison of their performance is offered, along with a qualitative assessment of their appropriateness for describing the quality of a surface water body. Practical conclusions were generated and addressed based on the applicability and disadvantages of the evaluated indexes. When compared to the CCME-WQI, it is found that the NSF-WQI is a more robust index that yields a categorization stricter than CCME-WQI.
1. Introduction
Safe, clean and sufficient freshwater is essential for human life and the survival of other living organisms in the environment [1]. The deterioration of water quality has become a global problem due to its inherent ability to produce significant adjustments to the hydrological cycle [1]. Complex and diversified water quality challenges need urgent worldwide attention and response. Intensive anthropogenic activities and rapid economic growth have added to the pressure on the environment and ecosystems, resulting in soil and water resource degradation, severely limiting sustainability [2,3,4,5,6]. The presence of chemical compounds is the cause of pollution in both groundwater and surface water [7,8,9,10,11,12]. These chemical substances significantly impact whether or not the water is suitable for human consumption and purposes in industry and agriculture. Even while many researchers, including scientists and engineers, have conducted exhaustive studies on a wide range of themes concerning water pollution, it is abundantly evident that there is a dearth of mature and scientifically sound techniques in several areas [13,14,15]. Horton pioneered mathematical algorithms to estimate river water quality levels as early as 1965 [16].The combined influence of many driving forces that control water quality and the difficulties in identifying the significant parameters used to quantify the chemical status of water resources are complicated to comprehend [17]. As a result, the water quality index (WQI) is regarded as a mathematical tool that considerably reduces the complexity of water quality datasets while providing a single categorizing value that defines the water quality status of water bodies or the degree of pollution [18].
Following Horton’s proposed WQI method, numerous organisations and laboratories developed several WQI methods for various purposes, including the National Sanitation Foundation WQI (NSF-WQI) [19], Scottish Research Development Department (SRDD) [20], River Status Index (RSI) [21], Canadian Council of Ministers of the Environment WQI (CCME-WQI) [22], Bhargava Method WQI (BM-WQI) [23], Overall Indicator Overall Index of Pollution (OIP) [24], British Columbia Water Quality Index (BC-WQI) [25], Oregon WQI (O-WQI) [26] and Malaysia WQI (M-WQI) [27].
WQI is a single dimensionless number that summarises the overall water quality state by aggregating data for selected parameters such as nitrates, dissolved oxygen (DO), electrical conductivity (CND) and trace elements [17]. Recording a single value or score that is generally recognised as expressing the water quality of a lake in terms of a water quality index is one of the themes discussed in this study. The WQI was developed to become a valuable and persuasive instrument for managing water quality and the sustainable development of water resources [13,19]. WQIs are methodologies or tools that combine a list of water quality parameters and their objective values measured in a water sample into a single value (score) that, after comparison with known ranges of the corresponding objective value, would facilitate the evaluation of the water quality status of the water body and classify it in terms of water quality [9,28]. The significant advantage of using water quality indices is the simplicity they provide by combining a vast number of quality data into a single value and by giving a comprehensible description of quality [19,22,28]. This is the main benefit of using water quality indices. A WQI is an effective and practical instrument representing the water quality at a monitoring station. Numerous scholars from all around the globe have acknowledged the significance of using WQIs to assess the quality state of water bodies in their respective regions [9,17,19,28,29,30]. WQIs have also been successfully applied to provide a holistic assessment of the current status, reliability and purpose of the Russian water quality monitoring program [31]. Kouadri et al. [32] applied artificial intelligence algorithms to predict WQI in the groundwater collected from the Illizi region (Algeria), including locally weighted linear regression, additive regression, multilinear regression, random forest, random subspace, artificial neural network and support vector regression. Deng et al. [33] have successfully applied two different machine-learning methods (artificial neural networks and a support vector machine) to accurately predict algal growth and eutrophication in Tolo Harbour (Hong Kong). Hadjisolomou et al. [34] have applied an artificial neural network to model the chlorophyll-a levels of a shallow eutrophic lake (Mikri Prespa, Greece), which is a crucial parameter for estimating CCME-WQI.
The scientific topic of water quality covers much ground and has many implications. One of the most significant outcomes of increased agricultural production, industrial production, domestic population and other shifts in land use is a general deterioration in water quality. Protecting water quality, determining the extent of groundwater and surface water pollution, and developing effective management strategies require meticulous and well-organized water resource planning.
The main difficulties in evaluating the performance of WQIs in surface water bodies worldwide are the lack of the appropriate dataset and the many options for selecting the different sets of indicators and objective values. The strength of this study mainly includes the following aspects: (a) the analysis of four versions of the WQIs, considering a different set of indicators, and (b) the suggestion of the most rigorous, from our point of view, option for calculating the WQI.
The primary goals of this investigation are: (a) to analyse the water quality of a mesotrophic lake located in the state of Washington using water quality indices that have been recorded monthly for a period of two years, and (b) to assess the performance of WQIs in the lake studied. The ultimate aim is to examine many existing WQIs and provide recommendations about which should be selected and how those WQIs should be modified to assess aquatic systems.
2. Materials and Methods
2.1. Area Studied
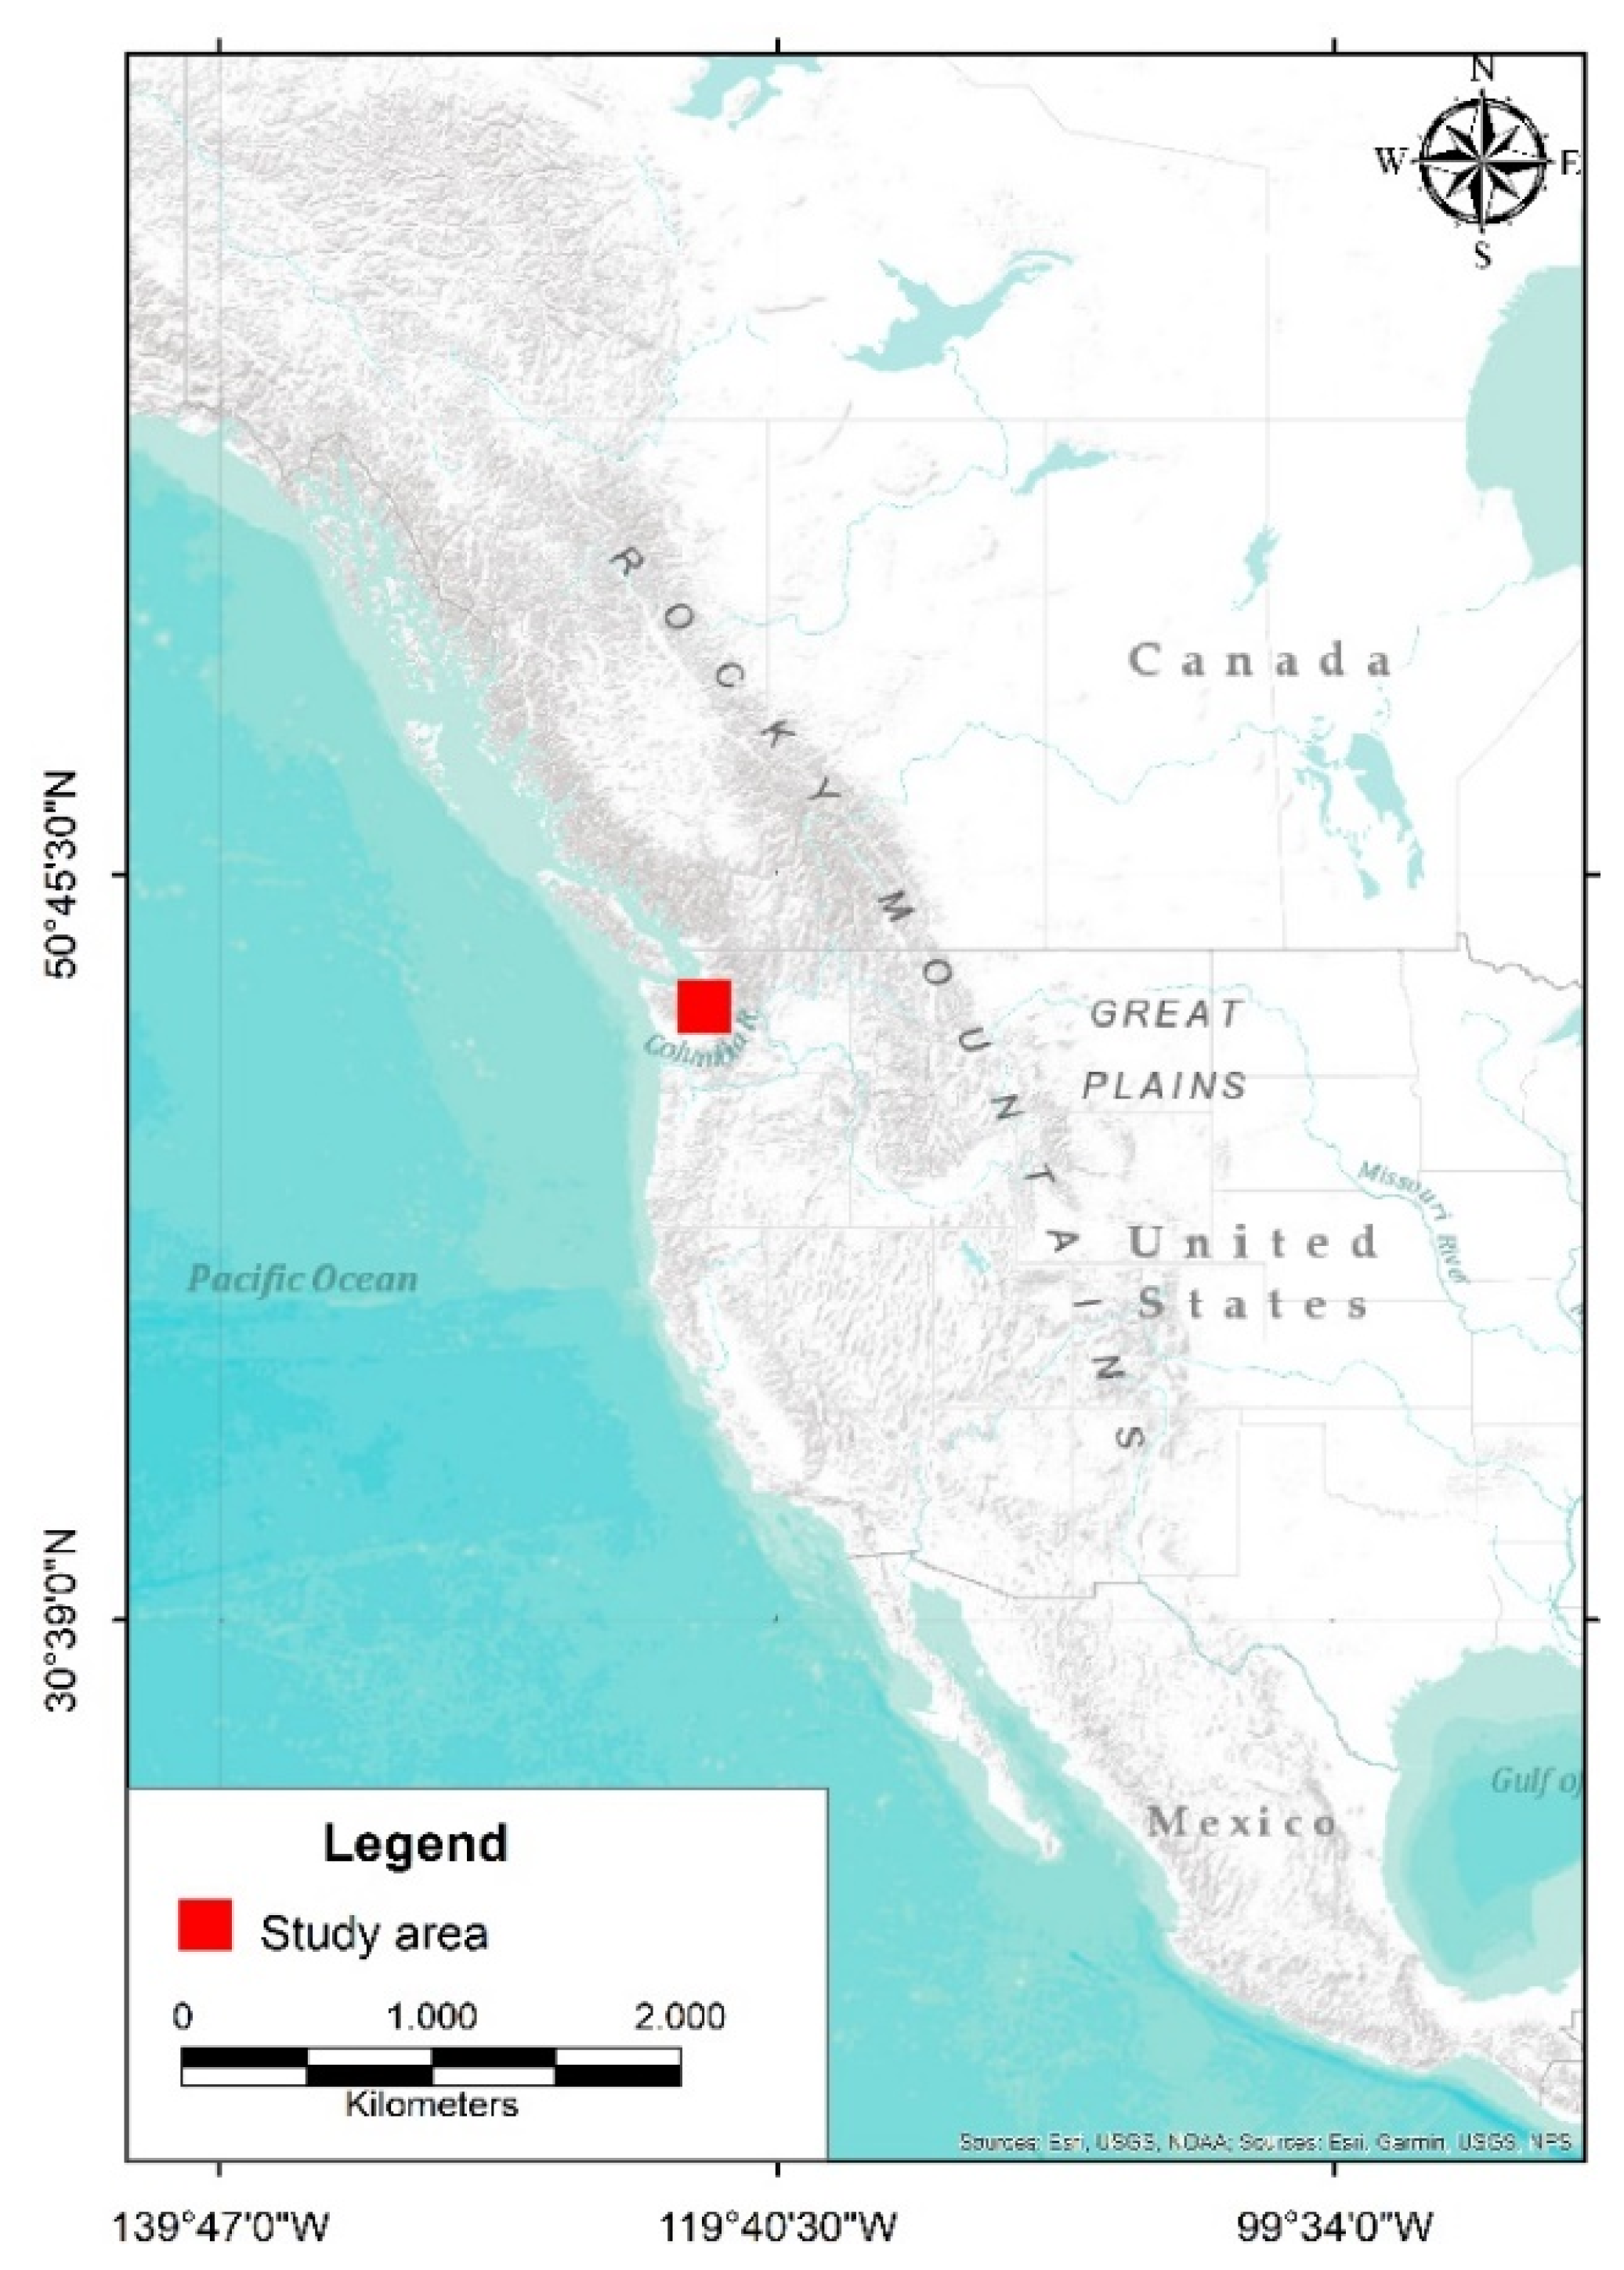
Lake Union is situated in Washington State, United States of America (Figure 1). Its surface area is 2.3 km2, and its depth varies between 10 and 15 m. According to King County, Lake Union can be characterized as a mesotrophic ecosystem [35].
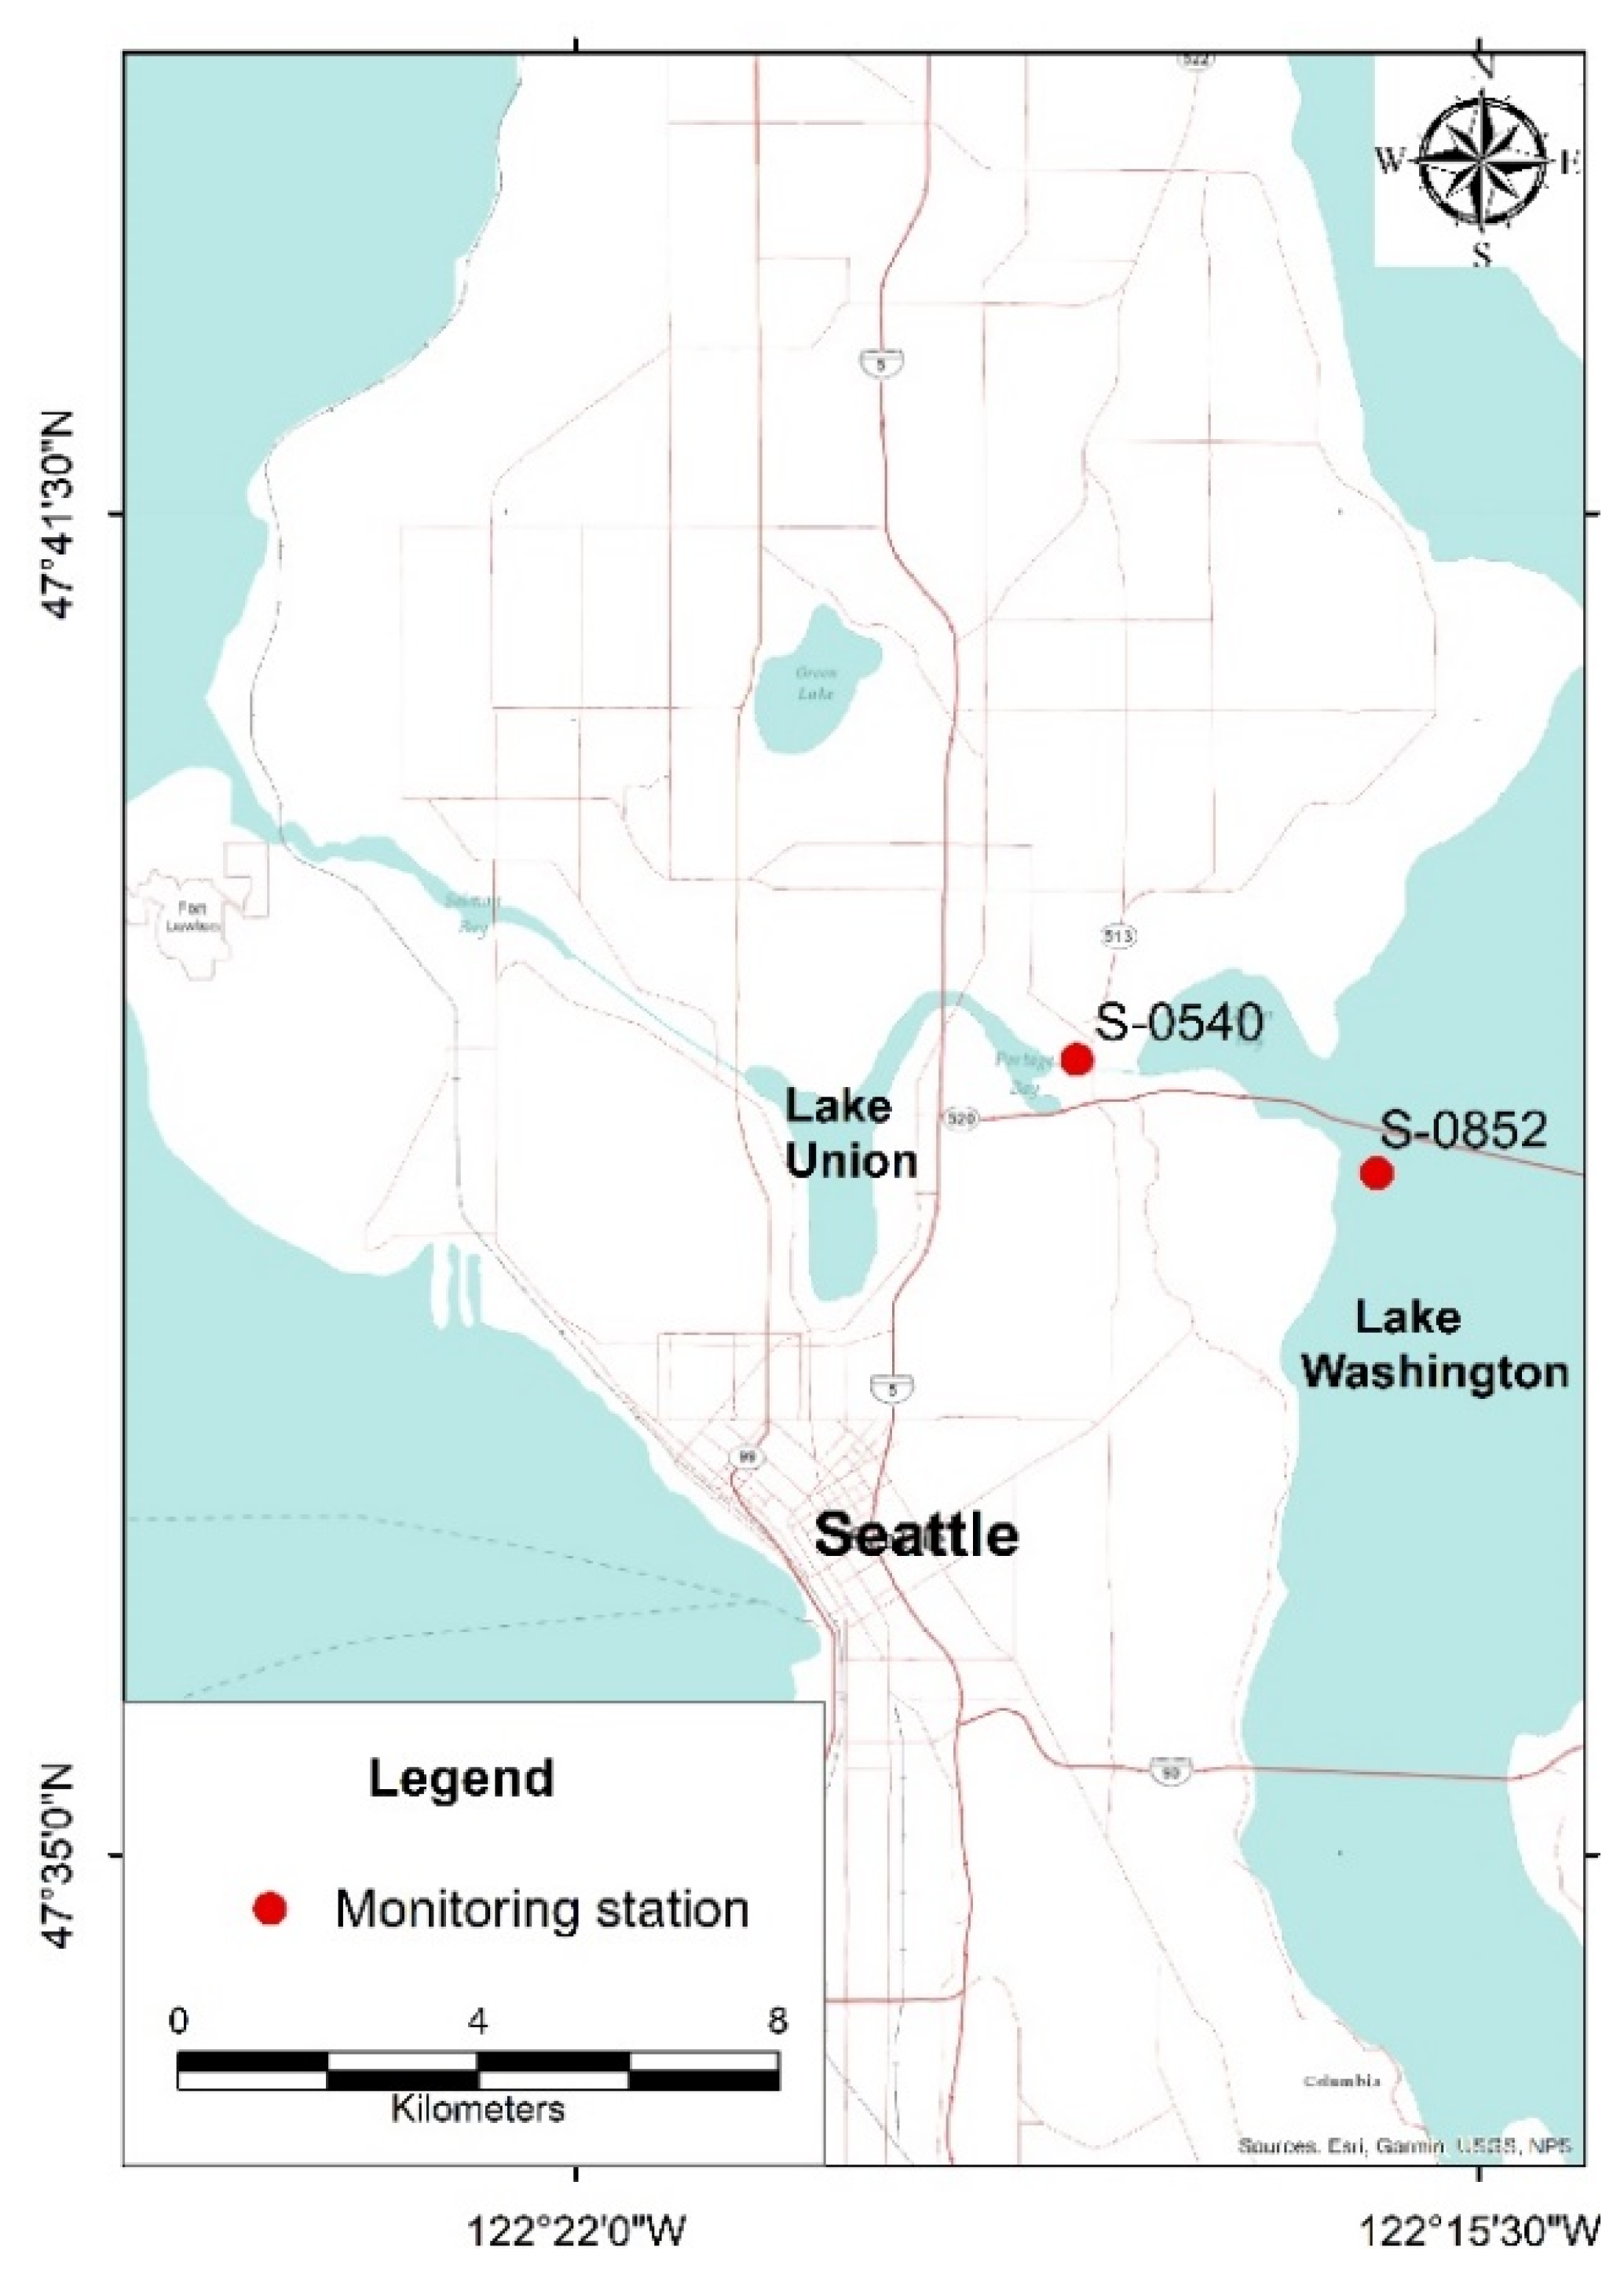
The main outlet of Lake Union is Hiram Chittenden Locks, while its main inflow is Lake Washington ship canal (Figure 2) [36]. Glacial and glaciofluvial scouring and deposition, tectonic folding and faulting, flooding by volcanic mudflow deposits, current processes such as land sliding and stream erosion, and considerable human alteration have shaped today’s terrain in the study area [37]. Throughout the Quaternary period (2.4 million years), glaciers retreated southward from British Columbia into the Seattle region on many occasions [37]. Seattle’s surficial deposits may be broken down into the following categories: postglacial deposits, late-glacial deposits, Vashon glacial deposits, pre-Vashon deposits and bedrock. More than half of these deposits (49%) are fine-grained, 19% are intermediate or interbedded, and 32% are coarse-grained deposits [37].
Lake Union is the most heavily urbanized and the smallest of King County’s three major lakes. A significant part of the catchment area has been used mainly for residential, commercial and industrial purposes. A major part of the shoreline of Lake Union, across the lake perimeter, has been used for commercial docks, marinas, houseboat moorage, industries and dry docks. Seismic seiching is a recurrent phenomenon in the catchment area of Lake Union [38]. Lake Union is susceptible to water waves produced by earthquakes; for example, the 1964 Alaska earthquake caused severe damage to houseboats on Lake Union [38]. It is Y-shaped in plain view and is not adequately approximated by a conventional geometrical shape. Lake Union is a shallow basin with an average depth of 10 m [38].
2.2. Primary Data and Data Analysis
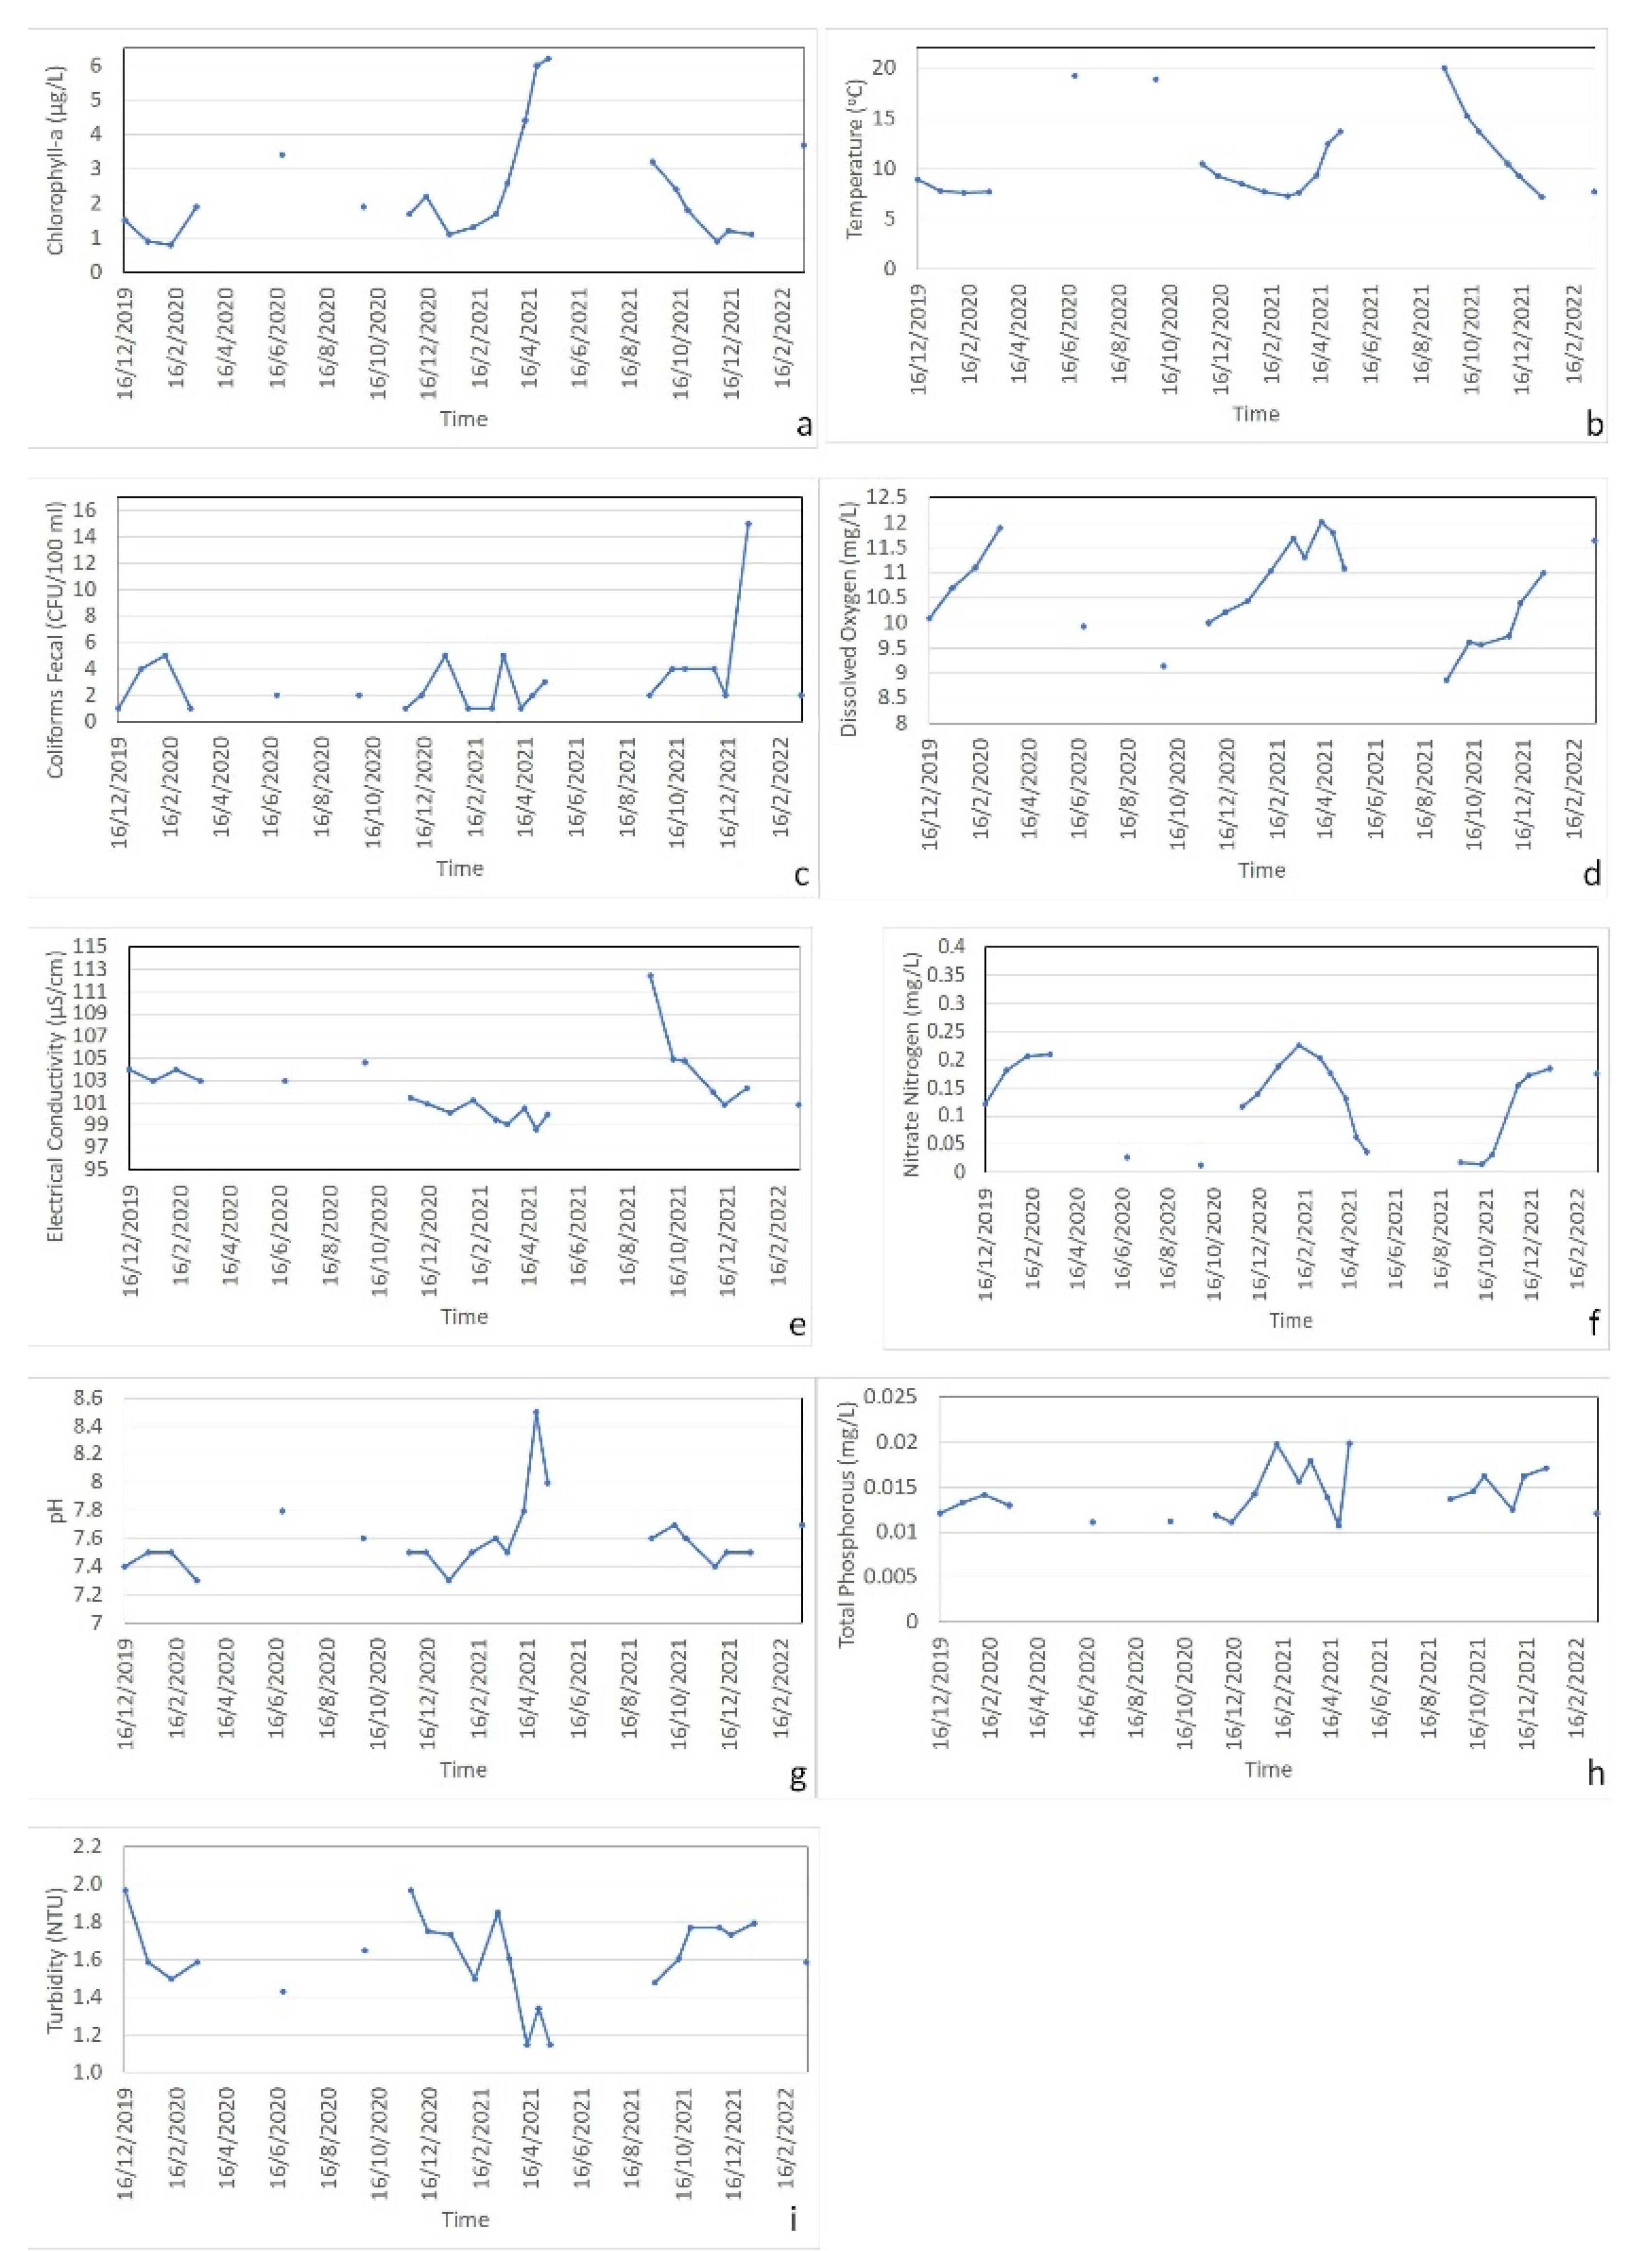
A database was expanded using all the available information from December 2019 through March 2022 through data collection derived from the database of King County [35,36]. The primary data applied in this study were assembled by King County, U.S.A. [36]. Chlorophyll-a (Chl-a), temperature, faecal coliforms, dissolved oxygen (DO), electrical conductivity (CND), nitrate-nitrogen (N-NO3), pH, total phosphorous (TP) and transparency (Secchi disk depth) were all included in the accessible dataset (Figure 3).
Water samples were collected once a month from December to February and from March to November twice a month. The S-0540 monitoring station located in Lake Union was used to gather samples (Figure 2). Water samples were collected from 1 m below the lake’s surface to just above the lake bottom at the S-0540 monitoring station (latitude: 47°38′51.04″ N, longitude: 122°18′18.69″ W), which is located west of Montlake Bridge in Montlake Cut (Figure 2). Chlorophyll-a was measured using the fluorometric method (SM10000-chlorophyll-H3) [25]. Faecal coliforms were determined according to SM9222D 20th ed. [23]. The NO3-N was determined according to the automated cadmium reduction method (SM4500-NO3-F) [25]. The TP was measured applying the automated ascorbic acid method (SM4500-P F) [25]. Several gaps in the data series of chemical and physical parameters were identified (Figure 3).
For data processing, the software programs Microsoft® Excel (Redmond, Washington, DC, USA) and IBM® SPSS v.28 (International Business Machines Corporation; Statistical Product and Service Solutions; Armonk, NY, USA) for Windows were used. The Pearson correlation coefficient (r) and p-values of the variables under consideration were calculated.
2.3. WQI Implementation
The WQI’s key benefit is merging a large amount of water quality data into a single value, which aids in the rigorous and speedy assessment of water resources. The water quality of Lake Union was evaluated using the Canadian Council of Ministers of Environment WQI (CCME-WQI) [22] and National Sanitation Foundation WQI (NSF-WQI) [17,19]. The CCME-WQI is calculated by combining suitable water quality criteria into a single number ranging from 0 to 100, with 100 representing “excellent” quality [22]. The CCME-WQI score is calculated using a freely available software code developed by CCME. The NSF-WQI is computed as a weighted average by selecting relevant water quality metrics and giving weights to those values. Its score goes from 0 to 100, with 100 representing the highest possible score. All the objective values are provided by CCME [22], except for turbidity, which is suggested by World Health Organisation (WHO) [39], and electrical conductivity and nitrate-nitrogen, which are given by Council Directive 98/83/EC (Table 1). Depending on the result, the NSF-WQI categorizes water bodies into five categories: excellent, good, medium, bad, and extremely bad [19]. Compared to the CCME-WQI, the NSF-WQI requires additional computations and conversions. The temperature change was estimated using the S-0852 monitoring station in Lake Washington as the reference value. This is because the monitoring station S-0852 (latitude: 47°38′09.55″ N, longitude: 122°16′03.21″ W) is the closest to the monitoring station S-0540 located in Lake Washington, the main inflow system for Lake Union (Figure 2). Equation (1) proposed by the State of Utah Division of Water Quality was applied to calculate turbidity from Secchi disk depth [40]:
Secchi disk depth = 244.13 (Turbidity)−0.662
This study applies two modified versions of two widely WQIs (CCME-WQI and NSF-WQI). The modified versions of the applied WQIs include a different number of the examined parameters as well as the selected objective values. The parameters chosen for the classification of lake water quality used in this study are listed in Table 1. The subscripts [6,7,8] indicate the number of selected parameters for the calculation of each WQI (Table 1). The NSF6-WQI and CCME6-WQI are designed to include precisely the same parameters available in this study. The selection of the same parameters for calculating NSF6-WQI and CCME6-WQI facilitates the discussion of the outcomes derived from these WQIs. On the other hand, the NSF7-WQI and CCME8-WQI are designed to use all the available datasets for this study. There were several gaps in the dataset of this study.
The classes and ratings of CCME-WQI and NSF-WQI applied in this study are tabulated in Table 2.
3. Results and Discussion
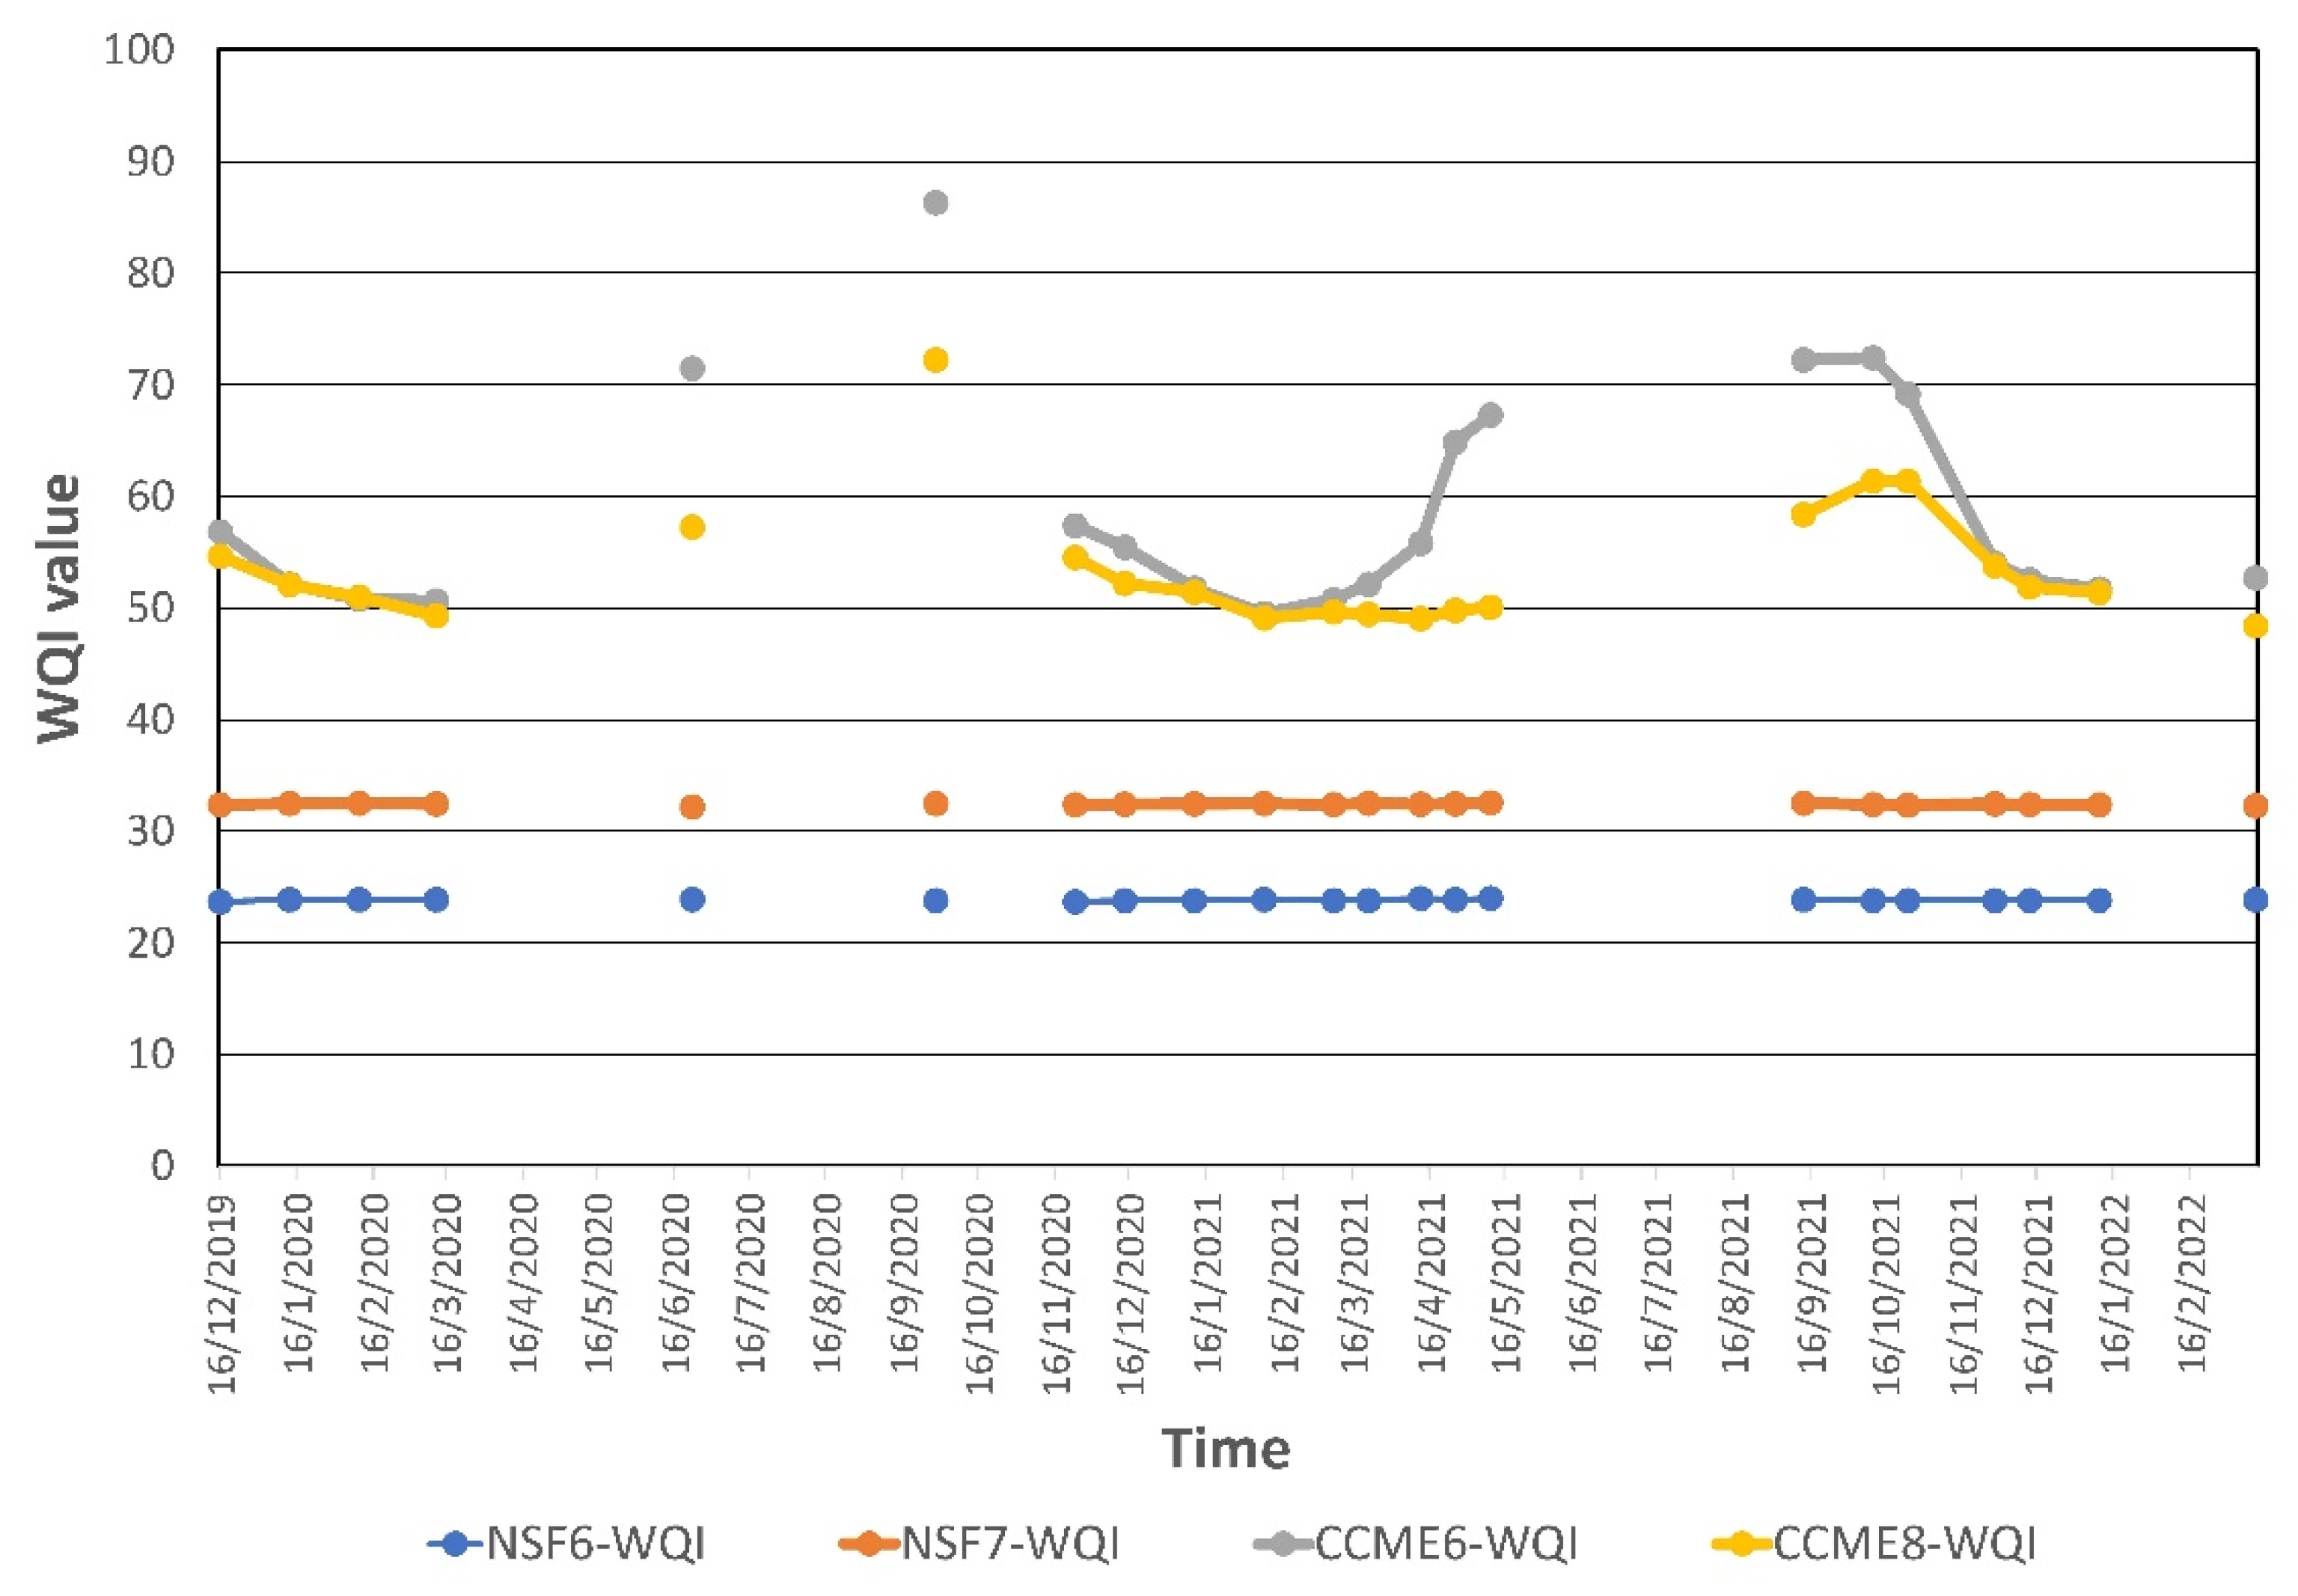
Figure 4 displays the interannual variation in CCME-WQI and NSF-WQI values for the surface water of Lake Union. The NSF6-WQI and NSF7-WQI values recorded in the surface water of Lake Union are noticeably lower than the CCME6-WQI and CCME8-WQI values at each monitoring period (Figure 4). The NSF6-WQI and NSF7-WQI values are constantly lower than the CCME6-WQI and CCME8-WQI values, which can be attributed to the change in temperature for the calculation of NSF-WQI, suggesting that the temperature is a critical parameter for its estimation (Figure 4). These differences between the results obtained from NSF-WQI and CCME-WQI are explained by discussing further the dissimilarities of these WQIs. According to Brown et al. [19] NSF-WQI is classified as a “conventional” WQI since it examines water quality for general usage without focusing on any one type of water consumption. The NSF-WQI is produced as the weighted arithmetic mean of the individual sub-index values for each of the listed parameters. Weightages assigned to quality measures, as in other weighted WQI techniques, highlight the relative relevance of the latter to overall water quality. The CCME-WQI analyses aquatic-life water quality conditions by including three elements [22]: (a) scope, (b) frequency, and (c) amplitude. Each of the aforementioned indicators is displayed on a percentage scale and reflects: (a) the number of parameters that do not satisfy water quality standards; (b) the frequency with which these objectives are not reached; and (c) the proportion by which the objectives are not met. The selection of particular variables and intended outcomes (objective values) that are incorporated in the CCME-WQI is depended on the specific circumstances in Lake Union [22]. The CCME final index is calculated by the three components (scope, frequency and amplitude). Moreover, NSF6-WQI and NSF7-WQI exhibit a lower seasonal variability and can be considered a more robust WQI. Additionally, the study conducted by Alexakis et al. [28] in a lake situated in the Mediterranean region also verifies this outcome. The correlation coefficients between each WQI and water quality parameter are tabulated in Table 3.
It is important to note that several factors impact the water quality parameters with the highest correlation coefficient values and, thus, play a more significant role in formulating the final findings. It is essential to indicate that various factors influence the water quality parameters, which will show higher correlation coefficient values, and consequently, the higher the correlation coefficient value, the more significant role in formulating the outcome (Table 3).
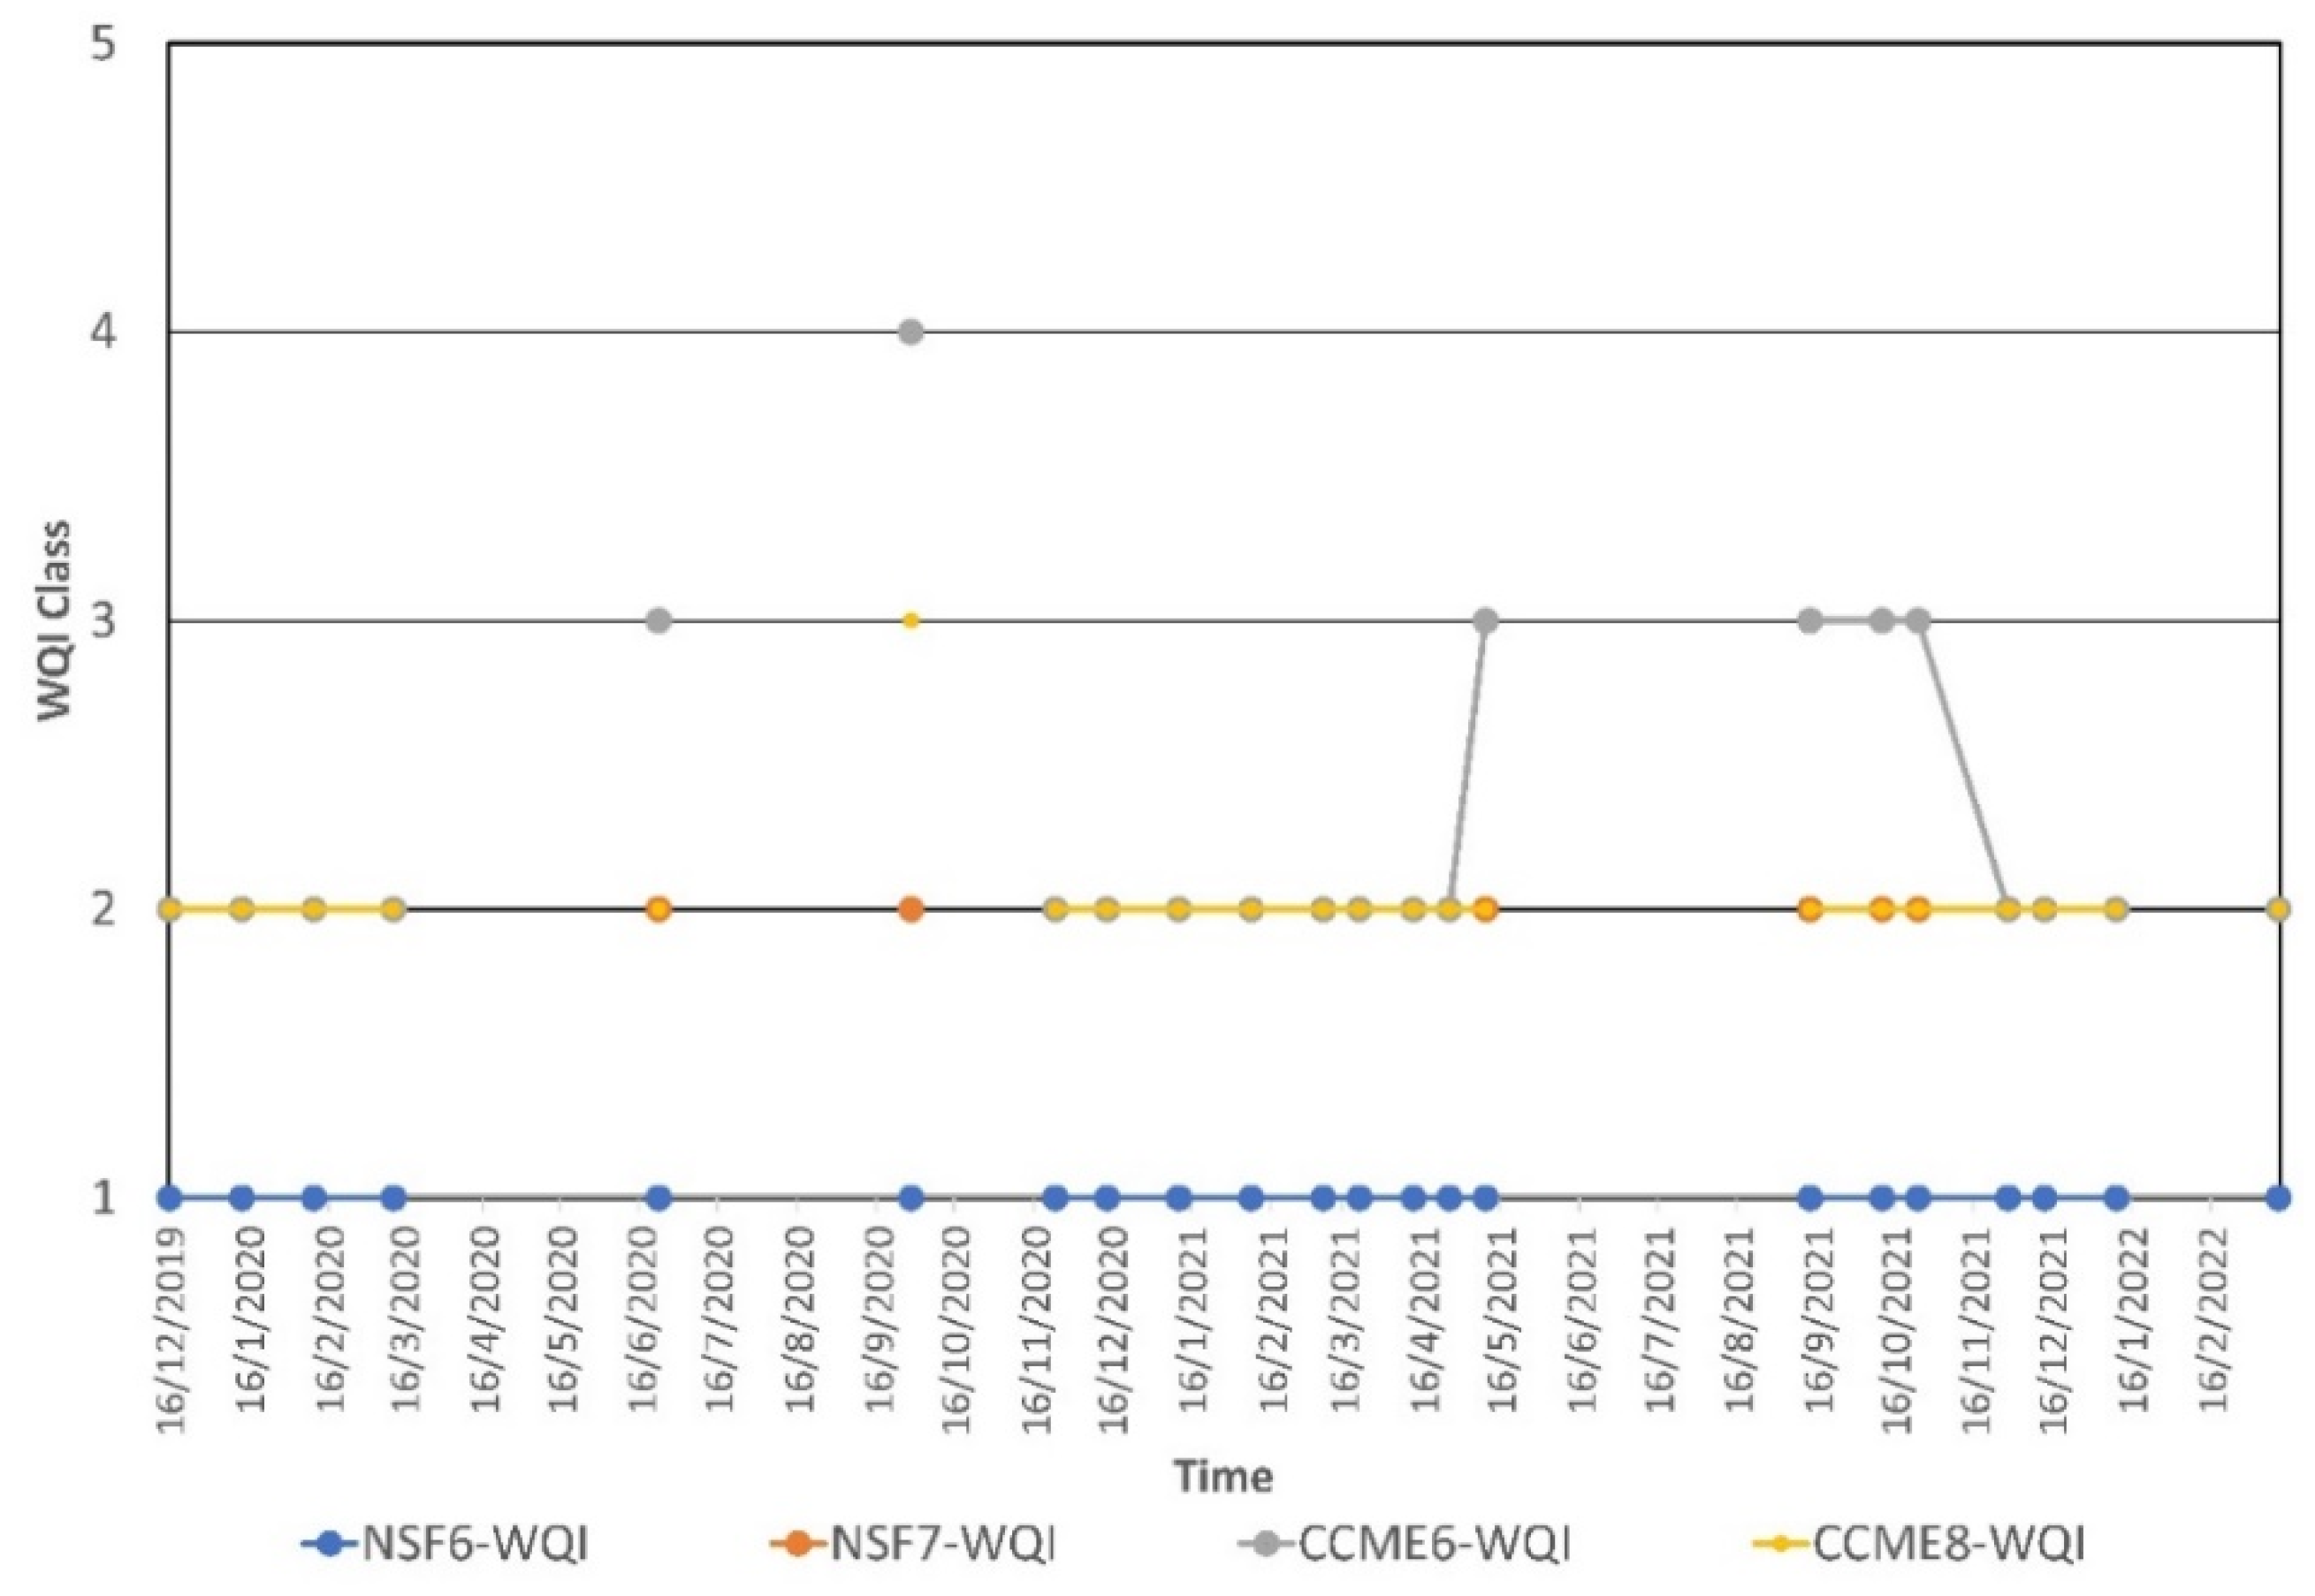
Figure 5 presents the variation in NSF-WQI and CCME-WQI classes (1 to 5 scale) in Lake Union. The following conclusions may be derived based on the variation in WQI classes (Figure 5).
First, the lowest class is Class 1, which NSF6-WQI calculates. This class is recorded at all sampling campaigns, suggesting that the classification using NSF6-WQI is stricter than the classification derived from NSF7-WQI, CCME6-WQI and CCME8-WQI. Waters with these characteristics can be considered as “very bad” waters according to the NSF6-WQI classification.
Second, the lowest class of both NSF7-WQI, CCME6-WQI and CCME8-WQI is Class 2, except for six sampling campaigns (Figure 4); while the highest class of CCME6-WQI is Class 4, which leads to the observation that at the majority of sampling campaigns, there is no difference between the classes of NSF7-WQI, CCME6-WQI and CCME8-WQI. For surface water of Lake Union collected in five sampling campaigns (16 June 2020, 16 April 2021, 16 September 2021, 16 October 2021 and 16 November 2021), the NSF7-WQI and CCME8-WQI fall in Class 2 (Bad, Marginal); while according to CCME6-WQI it is categorized in Class 3 (Fair) denoting that the difference between these classes was +1. The inclusion of CND can explain these differences only in CCME8-WQI, and consequently, this index produces a stricter classification for the surface water of Lake Union. The CCME8-WQI and CND are moderate intercorrelated (correlation coefficient: +0.579; p-value < 0.050; Table 3), suggesting that CND controls the CCME8-WQI classification in Lake Union moderately. It should be reported that saltwater intrusion and the increase in CND in lake water is well documented in Lake Union [35]. High salinity water (up to 29 ppt) often enters Lake Union during the summer when lock operations are at their peak and flow is at its lowest, but this saltwater is usually flushed out by late autumn with increasing freshwater flow [35]. Moreover, the CCME6-WQI and DO (correlation coefficient: −0.625; p-value < 0.050) and CCME8-WQI and DO (correlation coefficient: −0.807; p-value < 0.050) are moderately and strongly intercorrelated, respectively, which suggests that DO moderately to strongly controls the CCME-WQI classification in Lake Union (Table 3). According to King County [35,36], the known phenomenon of saltwater intrusion controls the CND and DO contents in water of Lake Union. This finding shows that the impact of saltwater intrusion in Lake Union is clearly revealed by CCME-WQI classification. Furthermore, CCME6-WQI, CCME8-WQI and NO3-N (correlation coefficient up to −0.943; p-value <0.050) are strongly intercorrelated (Table 3), which also suggest that NO3-N strongly controls the CCME classification in Lake Union. Nitrate is among the parameters that contributed to the decrease in the indices (Table 3; Figure 4). A similar finding is also reported by Kikuda et al. [41], who studied Buritis Lake (Brazil). Even a slight decrease in nitrogen contents in Lake Union improves lake trophic status, but adding nutrients to the lake promotes eutrophication. A recent study conducted by Hadjisolomou et al. [34] in Lake Mikri Prespa (Greece) reported similar findings. Studies conducted by King County in both 2002 and 2014 have also reported that within saltwater intrusion, there were increases, among others, in the contents of nitrogen in lake water [35]. In the sampling campaign conducted on 16 September 2020, the application of each one of the examined WQIs produced a different outcome for the classification of the surface water of Lake Union (Figure 5).
Including chlorophyll-a and electrical conductivity only in the CCME8-WQI, categorize the surface water in Lake Union in Class 2 (Marginal), which is lower than the classification derived from CCME6-WQI. Furthermore, saltwater intrusion shows that increased temperature appears to cause a decrease in DO and sustained anoxia [17].
The classification of Lake Union in classes ranging from 1 to 3 is attributed to the intrusion of saltwater in the studied lake. Saltwater intrusion in Lake Union is recorded by King County as a common phenomenon [35]. The 2014 saltwater intrusion into Lake Union was unprecedented in duration and magnitude since the King County started regular observations in 1984 [35]. During the 2002 and 2014 saltwater intrusions, routine monitoring conducted by King County showed increasing temperature, prolonged anoxia, and low pH [35]. Moreover, the 2014–2016 saltwater intrusion into Lake Union changed the lake’s physical and chemical ecosystem [35].
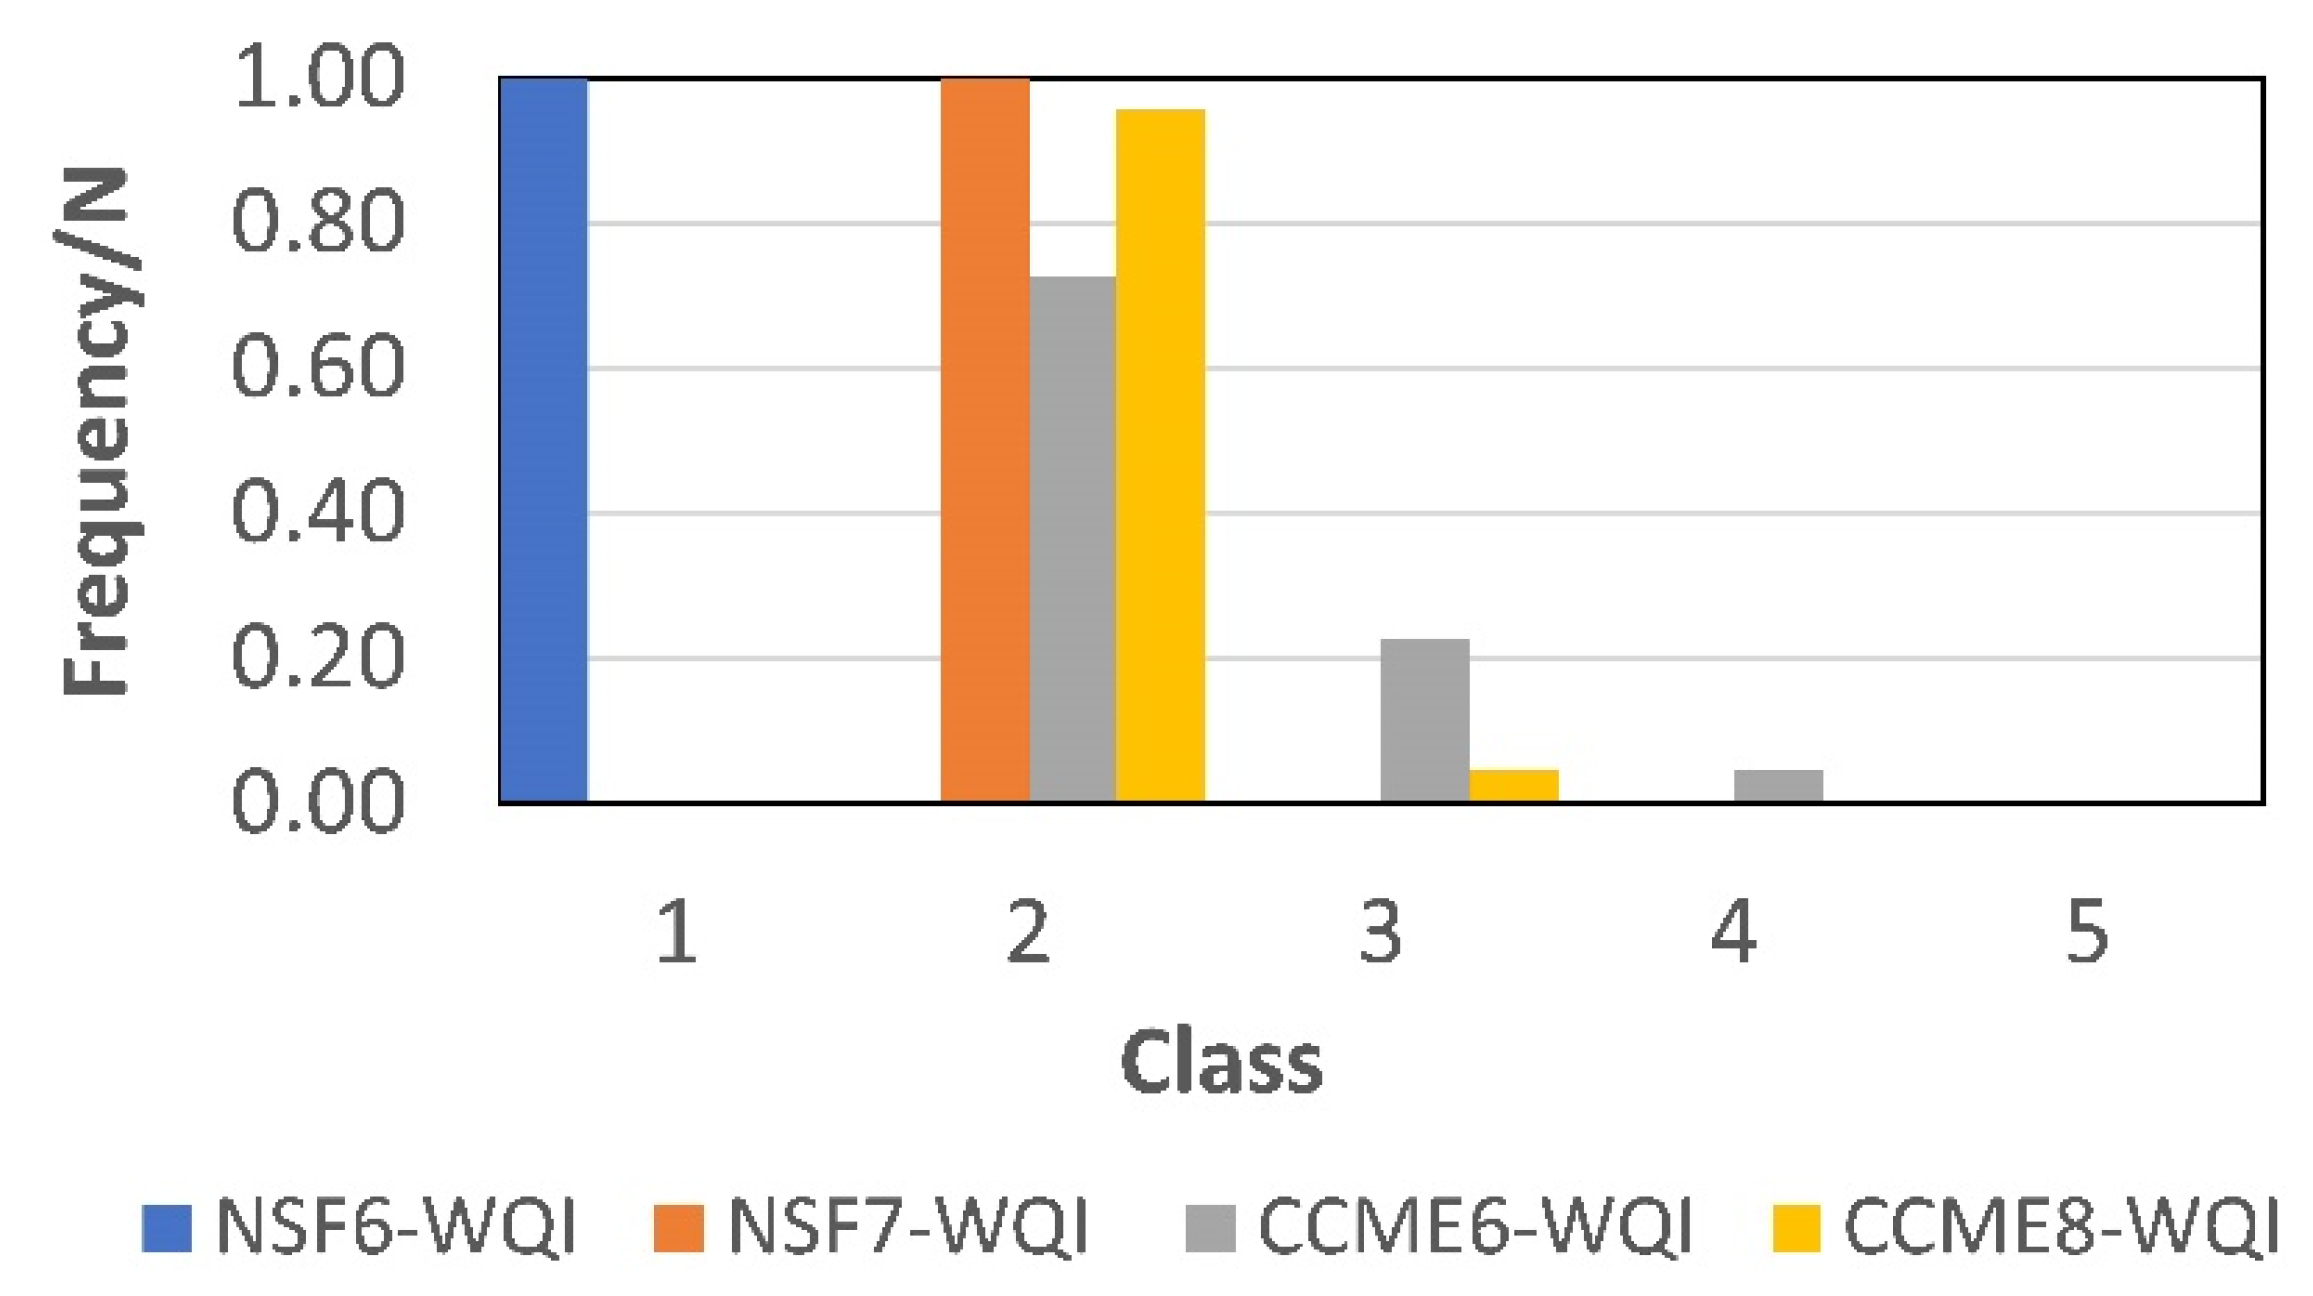
Figure 6 shows the normalized frequencies for each WQI class. It is depicted that the NSF6-WQI ranges only in the lowest class (Class 1—Very bad) (Table 2). The NSF7-WQI, CCME6-WQI and CCME8-WQI mostly range in Class 2 (Bad, Marginal) (Table 2). The CCME6-WQI and CCME8-WQI range in the middle class (Class 3—Fair) only for a few sampling campaigns; while only CCME6-WQI for one sampling campaign falls into the upper class (Class 4—Good) (Table 2).
Figure 5 and Figure 6 show that the NSF6-WQI, NSF7-WQI, CCME6-WQI and CCME8-WQI could be classified based on their relative performance in three groups. The NSF6-WQI falls into the first group since it classifies the surface water of Lake Union as the lowest quality class. The NSF7-WQI and CCME8-WQI fall into the second group, as the resulting surface water classification categorises Lake Union into Class 2 (except for one sampling campaign). It can be observed that the quality class of CCME6-WQI varies between 2 and 4, and consequently, this WQI falls into the third group.
The results obtained from the analysis of NSF6-WQI, NSF7-WQI, CCME6-WQI and CCME8-WQI show significant discrepancies between classifications provided by these indices on the same surface water body. These significant discrepancies are attributable to changes in objective values and the number of parameters used for the calculations.
4. Concluding Remarks
It is shown that when different WQI procedures are used, different classification results may arise; thus, considerable consideration should be given in choosing a particular approach to apply for assessing lake water quality. The findings of this study indicate significant differences in classifications supplied by different indices on the same surface water body. At each monitoring period, the NSF6-WQI and NSF7-WQI values reported in Lake Union’s surface water are considerably lower than the CCME6-WQI and CCME8-WQI values. The NSF6-WQI and NSF7-WQI values are consistently lower than the CCME6-WQI and CCME8-WQI values, which may be linked to temperature changes for NSF-WQI calculation, indicating that temperature is a significant parameter for its estimation. NSF6-WQI and NSF7-WQI are stricter and more robust than the CCME6-WQI and CCME8-WQI since they have less seasonal variation and present constantly lower values. Including chlorophyll-a and electrical conductivity solely in CCME8-WQI classifies Lake Union’s surface water as Class 2 (Marginal), which is lower than the classification determined from CCME6-WQI. In most sampling campaigns, there is no difference between the classes of NSF7-WQI, CCME6-WQI and CCME8-WQI. The variation in WQIs in the surface water of Lake Union can be attributed to saltwater intrusion. However, these results are based on a set of observed data from a single surface water body and can only be generalized if the WQIs are applied to a wide range of case studies that reflect varied meteorological, geomorphological, geological and hydrological circumstances. WQIs have been shown to be helpful tools because they promote the communication process by delivering precise and accurate results for stakeholders and policymakers. Future work may include the sensitivity analysis of the selected parameters for each WQI.
Author Contributions
Conceptualization, D.E.A. and D.E.G.; methodology, D.E.A., software, D.E.G.; validation, D.E.A. and D.E.G.; formal analysis, D.E.A.; investigation, D.E.G.; resources, D.E.G. and. D.E.A.; data curation, D.E.G.; writing—original draft preparation, D.E.A. and D.E.G.; writing—review and editing, D.E.A. and D.E.G.; visualization, D.E.G.; supervision, D.E.A. and D.E.G. All authors have read and agreed to the published version of the manuscript.
Funding
This research received no external funding.
Institutional Review Board Statement
Not applicable.
Informed Consent Statement
Not applicable.
Data Availability Statement
Data that support the findings of this study are available from the corresponding author upon reasonable request.
Conflicts of Interest
The authors declare no conflict of interest.
References
- Adelagun, R.O.A.; Etim, E.E.; Godwin, O.E. Application of Water Quality Index for the Assessment of Water from Different Sources in Nigeria. In Promising Techniques for Wastewater Treatment and Water Quality Assessment; Ahmed Moujdin, I., Kevin Summers, J., Eds.; IntechOpen: London, UK, 2021; ISBN 978-1-83881-900-2. [Google Scholar]
- Alexakis, D.; Gamvroula, D.; Theofili, E. Environmental Availability of Potentially Toxic Elements in an Agricultural Mediterranean Site. Environ. Eng. Geosci. 2019, 25, 169–178. [Google Scholar] [CrossRef]
- Alexakis, D.E.; Bathrellos, G.D.; Skilodimou, H.D.; Gamvroula, D.E. Land Suitability Mapping Using Geochemical and Spatial Analysis Methods. Appl. Sci. 2021, 11, 5404. [Google Scholar] [CrossRef]
- Kelepertsis, A.; Alexakis, D. The Impact of Mining·and Metallurgical Activity of the Lavrion Sulfide Deposits οn the Geochemistry of Bottom Sea Sediments East of the Lavreotiki Peninsula, Greece. Res. J. Chem. Environ. 2004, 8, 40–46. [Google Scholar]
- Alexakis, D.E. The Relationship between the Chemical Composition of Groundwater and the Geological Environment in the East Attiki Area, Greece. Miner. Wealth 1998, 109, 12. [Google Scholar]
- Yu, H.; Yang, Z.; Li, B. Sustainability Assessment of Water Resources in Beijing. Water 2020, 12, 1999. [Google Scholar] [CrossRef]
- Bekas, G.K.; Alexakis, D.E.; Gamvroula, D.E. Forecasting Discharge Rate and Chloride Content of Karstic Spring Water by Applying the Levenberg–Marquardt Algorithm. Environ. Earth Sci. 2021, 80, 404. [Google Scholar] [CrossRef]
- Alexakis, D.E.; Kiskira, K.; Gamvroula, D.; Emmanouil, C.; Psomopoulos, C.S. Evaluating Toxic Element Contamination Sources in Groundwater Bodies of Two Mediterranean Sites. Environ. Sci. Pollut. Res. 2021, 28, 34400–34409. [Google Scholar] [CrossRef]
- Alexakis, D.E. Linking DPSIR Model and Water Quality Indices to Achieve Sustainable Development Goals in Groundwater Resources. Hydrology 2021, 8, 90. [Google Scholar] [CrossRef]
- Sorokina, T.Y. A National System of Biological Monitoring in the Russian Arctic as a Tool for the Implementation of the Stockholm Convention. Int. Environ. Agreem. Polit. Law Econ. 2019, 19, 341–355. [Google Scholar] [CrossRef] [Green Version]
- Panneerselvam, B.; Muniraj, K.; Pande, C.; Ravichandran, N.; Thomas, M.; Karuppannan, S. Geochemical Evaluation and Human Health Risk Assessment of Nitrate-Contaminated Groundwater in an Industrial Area of South India. Environ. Sci. Pollut. Res. 2021. [Google Scholar] [CrossRef]
- Howell, N. Comparative Water Qualities and Blending in the Ogallala and Dockum Aquifers in Texas. Hydrology 2021, 8, 166. [Google Scholar] [CrossRef]
- Alexakis, D.E. Water Quality Indices: Current and Future Trends in Evaluating Contamination of Groundwater Resources. Water 2021, 13, 401. [Google Scholar] [CrossRef]
- Chikita, K.A.; Goto, A.; Okada, J.; Yamaguchi, T.; Miura, S.; Yamamoto, M. Hydrological and Chemical Budgets of Okama Crater Lake in Active Zao Volcano, Japan. Hydrology 2022, 9, 28. [Google Scholar] [CrossRef]
- Padedda, B.M.; Lugliè, A.; Lai, G.G.; Giadrossich, F.; Satta, C.T.; Pulina, S. Land-Based Impact of Nutrient Loads and Eutrophication on an Ancient Mediterranean Natural Lake. Hydrology 2021, 9, 7. [Google Scholar] [CrossRef]
- Horton, R.K. An Index Number System for Rating Water Quality. J. Water Pollut. Control Fed 1965, 37, 300–306. [Google Scholar]
- Abbasi, T.; Abbasi, S.A. Water Quality Indices; Elsevier: Amsterdam, The Netherlands, 2012. [Google Scholar]
- Akhtar, N.; Ishak, M.I.S.; Ahmad, M.I.; Umar, K.; Md Yusuff, M.S.; Anees, M.T.; Qadir, A.; Ali Almanasir, Y.K. Modification of the Water Quality Index (WQI) Process for Simple Calculation Using the Multi-Criteria Decision-Making (MCDM) Method: A Review. Water 2021, 13, 905. [Google Scholar] [CrossRef]
- Brown, R.M.; McClelland, N.I.; Deininger, R.A.; Tozer, R.G. A Water Quality Index: Do We Dare? Water Sew. Work. 1970, 117, 339–343. [Google Scholar]
- Scottish Research Development Department (SRDD). Development of A Water Quality Index; Engineering Division: Edinburg, UK, 1976. [Google Scholar]
- Liou, S.-M.; Lo, S.-L.; Wang, S.-H. A Generalized Water Quality Index for Taiwan. Environ. Monit. Assess. 2004, 96, 35–52. [Google Scholar] [CrossRef]
- Canadian Council of Ministers of the Environment (CCME). Canadian Water Quality Guidelines for the Protection of Aquatic Life. CCME Water Quality Index 1.0, User’s Manual; Canadian Council of Ministers of the Environment: Winnipeg, MB, Canada, 2001. [Google Scholar]
- Bhargava, D.S. Expression for Drinking Water Supply Standards. J. Environ. Eng. 1985, 111, 304–316. [Google Scholar] [CrossRef]
- Sargaonkar, A.; Deshpande, V. Development of an Overall Index of Pollution for Surface Water Based on a General Classification Scheme in Indian Context. Environ. Monit. Assess. 2003, 89, 43–67. [Google Scholar] [CrossRef]
- Zandbergen, P.A.; Hall, K.J. Analysis of the British Columbia Water Quality Index for Watershed Managers: A Case Study of Two Small Watersheds. Water Qual. Res. J. 1998, 33, 519–550. [Google Scholar] [CrossRef]
- Cude, C.G. Oregon water quality index a tool for evaluating water quality management effectiveness. J. Am. Water Resour. Assoc. 2001, 37, 125–137. [Google Scholar] [CrossRef]
- Shuhaimi-Othman, M.; Lim, E.C.; Mushrifah, I. Water Quality Changes in Chini Lake, Pahang, West Malaysia. Environ. Monit. Assess. 2007, 131, 279–292. [Google Scholar] [CrossRef]
- Alexakis, D.; Tsihrintzis, V.A.; Tsakiris, G.; Gikas, G.D. Suitability of Water Quality Indices for Application in Lakes in the Mediterranean. Water Resour. Manag. 2016, 30, 1621–1633. [Google Scholar] [CrossRef]
- Alexakis, D.E. Meta-Evaluation of Water Quality Indices. Application into Groundwater Resources. Water 2020, 12, 1890. [Google Scholar] [CrossRef]
- Ewaid, S.; Abed, S.; Al-Ansari, N.; Salih, R. Development and Evaluation of a Water Quality Index for the Iraqi Rivers. Hydrology 2020, 7, 67. [Google Scholar] [CrossRef]
- Zhulidov, A.V.; Khlobystov, V.V.; Robarts, R.D.; Pavlov, D.F. Critical Analysis of Water Quality Monitoring in the Russian Federation and Former Soviet Union. Can. J. Fish. Aquat. Sci. 2000, 57, 1932–1939. [Google Scholar] [CrossRef]
- Kouadri, S.; Elbeltagi, A.; Islam, A.R.M.T.; Kateb, S. Performance of Machine Learning Methods in Predicting Water Quality Index Based on Irregular Data Set: Application on Illizi Region (Algerian Southeast). Appl. Water Sci. 2021, 11, 190. [Google Scholar] [CrossRef]
- Deng, T.; Chau, K.-W.; Duan, H.-F. Machine Learning Based Marine Water Quality Prediction for Coastal Hydro-Environment Management. J. Environ. Manag. 2021, 284, 112051. [Google Scholar] [CrossRef]
- Hadjisolomou, E.; Stefanidis, K.; Herodotou, H.; Michaelides, M.; Papatheodorou, G.; Papastergiadou, E. Modelling Freshwater Eutrophication with Limited Limnological Data Using Artificial Neural Networks. Water 2021, 13, 1590. [Google Scholar] [CrossRef]
- Clark, T. King County Lake Union/Ship Canal Water Quality Report: January 2014 to March 2016; Water and Land Resources Division: Seattle, WA, USA, 2018. [Google Scholar]
- King County Water Quality Report 2000. 2000 Water Quality Survey Results; Department of Natural Resources: Seattle, WA, USA, 2000; 29p.
- Troost, K.G.; Booth, D.B. Geology of Seattle and the Seattle Area, Washington. In Landslides and Engineering Geology of the Seattle, Washington, Area; Geological Society of America: Boulder, CO, USA, 2008. [Google Scholar]
- Barberopoulou, A. A Seiche Hazard Study for Lake Union, Seattle, Washington. Bull. Seismol. Soc. Am. 2008, 98, 1837–1848. [Google Scholar] [CrossRef]
- World Health Organization. Guidelines for Drinking Water Quality, Vol. 1: Recommendations; World Health Organization: Geneva, Switzerland, 1993. [Google Scholar]
- State of Utah, Department of Environmental Quality, Division of Water Quality (SUDEQ). Standard Operating Procedure for Turbidity Measurements Using a Turbidity Tube; Revision 0, Effective 1 May 2014; State of Utah, Department of Environmental Quality, Division of Water Quality (SUDEQ): Salt Lake City, UT, USA, 2014. [Google Scholar]
- Kikuda, R.; Pereira Gomes, R.; Rodrigues Gama, A.; De Paula Silva, J.A.; Pereira Dos Santos, A.; Rodrigues Alves, K.; Nascimento Arruda, P.; Scalize, P.S.; Gonçalves Vieira, J.D.; Carneiro, L.C.; et al. Evaluation of Water Quality of Buritis Lake. Water 2022, 14, 1414. [Google Scholar] [CrossRef]
Figure 1.
Map showing area studied.

Figure 2.
Map showing monitoring stations S-0540 and S-0852 of lake water.

Figure 3.
Timeseries of the monitored water quality parameters of Lake Union: (a) Chlorophyll-a, (b) Temperature, (c) Faecal Coliforms, (d) Dissolved Oxygen, (e) Electrical Conductivity, (f) Nitrate-Nitrogen, (g) pH, (h) Total Phosphorous, and (i) Turbidity.
Figure 3.
Timeseries of the monitored water quality parameters of Lake Union: (a) Chlorophyll-a, (b) Temperature, (c) Faecal Coliforms, (d) Dissolved Oxygen, (e) Electrical Conductivity, (f) Nitrate-Nitrogen, (g) pH, (h) Total Phosphorous, and (i) Turbidity.

Figure 4.
Interannual variation in WQI values in water collected at the monitoring station S-0540 in Lake Union, Seattle.
Figure 4.
Interannual variation in WQI values in water collected at the monitoring station S-0540 in Lake Union, Seattle.

Figure 5.
Variations of WQI classes in Lake Union, Seattle.

Figure 6.
Normalized frequency diagrams for WQI classes in monitoring station S-0540 of Lake Union, Seattle.
Figure 6.
Normalized frequency diagrams for WQI classes in monitoring station S-0540 of Lake Union, Seattle.


Table 1.
Parameters used for the classification of water quality in Lake Union.
| Units | NSF6-WQI | NSF7-WQI | CCME6-WQI | CCME8-WQI | |
| Chlorophyll-a | μg L−1 | - | - | - | ✓ (4) |
| Change in Temperature | °C | - | ✓ | - | - |
| Faecal Coliforms | CFU/100 mL | ✓ | ✓ | ✓ (100) | ✓ (100) |
| Dissolved Oxygen (DO) | mg L−1 | - | - | ✓ (6) | ✓ (6) |
| % | ✓ | ✓ | - | - | |
| Electrical Conductivity (CND) | μS cm−1 | - | - | - | ✓ (2,500) |
| Nitrate Nitrogen (N-NO3-) | mg L−1 | ✓ | ✓ | ✓ (13.45) | ✓ (13.45) |
| pH | - | ✓ | ✓ | ✓ (6.5–9.0) | ✓ (6.5–9.0) |
| Total Phosphorus | mg L−1 | ✓ | ✓ | - | - |
| μg L−1 | - | - | ✓ (10) | ✓ (10) | |
| Turbidity | NTU | ✓ | ✓ | ✓ (5) | ✓ (5) |
| NSF-WQI [19] | CCME-WQI [22] | |||
|---|---|---|---|---|
| Class | Rating | Range | Rating | Range |
| 5 | Excellent | 91–100 | Excellent | 95–100 |
| 4 | Good | 90–71 | Good | 80–94 |
| 3 | Medium | 51–70 | Fair | 65–79 |
| 2 | Bad | 26–50 | Marginal | 45–64 |
| 1 | Very bad | 0–25 | Poor | 0–44 |
Table 3.
Correlation matrix of WQIs and the examined parameters in surface water in Lake Union (bold characters indicate high correlation, statistically significant correlation if p-value < 0.050).
Table 3.
Correlation matrix of WQIs and the examined parameters in surface water in Lake Union (bold characters indicate high correlation, statistically significant correlation if p-value < 0.050).
| NSF6-WQI | NSF7-WQI | CCME6-WQI | CCME8-WQI | |
|---|---|---|---|---|
| Chlorophyll-a | - | - | - | −0.150 |
| p-value | - | - | - | 0.252 |
| Change in Temperature | - | −0.400 | - | - |
| p-value | - | 0.033 | - | - |
| Faecal Coliform | −0.126 | 0.056 | −0.153 | −0.041 |
| p-value | 0.289 | 0.402 | 0.248 | 0.428 |
| Dissolved Oxygen (DO) | 0.453 | 0.076 | −0.625 | −0.807 |
| p-value | 0.017 | 0.369 | 0.001 | 0.000 |
| Electrical Conductivity (CND) | - | - | - | 0.579 |
| p-value | - | - | - | 0.002 |
| Nitrate-nitrogen (NO3-N) | −0.052 | 0.113 | −0.943 | −0.714 |
| p-value | 0.409 | 0.309 | 0.000 | 0.000 |
| pH | 0.472 | −0.010 | 0.410 | −0.043 |
| p-value | 0.013 | 0.482 | 0.029 | 0.424 |
| Total Phosphorous (TP) | 0.202 | 0.360 | −0.248 | −0.292 |
| p-value | 0.183 | 0.050 | 0.133 | 0.094 |
| Turbidity | −0.936 | −0.304 | −0.224 | 0.198 |
| p-value | 0.000 | 0.084 | 0.159 | 0.189 |
Publisher’s Note: MDPI stays neutral with regard to jurisdictional claims in published maps and institutional affiliations. |
© 2022 by the authors. Licensee MDPI, Basel, Switzerland. This article is an open access article distributed under the terms and conditions of the Creative Commons Attribution (CC BY) license (https://creativecommons.org/licenses/by/4.0/).
Share and Cite
MDPI and ACS Style
Gamvroula, D.E.; Alexakis, D.E. Evaluating the Performance of Water Quality Indices: Application in Surface Water of Lake Union, Washington State-USA. Hydrology 2022, 9, 116. https://0-doi-org.brum.beds.ac.uk/10.3390/hydrology9070116
AMA Style
Gamvroula DE, Alexakis DE. Evaluating the Performance of Water Quality Indices: Application in Surface Water of Lake Union, Washington State-USA. Hydrology. 2022; 9(7):116. https://0-doi-org.brum.beds.ac.uk/10.3390/hydrology9070116
Chicago/Turabian StyleGamvroula, Dimitra E., and Dimitrios E. Alexakis. 2022. "Evaluating the Performance of Water Quality Indices: Application in Surface Water of Lake Union, Washington State-USA" Hydrology 9, no. 7: 116. https://0-doi-org.brum.beds.ac.uk/10.3390/hydrology9070116
Note that from the first issue of 2016, this journal uses article numbers instead of page numbers. See further details here.