Internal Test Sets Studies in a Group of Antimalarials

1
Xarxa de Recerca de Malalties Tropicals, Facultat de Farmàcia, Universitat de València, Spain
2
Institut de Química Computacional, Facultat de Ciències, Universitat de Girona, Spain
*
Author to whom correspondence should be addressed.
Int. J. Mol. Sci. 2006, 7(10), 456-468; https://0-doi-org.brum.beds.ac.uk/10.3390/i8200456
Submission received: 1 June 2006
/
Accepted: 27 October 2006
/
Published: 31 October 2006
(This article belongs to the Special Issue Virtual Combinatorial Synthesis and Drug Design)
Abstract
:Topological indices have been applied to build QSAR models for a set of 20 antimalarial cyclic peroxy cetals. In order to evaluate the reliability of the proposed linear models leave-n-out and Internal Test Sets (ITS) approaches have been considered. The pro-posed procedure resulted in a robust and consensued prediction equation and here it is shown why it is superior to the employed standard cross-validation algorithms involving multilinear regression models.
Introduction
The objective of the present work is to study true prediction possibilities in a congeneric group of antimalarials by using graph-theoretical indices as molecular descriptors. Malaria is one of the most concerning diseases in developing countries. The obtaining of an effective vaccine is a far expectative. The increasing of resistant strains to chloroquine has raised the search of new potential drugs [1] and artemisin-like substances are promising candidates in order to control this epidemic and intensive research is being made on cyclic peroxy compounds [1].
Graph-theoretical indices, also known as Topological Indices (TI), are non-empirical graph invariants calculated from the intuitive representation of the molecules [2,3,4,5]. They encode information on molecular size, shape and branching, the most important features of the molecular structure. The computation of TI is very swift and they have the advantage of being true structural invariants. That is, their values are independent of molecular conformations. Their usefulness in the modeling of physical [6,7], chemical and biological [8] properties such as different therapeutical activities as well as toxicological properties [9], the drug-like character [10,11] and the molecular similarity/diversity [12,13,14,15], has been firmly established, even within structurally heterogeneous groups of compounds, making TI apt for their application in drug design [16,17,18,19,20,21]. Recent papers deal with the prediction of antimicrobial [22,23], specific anti-mycobacterial [24,25], anticonvulsant activities [26], drug-albumin binding affinity [27], brain-blood distribution [28], and antioxidant character [29], among others. Three-dimensional versions of the graph-theoretical indices have been also proposed [30,31,32]. But, in fact, it is very common to find studies in which the topostructural and topochemical indices explain the majority of the system variance, and that the inclusion of molecular geometry-dependent parameters does not result in significantly improved predictive models [33].
On the other hand, in the QSAR field oftentimes mathematical models are presented as a linear equation of some descriptors selected in some way with a good adjustment for the experimental data within the series. These models usually come accompanied by a test of validation of leave-one-out type in which the value of the property for each molecule is evaluated by an equation obtained with the whole rest of the population, in a manner that the selected variables remain fixed. To the apparent guarantees that supposes this validation method, when applying the equations to molecules that don't appear in the series of training, the results of prediction of the property are usually very poor. In part, this is due to the particular procedure which has been followed in order to perform the cross-validation. In this work, two related algorithmic designs are explored. First, a standard leave-n-out (LnO) protocol normally considered when MLR models are searched. It will be seen how and why this procedure does not warrant reliable models, even in the cases for which sound statistical parameters are being obtained. The important thing is that in order to obtain reliable models, it is advisable to obtain acceptable results for test molecules external to the training group, although the predictions inside it were not so remarkable. This encompasses the second method explored here: as it will be seen, Internal Tests Sets (ITS) protocol constitutes a more severe LnO procedure. Basically, this method internally generates external molecular test sets for which true predictions must be performed. Here, a leave-one-out variant will be presented. This means that, one at a time, each molecule in the original family is momentarily removed, a model is found using the data of the remaining molecules (even relying in an internal LnO protocol) and a prediction is done for the hidden compound. If fact, this procedure is equivalent to an n-fold cross-validation test and constitutes an iterative and exhaustive process with reposition. The consequence is that a particular prediction equation is built for each removed structure and the selection of the relevant variables entering in models can vary among equations. Our experience reveals us that this method allows the automatic identification of outliers.
Calculations
Data
This study is made on the set of 20 cyclic peroxy cetals previously published by Posner et al. [34]. Table 1 shows the molecular structure of the studied compounds and their activities obtained experimentally by a reported method [35]. Activities are expressed as logarithm of IC50 (50% inhibitory concentration, C, in nM units). Thus, the most active compounds show low values.

 | |||
|---|---|---|---|
| Entry | Ar | R, R | Log(IC50/nM) |
| 1 | Ph | Me, Me | 3.041 |
| 2 | Ph | cyclopentyl | 2.279 |
| 3 | Ph | cyclohexyl | 2.447 |
| 4 | Ph | cycloheptyl | 2.342 |
| 5 | 4-MeOPh | cyclobutyl | 2.204 |
| 6 | 4-MeOPh | cyclohexyl | 2.255 |
| 7 | 4-MeOPh | cycloheptyl | 2.322 |
| 8 | 3,4,5-(MeO)3Ph | cycloheptyl | 2.079 |
| 9 | 4-CF3OPh | cycloheptyl | 1.785 |
| 10 | 4-ClPh | cycloheptyl | 1.763 |
| 11 | 4-FPh | cycloheptyl | 1.929 |
| 12 | 4-MeSPh | cycloheptyl | 1.892 |
| 13 | 4-MeS(O2)Ph | cycloheptyl | 1.491 |
| 14 | 4-EtPh | cycloheptyl | 2.255 |
| 15 | 4-MeSPh | cyclohexyl | 2.204 |
| 16 | 4-MeS(O2)Ph | cyclohexyl | 1.748 |
| 17 | 4-O2NPh | cyclohexyl | 1.663 |
| 18 | 4-ClPh | cyclohexyl | 2.000 |
| 19 | 4-FPh | cyclohexyl | 2.301 |
| 20 | 4-F3CPh | cyclohexyl | 2.146 |
Descriptors
Originally, 90 descriptors were computed for each structure. These graph-theoretical indices are briefly defined in table 2. Detailed definitions of these descriptors can be found in references 19, 36-41.
| Symbol | Name | Definition | Reference |
|---|---|---|---|
| N | Molecular size | Number of non-hydrogen atoms. | 19 |
| Vk k=3,4 | Vertices of degree k | Number of atoms having k bonds, σ or π, to non-hydrogen atoms. | 19 |
| R | Ramification | Number of single structural branches. | 19 |
| W | Wiener path number | Sum of the distances between any two atoms in terms of bonds. | 36 |
| L | Length | Maximal distance between atoms in terms of bonds. | 19 |
| PRk k=0-3 | Pairs of ramifications at distance k | Number of pairs of single branches at distance k in terms of bonds. | 19 |
| kχt k=0-4 t=p,c,pc | Randić-like indices of order k and type path (p), cluster (c) and path-cluster (pc) |  δ i, number of bonds, σ or π, of the atom i to non-hydrogen atoms. Sj, jth sub-structure of order k and type t. | 37,38 |
| kχtv k=0-4 t=p,c,pc | Kier-Hall indices of order k and type path (p), cluster (c) and path-cluster (pc) |  δ iv, Kier-Hall valence of the atom i. Sj, jth sub-structure of order k and type t. | 39 |
| Gk k=1-5 | Topological charge indices of order k |  M=AQ, product of the adjacency and inverse squared distance matrices for the hydrogen-depleted molecular graph. D, distance matrix. δ, Kronecker delta | 19,40 |
| Gkv k=1-5 | Valence topological charge indices of order k |  Mv=AvQ, product of the electronegativity-modified adjacency and inverse squared distance matrices for the hydrogen-depleted molecular graph. D, distance matrix. δ, Kronecker delta | 19,40 |
| Jk k=1-5 | Pondered topological charge indices of order k |  | 19,40 |
| Jkv k=1-5 | Pondered valence topological charge indices of order k |  | 19,40 |
| kDt k=0-4 t=p,c,pc | Connectivity differences of order k and type path (p), cluster (c) and path-cluster (pc) |  | 19 |
| Ek k=1-5 | Topological charge differences of order k |  | 41 |
| Fk k=1-5 | Pondered topological charge differences of order k |  | 41 |
| kCt k=0-4 t=p,c,pc | Connectivity quotients of order k and type path (p), cluster (c) and path-cluster (pc) |  | 19 |
| kQt k=0-4 t=p,c,pc | Inverse connectivity quotients of order k and type path (p), cluster (c) and path-cluster (pc) |  | 41 |
| CGk k=1-5 | Topological charge quotients of order k |  | 41 |
| QGk k=1-5 | Inverse topological charge quotients of order k |  | 41 |
The original data matrix dimension was 20×90. The complexity of this primary set of indices was reduced resorting to the Unsupervised Forward Selection (UFS) algorithm due to Whitley et al. [42]. UFS procedure eliminates redundant vectors of descriptors according to the collinearities present in the data. In this way the original data matrix has been slightly reduced to dimension 20×84, avoiding the presence of descriptors that did not bring forward any information. Despite only a few vectors have been discarded, this prevents for the generation of linear dependences when constructing MLR models, especially in the cases where several compounds are iteratively eliminated during a LnO or ITS procedure (see below).
Modeling
A first test of predictability was performed with the 20 molecules of table 1. It was a standard LnO cross-validation, with n ranging from 0 to 2, using Multilinear Regression (MLR) of all the possible subsets of k independent variables, where k varies between 1 and 5. In order to select an optimal subset of variables for each n and each k, the following Algorithm A was used:
- Algorithm A(N,n,m,k): Standard MLR-LnO for N molecules for obtaining linear models involving k indices selected from a set of m.
- 1.
- Generate all the M=
![Ijms 07 00456 i015]() combinations of k descriptors taken from the group of m. For every combination:
combinations of k descriptors taken from the group of m. For every combination: - 2.
- Perform the LnO test:
- 2.1.
- Left it apart all the distinct
![Ijms 07 00456 i016]() sets of n molecules taken from the group of N. For each set, compute the MLR fitting equation involving the remaining N-n ones. Apply the obtained linear model to the excluded molecules.
sets of n molecules taken from the group of N. For each set, compute the MLR fitting equation involving the remaining N-n ones. Apply the obtained linear model to the excluded molecules. - 2.2.
- Previous step furnishes with
![Ijms 07 00456 i017]() predictions by molecule. Evaluate the mean value. This constitutes the consensued set of N predictions attached to the k descriptors.
predictions by molecule. Evaluate the mean value. This constitutes the consensued set of N predictions attached to the k descriptors. - 2.3.
- Compute the correlation coefficient (Rcv) between the N experimental values and the consensued ones.
- 3.
- Final selected variables are those attached to the combination having the highest Rcv coefficient in step 2.3 and, additionally, an acceptable statistical significance (in this work, for each coefficient in the MLR model the probability to be zero is lesser than 1%).
- 4.
- Give as final model the MLR fitting equation obtained considering all the N molecules and the selected variables in the previous step.


It is well known that algorithm A overestimates the predictive capabilities of the selected models [24]. This is so because the final model arises from a selection within a very big pool of candidates (in general the external loop number 1 may generate millions of combinations) and the risk of overparametrization is evident as it is quite probable to find a combination of indices well correlated with the experimental property vector. Despite to this drawback, when considering MLR or other linear techniques this standard algorithm is widely used for its simplicity and execution speed, as steps 2.1 and 2.2 do not need to be explicitly reproduced for MLR models, as there is a general theorem that allows obtaining the results in an even faster way [43]. Even more, the statistical parameters presented accompanying the results (such as the F one) where originally designed to evaluate a single model and not a model selected from a big pool of candidates [44]. This feature helps to optimistically interpret the obtained fittings.
A second and more robust test of predictability was also performed with the data, this time using the ITS method. It also constitutes a LnO cross-validation, with n ranging from 0 to 2, and considering all the possible subsets of k independent variables, where k varies between 1 and 5. In order to select an optimal subset of variables for each n and each k values, the following Algorithm B implements a L1O-ITS protocol:
- Algorithm B(N,n,m,k): MLR-LnO/L1O-ITS method for N molecules for obtaining linear models involving k indices taken from a set of m.
- 1.
- Consider the N molecules with known activity and left apart one at a time (this is the L1O part in the ITS formalism). For each set of N-1 remaining molecules:
- 1.1.
- Apply the A(N-1,n,m,k) algorithm.
- 1.2.
- Consider the MLR model obtained in previous step and apply it over the molecule excluded in step 1, obtaining in this way the property value prediction and the corresponding equation.
As it can be seen from the Algorithm B, for each particular value of k, it provides with a single model for each left out molecule. Therefore, in this case predictions are made without supervision and the process of selection of subset variables is performed without taking into account the information relative to the excluded structure (the data of the molecule left out are completely hidden to the system at every step) and obtaining in this way a true prediction. Evidently, algorithm B is much more severe than Algorithm A: first, because it is much more time consuming (approximately N times more as this is the number of required internal calls to Algorithm A) and, second, because it gives true external simulated predictions, which can be more unstable. Respect to this last point, the advantage relies in the fact that if consistent predictions are obtained, they have an extra value as they where obtained simulating external predictions. In this way, ITS procedures can be interpreted as a test for assessing the true predictive capabilities of the proposed models.
Results and Discussion
Results of prediction performance by using Algorithm A are shown in table 3. In order to compare models (despite the word of caution above) even in the case of involving distinct number of parameters, we revert to the clogPP term due to Pecka and Ponec [45]. This statistical parameter is the co-logarithm of the probability of finding a linear model involving a certain number of descriptors and objects and having an equal or greater value of the correlation coefficient. It has been recently demonstrated that this is equivalent to the computation of the statistical F term [46]. Higher values of clogPP imply greater model reliability. In general, it would be ideal to find a maximal value for clogPP, indicating how many descriptors must be taken in the model.
| Number of descriptors ( k) | ||||||
|---|---|---|---|---|---|---|
| Model | 1 | 2 | 3 | 4 | 5 | |
| Leave-0-out (MLR) | R2 | 0.611 | 0.778 | 0.879 | 0.948 | 0.965 |
| clogPP | 4.32 | 5.55 | 6.84 | 8.70 | 8.98 | |
| Leave-1-out | R2 | 0.552 | 0.658 | 0.827 | 0.902 | 0.945 |
| clogPP | 3.76 | 3.96 | 5.60 | 6.67 | 7.62 | |
| Leave-2-out | R2 | 0.552 | 0.658 | 0.826 | 0.902 | 0.946 |
| clogPP | 3.76 | 3.76 | 5.59 | 6.68 | 7.63 | |
From Table 3, it seems that the most the number of variables increases, the best the equations obtained seems to be. This is a typical result and in some cases a maximum value of R2 or clogPP can be achieved along a series in k or in n. In the particular case shown here such a maximum value is not found, but some L1O and L2O results are identical as the same final models are selected.
By contrast, when algorithm B is executed, the prediction performance varies irregularly, as it can be seen in Table 4. ITS results in Table 4 present a qualitative and quantitative improvement when 5 descriptors are being considered in the obtaining of internal models (combinations of 6 descriptors where not tested due to the big computation time required). This shows how ITS procedures are distinct in nature from simple overall fitting approaches. Authors interpret that the nature of the present QSAR problem needs the inclusion of at least 5 descriptors in order to deal with the molecular diversity and to achieve an acceptable molecule-property relationship description. This is revealed by the ITS procedure, as it forces to make individual and transparent predictions for each one of the compounds. The ITS algorithm can be refined implementing an overall L2O or higher protocols (making predictions for a couple or more molecules at a time) in step number 1. However, according to our experience the results of L2O are only slightly different from the results of L1O and they will not be shown here. Furthermore, in our case this was not necessary since at the L1O level a quantitative and instructive leap is already found when passing from k = 3 to 4 as presented in Table 4. The best models are the ones involving 5 descriptors considering internal L0O (ordinary MLR) or L2O models (L3O models are much more time consuming and have not been explored here).
| Number of descriptors ( k) | ||||||
|---|---|---|---|---|---|---|
| Model | 1 | 2 | 3 | 4 | 5 | |
| Leave-0-out (MLR) | R2 | 0.044 | 0.140 | 0.003 | 0.525 | 0.695 |
| clogPP | 0.43 | 0.56 | 0.00 | 1.73 | 2.56 | |
| Leave-1-out | R2 | 0.044 | 0.044 | 0.016 | 0.210 | 0.659 |
| clogPP | 0.43 | 0.16 | 0.02 | 0.36 | 2.25 | |
| Leave-2-out | R2 | 0.094 | 0.044 | 0.016 | 0.211 | 0.676 |
| clogPP | 0.73 | 0.17 | 0.02 | 0.36 | 2.39 | |
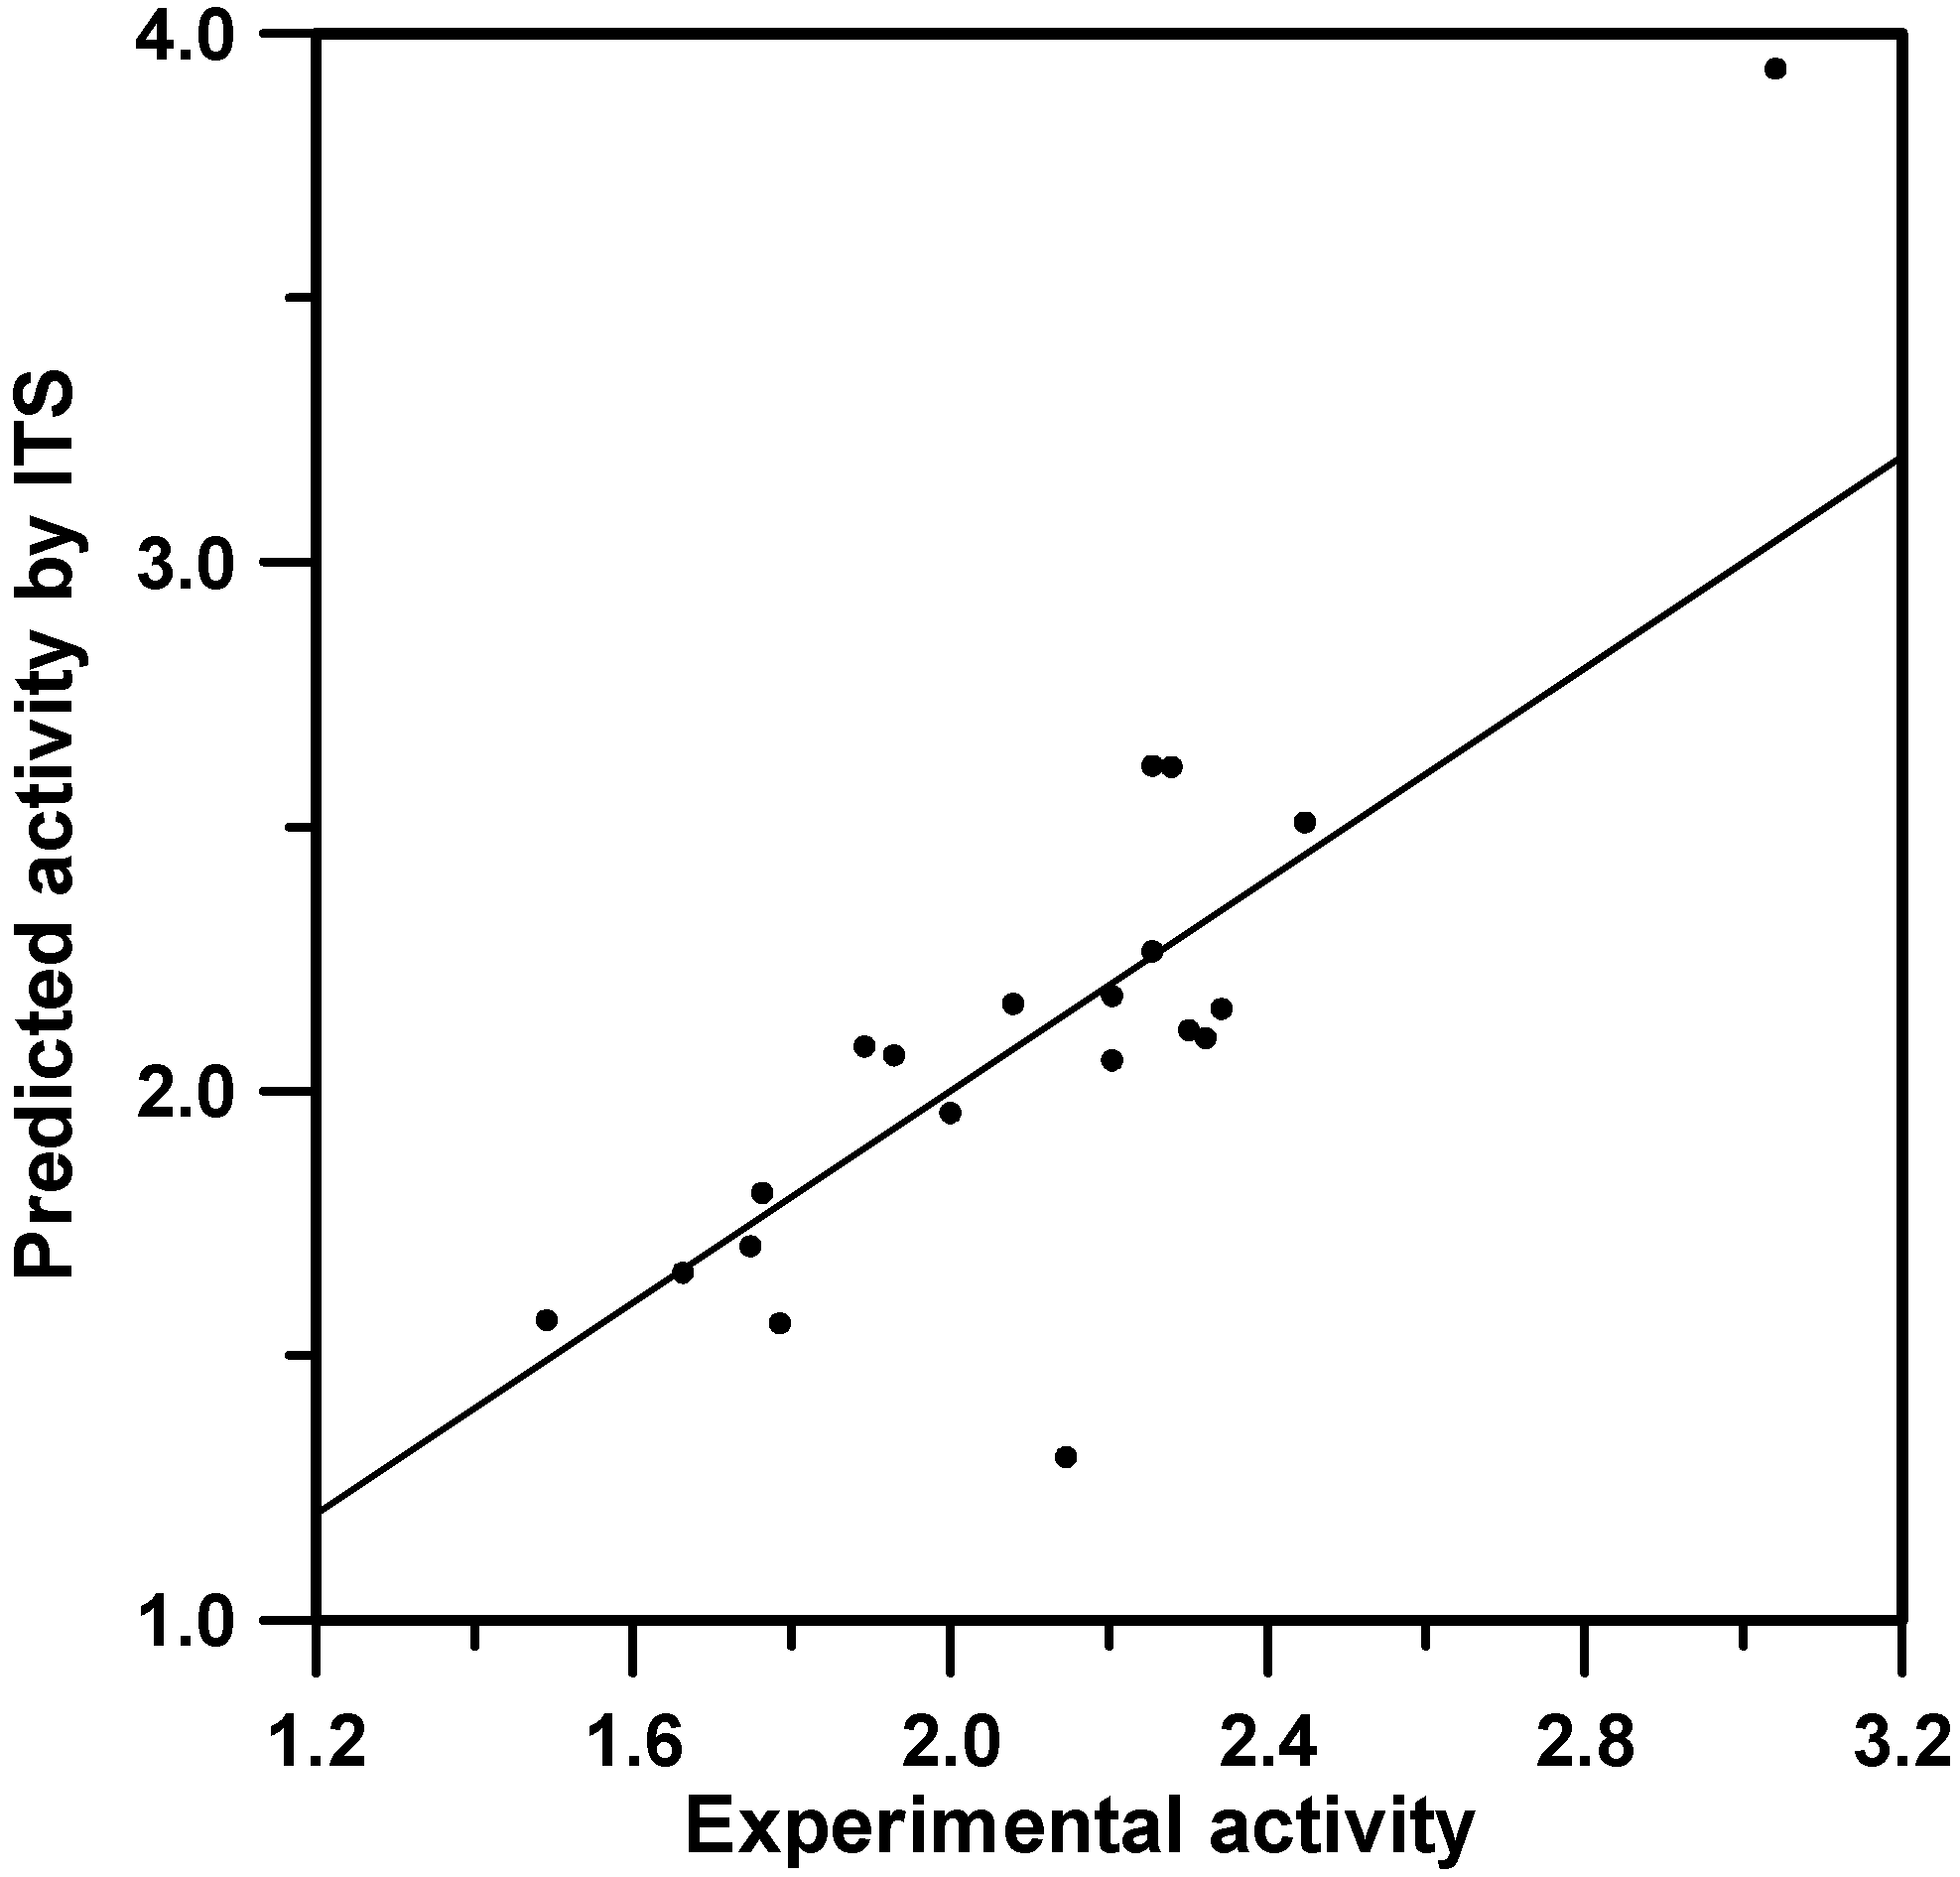
Figure 1.
The predictions obtained from the model involving 5 descriptors for the ITS-L1O procedure. Internal models where obtained by ordinary MLR. R2=0.695, clogPP=2.56.
Figure 1.
The predictions obtained from the model involving 5 descriptors for the ITS-L1O procedure. Internal models where obtained by ordinary MLR. R2=0.695, clogPP=2.56.

For instance, the predictions obtained by the MLR models are displayed in Figure 1. Similar results are obtained by the L1O or L2O models. It must be noted that in Figure 1, each depicted point corresponds to a single prediction and is attached to a particular MLR equation model. Thus, in fact we are dealing with 20 distinct models. This constitutes another advantage of ITS methodologies: as it provides many equations, the possibility of performing a statistical study is open. For the particular case we are dealing with, predictions are reasonable except for two cases. The first one, the most diverging point, is attached to entry 1 in Table 1, which corresponds to the structure having not only an extreme value for the biological property, but also presenting the unique acyclic R,R structure (see Table 1). The second case corresponds to the entry number 20 in Table 1. Visually, there is no structural evidence to consider this molecule as a special case. This shows how the ITS protocol helps to detect outliers: the fist one possibly due to structural reasons or to the fact of being an extrapolation, the second one due to non evident reasons related to descriptor or model deficiencies.
Table 5 shows the frequency with which every index appears in the final 20 models involving 5 descriptors each. As it can be seen in the table, only 12 descriptors appear in models more than once. In Table 5 the data are sorted according to the number of times the index was selected in models. The indices G5, J3v, 3Cc, QG3 and 3χp are the most often used. Additionally, in all the cases in the table each index appears in models preserving the corresponding coefficient sign. This feature constitutes an indicator for model robustness and, additionally, permits to qualitatively correlate each index with the experimental property variation.
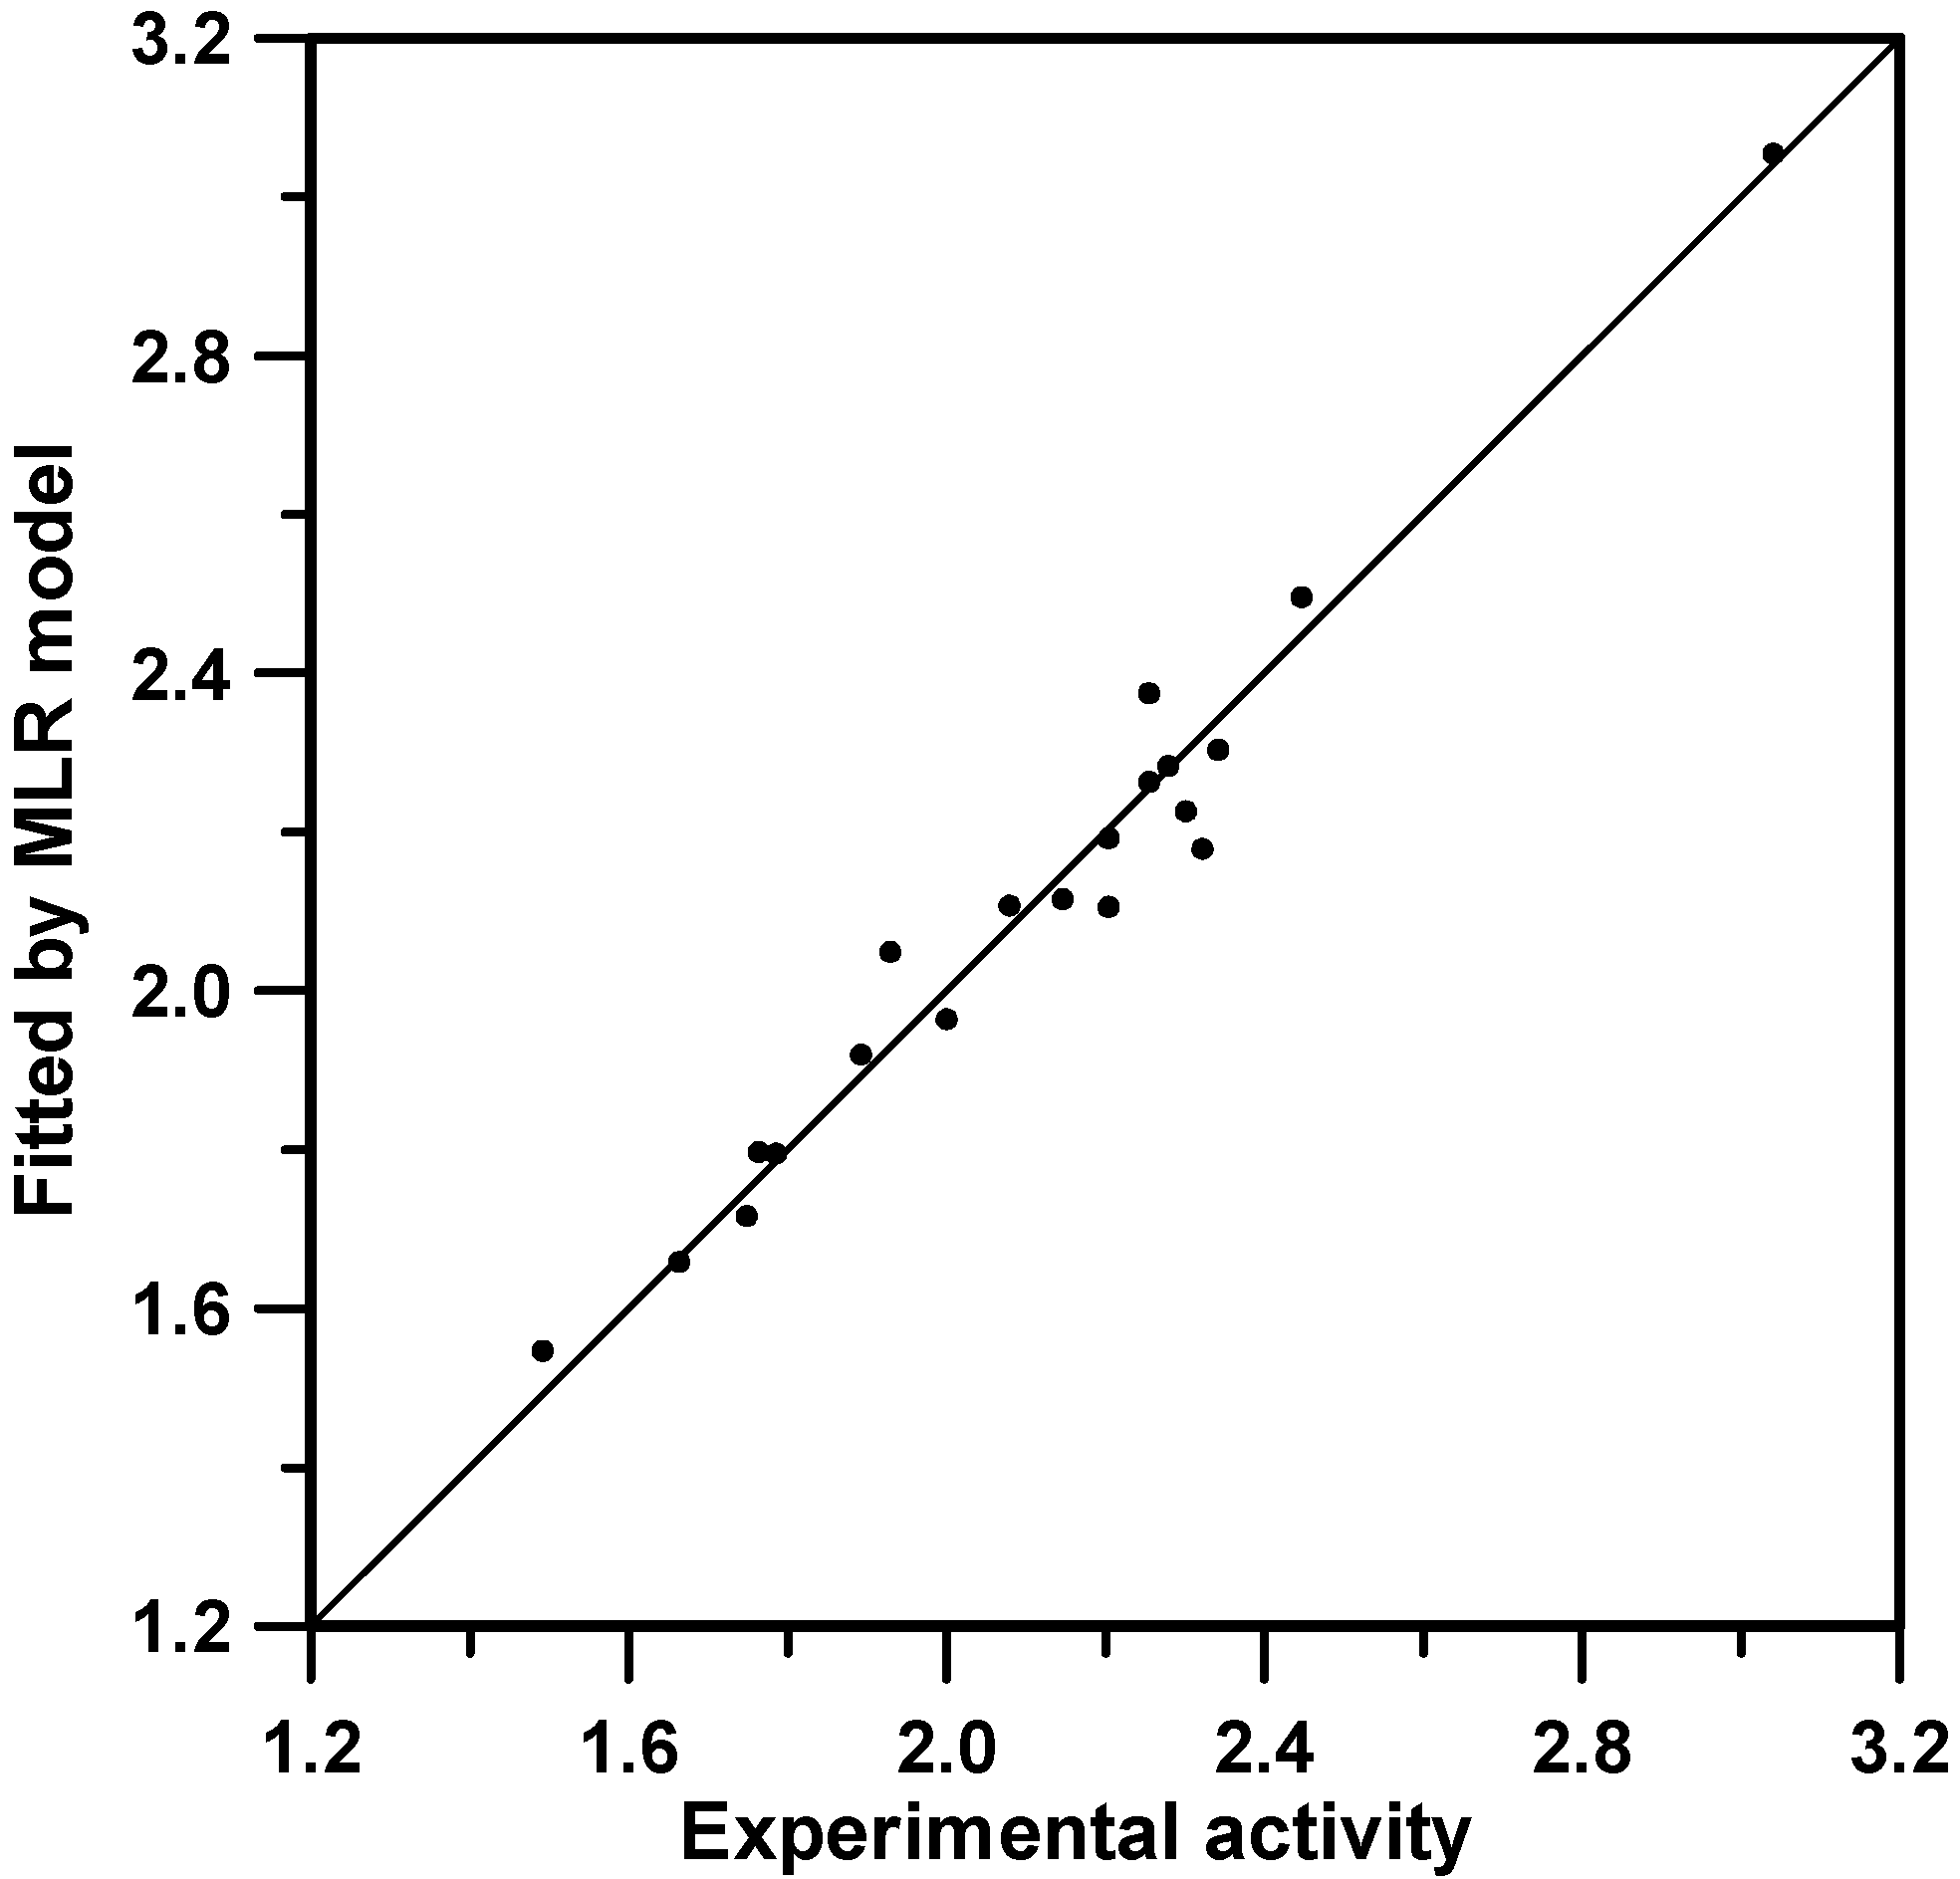
Actually, the model involving the 5 most voted descriptors in Table 5 coincides with the one presented in Table 3 for a L0O (MLR) procedure. Equation 1 below shows the explicit model formula and the attached statistical data. Figure 2 shows the corresponding adjusted predictions against the experimental ones. For this particular case, it is revealed that Equation 1 could be obtained in advance by the first numerical investigations which were carried out (Table 3), but ITS method allowed us to corroborate that the selected model bears extra value due to the coefficients sign stability and the popularity along all the individual models surveyed in Table 5.
Table 5.
Frequency of use of the indices along the 20 MLR models of 5 descriptors selected by Algorithm B.
| Cardinal | Index | Frequency of use | Coefficient sign |
|---|---|---|---|
| 1 | G5 | 16 | – |
| 2 | J3v | 14 | + |
| 3 | 3Cc | 12 | + |
| 4 | QG3 | 12 | – |
| 5 | 3χp | 10 | + |
| 6 | E3 | 3 | + |
| 7 | G4 | 3 | – |
| 8 | J3 | 3 | + |
| 9 | G3v | 3 | + |
| 10 | 4Cpc | 2 | + |
| 11 | J5 | 2 | + |
| 12 | 4Qc | 2 | – |
Equation 1. Global MLR model involving the 5 descriptors selected in the ITS-L1O procedure. Coefficient intervals are given at the 95% confidence level. All significance levels for coefficients are less than 0.3% (probability for each coefficient to be zero).
Log(IC50/nM) = 0.241563(±0.077253) 3χp – 2.23930(±0.47090) G5 + 35.3656(±5.8769) J3v + 0.798064(±0.165968) 3Cc – 0.825473(±0.482103) QG3 – 2.78771(±1.25679) n=20, R2=0.965 (clogPP=8.98), F=77.59, p<0.00001.
Figure 2.
Fitting results obtained by using Equation 1.

Conclusion
A QSAR study of a set of antimalarial agents has been performed. It has been shown that the reliability of the resulting model is crucially influenced by its quality. Standard MLR Leave-n-out procedures with supervision have a much lower predictive power than allowing the process to be unsupervised. This is especially due to hidden overparametrization or instability problems. The last choice implemented in terms of Internal Tests Sets protocol, also prevents from these eventual problems and can be additionally useful for outlier detection. ITS models are more valuable because they can perform potentially well in interpolations and extrapolation predictions.
Acknowledgements
The authors acknowledge the financial of this research to the Red Temática de Investigación Cooperativa RICET (Red de Investigación de Centros de Enfermedades Tropicales C03/04) of the Spanish Ministry of Health. It is also acknowledged the support by the grant number BQU2003-07420-C05 of the Ministerio de Ciencia y Tecnología within the Spanish Plan Nacional I+D. Three anonymous referees are also acknowledged for their kind comments and suggestions that improved the presentation of this article.
References
- Biagini, G.A.; O'Neill, P.M.; Nzila, A.; Ward, S.A.; Bray, P.G. Antimalarial chemotherapy: young guns or back to the future? Trends Parasitol. 2003, 19, 479–487. [Google Scholar] [CrossRef]
- Kier, L.B.; Hall, L.H. Molecular Connectivity in Chemistry and Drug Research; Academic Press: New York, 1976. [Google Scholar]
- Pogliani, L. From molecular connectivity indices to semiempirical connectivity terms: Recent trends in graph theoretical descriptors. Chem. Rev. 2000, 100, 3827–3858. [Google Scholar] [CrossRef]
- Estrada, E.; Uriarte, E. Recent Advances on the Role of Topological Indices in Drug Discovery Research. Curr. Med. Chem. 2001, 8, 1573–1588. [Google Scholar] [CrossRef]
- Gozalbes, R.; Doucet, J.P.; Derouin, F. Application of topological descriptors in QSAR and drug design. Curr. Drug Targets Infect. Disord. 2002, 2, 93–102. [Google Scholar] [CrossRef]
- Basak, S.C.; Gute, B.D.; Grunwald, G. A Comparative Study of Topological and Geometric Parameters in Estimating Normal Boiling Point and Octanol/Water Partition Coefficient. J. Chem. Inf. Comput. Sci. 1996, 36, 1054–1060. [Google Scholar] [CrossRef]
- Tomovic, Z.; Gutman, I. Modeling boiling points of cycloalkanes by means of iterated line graph sequences. J. Chem. Inf. Comput. Sci. 2001, 41, 1041–1045. [Google Scholar] [CrossRef]
- Pogliani, L. The Molecular Connectivity Method: A Powerful Tool in the Study of Biologically Relevant Molecules. Curr. Top. Pept. Prot. Res. 1994, 1, 119–134. [Google Scholar]
- Estrada, E.; Patlewicz, G.; Chamberlain, M.; Basketter, D.; Larbey, S. Computer-aided knowledge generation for understanding skin sensitization mechanisms: the TOPS-MODE approach. Chem. Res. Toxicol. 2003, 16, 1226–1235. [Google Scholar] [CrossRef]
- Gálvez, J.; Julián-Ortiz, J.V.; de García-Domenech, R. General topological patterns of known drugs. J. Mol. Graphics Model. 2001, 20, 84–94. [Google Scholar] [CrossRef]
- Murcia-Soler, M.; Pérez-Giménez, F.; García-March, F.J.; Salabert-Salvador, M.T.; Díaz-Villanueva, W.; Castro-Bleda, M.J. Drugs and nondrugs: an effective discrimination with topological methods and artificial neural networks. J. Chem. Inf. Comput. Sci. 2003, 43, 1688–1702. [Google Scholar] [CrossRef]
- Johnson, M.A.; Maggiora, G.M. Concepts and Applications of Molecular Similarity; J. Wiley & Sons: New York, 1990. [Google Scholar]
- Hall, L.H.; Kier, L.B.; Brown, B.B. Molecular Similarity Based on Novel Atom Type Electrotopological State Indices. J. Chem. Inf. Comput. Sci. 1995, 35, 1074–1080. [Google Scholar] [CrossRef]
- Carbo-Dorca, R.; Gironés, X.; Mezey, P.G. The fundamentals of Molecular Similarity; Kluwer Academic/Plenum publishers : New York, 2001. [Google Scholar]
- Ivanciuc, O.; Klein, D.J. Computing wiener-type indices for virtual combinatorial libraries generated from heteroatom-containing building blocks. J. Chem. Inf. Comput. Sci. 2002, 42, 8–22. [Google Scholar] [CrossRef]
- Kier, L.B.; Hall, L.H.; Frazer, J.W. Design of Molecules from Quantitative Structure-Activity Relationship Models. I Information Transfer Between Path and Vertex Degree Counts. J. Chem. Inf. Comput. Sci. 1993, 33, 143–147. [Google Scholar] [CrossRef]
- Hall, L.H.; Kier, L.B.; Frazer, J.W. Design of Molecules from Quantitative Structure-Activity Relationship Models. II Derivation and Proof of Information Transfer Relating Equations. J. Chem. Inf. Comput. Sci. 1993, 33, 148–152. [Google Scholar] [CrossRef]
- Hall, L.H.; Kier, L.B. Design of Molecules from Quantitative Structure-Activity Relationship Models. III Role of Higher Order Path Counts: Path Three. J. Chem. Inf. Comput. Sci. 1993, 33, 598–603. [Google Scholar] [CrossRef]
- Gálvez, J.; García-Domenech, R.; de Julián-Ortiz, J.V.; Soler., R. Topological approach to drug design. J. Chem. Inf. Comp. Sci. 1995, 35, 272–284. [Google Scholar] [CrossRef]
- Zheng, W.; Cho, S.J.; Tropsha, A. Rational Combinatorial Design. 1. Focus 2-D: A New Approach to the Design of Targeted Combinatorial Chemical Libraries. J. Chem. Inf. Comput. Sci. 1998, 38, 251–258. [Google Scholar] [CrossRef]
- Zheng, W.; Cho, S.J.; Tropsha, A. Rational Combinatorial Design. 2. Rational Design of Targeted Combinatorial Peptide Libraries Using chemical Similarity Probe and Inverse QSAR Approaches. J. Chem. Inf. Comput. Sci. 1998, 38, 259–268. [Google Scholar] [CrossRef]
- Jaén-Oltra, J.; Salabert-Salvador, M.T.; García-March, F.J.; Pérez-Giménez, F.; Tomás, F. Artificial neural network applied to prediction of fluorquinolone antibacterial activity by topological methods. J. Med. Chem. 2000, 43, 1143–1148. [Google Scholar] [CrossRef]
- Mut-Ronda, S.; Salabert-Salvador, M.T.; Duart, M.J.; Antón-Fos, G.M. Search compounds with antimicrobial activity by applying molecular topology to selected quinolones. Bioorg. Med. Chem. Lett. 2003, 13, 2699–2702. [Google Scholar] [CrossRef]
- Besalú, E.; Ponec, R.; Julián-Ortiz, J.V. de Virtual generation of agents against Mycobacterium tuberculosis. A QSAR study. Mol. Divers. 2003, 6, 107–120. [Google Scholar]
- García-García, A.; Gálvez, J.; de Julián-Ortiz, J.V.; García-Domenech, R.; Muñoz, C.; Guna, R.; Borrás, R. New agents active against Mycobacterium avium complex selected by molecular topology: a virtual screening method. J. Antimicrob. Chemother. 2004, 53, 65–73. [Google Scholar]
- Bruno-Blanch, L.; Gálvez, J.; García-Domenech, R. Topological virtual screening: a way to find new anticonvulsant drugs from chemical diversity. Bioorg. Med. Chem. Lett. 2003, 13, 2749–2754. [Google Scholar] [CrossRef]
- Hall, L.M.; Hall, L.H.; Kier, L.B. Modeling drug albumin binding affinity with e-state topological structure representation. J. Chem. Inf. Comput. Sci. 2003, 43, 2120–2128. [Google Scholar] [CrossRef]
- Luco, J.M. Prediction of the brain-blood distribution of a large set of drugs from structurally derived descriptors using partial least-squares (PLS) modeling. J. Chem. Inf. Comput. Sci. 1999, 39, 396–404. [Google Scholar] [CrossRef]
- Estrada, E.; Quincoces, J.A.; Patlewicz, G. Creating molecular diversity from antioxidants in Brazilian propolis. Combination of TOPS-MODE QSAR and virtual structure generation. Mol. Divers. 2004, 8, 21–33. [Google Scholar] [CrossRef]
- Torrens, F. A new topological index to elucidate apolar hydrocarbons. J. Comput.-Aided Mol. Design 2001, 15, 709. [Google Scholar] [CrossRef]
- Besalú, E.; Gironés, X.; Amat, L.; Carbó-Dorca, R. Molecular quantum similarity and the fundamentals of QSAR. Acc. Chem. Res. 2002, 35, 289–295. [Google Scholar] [CrossRef]
- Golbraikh, A.; Bonchev, D.; Tropsha, A. Novel ZE-isomerism descriptors derived from molecular topology and their application to QSAR analysis. J. Chem. Inf. Comput. Sci. 2002, 42, 769–787. [Google Scholar] [CrossRef]
- Basak, S.C.; Mills, D.R.; Balaban, A.T.; Gute, B.D. Prediction of mutagenicity of aromatic and heteroaromatic amines from structure: a hierarchical QSAR approach. J. Chem. Inf. Comput. Sci. 2001, 41, 671–678. [Google Scholar] [CrossRef]
- Posner, G.H.; O’Dowd, H.; Ploypradith, P.; Cumming, J.N.; Xie, S.; Shapiro, T.A. Antimalarial cyclic peroxy ketals. J. Med. Chem. 1998, 41, 2164–2167. [Google Scholar] [CrossRef]
- Posner, G.H.; González, L.; Cumming, J.N.; Klinedinst, D.; Shapiro, T.A. Synthesis and antimalarial activity of heteroatom-containing bicyclic endoperoxides. Tetrahedron 1997, 53, 37–50. [Google Scholar] [CrossRef]
- Wiener, H. Structural determination of Paraffin Boiling. Points. J. Am. Chem. Soc. 1947, 69, 17–20. [Google Scholar] [CrossRef]
- Kier, L.B.; Murray, W.J.; Randiċ, M.; Hall, L.H. Molecular connectivity V: connectivity series concept applied to density. J. Pharm. Sci. 1976, 65, 1226–1230. [Google Scholar] [CrossRef]
- Julián-Ortiz, J.V.D.; Gálvez, J.; Muñoz–Collado, C.; García–Domenech, R.; Gimeno–Cardona, C. Virtual combinatorial syntheses and computational screening of new potential anti-herpes compounds. J. Med. Chem. 1999, 42, 3308–3314. [Google Scholar] [CrossRef]
- Kier, L.B.; Hall, L.H. General definition of valence delta-values for molecular connectivity. J. Pharm. Sci. 1983, 72, 1170–1173. [Google Scholar] [CrossRef]
- Gálvez, J.; García-Domenech, R.; Salabert, M.T.; Soler, R. Charge indexes. New topological descriptors. J. Chem. Inf. Comp. Sci. 1994, 34, 520–525. [Google Scholar] [CrossRef]
- de Julián-Ortiz, J.V.; Besalú, E.; García-Domenech, R. True Prediction by Consensus for Small Sets of Cyclooxigenase-2 Inhibitors. Indian J. Chem., Sect. A. 2003, 42A, 1392–1404. [Google Scholar]
- Whitley, D.C.; Ford, M.G.; Livingstone, D. Unsupervised forward selection: a method for eliminating redundant variables. J. Chem. Inf. Comput. Sci. 2000, 40, 1160–1168. [Google Scholar] [CrossRef]
- Besalú, E. Fast Computation of Cross-Validated Properties in Full Linear Leave-Many-Out. Procedures. J. Math. Chem. 2001, 9, 191–204. [Google Scholar] [CrossRef]
- Livingstone, D.J.; Salt, D.W. Judging the significance of multiple linear regression models. J. Med. Chem. 2005, 48, 661–663. [Google Scholar] [CrossRef]
- Pecka, J.; Ponec, R. Simple Analytical Method for Evaluation of Statistical Importance of Correlations in QSAR Studies. J. Math. Chem. 2000, 27, 13–22. [Google Scholar] [CrossRef]
- Besalú, E.; de Julián-Ortiz, J.V. Equivalence of the Pecka–Ponec correlation probability and the statistical F significance for MLR models. J. Math. Chem. 2004, 36, 361–363. [Google Scholar]
© 2006 by MDPI (http://www.mdpi.org). Reproduction is permitted for noncommercial purposes.
Share and Cite
MDPI and ACS Style
De Julián-Ortiz, J.V.; Besalú, E. Internal Test Sets Studies in a Group of Antimalarials. Int. J. Mol. Sci. 2006, 7, 456-468. https://0-doi-org.brum.beds.ac.uk/10.3390/i8200456
AMA Style
De Julián-Ortiz JV, Besalú E. Internal Test Sets Studies in a Group of Antimalarials. International Journal of Molecular Sciences. 2006; 7(10):456-468. https://0-doi-org.brum.beds.ac.uk/10.3390/i8200456
Chicago/Turabian StyleDe Julián-Ortiz, J. V., and E. Besalú. 2006. "Internal Test Sets Studies in a Group of Antimalarials" International Journal of Molecular Sciences 7, no. 10: 456-468. https://0-doi-org.brum.beds.ac.uk/10.3390/i8200456