
The Exploration of Metallic Deposits Using Satellite Image Processing in the Parwan-Panjsher Area, Afghanistan †


Abstract
:1. Introduction
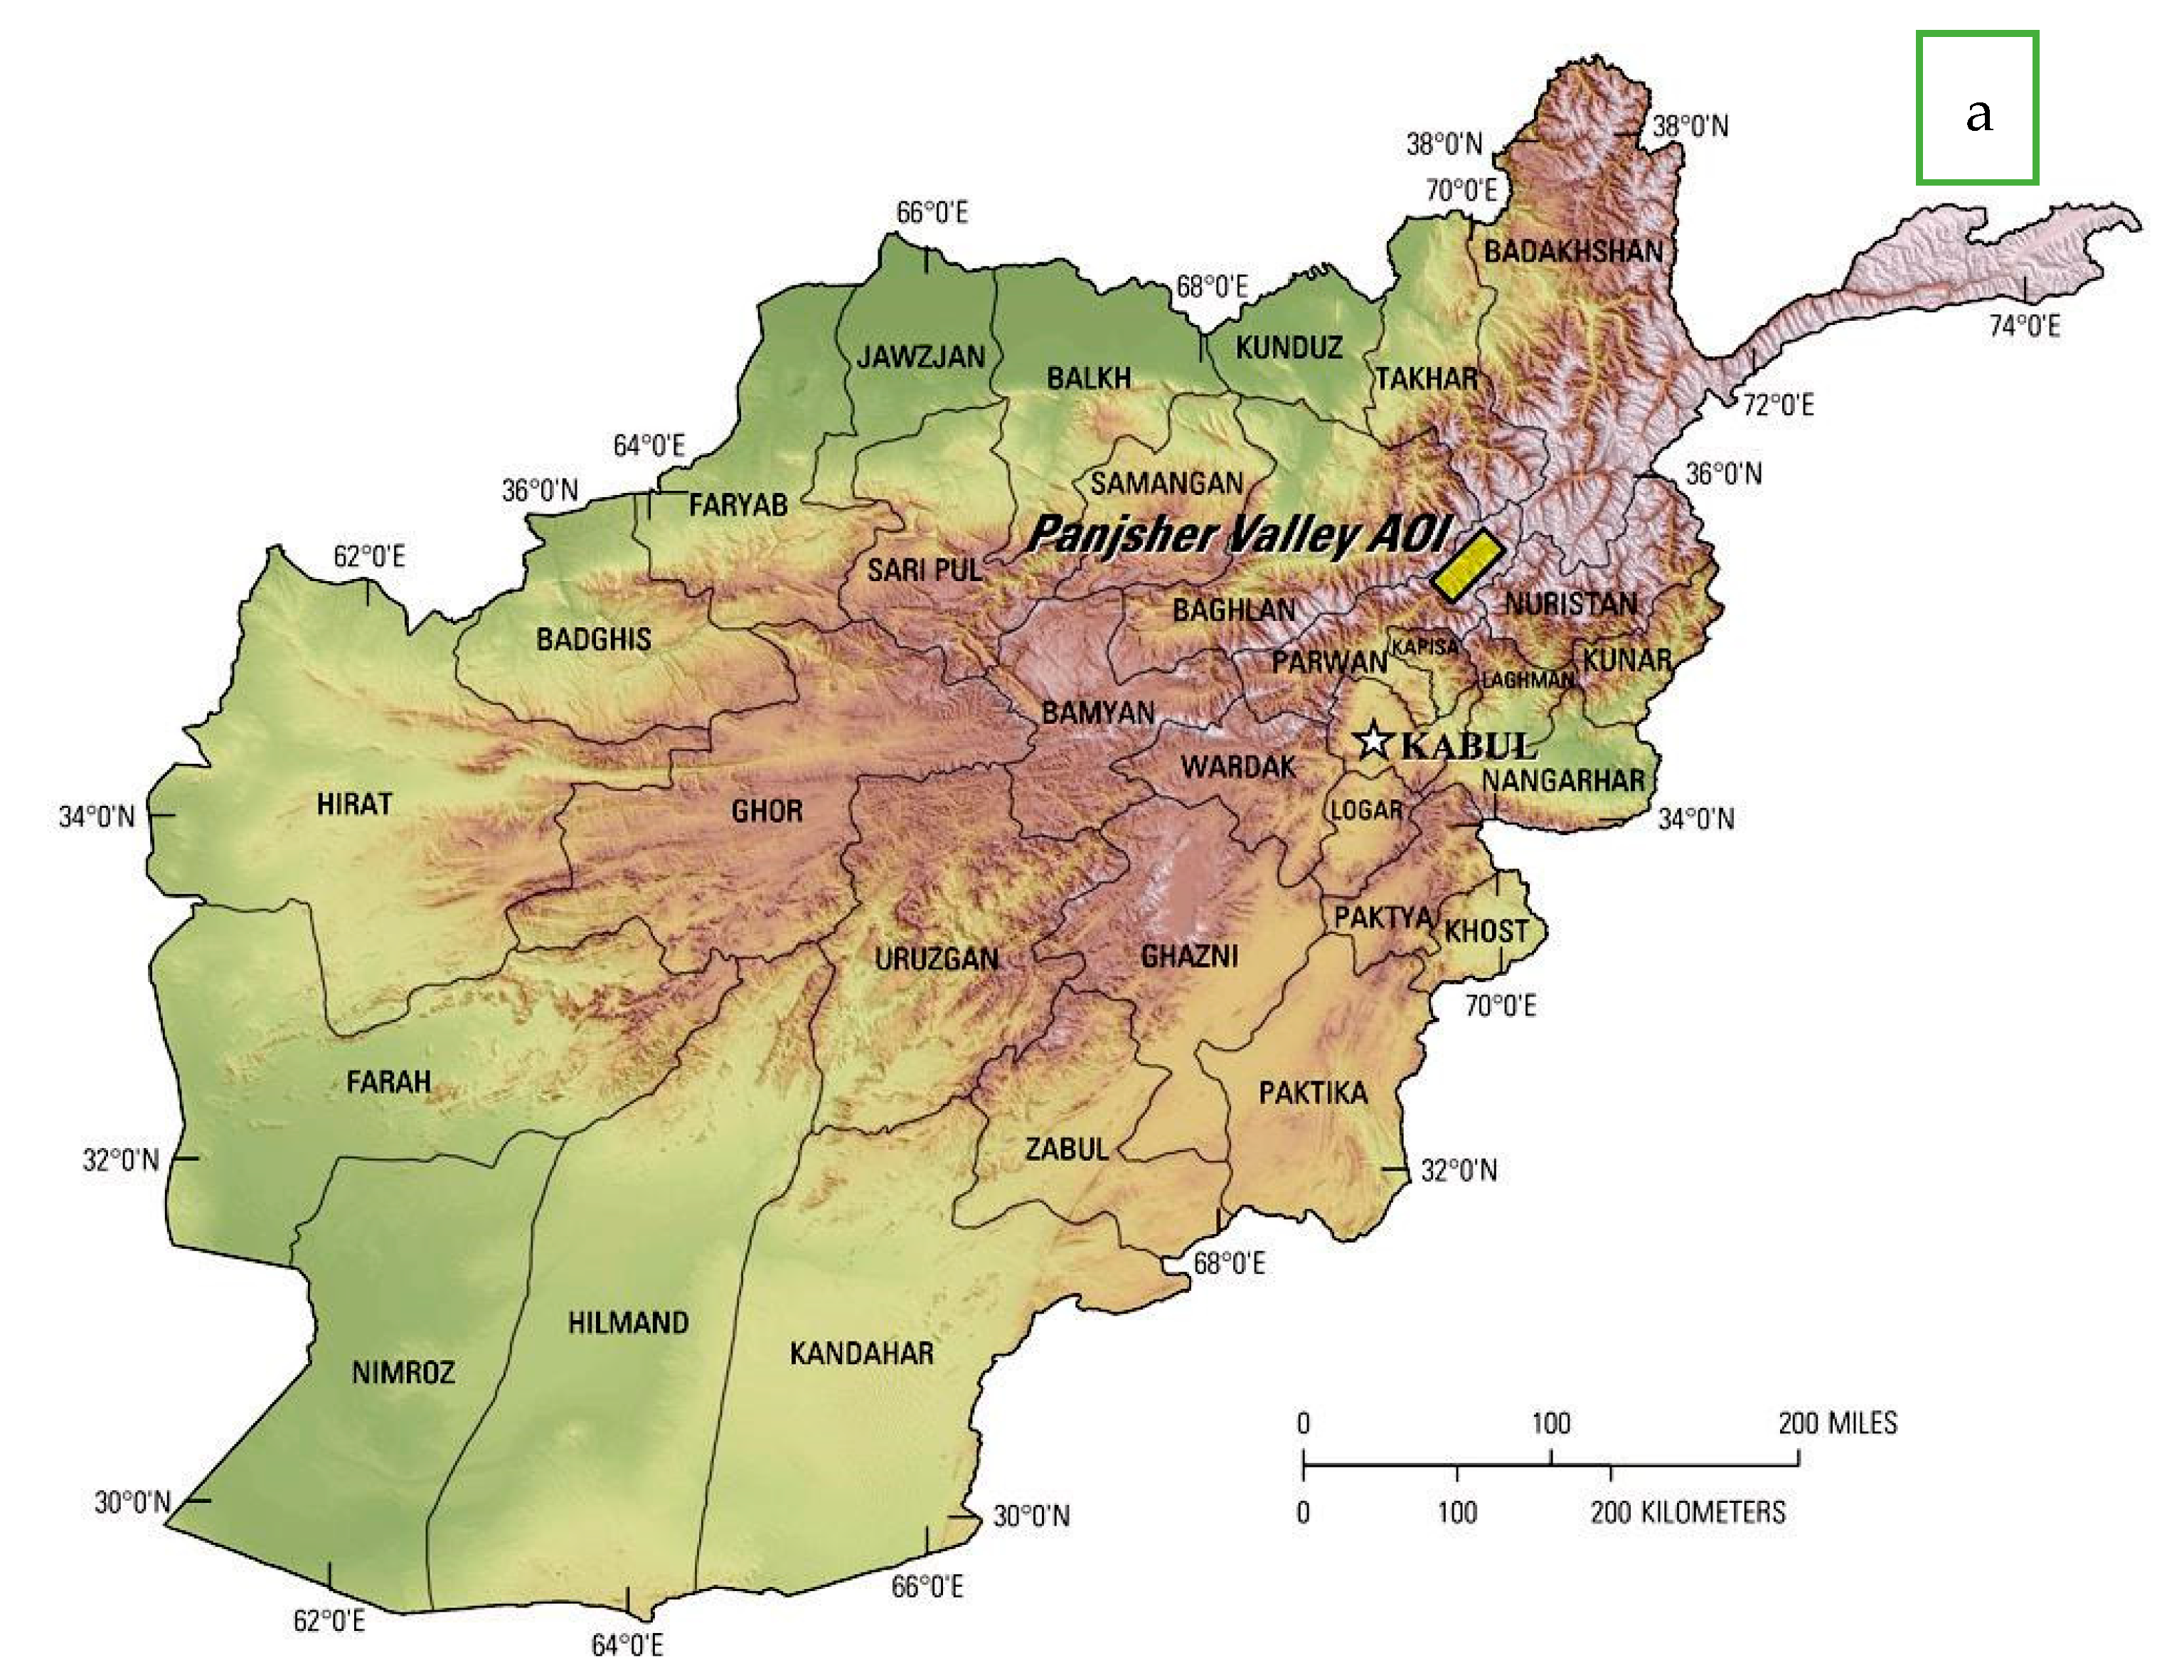
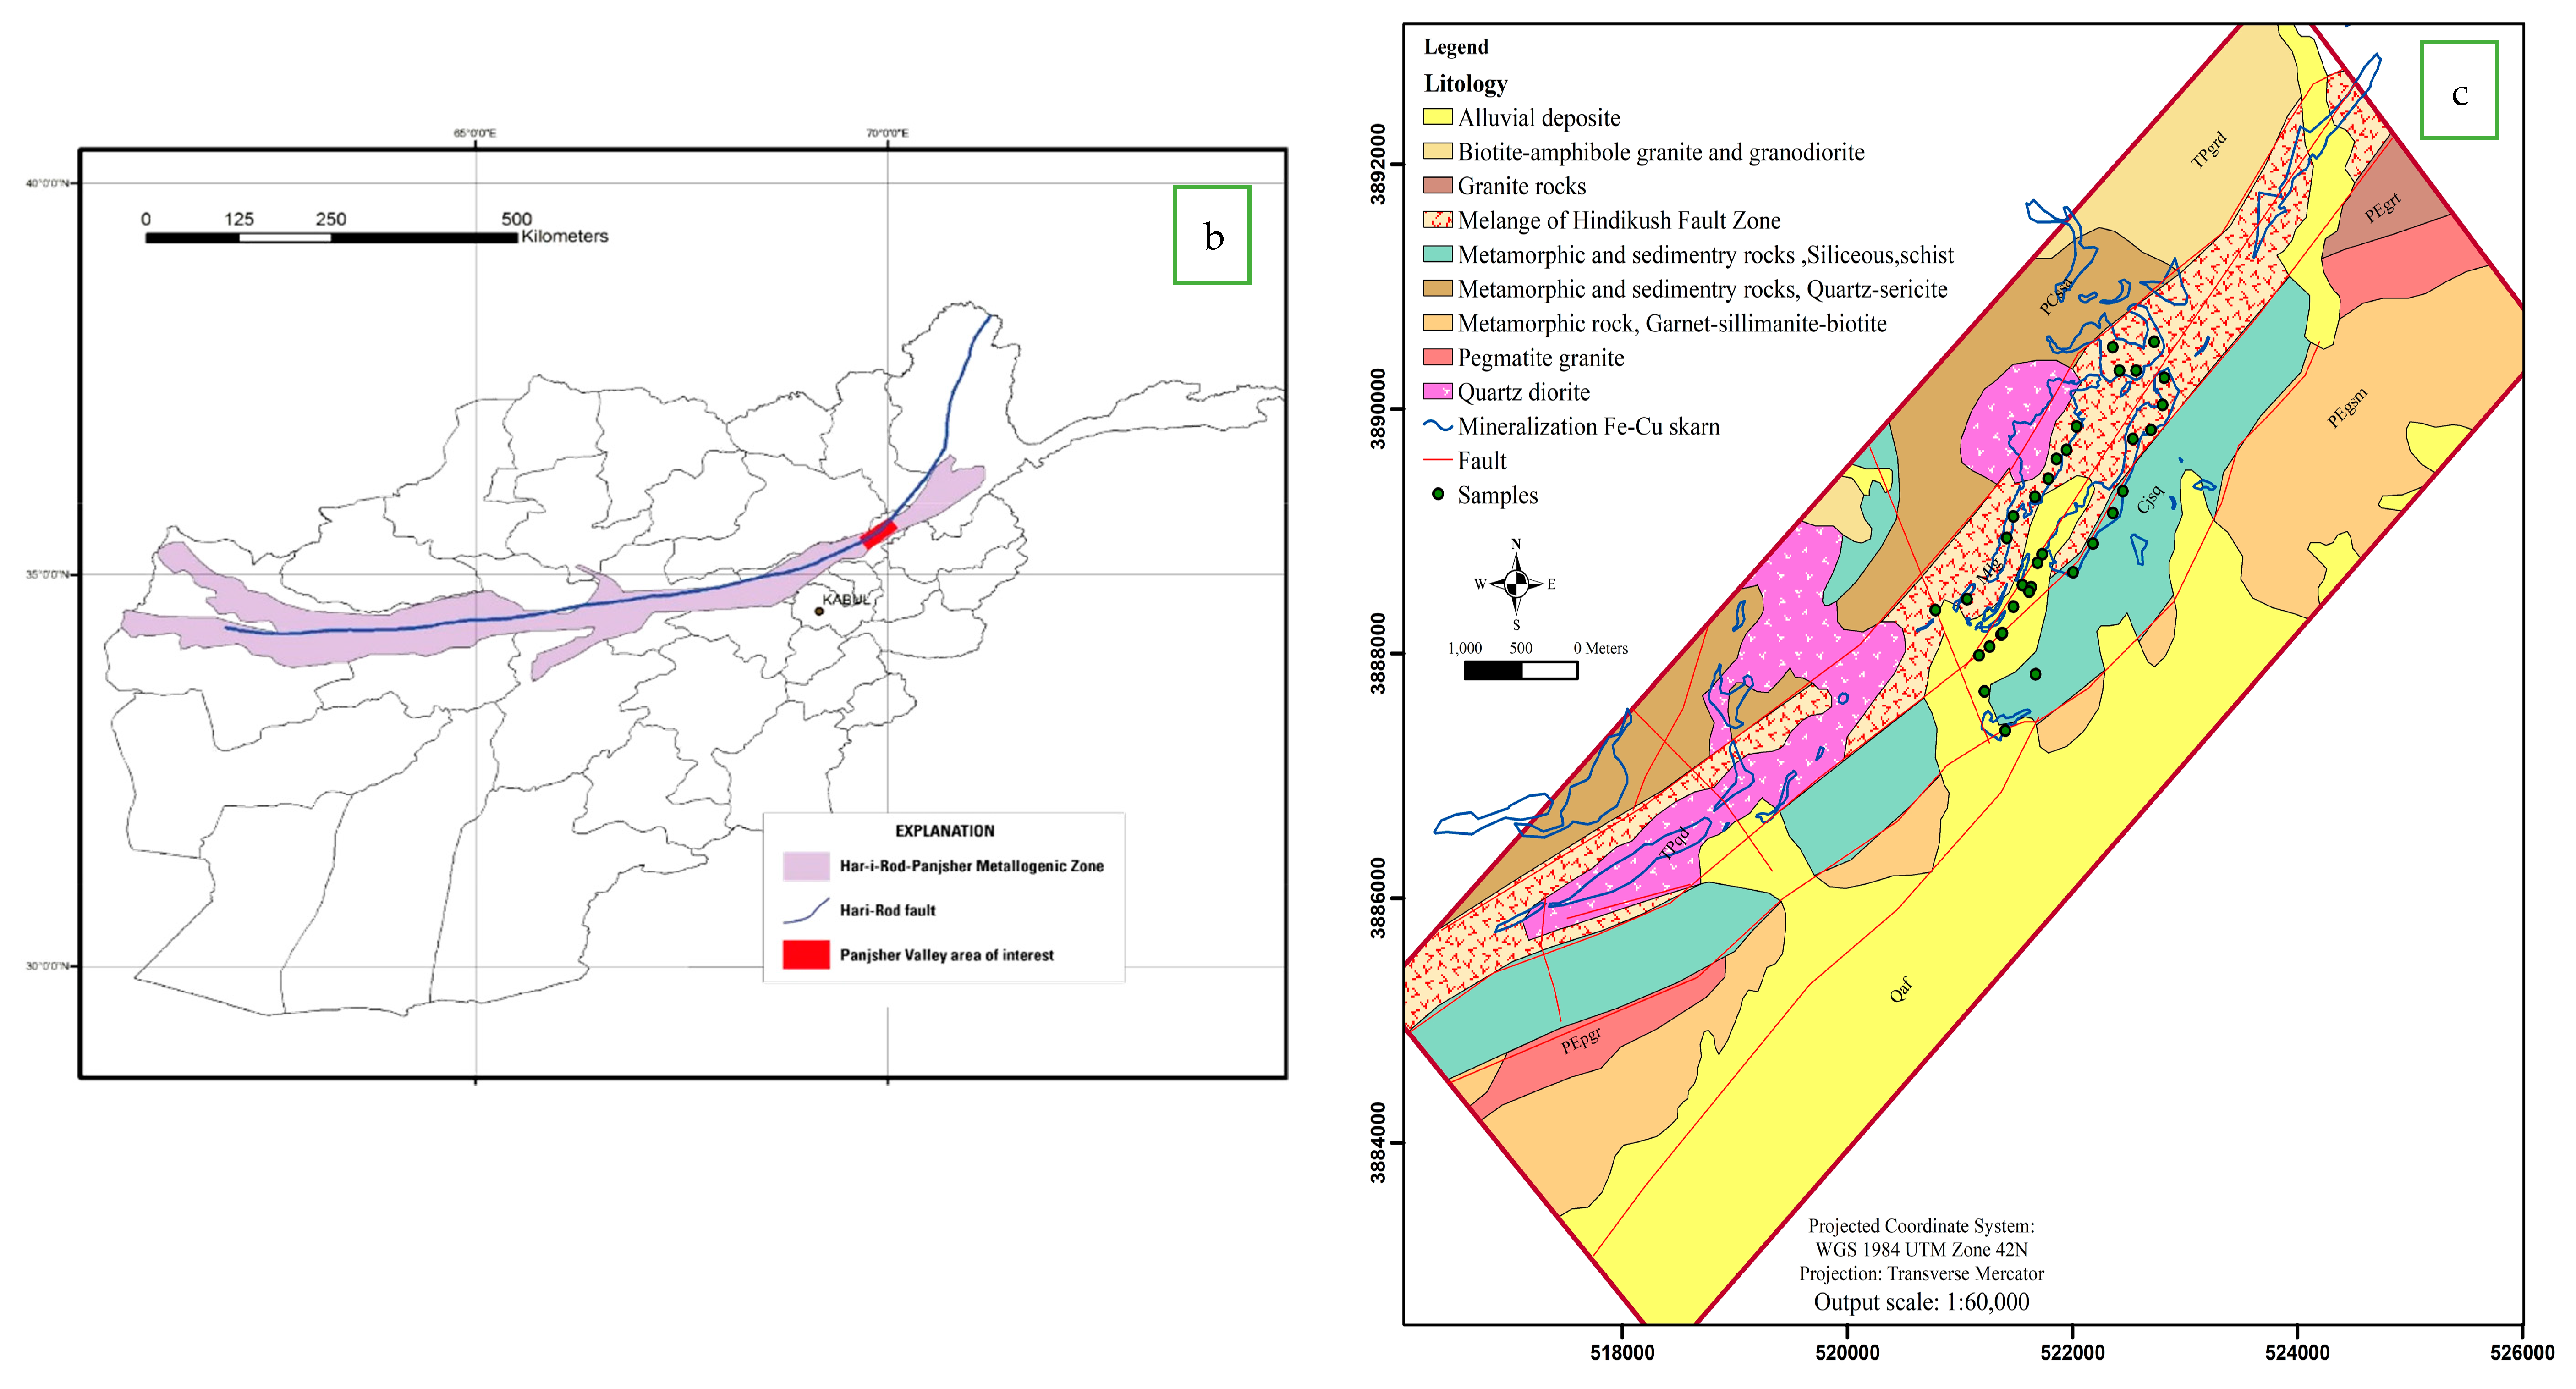
1.1. Regional Geology
2. Material and Methods
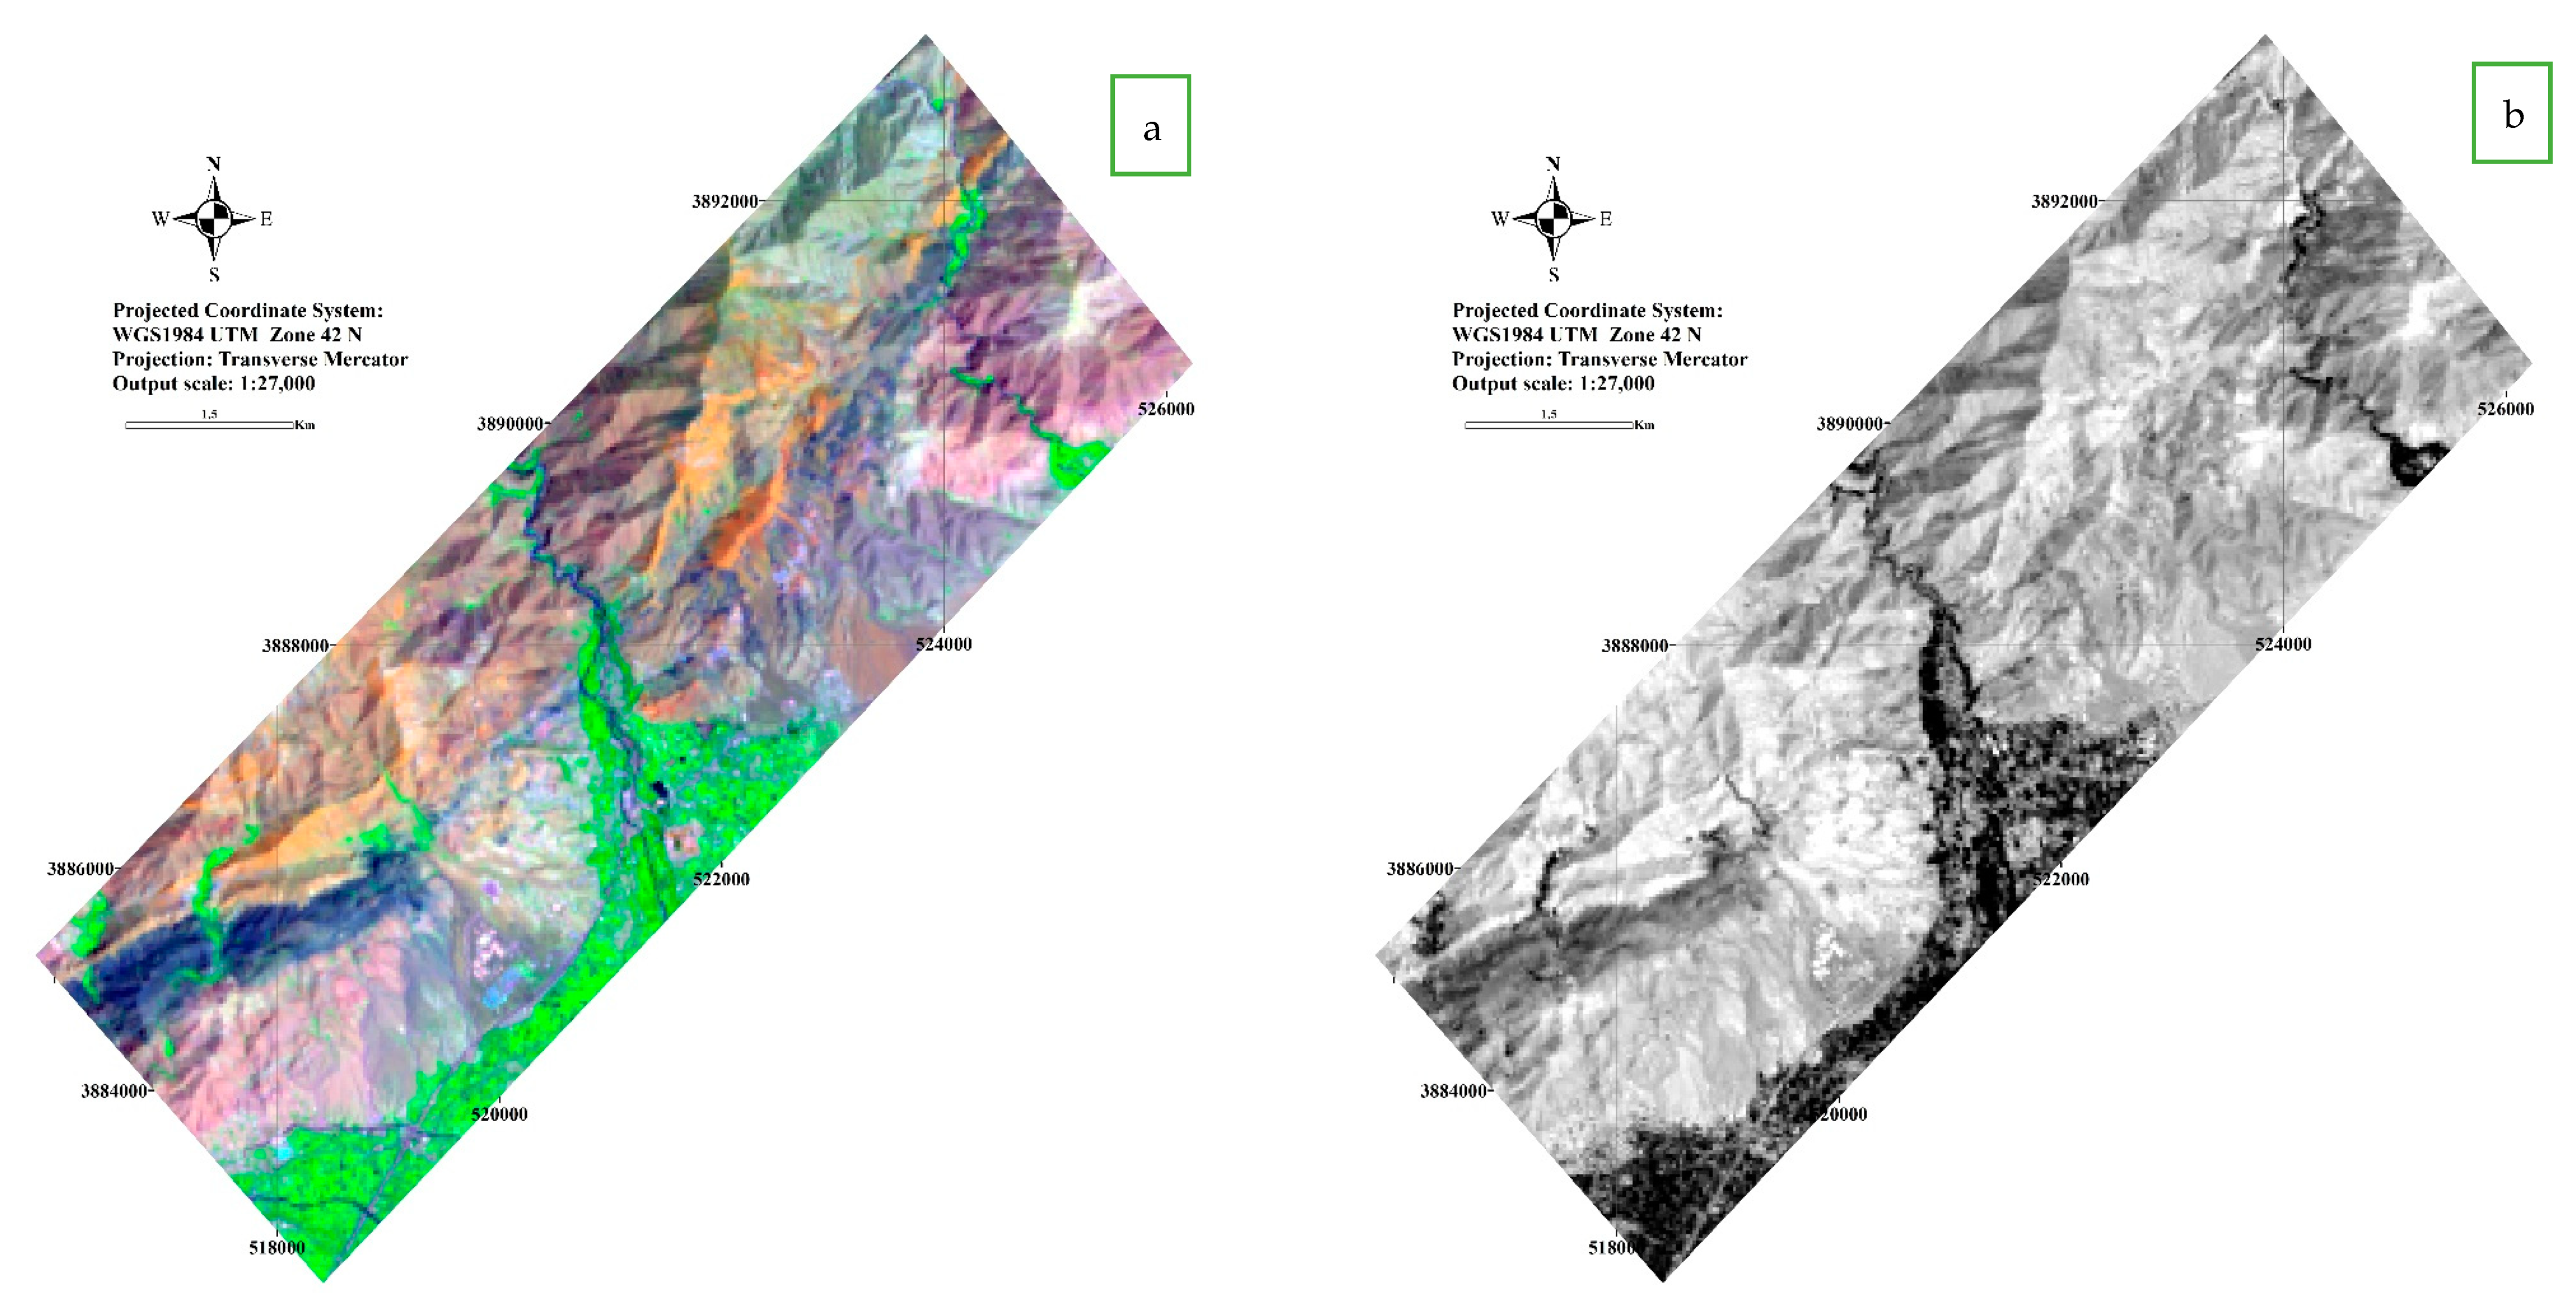
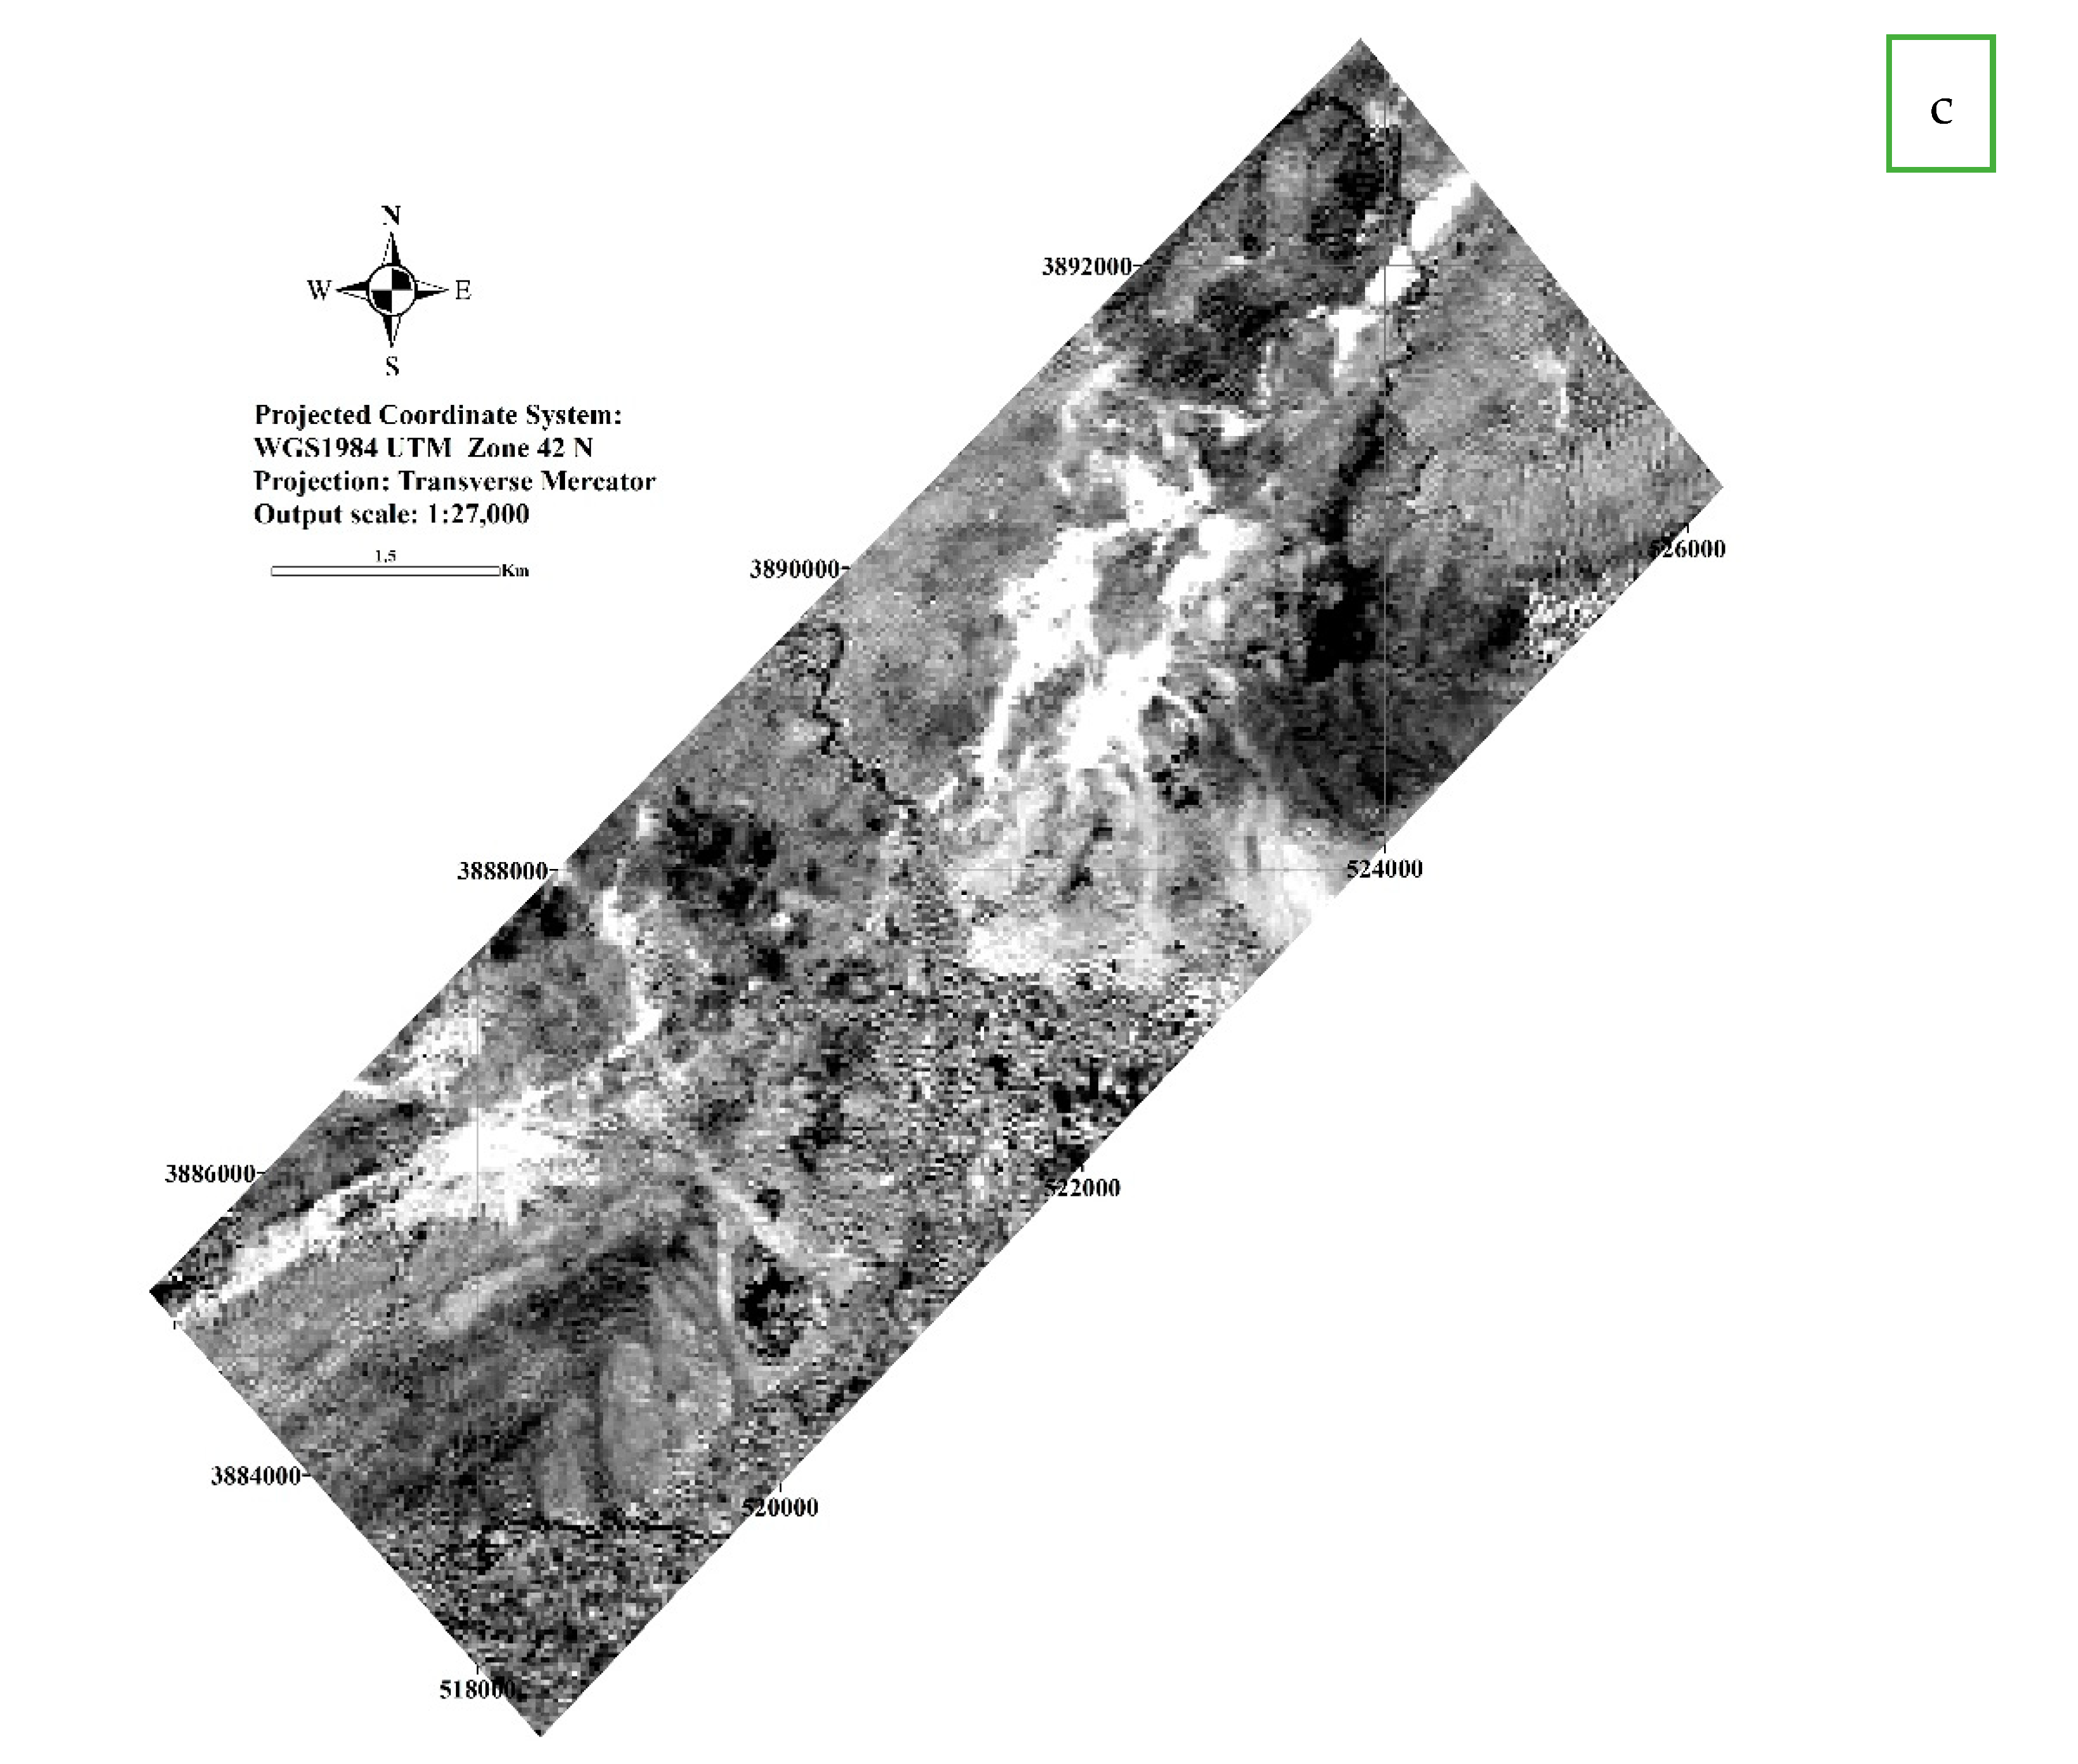
2.1. Remote Sensing
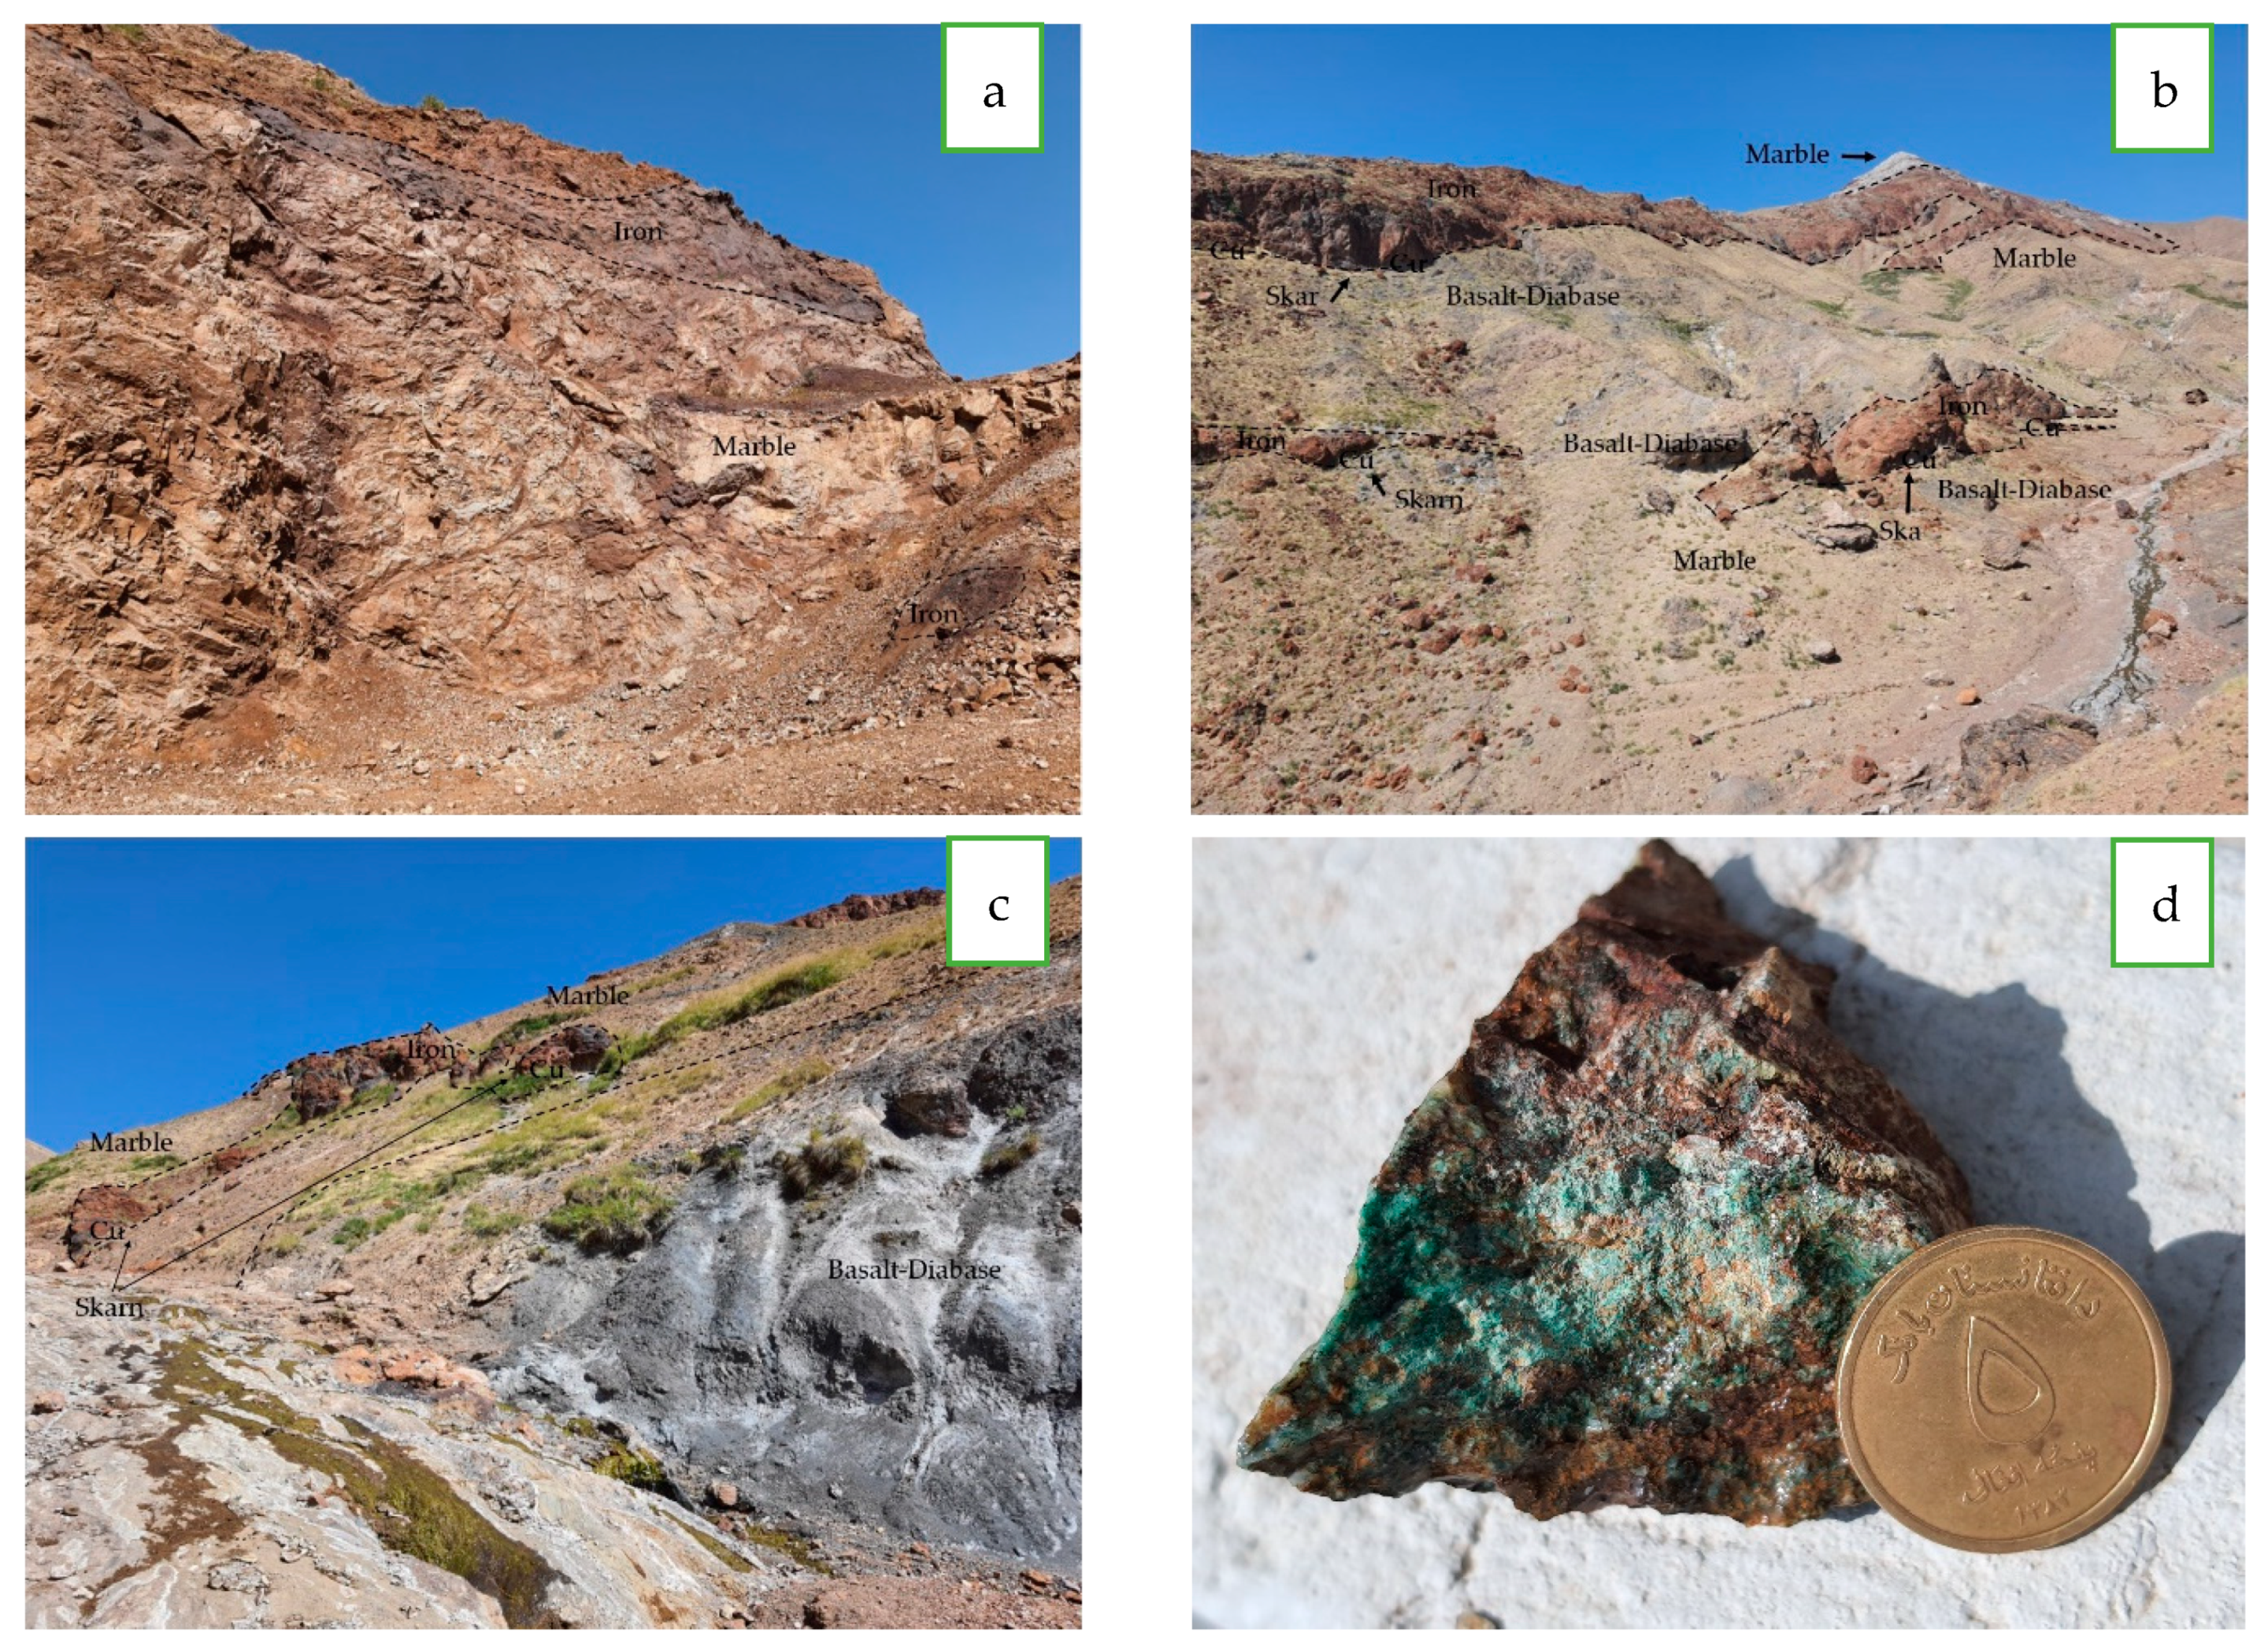
2.2. Mineralization
2.3. Geochemistry
- -
- Silver in lenses containing iron is higher than the skarn zone. The correlation of Fe with Ag in iron lenses is above 0.9.
- -
- According to the correlation (Table 1), there is no positive correlation between the elements of samples collected from iron and skarn mineralization, and there is no good correlation between Fe and Cu. The corresponding correlations between Fe and Cu for samples collected from skarn and iron lenses are 0.4 and -0.25, respectively (Table 1).
- -
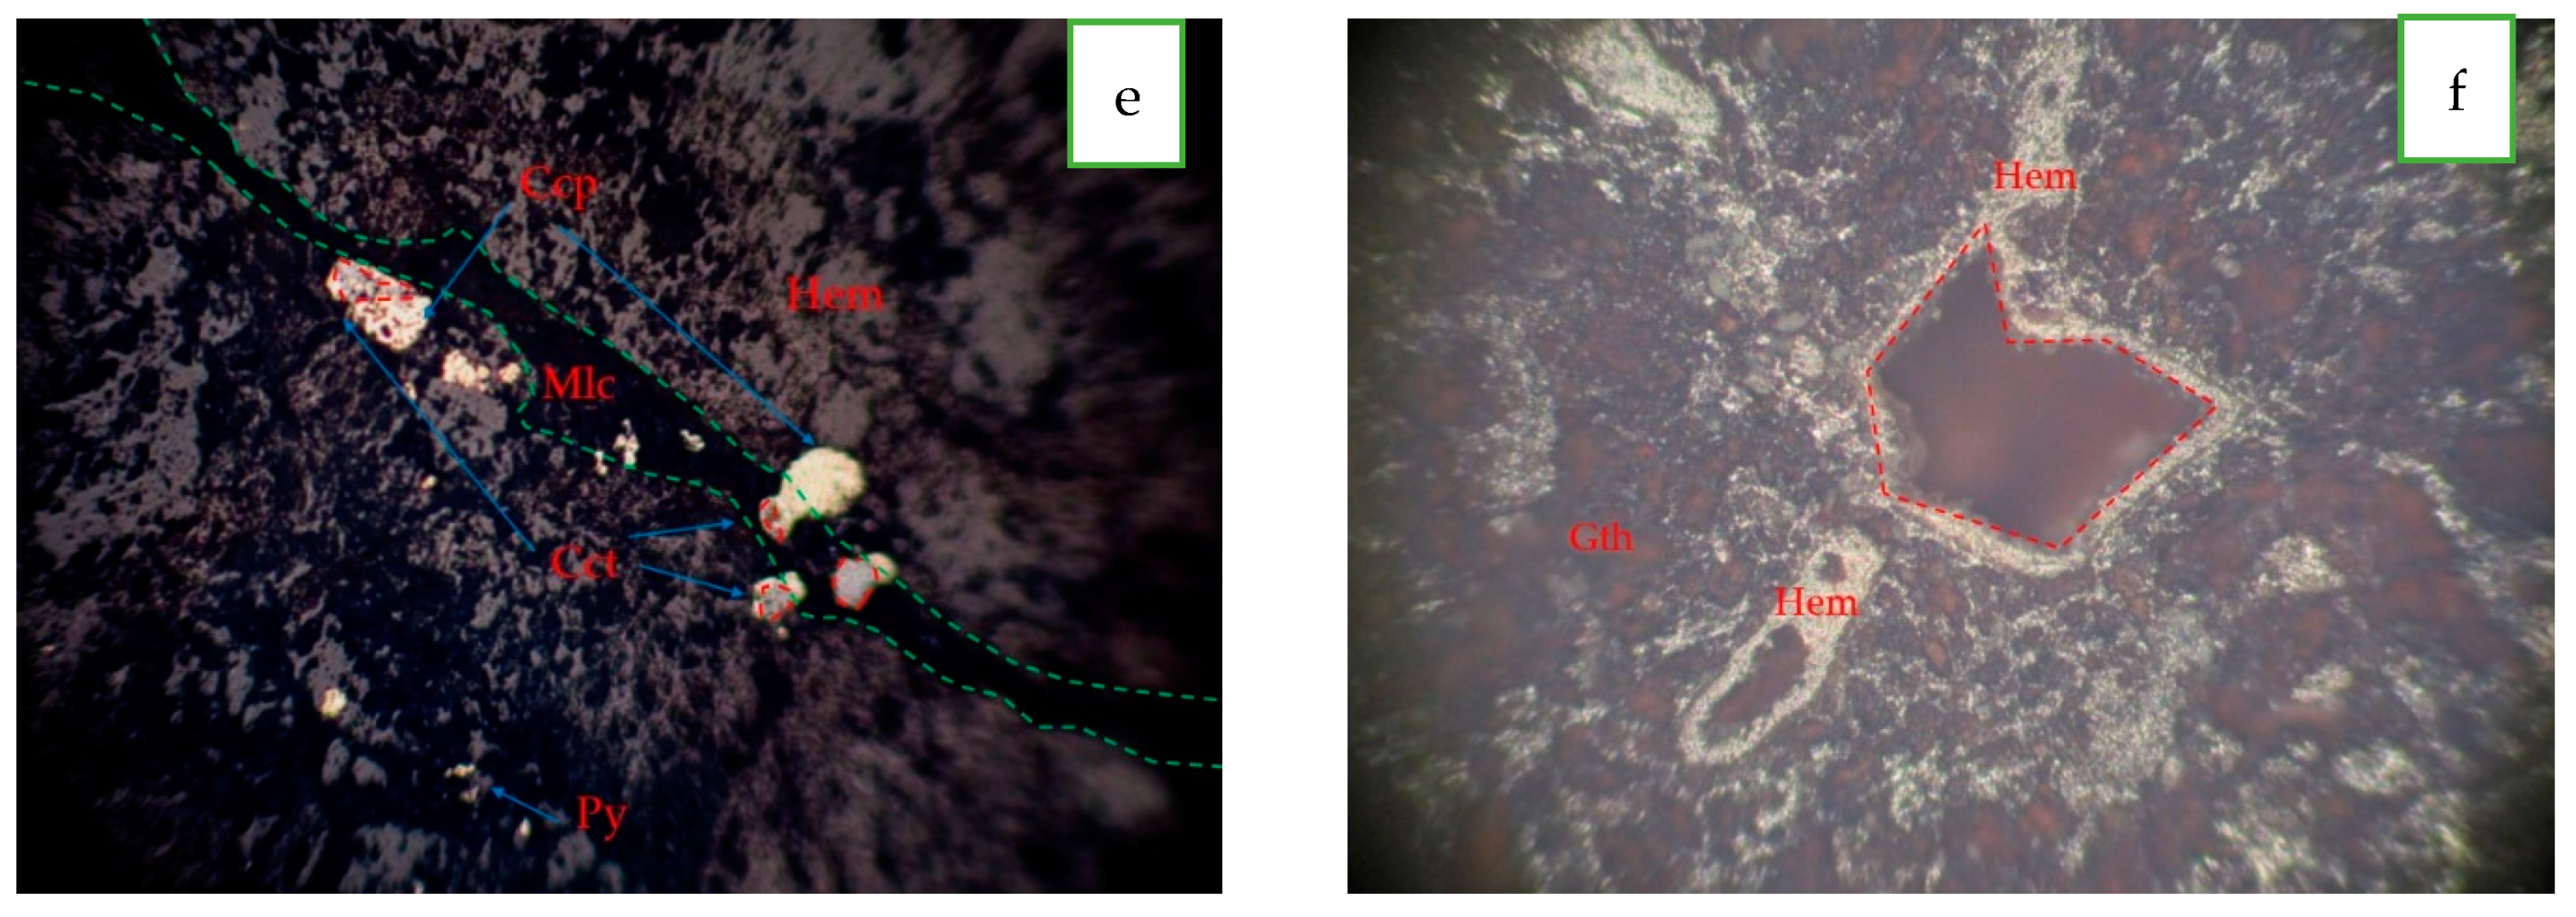
- Some rock samples were collected from the AOI. The chemical analysis results of which were studied by considering of the diagrams using to distinguish between different iron deposits types. The results revealed that the polymetallic deposit in the AOI is in Fe-Cu-(Au) skarn type mineralization [18] (Figure 4).
3. Conclusions
Institutional Review Board Statement
Informed Consent Statement
Data Availability Statement
Acknowledgments
Conflicts of Interest
References
- Treloar, P.J.; Izatt, C.N. Tectonics of the Himalayan collision between the Indian plate and the Afghan block: A synthesis. Geol. Soc. Lond. Spec. Publ. 1993, 74, 69–87. [Google Scholar] [CrossRef]
- Molnar, P.; Tapponnier, P. The collision between India and Eurasia. Sci. Am. 1977, 236, 30–41. [Google Scholar] [CrossRef]
- King, T.V.; Kokaly, R.F.; Hoefen, T.M.; Johnson, M.R. Hyperspectral remote sensing data maps minerals in Afghanistan. Eos Trans. Am. Geophys. Union 2012, 93, 325–326. [Google Scholar] [CrossRef]
- Marjoribanks, R. Geological Methods in Mineral Exploration and Mining; Springer Science & Business Media: Berlin/Heidelberg, Germany, 2010. [Google Scholar]
- Hunt, G.R. Spectral signatures of particulate minerals in the visible and near infrared. Geophysics 1977, 42, 501–513. [Google Scholar] [CrossRef]
- Malistani, H. Hajigak Iron Ore Deposit; ResearchGate: Berlin, Germany, 2011. [Google Scholar]
- Risen, J. US identifies vast mineral riches in Afghanistan. New York Times, 13 June 2010. [Google Scholar]
- Abdullah, S.; Chmyriov, V.; Dronov, V. Geology and Mineral Resources of Afghanistan; British Geological Survey: Nottingham, UK, 2008. [Google Scholar]
- Azizi, M.; Saibi, H.; Cooper, G. Mineral and structural mapping of the Aynak-Logar Valley (eastern Afghanistan) from hyperspectral remote sensing data and aeromagnetic data. Arab. J. Geosci. 2015, 8, 10911–10918. [Google Scholar] [CrossRef]
- Abdullah, S.; Chmyriov, V.; Stazhilo-Alekseev, K.; Dronov, V.; Gannan, P.; Rossovskiy, L.; Kafarskiy, A.K.; Malyarov, E. Mineral resources of Afghanistan: Kabul; Republic of Afghanistan Geological and Mineral Survey: Kabul, Afghanistan, 1977. [Google Scholar]
- Stettner, N.E.K.W.R.; Masonic, L.M.; Shields, D.A. Geologic and Mineral Map (Modified from the 1975 Original Map Compilation by A.S. Shadchinev and others) and Hyperspectral Surface Material Maps of the Chorband, Salang, and Panjsher River Basins; Kapisa, Panjsher, Parwan, and Baghlan Provinces, Afghanistan; U.S. Geological Survey: Reston, VA, USA, 2020. [Google Scholar]
- Khalaj, M. Investigation and their Relationship of copper mineralizations of ChahMousa, Derakhshanieh and Qollehsoukhteh area with structural lineaments based on geochemistry, alteration and fluid inclusion in the south of Damghan. In Proceedings of the 7th conference of the Iranian Economic Geological Society, Damghan University, Damghan, Iran, 9–10 September 2015. [Google Scholar]
- Rowan, L.C.; Kingston, M.J.; Crowley, J.K. Spectral reflectance of carbonatites and related alkalic igneous rocks; selected samples from four North American localities. Econ. Geol. 1986, 81, 857–871. [Google Scholar] [CrossRef]
- Gabr, S.S.; Hassan, S.M.; Sadek, M.F. Prospecting for new gold-bearing alteration zones at El-Hoteib area, South Eastern Desert, Egypt, using remote sensing data analysis. Ore Geol. Rev. 2015, 71, 1–13. [Google Scholar] [CrossRef]
- Ducart, D.F.; Silva, A.M.; Toledo, C.L.B.; Assis, L.M.D. Mapping iron oxides with Landsat-8/OLI and EO-1/Hyperion imagery from the Serra Norte iron deposits in the Carajás Mineral Province, Brazil. Braz. J. Geol. 2016, 46, 331–349. [Google Scholar] [CrossRef]
- Ranjbar, H.; Honarmand, M.; Moezifar, Z. Application of the Crosta technique for porphyry copper alteration mapping, using ETM+ data in the southern part of the Iranian volcanic sedimentary belt. J. Asian Earth Sci. 2004, 24, 237–243. [Google Scholar] [CrossRef]
- Peters, S.G.; Ludington, S.D.; Orris, G.J.; Sutphin, D.M.; Bliss, J.D.; Rytuba, J.J.; Bawiec, W.J. Preliminary Non-Fuel Mineral Resource Assessment of Afghanistan 2007; US Geological Survey Open-File Report; United States Geological Survey: Reston, VA, USA, 2007; p. 1214. [Google Scholar]
- Dupuis, C.; Beaudoin, G. Discriminant diagrams for iron oxide trace element fingerprinting of mineral deposit types. Miner. Depos. 2011, 46, 319–335. [Google Scholar] [CrossRef]


| (a) | ||||||||||||||||||||||
|---|---|---|---|---|---|---|---|---|---|---|---|---|---|---|---|---|---|---|---|---|---|---|
| Ba | 1 | |||||||||||||||||||||
| Sn | 0.76 | 1 | ||||||||||||||||||||
| Ag | 0.91 | 0.79 | 1 | |||||||||||||||||||
| Mo | 0.97 | 0.62 | 0.88 | 1 | ||||||||||||||||||
| Nb | 0.85 | 0.41 | 0.71 | 0.92 | 1 | |||||||||||||||||
| Sr | 0.97 | 0.75 | 0.91 | 0.95 | 0.79 | 1 | ||||||||||||||||
| As | −0.91 | −0.75 | −0.88 | −0.92 | −0.83 | −0.92 | 1 | |||||||||||||||
| Pb | −0.80 | −0.70 | −0.81 | −0.83 | −0.76 | −0.83 | 0.97 | 1 | ||||||||||||||
| W | 0.85 | 0.55 | 0.82 | 0.89 | 0.73 | 0.89 | −0.79 | −0.69 | 1 | |||||||||||||
| Zn | 0.18 | −0.09 | −0.03 | 0.19 | 0.18 | 0.22 | −0.11 | −0.05 | 0.05 | 1 | ||||||||||||
| Cu | −0.18 | 0.04 | −0.07 | −0.26 | −0.16 | −0.27 | 0.18 | 0.19 | −0.29 | −0.57 | 1 | |||||||||||
| Ni | 0.26 | 0.23 | 0.15 | 0.26 | 0.36 | 0.22 | −0.33 | −0.41 | −0.14 | 0.44 | −0.22 | 1 | ||||||||||
| Fe | 0.98 | 0.75 | 0.90 | 0.97 | 0.85 | 0.97 | −0.94 | −0.86 | 0.83 | 0.26 | −0.26 | 0.37 | 1 | |||||||||
| Mn | 0.96 | 0.73 | 0.89 | 0.96 | 0.84 | 0.97 | −0.94 | −0.87 | 0.81 | 0.30 | −0.28 | 0.41 | 0.99 | 1 | ||||||||
| Cr | 0.93 | 0.74 | 0.82 | 0.85 | 0.72 | 0.90 | −0.78 | −0.65 | 0.66 | 0.39 | −0.14 | 0.42 | 0.92 | 0.91 | 1 | |||||||
| V | 0.63 | 0.37 | 0.63 | 0.68 | 0.75 | 0.59 | −0.71 | −0.71 | 0.44 | 0.30 | −0.36 | 0.57 | 0.70 | 0.70 | 0.57 | 1 | ||||||
| Ca | −0.99 | −0.73 | −0.89 | −0.97 | −0.87 | −0.97 | 0.93 | 0.83 | −0.84 | −0.24 | 0.19 | −0.29 | −0.99 | −0.97 | −0.92 | −0.67 | 1 | |||||
| K | 0.45 | 0.47 | 0.51 | 0.41 | 0.35 | 0.35 | −0.32 | −0.28 | 0.30 | −0.44 | 0.29 | 0.11 | 0.38 | 0.38 | 0.40 | 0.16 | −0.39 | 1 | ||||
| Al | 0.73 | 0.71 | 0.74 | 0.62 | 0.41 | 0.74 | −0.64 | −0.51 | 0.59 | 0.36 | 0.01 | 0.07 | 0.73 | 0.72 | 0.82 | 0.38 | −0.75 | 0.18 | 1 | |||
| Si | −0.62 | −0.59 | −0.65 | −0.66 | −0.58 | −0.74 | 0.80 | 0.88 | −0.62 | −0.17 | 0.46 | −0.39 | −0.72 | −0.77 | −0.51 | −0.60 | 0.67 | −0.10 | −0.36 | 1 | ||
| Cl | 0.79 | 0.57 | 0.76 | 0.81 | 0.77 | 0.72 | −0.74 | −0.69 | 0.69 | −0.27 | −0.04 | 0.24 | 0.75 | 0.73 | 0.61 | 0.51 | −0.74 | 0.78 | 0.26 | −0.49 | 1 | |
| S | −0.70 | −0.47 | −0.70 | −0.76 | −0.77 | −0.67 | 0.82 | 0.84 | −0.56 | −0.05 | 0.21 | −0.47 | −0.75 | −0.77 | −0.56 | −0.75 | 0.73 | −0.55 | −0.32 | 0.66 | −0.79 | 1 |
| Ba | Sn | Ag | Mo | Nb | Sr | As | Pb | W | Zn | Cu | Ni | Fe | Mn | Cr | V | Ca | K | Al | Si | Cl | S | |
| (b) | ||||||||||||||||||||||
| Ba | 1 | |||||||||||||||||||||
| Sr | 0.883 | 1 | ||||||||||||||||||||
| Rb | 0.64 | 0.673 | 1 | |||||||||||||||||||
| As | 0.159 | −0.1 | −0.36 | 1 | ||||||||||||||||||
| Pb | 0.656 | 0.519 | 0.368 | 0.522 | 1 | |||||||||||||||||
| W | 0.395 | 0.214 | −0.02 | 0.48 | 0.431 | 1 | ||||||||||||||||
| Zn | −0.53 | −0.52 | −0.53 | 0.193 | −0.11 | −0.26 | 1 | |||||||||||||||
| Cu | 0.417 | 0.121 | 0.116 | 0.02 | 0.195 | 0.597 | −0.37 | 1 | ||||||||||||||
| Ni | −0.37 | −0.45 | −0.6 | 0.331 | −0.34 | −0.13 | 0.639 | −0.1 | 1 | |||||||||||||
| Fe | 0.092 | −0.05 | −0.42 | 0.409 | −0.12 | 0.522 | −0.14 | 0.403 | 0.356 | 1 | ||||||||||||
| Mn | −0.12 | −0.25 | −0.64 | 0.229 | −0.19 | 0.195 | 0.361 | 0.409 | 0.661 | 0.67 | 1 | |||||||||||
| Cr | 0.023 | 0.004 | 0.316 | 0.171 | 0.338 | 0.126 | 0.238 | −0.27 | −0.31 | −0.18 | −0.44 | 1 | ||||||||||
| V | 0.257 | 0.449 | −0.12 | 0.068 | 0.079 | −0.05 | −0.08 | −0.24 | 0.145 | −0 | 0.188 | −0.56 | 1 | |||||||||
| Ti | −0.05 | 0.057 | 0.139 | −0.4 | 0.044 | 0.263 | −0.21 | 0.258 | −0.56 | −0.26 | −0.11 | 0.049 | 0.036 | 1 | ||||||||
| Ca | 0.821 | 0.826 | 0.583 | −0.02 | 0.464 | 0.438 | −0.77 | 0.353 | −0.69 | 0.211 | −0.23 | 0.096 | 0.161 | 0.228 | 1 | |||||||
| K | 0.599 | 0.619 | 0.8 | −0.29 | 0.425 | 0.248 | −0.45 | 0.32 | −0.64 | −0.04 | −0.31 | 0.483 | −0.28 | 0.336 | 0.716 | 1 | ||||||
| Al | 0.513 | 0.502 | 0.202 | −0.17 | −0.08 | 0.242 | −0.09 | 0.375 | 0.15 | 0.49 | 0.446 | −0.07 | 0.169 | −0.1 | 0.423 | 0.403 | 1 | |||||
| Si | 0.366 | 0.488 | 0.107 | 0.157 | 0.135 | 0.217 | −0.11 | −0.01 | 0.141 | 0.542 | 0.345 | 0.08 | 0.352 | −0.06 | 0.433 | 0.391 | 0.613 | 1 | ||||
| Cl | −0.25 | −0.36 | 0.05 | −0.49 | −0.61 | −0.34 | −0.01 | 0.222 | 0.236 | −0.18 | −0.02 | −0.37 | −0.31 | −0.19 | −0.4 | −0.26 | 0.043 | −0.58 | 1 | |||
| S | −0.21 | −0.4 | −0.19 | 0.127 | 0.041 | 0.059 | 0.087 | 0.126 | −0.08 | −0.31 | −0.25 | −0.06 | −0.34 | −0.1 | −0.31 | −0.41 | −0.52 | −0.92 | 0.451 | 1 | ||
| Ba | Sr | Rb | As | Pb | W | Zn | Cu | Ni | Fe | Mn | Cr | V | Ti | Ca | K | Al | Si | Cl | S | |||
Publisher’s Note: MDPI stays neutral with regard to jurisdictional claims in published maps and institutional affiliations. |
© 2021 by the authors. Licensee MDPI, Basel, Switzerland. This article is an open access article distributed under the terms and conditions of the Creative Commons Attribution (CC BY) license (https://creativecommons.org/licenses/by/4.0/).
Share and Cite
Khalaj, M.; Karimi, Z.; Rabbani, M. The Exploration of Metallic Deposits Using Satellite Image Processing in the Parwan-Panjsher Area, Afghanistan. Environ. Sci. Proc. 2021, 6, 30. https://0-doi-org.brum.beds.ac.uk/10.3390/iecms2021-09354
Khalaj M, Karimi Z, Rabbani M. The Exploration of Metallic Deposits Using Satellite Image Processing in the Parwan-Panjsher Area, Afghanistan. Environmental Sciences Proceedings. 2021; 6(1):30. https://0-doi-org.brum.beds.ac.uk/10.3390/iecms2021-09354
Chicago/Turabian StyleKhalaj, Mahdi, Ziba Karimi, and Mohsen Rabbani. 2021. "The Exploration of Metallic Deposits Using Satellite Image Processing in the Parwan-Panjsher Area, Afghanistan" Environmental Sciences Proceedings 6, no. 1: 30. https://0-doi-org.brum.beds.ac.uk/10.3390/iecms2021-09354