Article

Geographical Distribution Patterns of Iodine in Drinking-Water and Its Associations with Geological Factors in Shandong Province, China

1
Department of Epidemiology, School of Public Health, Fudan University, Shanghai 200032, China
2
Key Laboratory of Public Health Safety, Ministry of Education, Shanghai 200032, China
3
Laboratory for Spatial Analysis and Modeling, School of Public Health, Fudan University, Shanghai 200032, China
4
Shandong Institute of Prevention and Control for Endemic Disease, Jinan 250014, China
*
Authors to whom correspondence should be addressed.
Int. J. Environ. Res. Public Health 2014, 11(5), 5431-5444; https://0-doi-org.brum.beds.ac.uk/10.3390/ijerph110505431
Submission received: 7 March 2014 / Revised: 29 April 2014 / Accepted: 4 May 2014 / Published: 19 May 2014

Abstract

:
County-based spatial distribution characteristics and the related geological factors for iodine in drinking-water were studied in Shandong Province (China). Spatial autocorrelation analysis and spatial scan statistic were applied to analyze the spatial characteristics. Generalized linear models (GLMs) and geographically weighted regression (GWR) studies were conducted to explore the relationship between water iodine level and its related geological factors. The spatial distribution of iodine in drinking-water was significantly heterogeneous in Shandong Province (Moran’s I = 0.52, Z = 7.4, p < 0.001). Two clusters for high iodine in drinking-water were identified in the south-western and north-western parts of Shandong Province by the purely spatial scan statistic approach. Both GLMs and GWR indicated a significantly global association between iodine in drinking-water and geological factors. Furthermore, GWR showed obviously spatial variability across the study region. Soil type and distance to Yellow River were statistically significant at most areas of Shandong Province, confirming the hypothesis that the Yellow River causes iodine deposits in Shandong Province. Our results suggested that the more effective regional monitoring plan and water improvement strategies should be strengthened targeting at the cluster areas based on the characteristics of geological factors and the spatial variability of local relationships between iodine in drinking-water and geological factors.

1. Introduction

Iodine is the most important pathogenic factors responsible for endemic thyroid disease. Both insufficient and excessive iodine intake can cause thyroid hormone disorders. With the rapid progress in alleviating iodine deficiency, the iodine intake in developing countries has increased greatly [1,2]. The issue of excess iodine intake, however, continues to raise many concerns because of its various adverse effects [3,4]. For example, excessive iodine intake may cause thyroid goiter, overt hyper- and hypothyroidism, subclinical hyper- and hypothyroidism, autoimmune thyroid disease, loss of intelligence, etc. [5,6].
The naturally sources of iodine are found in food and water. China was the first country to report cases excess goiter caused by water-sourced iodine [7]. A national investigation showed that drinking-water with high iodine levels could be found in 11 provinces, mainly located in the middle of China, including Shandong, Hebei, Henan, Jiangsu, Anhui, and Shanxi provinces [8]. Drinking-water with high iodine levels was found in 288 townships of 19 counties including seven cities in Shandong Province [9]. The surveillance results conducted by the Shandong Institute of Prevention and Control for Endemic Disease indicated that there may be a strong spatial heterogeneity in the distribution of iodine in drinking-water in Shandong Province [9,10,11]. As drinking-water was identified as one of the main sources of iodine intake [12], understanding the spatial distribution and pattern of iodine in drinking-water may help the various health departments implement effective strategies of regional prevention to control the adverse effects of excess iodine intake.
In recent years, geographical information system (GIS) and spatial analysis techniques have been frequently used to describe the patterns of endemic diseases and pathogenic factors. The spatial analyses, such as spatial autocorrelation and cluster analysis are commonly used to characterize spatial epidemiology of endemic diseases [13,14,15,16]. Previous studies suggested that the iodine in drinking-water might have variability in different regions [17,18,19]. However, to the best of our knowledge, few studies have tried to explore the spatial pattern of iodine in drinking-water in Shandong Province, China [20].
Besides, the iodine concentration in drinking-water is mainly determined by the geological background, making it essential to investigate the determinants for high iodine, especially the geological factors. However, geological factors usually have spatial autocorrelation and show obvious spatial heterogeneity [21,22,23], so geographically weighted regression (GWR) was used to analyze the local spatial heterogeneity in the estimated relationships between iodine in drinking-water and geological factors, with the purpose of exploring possible clues to the geographical distribution of high levels of iodine in drinking-water.

2. Experimental Section
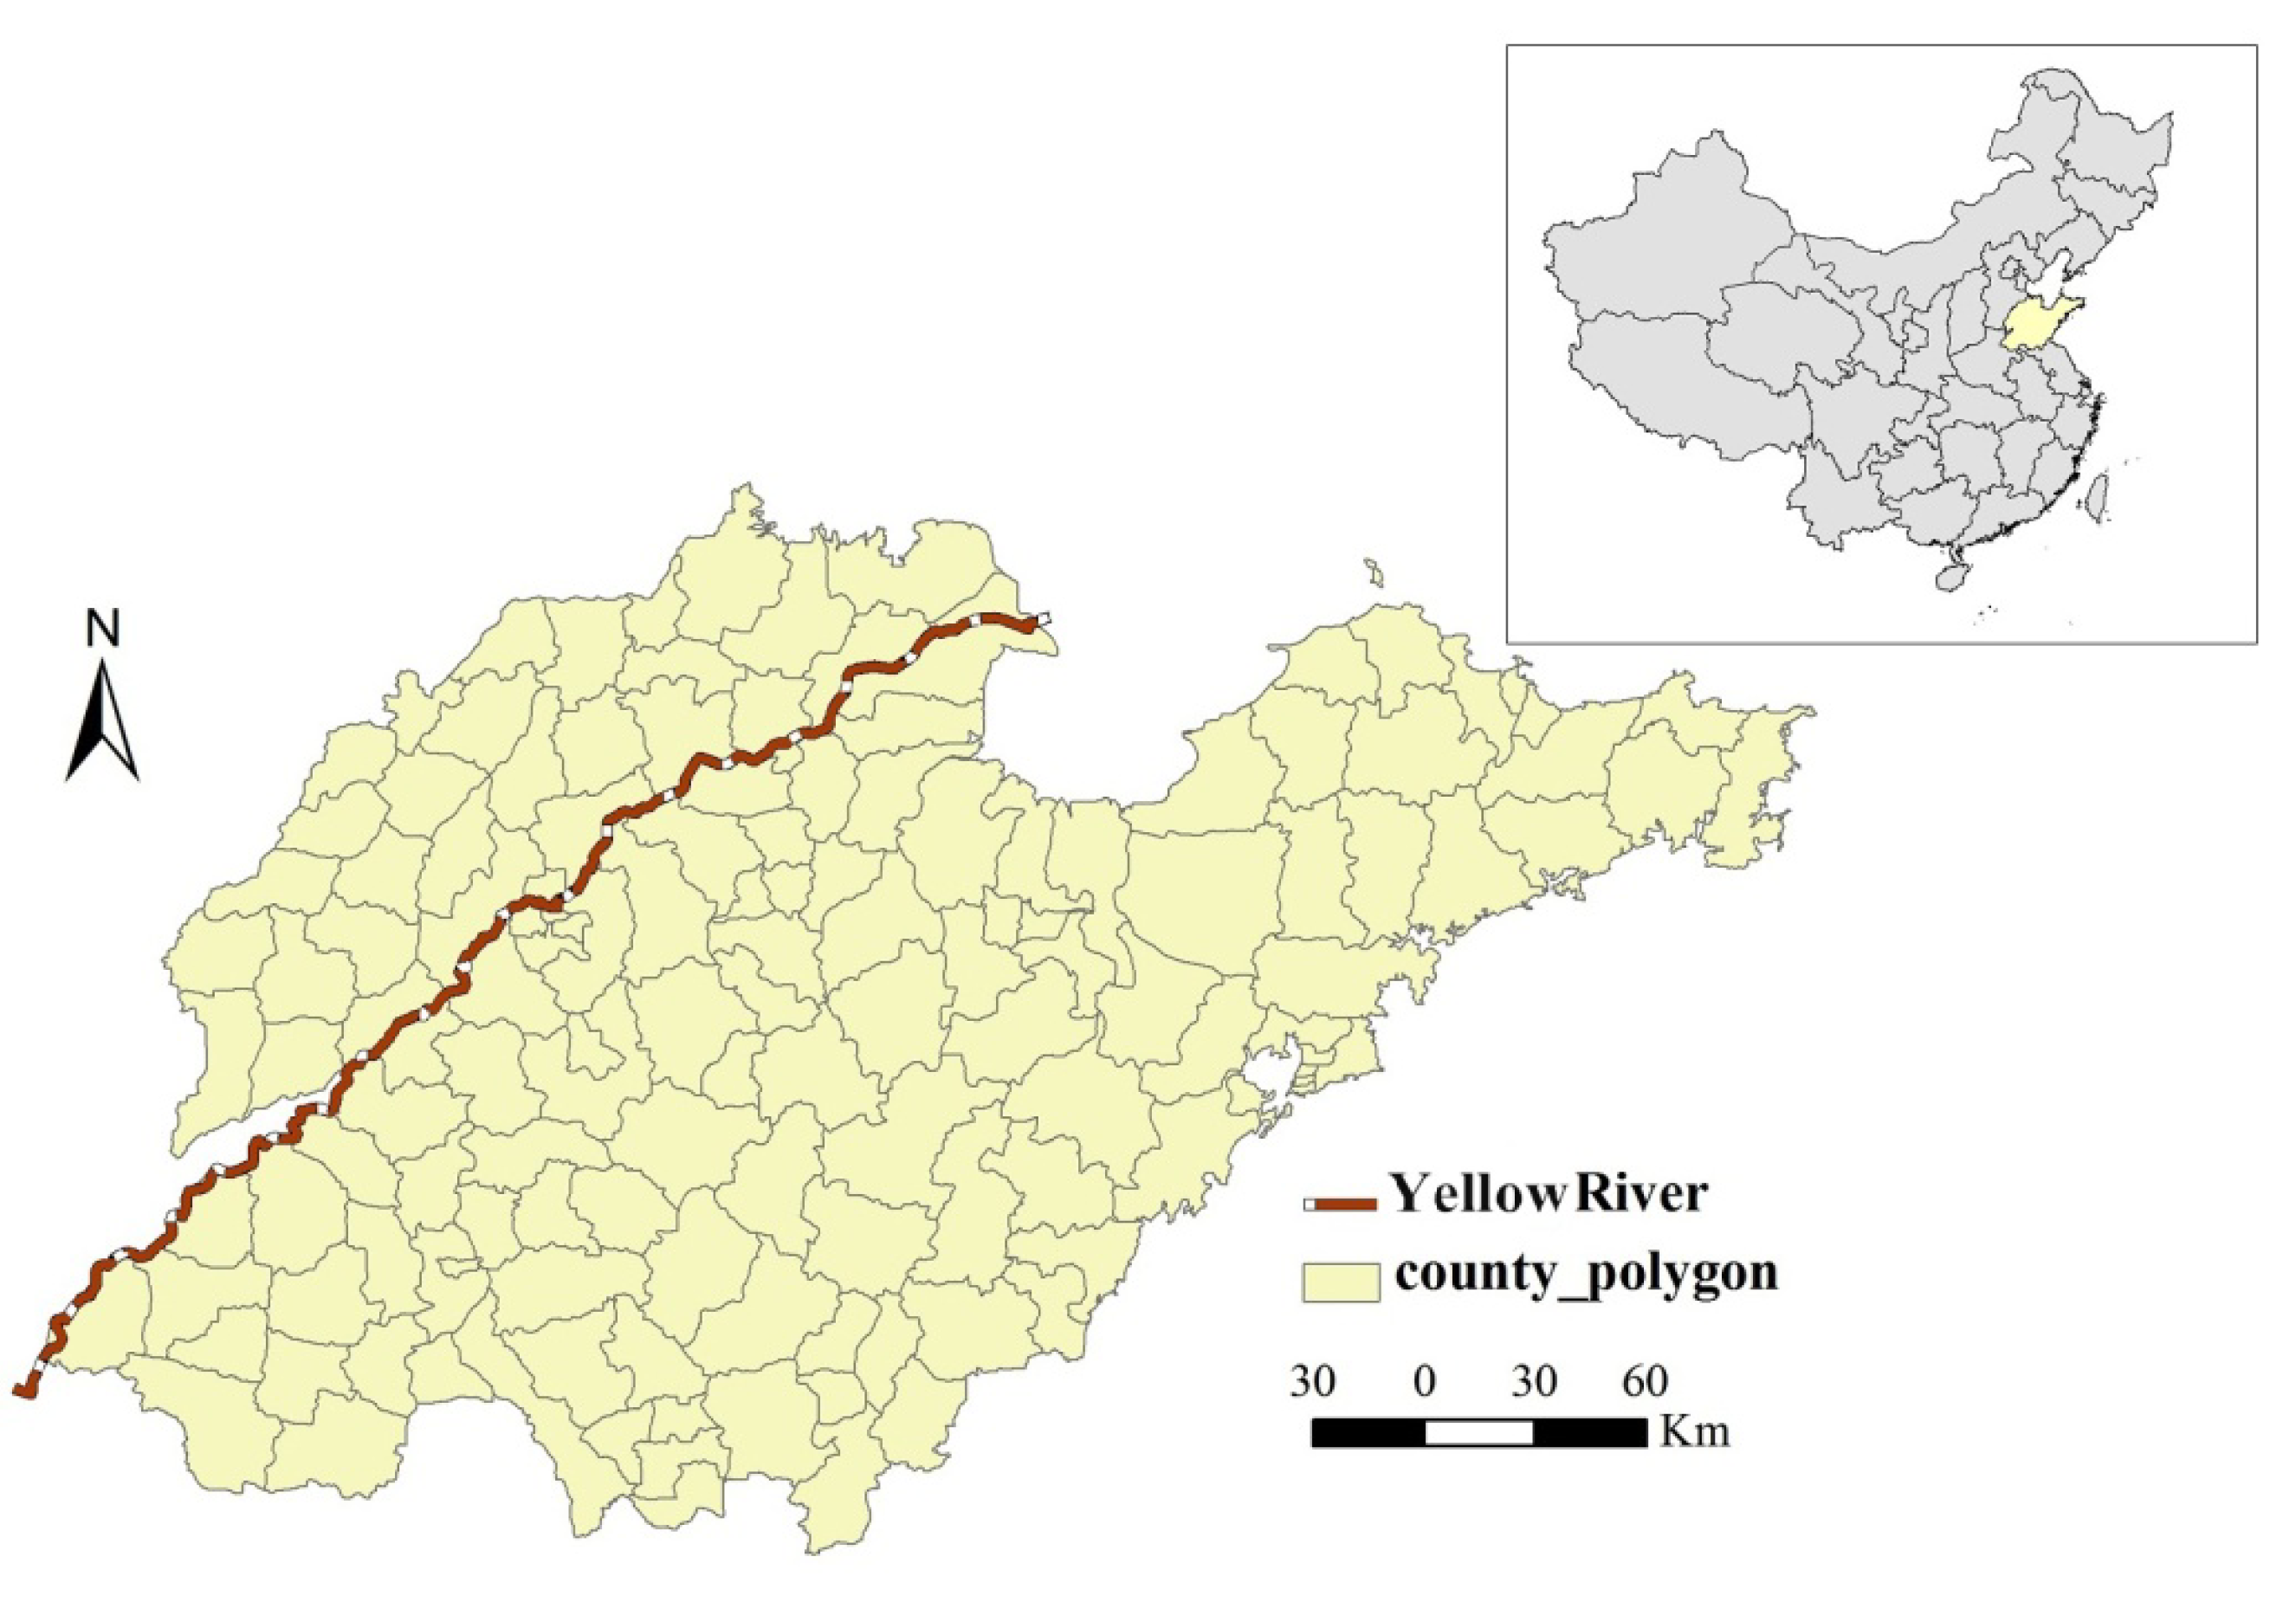
2.1. Study Area

The study area, Shandong Province, located at latitude 34°22.9′ N–38°24.01′ N, longitude 114°47.5′ E–122°42.3′ E, is a coastal province in Eastern China with a population of approximately 98 million (Figure 1). It includes 140 counties with a total land area of 157,100 square kilometers. Shandong Province has a warm temperate monsoon climate, with the mean annual temperature of 11–14 °C. Geographically, Shandong Province can be divided three parts: the plain area from southwest to northwest, the mountainous and hilly area in the central, and the hilly area in the eastern part.
Figure 1. The location of study area—Shandong Province in China.
Ijerph 11 05431 g001

2.2. Data Collection

Data of iodine in drinking-water in Shandong Province were obtained from the Shandong Institute of Prevention and Control for Endemic Disease. The water samples were collected at the township scale. Each town was divided into five districts (i.e., east, west, south, north and center). From each district, one village was randomly selected. For the villages with less than five wells, water samples from all available wells were collected. For those with more than five wells, the village was divided into five areas (i.e., east, west, south, north and center) and one well in each area was selected. In the village where water was provided through pipelines, a sample was collected from the source of the water supply. In total, 108,164 water samples were collected from the 140 counties. The median iodine concentrations were calculated to represent the iodine concentration of the county. Water iodine was determined using the As-Ce catalytic spectrophotometric method for high water iodine [8]. Considering the high level of iodine in the water samples, we adopted the China Iodine Deficiency Disorder Laboratory standard for iodine measurement. Four geological factors, including hydrogeology, soil, topography, were selected in the present study based on the hypothesis that the Yellow River caused iodine deposits through flooding. The main type of hydrogeology, soil or topography in each county was defined as the type of the county. The geological factors were obtained from the Shandong Institute of Geological Survey, and the distance from each county to the Yellow River was calculated using the ArcGIS10 software (ESRI Inc., Redlands, CA, USA). Further information is provided in Table 1.
Table 1. Value assignment of the geological variables.
Geological FactorsVariablesAssignment
Hydrogeology Unconsolidated rock water1
Fracturepore water in clastic rocks2
Fracturekarst water in Carbonate rocks3
basement rock fracture water4
SoilBrunisolic soil1
Cinnamon soil2
Moisture soil3
Shajiang Black soil4
Paddy soil5
TopographyPlain1
Hills 2
DtYDistance to Yellow River(Km)--

2.3. Spatial Autocorrelation Analysis

Spatial autocorrelation analyses were performed using ArcGIS10 [24,25]. Global Moran’s I [26] was used to describe spatial autocorrelation and analyze the spatial distribution pattern of iodine in Shandong Province. Local Moran’s I [27] was applied to examine the local level of spatial autocorrelation and determine locations of clusters or hotspots. The significance of Moran’s I was assessed by employing Monte Carlo randomization. A statistically significant (Z ≥ 1.96) estimate of I indicates that neighboring counties have similar iodine concentration and are likely to cluster at county level.

2.4. Spatial Scan Statistic

The spatial scan statistic was performed using SaTScan V9.1.1 software (Kulldorff and Information Management Services, Inc., Boston, MA, USA) [27]. The Kulldorff’s statistic uses a moving window of pre-specified shape to identify high-risk or low-risk areas with statistically significant relatively high risk [28]. The null hypothesis assumed that all observations come from the same distribution. Under the alternative hypothesis, there is one cluster location where the observations have either a larger or smaller mean than outside that cluster. In present study, a normal distribution based model was used, because the iodine is continuous data. The geographic size of the window was limited to half of all observations [29]. The significance test of the identified clusters was based on comparing the likelihood ratio test statistics against a null distribution obtained from Monte Carlo Simulation. The number of permutations was set to 999 and the significance level was set at 0.05.

2.5. Detection of Spatial Relationships between Iodine Concentration and Geological Factors

To detect the spatial dependence relationship between iodine in drinking water and geological factors, the generalized linear models (GLMs) and geographically weighted regression (GWR) were used to build the global and local regression model between iodine concentration and geological factors(including hydrogeology, soil, topography and distance to Yellow River). GWR is a local version of spatial regression that generates parameters disaggregated by the spatial units of the analysis [30,31]. It allows assessment of the spatial heterogeneity in the estimated relationships between independent variables and the dependent variable. Unlike conventional GLMs, which may only produce a single regression equation to summarize global relationships between iodine in drinking water and geological factors, GWR can generate the spatial relationships that dynamically express the local spatial variation between them, because the regression coefficients of GWR are allowed to vary spatially. The SAS 9.3 software (SAS Institute Inc., Cary, NC, USA) was used for GLMs to set up the global dependence model and ArcGIS10 was used for GWR to set up the local regression model between iodine concentration and geographical factors.

3. Results

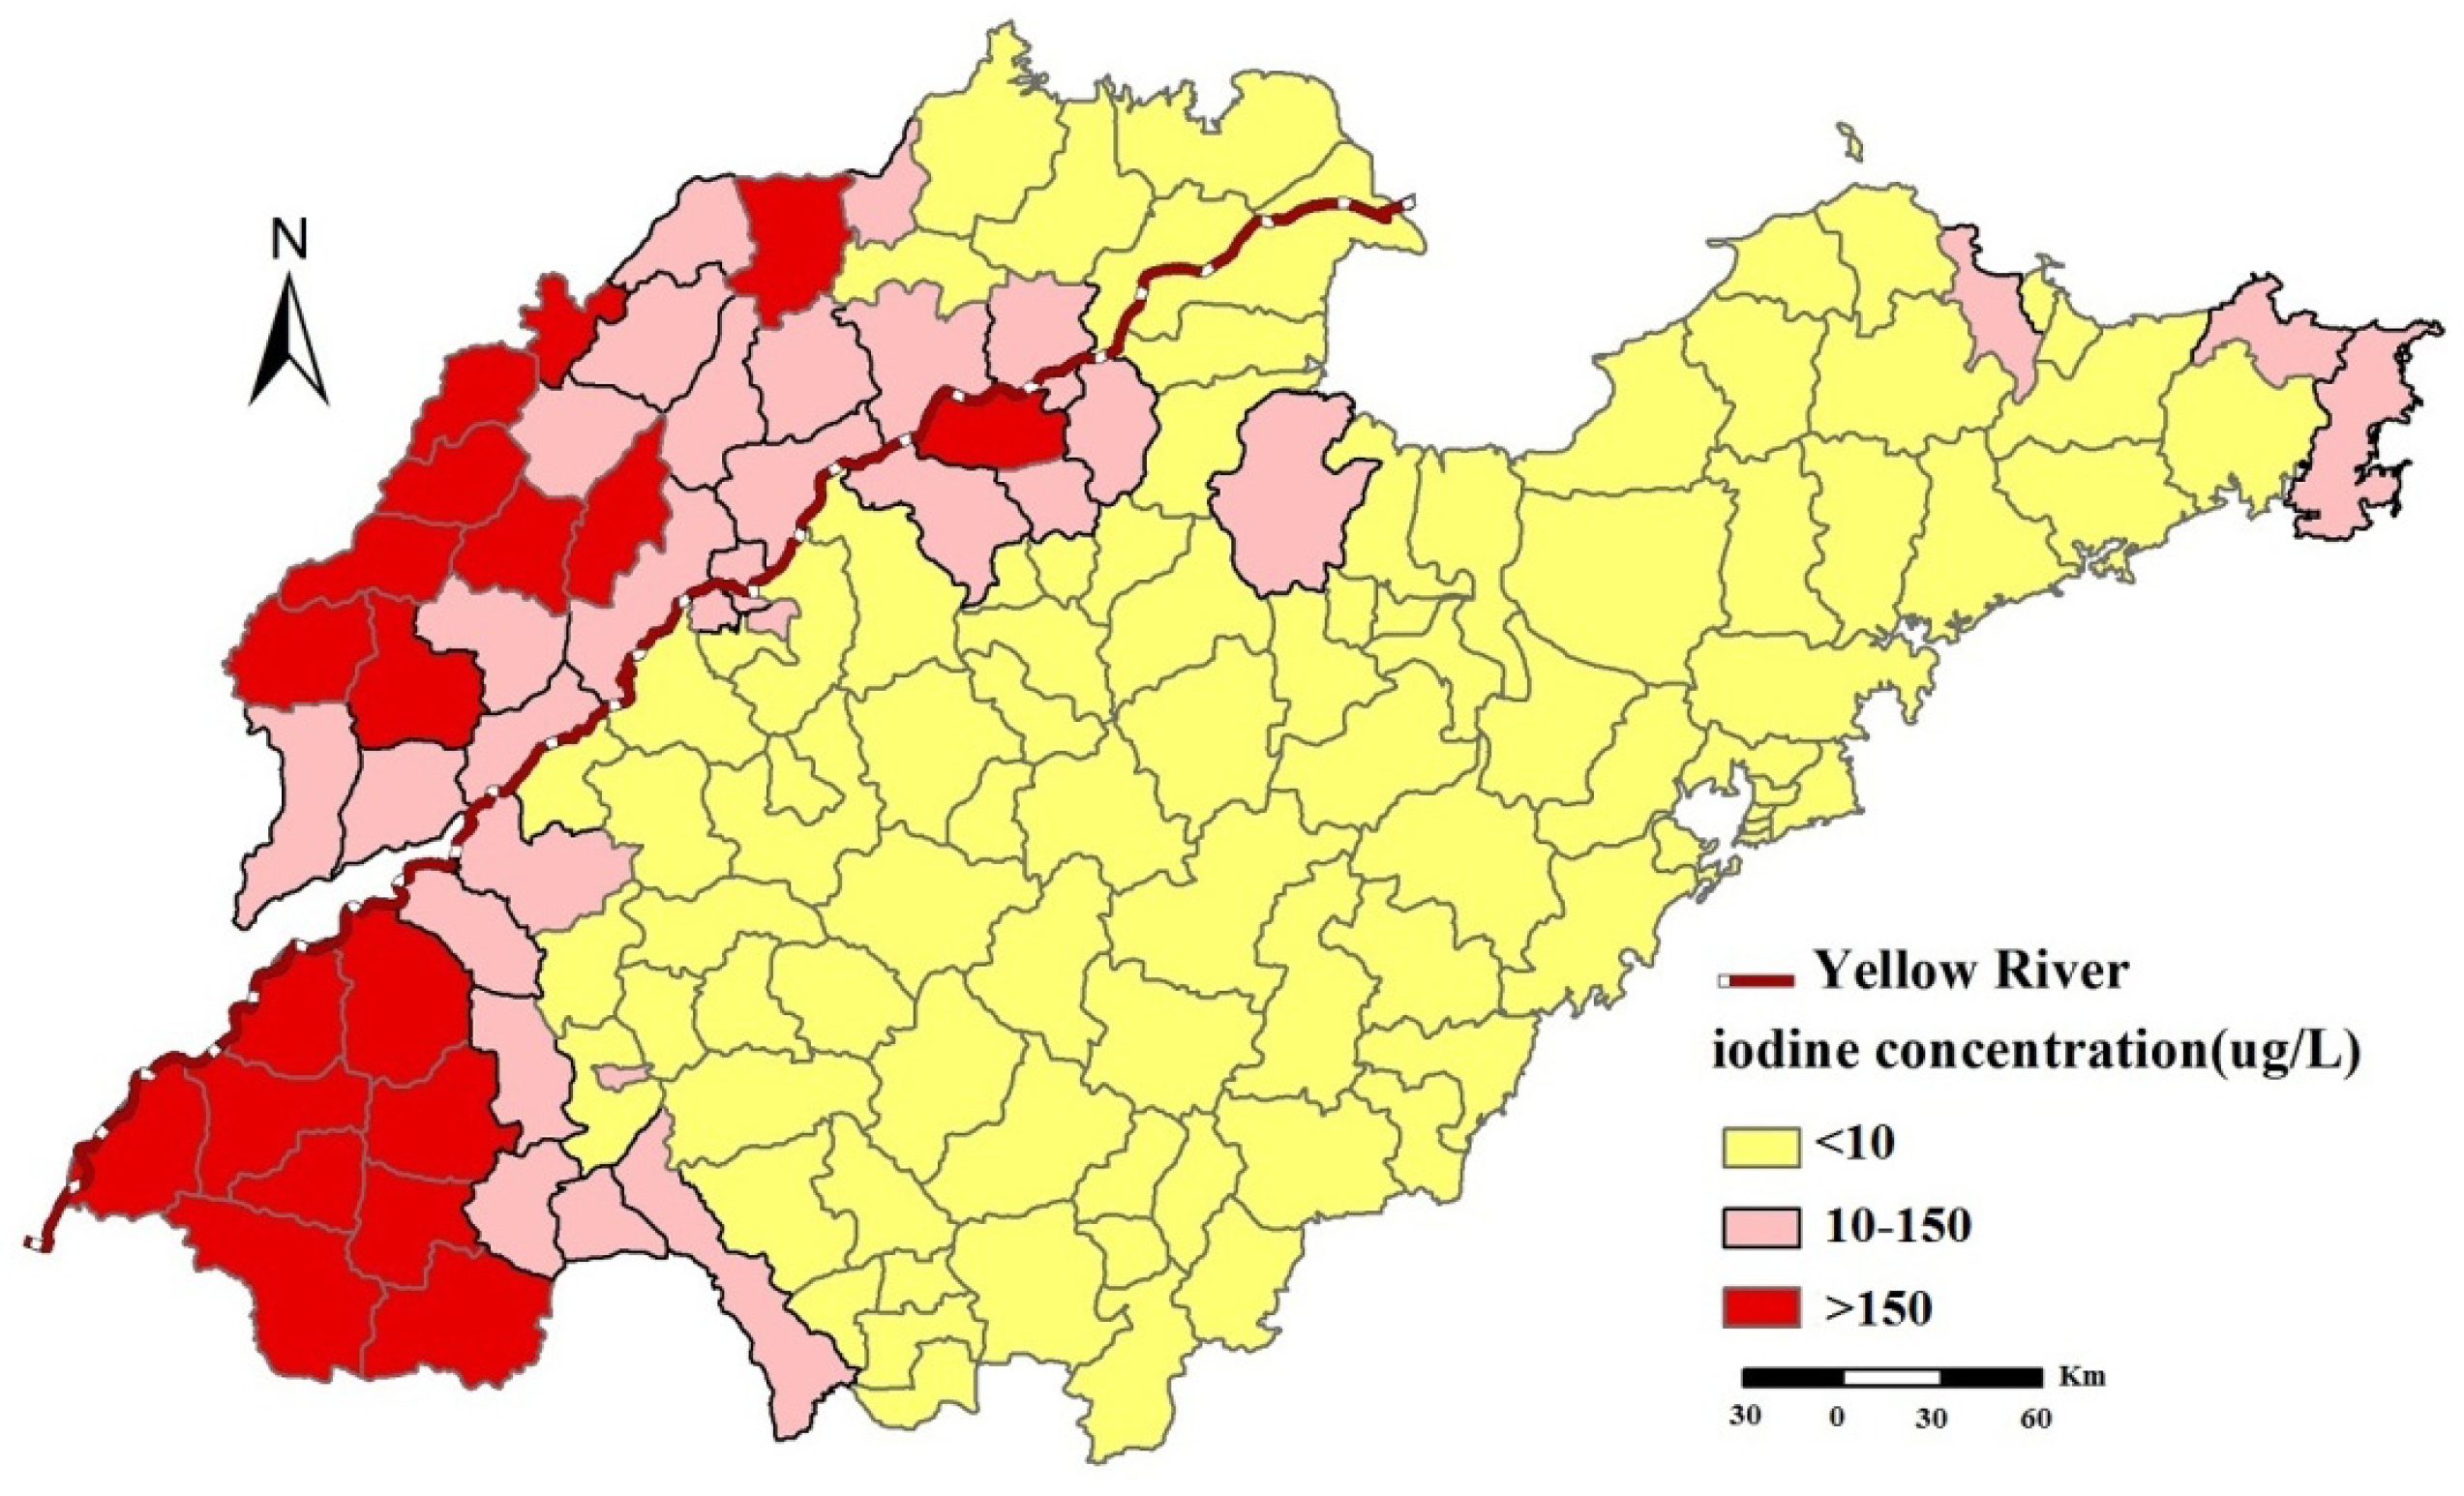
3.1. Iodine Concentration in Grounding-Water

According to the national standard “Determination and Classification of the Areas of High Water Iodine and the Endemic Areas of Iodine Excess Goiter” in China [32], there are 90 counties with a median water iodine of <10 μg/L, 31 counties with a median water iodine of 10–150 μg/L and 19 counties with a median water iodine >150 μg/L.
The excess iodine (>150 μg/L) regions were mainly located in southwest and northwest of Shandong Province. The “suitable” regions (10~150 μg/L) were mainly located in the counties along the Yellow River and the east of Shandong Province, while most counties were identified as iodine deficient (<10 μg/L) (Figure 2).

3.2. Spatial Autocorrelation Analysis

Spatial distribution of iodine in drinking-water was spatially autocorrelated at the county level in Shandong Province, China (Moran’s I = 0.52, p < 0.001). Two significantly spatial clusters (hotspots) were identified using the Local Moran’s I (Figure 3). The hotspots included the 18 counties of Decheng, Wucheng, Pingyuan, Xiajin, Dongchangfu, Gaotang, Linqing, Chiping, Guanxian, Yuncheng, Quancheng, Dongming, Mudan, Juye, Dingtao, Chengwu, Caoxian and Shanxian.
Figure 2. Distribution of iodine in drinking-water in Shandong province, China.
Ijerph 11 05431 g002
Figure 3. Spatial clusters detected by Local Moran’s I in Shandong Province, China.
Ijerph 11 05431 g003

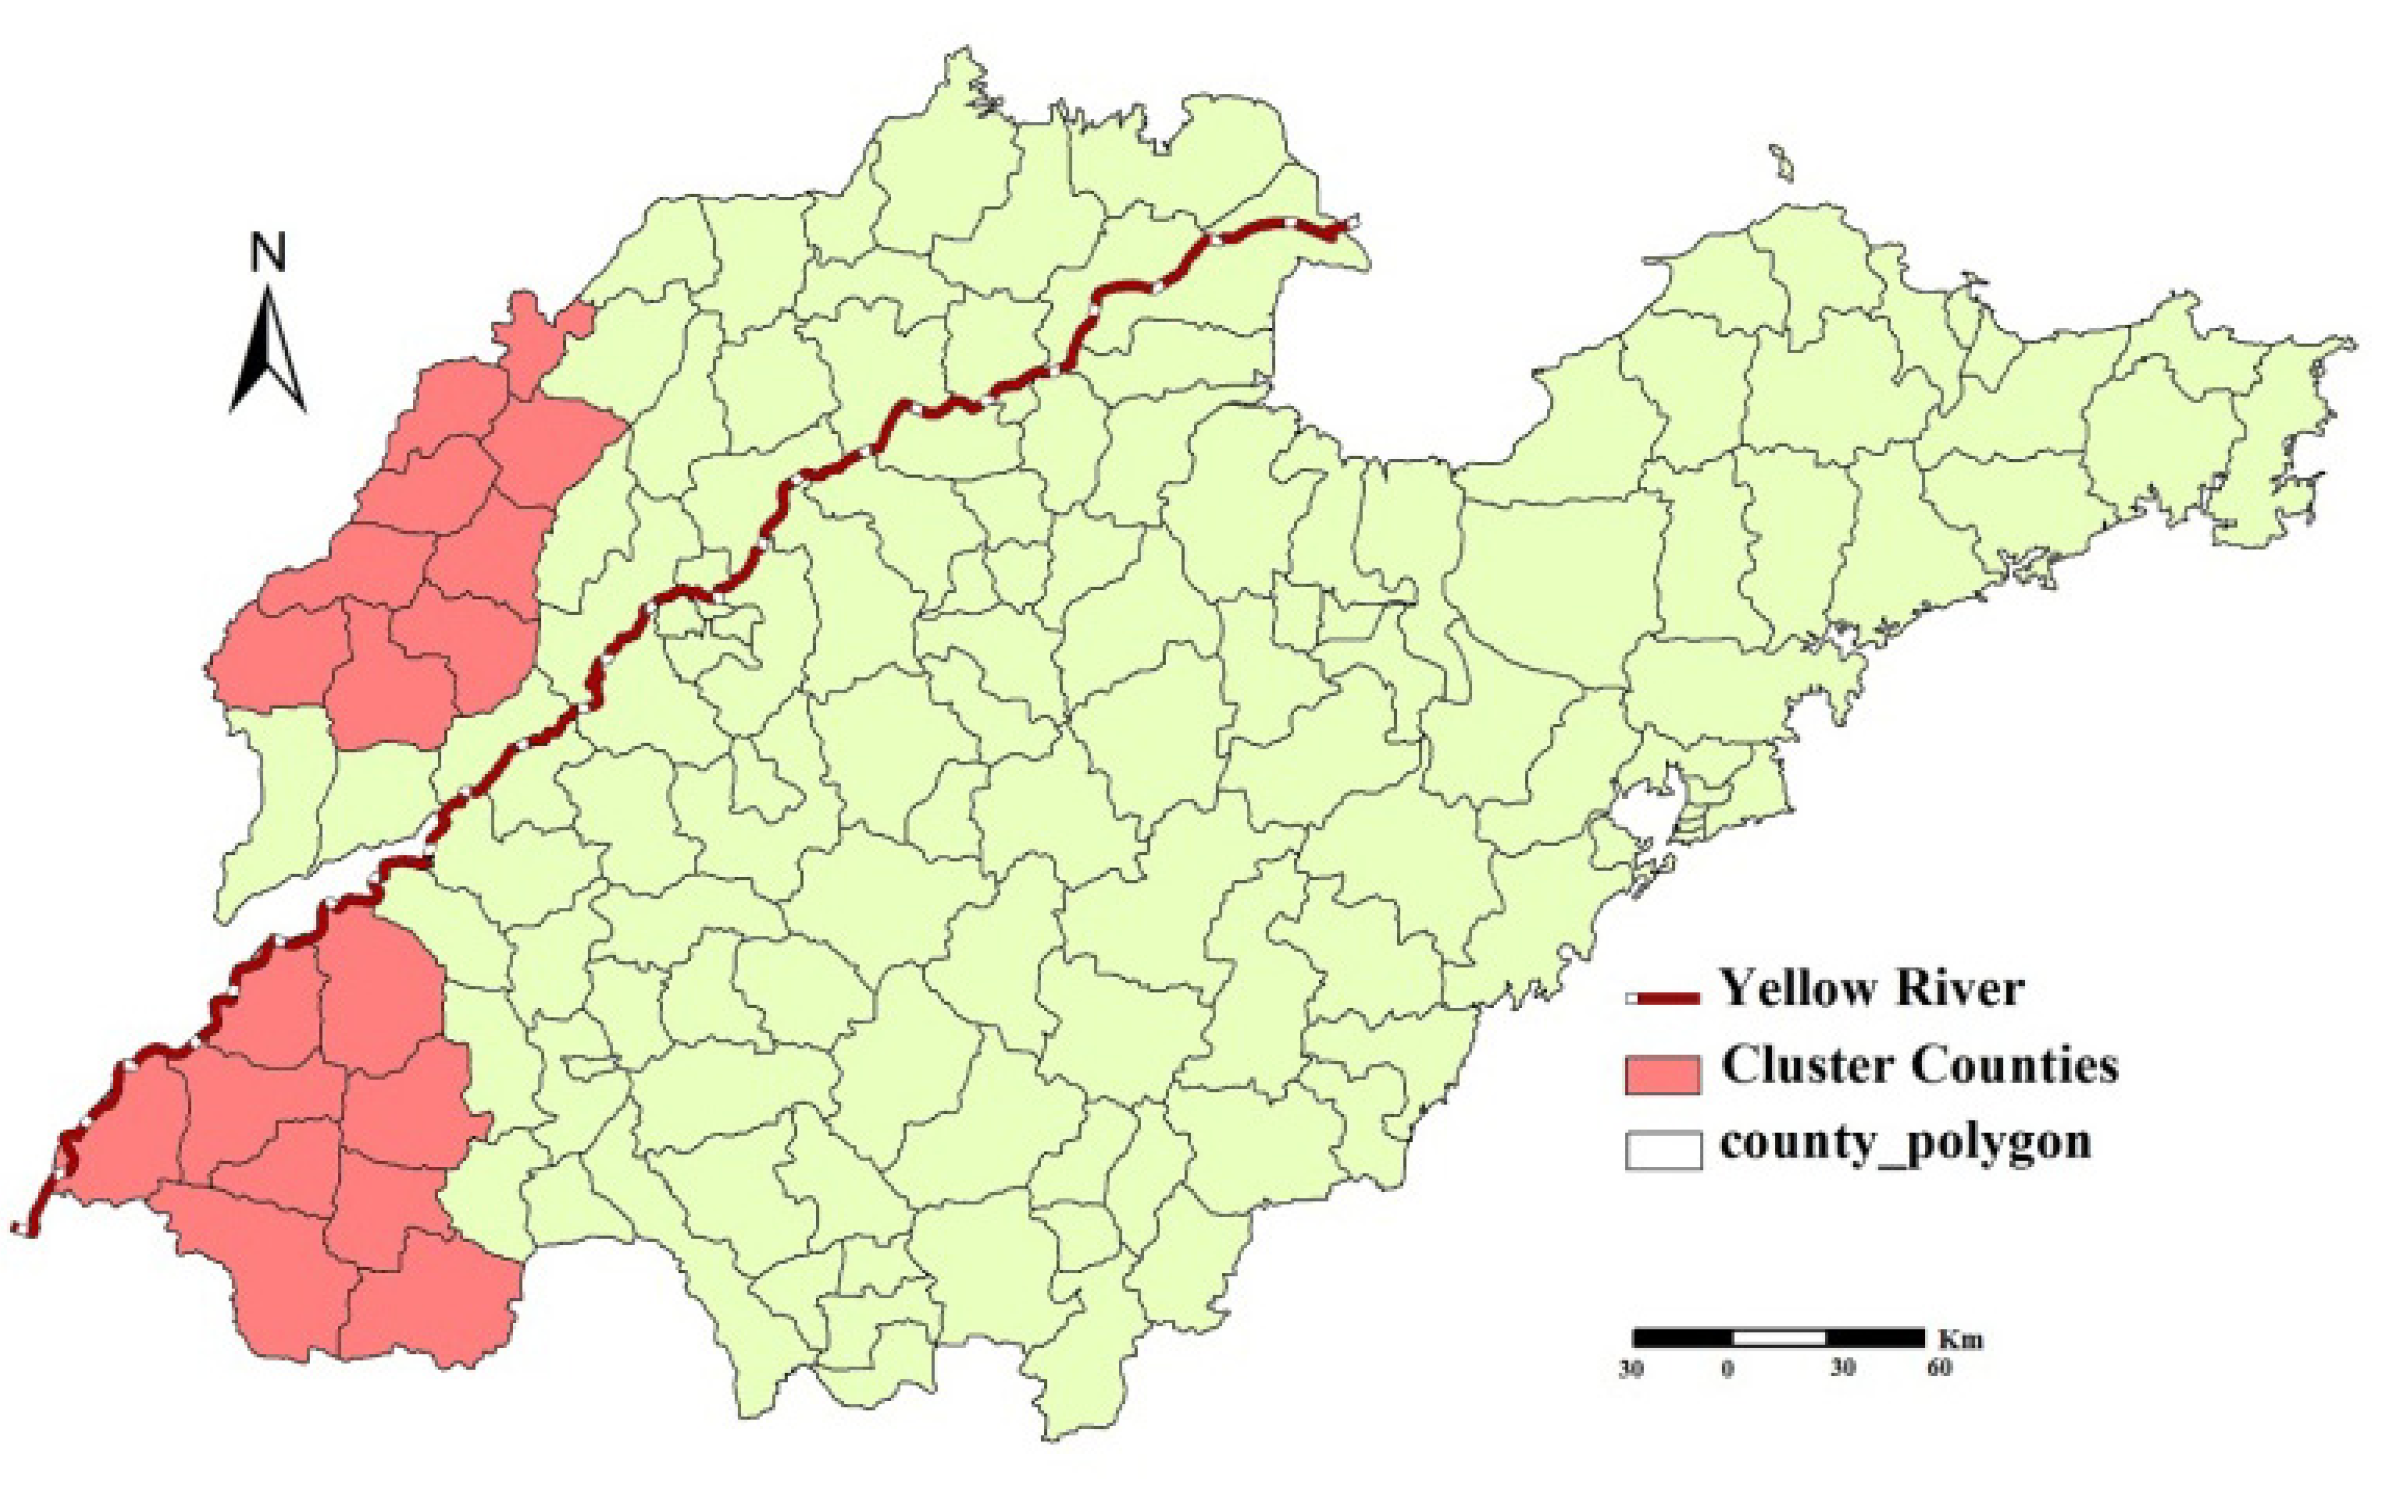
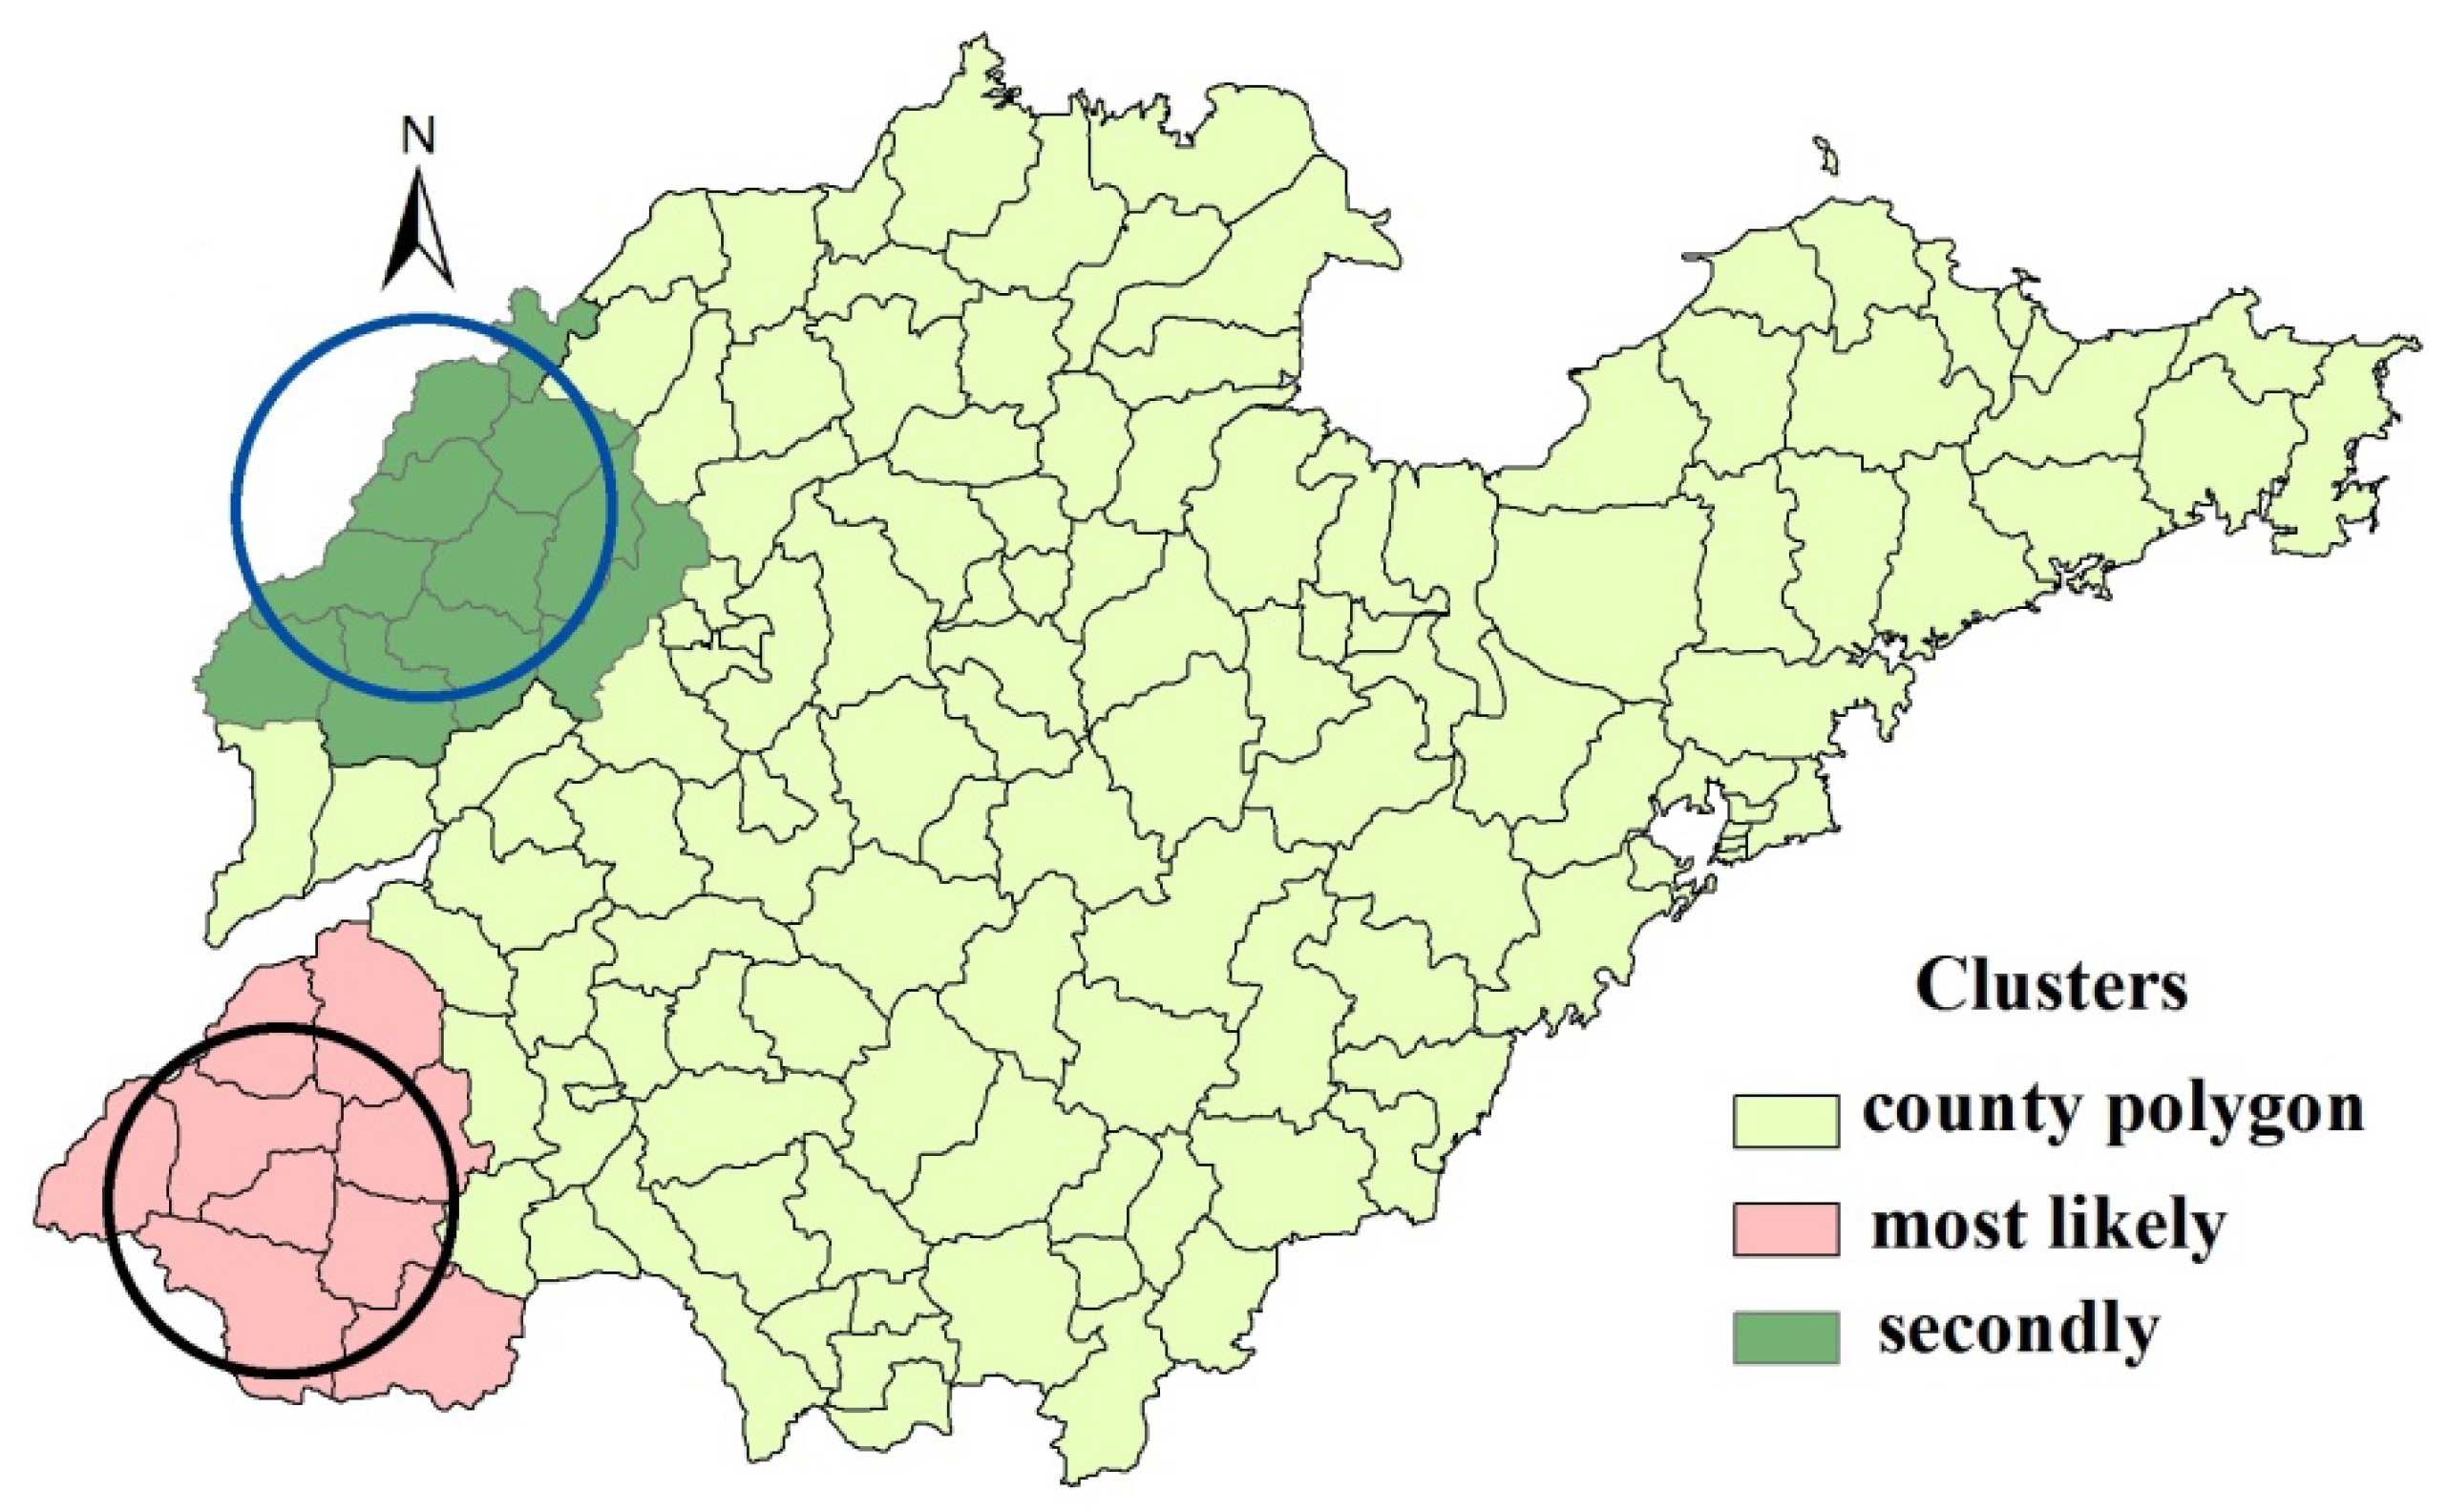
3.3. Spatial Clusters of Iodine in Drinking Water

Figure 4 shows the statistically significant spatial clusters (including the most likely cluster and secondary cluster) for a high concentration of iodine in drinking-water identified by the purely spatial scan statistic. It can be seen that the most likely clusters including nine counties (southwest), and the secondary cluster included 11 counties (northwest). Table 2 summarizes the cluster information.

3.4. Global Spatial Dependence between Iodine Concentration in Drinking-Water and Geological Factors

Iodine concentration was significantly associated with geographical factors (F = 16.29, p < 0.001), and GLMs explained about 53.00% of the total variance of iodine concentration (R2 = 0.53) (Table 3). However, the test for the independence of residuals showed that it is not independent (Durbin-Watson D = 0.67) and the residual had an obvious spatial autocorrelation (Moran’s I = 0.64, p < 0.01), suggesting that the GLM does not fit the data well.
Figure 4. Spatial distributions of the detected clusters of high iodine areas in Shandong Province, China.
Ijerph 11 05431 g004
Table 2. Two clusters detected by spatial scan statistic.
Cluster centerRadius (km)No. of counties in cluster areasLog-likelihood ratiop value
Dingtao 57.47936.550.001
Xiajin 65.581121.460.002
Table 3. Parameter estimates of GLMs.
VariableDFParameter estimateStandard ErrorT ValuePr > |t|
Intercept--0.37410.11533.24000.0015
HydrogeologyUnconsolidated rock water−0.03850.0533−0.72000.4716
Fracturepore water in clastic rocks0.02450.05520.45000.6570
Fracturekarst water in Carbonate rocks0.00070.05410.01000.9900
basement rock fracture water--------
SoilBrunisolic soil0.12640.11331.1200 0.2668
Cinnamon soil0.23980.1064 2.25000.0259
Moisture soil−0.02910.1028 −0.28000.7780
Shajiang Black soil0.13150.1451 0.91000.3662
Paddy soil--------
TopographyPlain−0.03590.0394−0.91000.3629
Hills--------
DtY--0.00050.00011.340.1833
Note: R2 = 0.53.

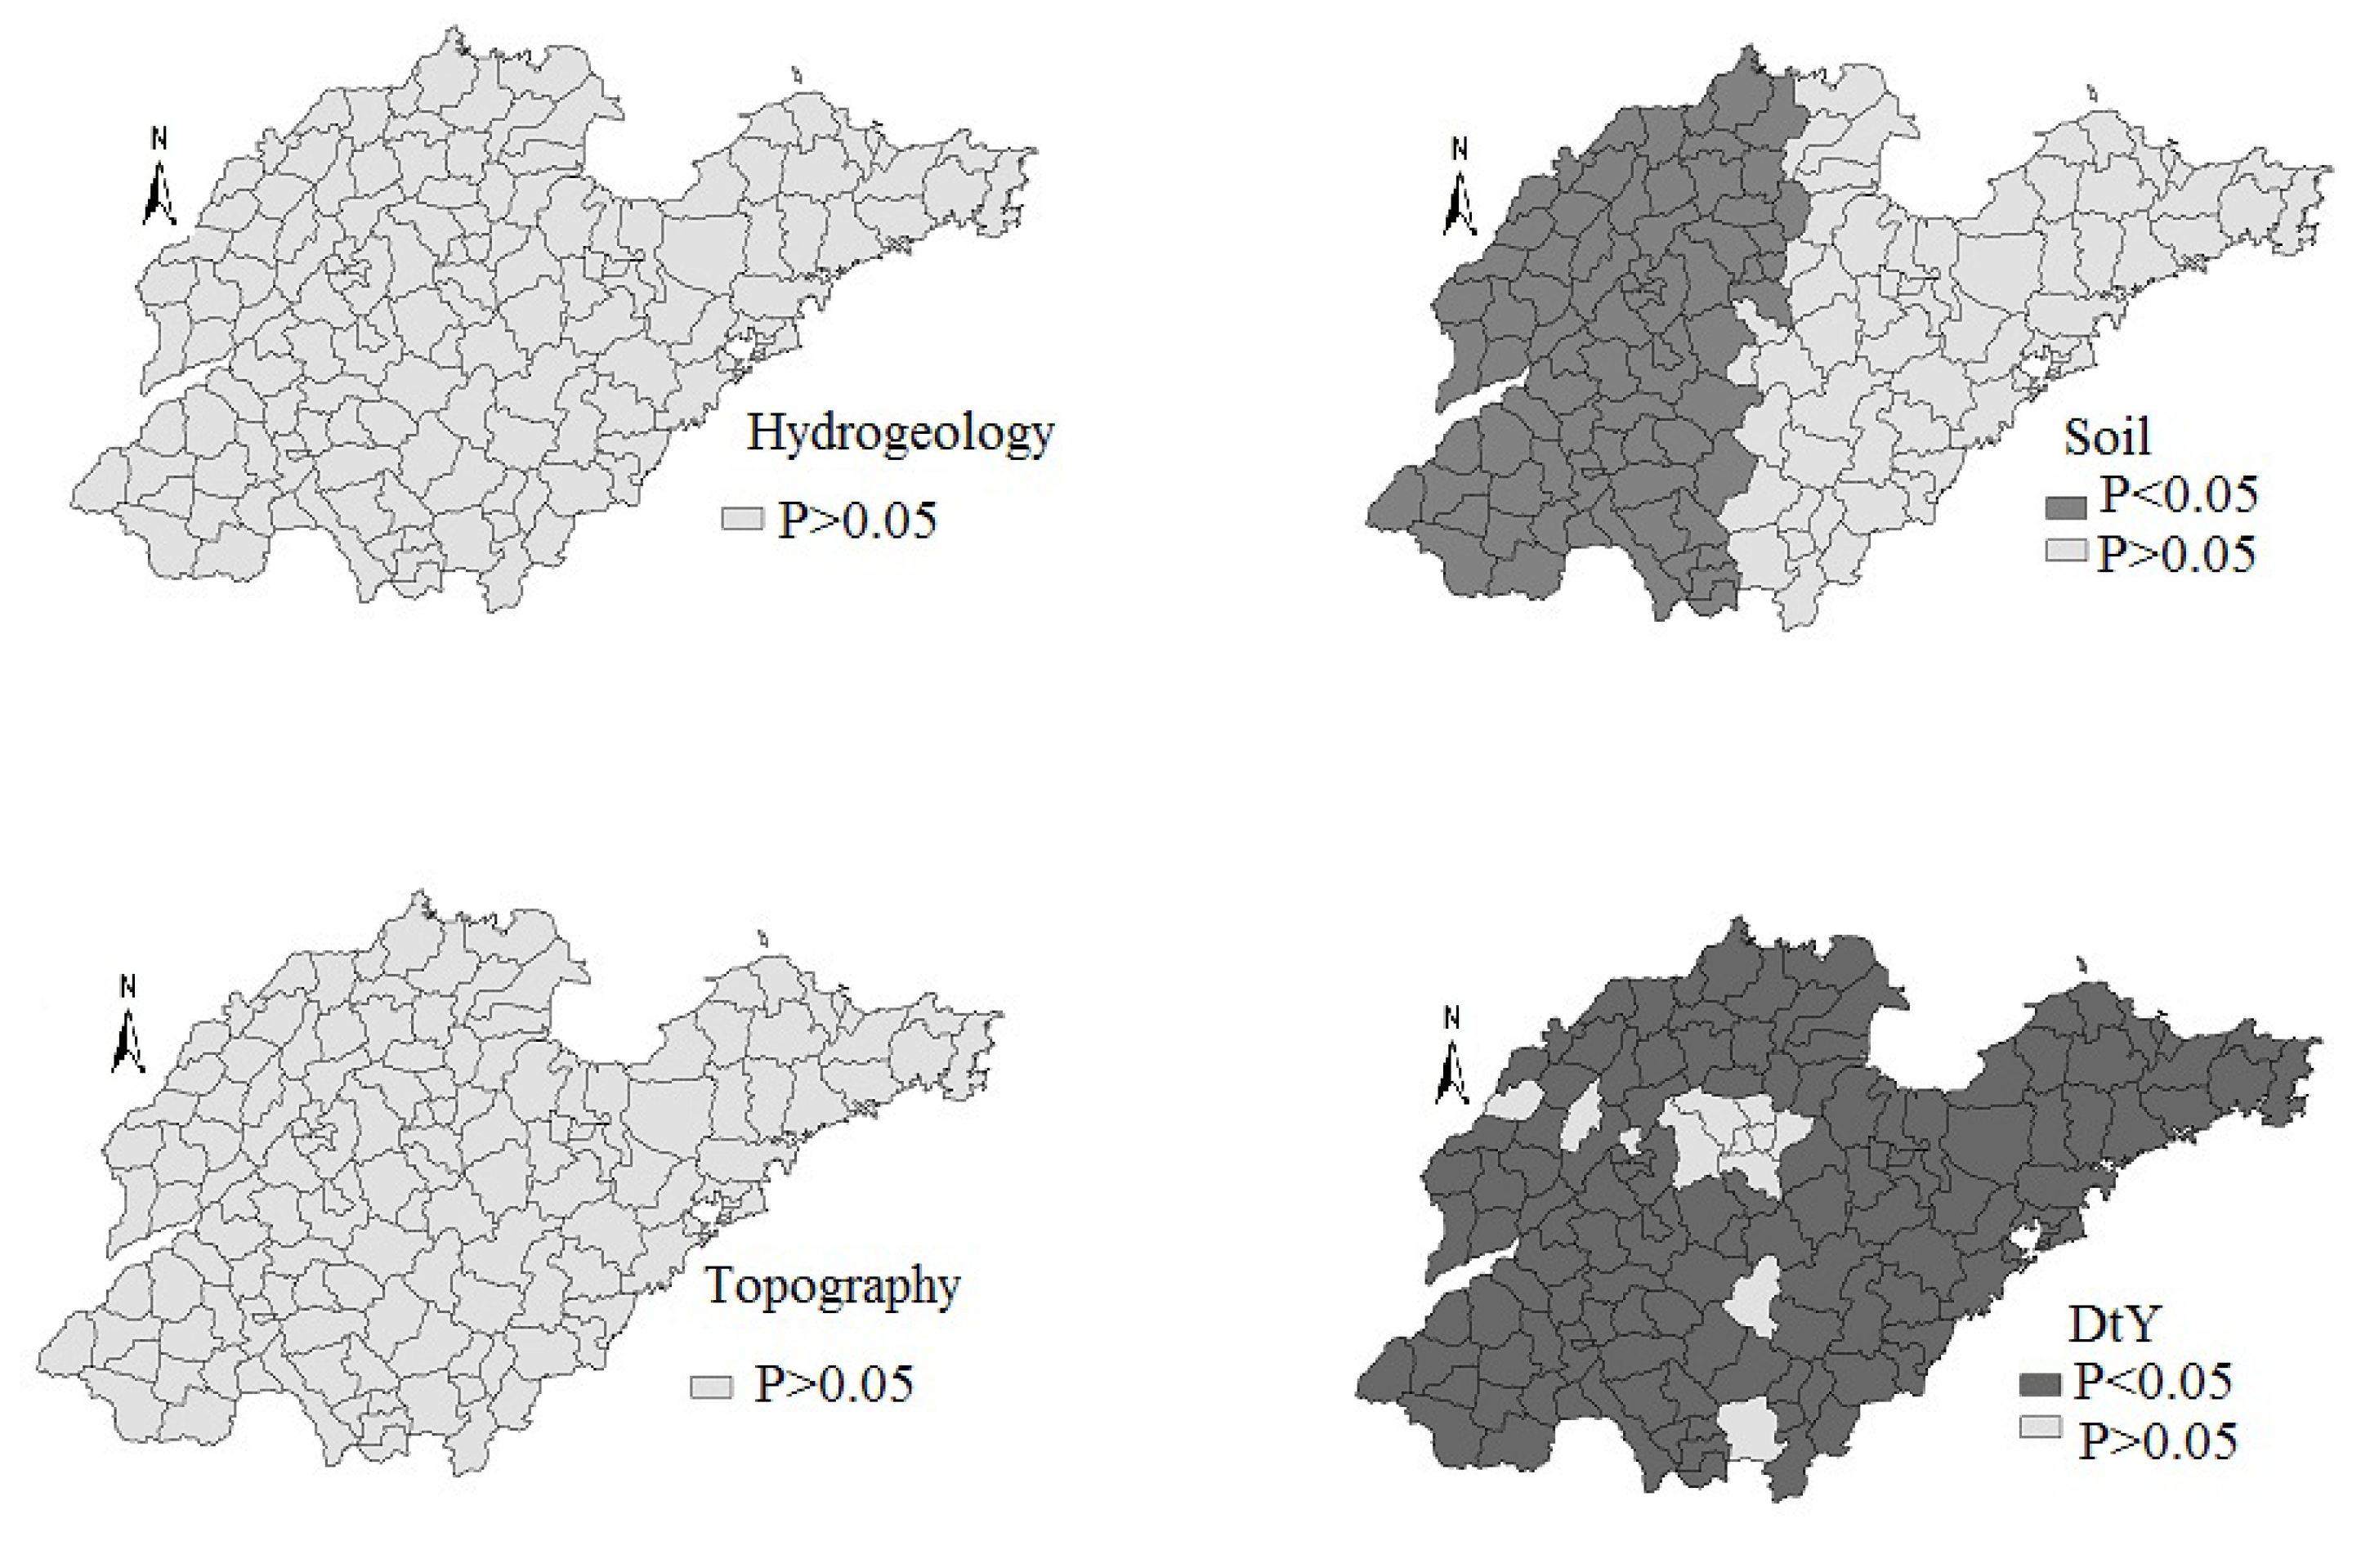
3.5. Local Spatial Dependence between Iodine Concentration and Geological Factors

Table 4 summarizes the results of GWR between iodine concentration and geographical factors, which indicated that there was large spatial variability in the parameter estimates across different regions. The R2 increased from 0.53 in GLMs to 0.63 in GWR, indicating that the GWR fitted the data better.
Table 4. The parameter estimates of the GWR model.
VariableMinimum1st QuartileMedian3rd QuartileMaximum
Intercept0.27590.42640.51660.54690.7620
Hydrogeology −0.01030.00710.01610.02330.0318
Soil−0.1783−0.1024−0.0638−0.00930.0069
Topography0.00670.03550.07520.10380.1353
DtY−0.0009−0.00040.00050.00160.0022
Note: R2 = 0.63, R2 (adjusted) = 0.59.
Figure 5 and Figure 6 showed the contour map of the regression coefficients of four risk factors and their p values. It is clear that the regression coefficients varied spatially, and the local spatial relationship between iodine concentration and geographical factors exhibited a non-constant mean and variance across the whole area.
Figure 5. The coefficients of risk factors in Geographically Weighted Regression.
Ijerph 11 05431 g005
The regression coefficients of “Soil” were mostly negative (some were not statistically significant), except in the East area (Figure 5). The regression coefficients of “Distance to Yellow River” were negative in the east and north of Shandong Province, when the regression coefficients were positive in the other areas. The standardized regression coefficient estimates of “Hydrogeology” and “Topography” were not statistically significant (Figure 6).
Figure 6. The p values of risk factors in geographically weighted regression.
Ijerph 11 05431 g006

4. Discussion

In this study, we mapped the distribution of iodine in drinking water at the county level in Shandong Province, China. Then spatial autocorrelation and spatial scan statistics analyses were conducted to investigate the highlighted geographic areas with significantly high concentrations of iodine. Besides, the GLMs and GWR were used to uncover the relationships between iodine concentration and geological factors. To our knowledge, this is the first study focusing on the spatial pattern of iodine in drinking water and relationships between iodine concentration and geological factors in Shandong Province.
The distribution of iodine in drinking water in Shandong Province was clustered, indicated by the significantly global Moran’s I (I = 0.52, p < 0.001). While, the Local Moran’s I and spatial scan statistic detected similar and significant high-risk clusterings. Both spatial cluster detection methods identified two nearly the same regions of high iodine, with one located in the south west (including nine counties) and the other located in the northwest (including nine by Local Moran’s I or 11 counties by spatial scan statistic). The two cluster areas were all located on the Yellow River flood plain. This finding should help policy makers to design better monitoring strategies, e.g., intensifying the surveillance in the cluster areas and draft suitable strategies for water improvement. It should be pointed out that only high-value clustering areas were detected in our study, although either iodine excess or deficiency can cause thyroid hormone disorders. Because the current iodine nutrition status of population was adequate and preliminary elimination of iodine-deficiency disorders was achieved since universal salt iodization (USI) implemented in China from 1995, including Shandong Province [33,34,35].
One possible reason for the high levels of iodine in drinking-water is that the Yellow River caused iodine deposits in the areas through flooding [36]. The iodine in drinking water mainly depended on the geological factors. In previous studies, researchers mainly focused on describing the geological characteristics in the high iodine areas, aiming at seeking the reasons for high iodine [37,38,39]. They found that the reasons for high iodine maybe related to the Yellow River. But in the present study, the dependence relationships between iodine concentration and geological factors were studied for the first time. GRW was used to analyze the local relationship between iodine concentration in drinking water and geological factors. The soil type and distance to Yellow River showed significant impacts on the iodine concentration. The iodine in drinking water in areas with cinnamon soil was higher than the other types. Generally, the iodine concentration decrease with the increasing of distance to the Yellow River. The distribution of cinnamon soil in Shandong Province was consistent with the high iodine areas. It was mainly located on the Yellow River flood plain, and it was caused by the Yellow River through flooding. This supported, to some extent, the hypothesis that Yellow River caused iodine deposits in the Shandong Province and their relationships showed obvious spatial variability reflected by the contour map of the regression coefficients of GWR model (Figure 5). To some extent, it was decided by the spatial distribution of the iodine in drinking water. Counties with iodine sufficiency were mostly located in west and east part, while counties with iodine deficiency were mostly located in the middle of Shandong Province. This indicated that the effect of geological factors on the concentration in drinking-water was different in different regions, suggesting that the local prevention strategies and monitoring schemes should be formulated according to the local association of the geological factors and iodine in drinking-water. Besides, the average R-square (0.63) of the GWR model was larger than the R-square (0.53) of GLM. It indicated that the fit of the GWR model was better than that of the GLM.
There are several limitations that deserve discussion. First, our spatial regression analysis was based on the county scale, but the distribution of iodine in drinking-water was also not homogeneous at the county level, so our study can’t identify the spatial heterogeneity within each unit. Secondly, the water iodine samples were investigated in two years, and were detected by 17 laboratories. So this might lead to some unexpected bias for the results, although standardized samples from the China External Quality Control were used. Thirdly, we did not assess the potential socioeconomic factors that could be associated with clustering since it is not a survey-based study.

5. Conclusions

The spatial distribution and cluster areas of iodine in drinking-water in Shandong Province were investigated and the relationship between the iodine concentration and geological factors were explored. The results showed that the distribution of iodine in drinking water in Shandong Province was clustered. Two high iodine cluster regions were detected, which suggested that more epidemiological and nutritional investigation should be conducted in the high iodine areas. Besides, the results indicated the “non-stationary” nature of the local relationship. Local prevention strategies and monitoring schemes should be formulated according to the local association of the geological factors and iodine in drinking-water. More important, our research showed that soil type and distance to the main course of the Yellow River were the main factors for the iodine concentration in drinking water. This can provide useful information to explore the reasons for the presence of high iodine levels in Shandong Province.

Acknowledgments

This research was supported by the National Natural Science Foundation of China (Grants No.: 81273026, 81102167, 81172609, and J1210041), Specialized Research Fund for the Doctoral Program of Higher Education, SRFDP (Grant No.: 20110071120040), a Foundation for the Author of National Excellent Doctoral Dissertation of China (FANEDD) (201186), and the National S&T Major Program (2012ZX10004220, 2008ZX10004-011), the Ecological Environment and Humanities/Social Sciences Interdisciplinary Research Project of Tyndall Center of Fudan University (FTC98503A09), the Talent Programs for Fostering Outstanding Youth of Shanghai (XYQ2013071), and the Independent Research Project of Fudan University (20520133105).

Author Contributions

Jie Gao, Zhijie Zhang and Qingwu Jiang had the original idea for the study. Jianchao Bian, Wen Jiang, Xiaoming Wang were responsible for data collecting. Jie Gao, Yi Hu and Liqian Sun carried out the analyses. All the authors drafted the manuscript, and approved the final one.

Conflicts of Interest

The authors declare no conflict of interest.

References

  1. World Health Organization. Assessment of Iodine Deficiency Disorders and Monitoring Their Elimination: A Guide for Programmer Managers, 3rd ed.; World Health Organization: Geneva, Switzerland, 2007. [Google Scholar]
  2. Delange, F.; Bürgi, H.; Chen, Z.; Dunn, J. World status of monitoring iodine deficiency disorders control programs. Thyroid 2002, 12, 915–924. [Google Scholar] [CrossRef]
  3. Zhao, J.; Wang, P.; Shang, L.; Sullivan, K.M.; van der Haar, F.; Maberly, G. Endemic goiter associated with high iodine intake. Am. J. Public Health 2000, 90, 1633–1635. [Google Scholar] [CrossRef]
  4. Teng, W.; Shan, Z.; Teng, X.; Guan, H.; Li, Y.; Teng, D.; Jin, Y.; Yu, X.; Fan, C.; Chong, W. Effect of iodine intake on thyroid diseases in China. N. Engl. J. Med. 2006, 354, 2783–2793. [Google Scholar] [CrossRef]
  5. Sang, Z.; Wei, W.; Zhao, N.; Zhang, G.; Chen, W.; Liu, H.; Shen, J.; Liu, J.; Yan, Y.; Zhang, W. Thyroid dysfunction during late gestation is associated with excessive iodine intake in pregnant women. J. Clin. Endocrinol. Metab. 2012, 97, 1363–1369. [Google Scholar] [CrossRef]
  6. Sang, Z.; Chen, W.; Shen, J.; Tan, L.; Zhao, N.; Liu, H.; Wen, S.; Wei, W.; Zhang, G.; Zhang, W. Long-term exposure to excessive iodine from water is associated with thyroid dysfunction in children. J. Nutr. 2013, 143, 2038–2043. [Google Scholar] [CrossRef]
  7. Zhao, J.; Guo, C.; Yu, Z. The study of prevalence law and distribution for the high water iodine endemic goiter in Hebei . China Prev. Med. 1987, 21, 296–299. (In Chinese) [Google Scholar]
  8. Shen, H.; Liu, S.; Sun, D.; Zhang, S.; Su, X.; Shen, Y.; Han, H. Geographical distribution of drinking-water with high iodine level and association between high iodine level in drinking-water and goitre: A Chinese national investigation. Br. J. Nutr. 2011, 106, 243–247. [Google Scholar] [CrossRef]
  9. Jiang, W.; Wang, J.; Wang, X.; Liu, Y.; Wang, X.; Huang, J.M.; Bian, J.C. Survey of “iodine suitable” region in iodine-deficient areas in Shandong province. Chin. J. Endemiol. 2012, 31, 71–73. (In Chinese) [Google Scholar]
  10. Wang, J.; Bian, J.; Jiang, W.; Huang, J.M.; Wang, L.F.; Qing, Y.P.; Cui, R. Investigation of iodine level in drinking water in iodine deficiency areas in Shandong province. Chin. J. Endemiol. 2010, 29, 652–655. (In Chinese) [Google Scholar]
  11. Guo, X.; Qin, Q.; Bian, J.C.; Liu, C.J.; Wang, X.; Liu, Y.; Huang, J.M.; Zhai, L.P.; Jiang, W.; Chen, Z.P. Distribution and characteristic of areas with high iodine concentration in drinking water in Shandong province. J. Public Health 2005, 21, 403–405. (In Chinese) [Google Scholar]
  12. Sang, Z.; Wang, P.P.; Yao, Z.; Shen, J.; Halfyard, B.; Tan, L.; Zhao, N.; Wu, Y.; Gao, S.; Tan, J. Exploration of the safe upper level of iodine intake in euthyroid Chinese adults: A randomized double-blind trial. Am. J. Clin. Nutr. 2012, 95, 367–373. [Google Scholar] [CrossRef]
  13. Fantong, W.Y.; Satake, H.; Ayonghe, S.N.; Suh, E.C.; Adelana, S.M.; Fantong, E.B.; Banseka, H.S.; Gwanfogbe, C.D.; Woincham, L.N.; Uehara, Y.; et al. Geochemical provenance and spatial distribution of fluoride in groundwater of Mayo Tsanaga River Basin, Far North Region, Cameroon: Implications for incidence of fluorosis and optimal consumption dose. Environ. Geochem. Health 2010, 32, 147–163. [Google Scholar] [CrossRef]
  14. Chen, H.; Yan, M.; Yang, X.; Chen, Z.; Wang, G.; Schmidt-Vogt, D.; Xu, Y.; Xu, J. Spatial distribution and temporal variation of high fluoride contents in groundwater and prevalence of fluorosis in humans in Yuanmou County, Southwest China. J. Hazard. Mater. 2012, 235–236, 201–209. [Google Scholar]
  15. Minelli, G.; Conti, S.; Manno, V.; Olivieri, A.; Ascoli, V. The geographical pattern of thyroid cancer mortality between 1980 and 2009 in Italy. Thyroid 2013, 23, 1609–1618. [Google Scholar] [CrossRef]
  16. Wang, J.; Li, H.; Li, Y.; Yu, J.; Yang, L.; Feng, F.; Chen, Z. Speciation, distribution, and bioavailability of soil selenium in the tibetan plateau kashin-beck disease area-a case study in songpan county, Sichuan Province, China. Biol. Trace Elem. Res. 2013, 156, 367–375. [Google Scholar] [CrossRef]
  17. Lv, S.M.; Xie, L.J.; Zhou, R.H.; Chong, Z.S.; Jia, L.H.; Jing, M.A.; Zhao, J.; Xu, D. Control of iodine deficiency disorders following 10-year universal salt iodization in Hebei Province of China. Biomed. Environ. Sci. 2009, 22, 472–479. [Google Scholar]
  18. Wang, Y.; Zhang, Z.; Ge, P.; Wang, Y.; Wang, S. Iodine deficiency disorders after a decade of universal salt iodization in a severe iodine deficiency region in China. Indian J. Med. Res. 2009, 130, 413–417. [Google Scholar]
  19. Huang, J.M.; Wang, J.B.; Wang, X.M.; Jiang, W.; Liu, Y. Analysis of effect of universal salt iodization on iodine nutrition among children aged 8–10 years in iodine deficiency area in Shandong Province. Chin. J. Endemiol. 2008, 27, 543–544. (In Chinese) [Google Scholar]
  20. Gao, J.; Zhang, Z.J.; Wang, Z.L.; Bian, J.C.; Wang, J.B.; Jiang, W.; Wang, X.M.; Jiang, Q.W. Spatial distribution characteristics of iodine in drinking water in Shandong province between year 2008 and 2010. Zhonghua Yu Fang Yi Xue Za Zhi 2013, 47, 18–22. (In Chinese) [Google Scholar]
  21. Krami, L.K.; Amiri, F.; Sefiyanian, A.; Shariff, A.R.; Tabatabaie, T.; Pradhan, B. Spatial patterns of heavy metals in soil under different geological structures and land uses for assessing metal enrichments. Environ. Monit. Assess. 2013, 185, 9871–9888. [Google Scholar] [CrossRef]
  22. Wang, Y.B.; Liu, C.W.; Liao, P.Y.; Lee, J.J. Spatial pattern assessment of river water quality: Implications of reducing the number of monitoring stations and chemical parameters. Environ. Monit. Assess. 2014, 186, 1781–1792. [Google Scholar]
  23. Liang, S.; Li, X.; Xu, H.; Wang, X.; Gao, N. Spatial-based assessment of heavy metal contamination in agricultural soils surrounding a non-ferrous metal smelting zone. Bull. Environ. Contam. Toxicol. 2013, 91, 526–532. [Google Scholar] [CrossRef]
  24. What Is GIS? Available online: http://www.esri.com/what-is-gis (accessed on 8 May 2014).
  25. Wong, D.W.S.; Lee, J. Statistical Analysis of Geographic Information with ArcView GIS and ArcGIS; John Wiley & Sons: Hoboken, NJ, USA, 2005. [Google Scholar]
  26. Anselin, L. Local indicators of spatial association—LISA. Geogr. Anal. 1995, 27, 93–115. [Google Scholar] [CrossRef]
  27. SaTScan™ Software for the Spatial, Temporal, and Space-Time Scan Statistics. Available online: http://www.satscan.org/ (accessed on 8 May 2014).
  28. Kulldorff, M.; Athas, W.F.; Feurer, E.J.; Miller, B.A.; Key, C.R. Evaluating cluster alarms: A space-time scan statistic and brain cancer in Los Alamos, New Mexico. Am. J. Public Health 1998, 88, 1377–1380. [Google Scholar] [CrossRef]
  29. Kulldorff, M.; Heffernan, R.; Hartman, J.; Assuncao, R.; Mostashari, F. A space-time permutation scan statistic for disease outbreak detection. PLoS Med. 2005, 2. [Google Scholar] [CrossRef] [Green Version]
  30. Lin, C.H.; Wen, T.H. Using geographically weighted regression (GWR) to explore spatial varying relationships of immature mosquitoes and human densities with the incidence of dengue. Int. J. Environ. Res. Public Health 2011, 8, 2798–2815. [Google Scholar] [CrossRef]
  31. Hu, M.; Li, Z.; Wang, J.; Jia, L.; Liao, Y.; Lai, S.; Guo, Y.; Zhao, D.; Yang, W. Determinants of the incidence of hand, foot and mouth disease in China using geographically weighted regression models. PLoS One 2012, 2. [Google Scholar] [CrossRef]
  32. Liu, D.; Zhao, J.; Zhu, H. Determination and Classification of the Areas of High Water Iodine and the Endemic Areas of Iodine Excess Goiter; GB/T19380–2003; National Standard of China: Beijing, China, 2003. [Google Scholar]
  33. Fotheringham, A.S.; Brunsdon, C.; Charlton, M.E. Geographically weighted regression: A natural evolution of the expansion method for spatial data analysis. Environ. Plan. A 1998, 30, 1905–1927. [Google Scholar] [CrossRef]
  34. Li, X.; Sun, X.; Jin, L.; Xue, F. Worldwide spatial genetic structure of angiotensin-converting enzyme gene: A new evolutionary ecological evidence for the thrifty genotype hypothesis. Eur. J. Hum. Genet. 2011, 19, 1002–1008. [Google Scholar] [CrossRef]
  35. Dijkstra, A.; Janssen, F.; de Bakker, M.; Bos, J.; Lub, R.; van Wissen, L.J.; Hak, E. Using spatial analysis to predict health care use at the local level: A case study of type 2 diabetes medication use and its association with demographic change and socioeconomic status. PLoS One 2013, 30, e72730. [Google Scholar]
  36. Guo, X.W.; Zhai, L.P.; Liu, Y.; Wang, X. Study on the present status of the areas with high iodine concentration in drinking water and edible salt at household levels in Ohio of Yellow River. Wei Sheng Yan Jiu 2005, 34, 695–697. (In Chinese) [Google Scholar]
  37. Wang, M.; Pang, X.; Gao, Z.; Bian, J.C.; Dai, J.R.; Zhang, Z.X. The relationship between the goiter induced by excessive iodine and the geological environment of several cities in the Lower Yellow River Basin of Shandong Province. Geol. China 2010, 37, 803–807. (In Chinese) [Google Scholar]
  38. Pang, X.; Gao, Z.J.; Bian, J.C.; Wang, H.J.; Wang, M. The correlation between endemic diseases and eco-geochemical environment in the lower Yellow River basin, Shandong Province. Geol. China 2010, 37, 824–830. (In Chinese) [Google Scholar]
  39. Zhang, Z.H.; Dai, X.F; Wang, C.H.; Hu, Y.H.; Liu, Z.H.; Yue, G.L.; Zhao, F.Y.; Wang, Z.K. Relationship between endemic diseases and environmental geochemistry in the Yarlung Zangbo Great Canyon area. Geol. China 2006, 33, 1424–1429. (In Chinese) [Google Scholar]

