
An Investigation into the Lifestyle, Health Habits and Risk Factors of Young Adults

Abstract
:
1. Introduction
2. Method
2.1. Participants
2.2. Research Site and Procedures
2.3. Lifestyle Questionnaire
2.4. Body Mass Index (BMI) Measurement
2.5. Statistical Analysis
3. Results

| Gender | Age | Height | Weight | BMI |
|---|---|---|---|---|
| Males | 22.0 ± 4.5 | 174.7 ± 6.9 | 76.2 ± 16.8 | 24.9 ± 5.1 |
| Females | 20.6 ± 3.1 | 161.9 ± 8.3 | 64.9 ± 17.9 | 20.6 ± 3.1 |

| Year | Gender | Physical Activity Index (MET-min Per Week) | ||
|---|---|---|---|---|
| Inactive | Minimally Active | Active | ||
| Year 1 | Males | 17.7% | 12.5% | 69.8% |
| Females | 50.9% | 23.3% | 25.8% | |
| Total | 38.6% | 19.3% | 42.1% | |
| Year 2 | Males | 27.3% | 12.2% | 51.5% |
| Females | 52.5% | 20.6% | 27% | |
| Total | 40.3% | 20.9% | 38.8% | |
| Year 3 | Males | 28.9% | 20% | 51.1% |
| Females | 78.9% | 5.8% | 15.4% | |
| Total | 55.7% | 12.4% | 32% | |
| Year 4 | Males | 46.2% | 19.2% | 34.6% |
| Females | 71.7% | 15.2% | 13% | |
| Total | 62.5% | 16.7% | 20.8% | |
| Nationality | Gender | Physical Activity Index (MET-min Per Week) | ||
|---|---|---|---|---|
| Inactive | Minimally Active | Active | ||
| Qatari | Males | 28.9% | 20.3% | 50.8% |
| Females | 61.8% | 19.3% | 18.9% | |
| Total | 50.8% | 19.6% | 29.6% | |
| Non-Qatari | Males | 26.3% | 16% | 57.7% |
| Females | 49.1% | 22% | 28.9% | |
| Total | 36.5% | 18.7% | 44.8% | |


| Cluster | Cluster 1 (n = 218, 42.2%) | Cluster 2 (n = 126, 24.4%) | Cluster 3 (n = 172, 33.3%) |
|---|---|---|---|
| High Risk Factors | Moderate Risk Factors | Low Risk Factors | |
| Risk Factor behaviours | Mean | Mean | Mean |
| Healthy Dietary Habits | |||
| Fruits (servings/week) | 2.98 | 3.90 | 4.42 |
| Vegetables (servings/week) | 3.72 | 4.24 | 5.41 |
| Breakfast (servings/week) | 2.77 | 3.33 | 4.52 |
| Milk (servings/week) | 4.21 | 4.38 | 4.90 |
| Unhealthy Dietary Habits | |||
| Surgery foods (servings/week) | 4.94 | 3.37 | 2.68 |
| Fast foods (servings/week) | 3.92 | 2.90 | 1.20 |
| Fried potatoes (servings/week) | 3.61 | 2.61 | 1.09 |
| Energy drinks (servings/week) | 0.40 | 2.02 | 0.10 |
| Physical Activity Behaviour | |||
| PA behaviour | |||
| (total MET-min/week) | 1241.79 | 4604.56 | 1351.06 |
| TV viewing time (h/day) | 3.26 | 2.14 | 2.80 |
| Computer viewing time (h/day) | 1.91 | 1.50 | 1.95 |
| BMI (kg/m2) | 25.15 | 23.43 | 24.90 |
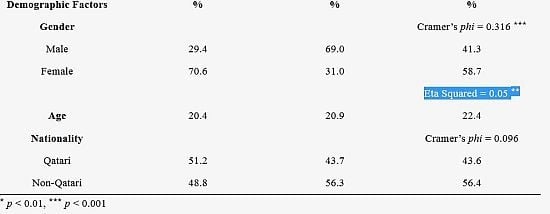
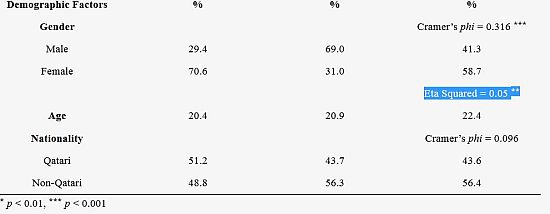
| Demographic Factors | % | % | % |
| Gender | Cramer’s phi = 0.316 *** | ||
| Male | 29.4 | 69.0 | 41.3 |
| Female | 70.6 | 31.0 | 58.7 |
| Eta Squared = 0.05 ** | |||
| Age | 20.4 | 20.9 | 22.4 |
| Nationality | Cramer’s phi = 0.096 | ||
| Qatari | 51.2 | 43.7 | 43.6 |
| Non-Qatari | 48.8 | 56.3 | 56.4 |
4. Discussion
5. Conclusions
Acknowledgments
Author Contributions
Conflict of Interest
References
- Department of Health; Physical Activity; Health Improvement and Protection. At Least Five a Week: Evidence on the Impact of Physical Activity and its Relationship to Health; Crown: London, UK, 2004. [Google Scholar]
- Swinburn, B.A.; Sacks, G.; Hall, K.D.; McPherson, K.; Finegood, D.T.; Moodie, M.L.; Gortmaker, S.L. The global obesity pandemic: Shaped by global drivers and local environments. Lancet 2011, 378, 804–814. [Google Scholar] [CrossRef] [PubMed]
- Sassi, F.; Devaux, M.; Cecchini, M.; Rusticalli, E. The Obesity Epidemic: Analysis of Past and Projected Future Trends in Selected OECD Countries; Organisation for Economic Co-operation and Development (OECD); Directorate for Employment; Labour and Social Affairs; Health Committee: Paris, France, 2009. [Google Scholar]
- Finucane, M.M.; Stevens, G.A.; Cowan, M.J.; Danaei, G.; Lin, J.K.; Paciorek, C.J.; Singh, G.M.; Gutierrez, H.R.; Lu, Y.; Bahalim, A.N.; et al. National, regional, and global trends in body-mass index since 1980: Systematic analysis of health examination surveys and epidemiological studies with 960 country-years and 9.1 million participants. Lancet 2011, 377, 557–567. [Google Scholar] [CrossRef]
- Lobstein, T.; Leach, R. Tackling Obesities: Future Choices—International Comparisons of Obesity Trends, Determinants and Responses—Evidence Review; Government Office for Science: London, UK, 2007. [Google Scholar]
- Ng, S.W.; Zaghloulm, S.; Ali, H.I.; Harrison, G.; Popkin, B.M. The prevalence and trends of overweight, obesity and nutrition-related non-communicable diseases in the Arabian Gulf States. Obes. Rev. 2011, 12, 1–13. [Google Scholar] [CrossRef] [PubMed]
- Al-Nuaim, A.A.; Al-Nakeeb, Y.; Lyons, M.; Al-Hazzaa, H.; Nevill, A.; Collins, P.; Duncan, M.J. The prevalence of physical activity and sedentary behaviours relative to obesity among adolescents from Al-Ahsa, Saudi Arabia: Rural vs. urban variations. J. Nutr. MeTable 2012, 2012. [Google Scholar] [CrossRef]
- Al-Nakeeb, Y.; Dodd, L.; Lyons, M.; Collins, P.; Al Nuaim, A.A. A cluster analysis of lifestyle and health habits of youth from two geographically and culturally diverse countries. Open J. Prev. Med. 2014, 4, 193–203. [Google Scholar] [CrossRef]
- World Health Organization (WHO). World Health Statistics—2014; World Health Organization (WHO) Press: Geneva, Switzerland, 2014. [Google Scholar]
- Bener, A.; Al-Suwaidi, J.; Al-Jaber, K.; Al-Marri, S.; Elbagi, I.E.A. Epidemiology of hypertension and its associated risk factors in the Qatari population. J. Hum. Hyperten. 2004, 18, 529–530. [Google Scholar] [CrossRef]
- Al-Hazzaa, H. Prevalence of physical inactivity in Saudi Arabia: A brief review. East. Mediter. Health J. 2004, 10, 663–670. [Google Scholar]
- Al-Nakeeb, Y.; Lyons, M.; Collins, P.; Al-Nuaim, A.; Al-Hazzaa, H.; Duncan, M.; Nevill, A. Obesity, physical activity and sedentary behavior amongst British and Saudi youth: A cross-cultural study. Intl. J. Environ. Res. Public Health 2012, 9, 1409–1506. [Google Scholar] [CrossRef] [Green Version]
- Al-Nozha, M.M.; Al-Hazzaa, H.M.; Arafah, M.; Al-Khadra, A.; Al-Mazrou, Y.Y.; Al-Maatouq, M.A.; Khan, N.B.; Al-Marzouki, K.; Al-Harthi, S.S.; Abdullah, M. Prevalence of physical activity and inactivity among Saudis aged 30–70 years: Population-based cross-sectional study. Saudi Med. J. 2007, 28, 559–568. [Google Scholar] [PubMed]
- Al Qauhiz, N.M. Obesity among Saudi female university students: Dietary habits and health behaviours. J. Egypt Public Health Assoc. 2010, 85, 45–59. [Google Scholar] [PubMed]
- Washi, S.A.; Ageib, M.B. Poor diet quality and food habits are related to impaired nutritional status in 13- to 18-year-old adolescents in Jeddah. Nutr. Res. 2010, 30, 527–534. [Google Scholar] [CrossRef] [PubMed]
- Dodd, L.; Al-Nakeeb, Y.; Nevill, A.; Forshaw, M.J. Lifestyle risk factors of students: A cluster analytical approach. Prev. Med. 2010, 51, 73–77. [Google Scholar] [CrossRef] [PubMed]
- Adams, T.; Colner, W. The association of multiple risk factors with fruit and vegetable intake among a nationwide sample of college students. J. Am. Coll. Health 2008, 56, 455–461. [Google Scholar] [CrossRef] [PubMed]
- Chiolero, A.; Wietlisbach, V.; Ruffieux, C.; Paccaud, F.; Cornuz, J. Clustering of risk behaviors with cigarette consumption: A population-based survey. Prev. Med. 2006, 42, 348–353. [Google Scholar] [CrossRef]
- Chou, K. The prevalence and clustering of four major lifestyle risk factors in Hong Kong Chinese older adults. J. Aging Health 2008, 20, 788–803. [Google Scholar] [CrossRef] [PubMed]
- De Vries, H.; Kremers, S.; Smeets, T.; Reubsaet, A. Clustering of diet, physical activity and smoking and a general willingness to change. Psychol. Health 2008, 23, 265–278. [Google Scholar] [CrossRef]
- Keller, S.; Maddock, J.E.; Hannöver, W.; Thyrian, J.R.; Basler, H.D. Multiple health risk behaviors in German first year university students. Prev. Med. 2008, 46, 189–195. [Google Scholar] [CrossRef] [PubMed]
- Poortinga, W. The prevalence and clustering of four major lifestyle risk factors in an English adult population. Prev. Med. 2007, 44, 124–128. [Google Scholar] [CrossRef] [PubMed]
- Pronk, N.P.; Anderson, L.H.; Crain, A.L.; Martinson, B.C.; O’Connor, P.J.; Sherwood, N.E.; Whitebird, R.R. Meeting recommendations for multiple healthy lifestyle factors. Prevalence, clustering, and predictors among adolescent, adult, and senior health plan members. Am. J. Prev. Med. 2004, 27, 25–33. [Google Scholar] [CrossRef] [PubMed]
- Reedy, J.; Haines, P.S.; Campbell, M.K. The influence of health behavior clusters on dietary change. Prev. Med. 2005, 41, 268–275. [Google Scholar] [CrossRef] [PubMed]
- Sanchez, A.; Norman, G.J.; Sallis, J.F.; Calfas, K.J.; Cella, J.; Patrick, K. Patterns and correlates of physical activity and nutrition behaviors in adolescents. Am. J. Prev. Med. 2007, 32, 124–130. [Google Scholar] [CrossRef] [PubMed]
- Theodorakis, Y.; Papaioannou, A.; Hatzigeorgiadis, A.; Papadimitriou, E. Patterns of health-related behaviors among Hellenic students. Hellenic J. Psychol. 2005, 2, 225–242. [Google Scholar]
- Steptoe, A.; Wardle, J. Health behaviour, risk awareness and emotional wellbeing in students from Eastern Europe and Western Europe. Soc. Sci. Med. 2001, 53, 1621–1630. [Google Scholar] [CrossRef] [PubMed]
- Laquatra, I. Nutrition for Weight Management. In Kraus’s Food, Nutrition and Diet Therapy, 10th ed.; Kathleen, M.I., Escott, S.S., Eds.; WB Saunders: Philadelphia, PA, USA, 2000; pp. 485–515. [Google Scholar]
- Ainsworth, B.E.; Haskell, W.L.; Whitt, M.C.; Irwin, M.L.; Swartz, A.M.; Strath, S.J.; O’Brien, W.L.; Bassett, D.R.; Schmitz, K.H.; Emplaincourt, P.O.; et al. Compendium of physical activities: An update of activity codes and MET intensities. Med. Sci. Sport Exerc. 2000, 32, s498–s516. [Google Scholar] [CrossRef]
- Bauman, A.; Bull, F.; Chey, T.; Craig, C.L.; Ainsworth, B.E.; Sallis, J.F.; Bowles, H.R.; Hagstromer, M.; Sjostrom, M.; Pratt, M. The international prevalence study on physical activity: Results from 20 countries. Int. J. Behav. Nutr. Phys. Act. 2009, 6. [Google Scholar] [CrossRef]
- World Health Organization. Global Recommendations on Physical Activity for Health; WHO Press: Geneva, Switzerland, 2010. [Google Scholar]
- Kesaniemi, A.; Riddoch, C.J.; Reeder, B.; Blair, S.N.; Sørensen, T. Advancing the future of physical activity guidelines in Canada: An independent expert panel interpretation of the evidence. Int. J. Behav. Nutr. Phys. Act. 2010, 7. [Google Scholar] [CrossRef] [PubMed] [Green Version]
- Al-Hazzaa, H.; Al-Ahmadi, M. A self-reported questionnaire for the assessment of physical activity in youth 15–25 years: Development, reliability and construct validity. Arab. J. Food Nutr. 2003, 4, 279–291. [Google Scholar]
- World Health Organization (WHO). Global Database on Body Mass Index. Available online: http://www.assessmentpsychology.com/icbmi.htm (accessed on 20 April 2015).
- Everitt, B.; Landau, S.; Leese, M. Cluster Analysis, 4th ed.; Oxford University Press: New York, NY, USA, 2001. [Google Scholar]
- Hair, J.F.; Black, W.C.; Babin, N.J.; Anderson, R.E.; Tatham, R.L. Multivariate Data Analysis; Prentice Hall: New Jersey, NJ, USA, 2005. [Google Scholar]
- Rizk, N.; Amin, M.; Yousef, M. A pilot study on metabolic syndrome and its associated features among Qatari schoolchildren. Int. J. Gen. Med. 2011, 4, 521–525. [Google Scholar] [CrossRef] [PubMed]
- Duncan, M.J.; Al-Hazzaa, H.M.; Al-Nakeeb, Y.; Al-Sobayel, H.I.; Abahussain, N.A.; Musaiger, A.O.; Lyons, M.; Collins, P.; Nevill, A. Anthropometric and Lifestyle Characteristics of Active and Inactive Saudi and British Adolescents. Am. J. Hum. Biol. 2014, 26, 635–642. [Google Scholar] [CrossRef] [PubMed]
- Dietz, W.H. The obesity epidemic in young children. Reduce television viewing and promote playing. Br. Med. J. 2001, 322, 313–334. [Google Scholar] [CrossRef]
- Bener, A.; Kamal, A.A. Growth patterns of Qatari school children and adolescents aged 6–18 years. J. Health Pop. Nutr. 2005, 23, 250–258. [Google Scholar]
- Rizk, N.M.; Yousef, M. Association of lipid profile and waist circumference as cardiovascular risk factors for overweight and obesity among school children in Qatar. Diab. Metabol. Synd. Obes. Targ. Ther. 2012, 5, 425–432. [Google Scholar] [CrossRef]
- Kerkadi, A.; Abdelmonem, H.S.; Adil Eltayeb, Y.M. High prevalence of the risk of overweight and overweight among Qatari children ages 9 through 11. Nutr. Food Sci. 2009, 39, 36–45. [Google Scholar] [CrossRef]
- Davallow, L.; Ayash, H.; el Assad, I.; Khidir, A. The Prevalence of Obesity amongst School Children and Adolescents in Qatar. In Proceedings of the Qatar Foundation Annual Research Forum (BM0 S4), Doha, Qatar, 20–22 November 2011.
- Bartholomew, L.K.; Parcel, G.S.; Kok, G.; Gottlieb, N.H. Intervention Mapping: Designing Theory and Evidence-Based Health Promotion Programs; Mayfield: Mountain View, CA, USA, 2001. [Google Scholar]
© 2015 by the authors; licensee MDPI, Basel, Switzerland. This article is an open access article distributed under the terms and conditions of the Creative Commons Attribution license (http://creativecommons.org/licenses/by/4.0/).
Share and Cite
Al-Nakeeb, Y.; Lyons, M.; Dodd, L.J.; Al-Nuaim, A. An Investigation into the Lifestyle, Health Habits and Risk Factors of Young Adults. Int. J. Environ. Res. Public Health 2015, 12, 4380-4394. https://0-doi-org.brum.beds.ac.uk/10.3390/ijerph120404380
Al-Nakeeb Y, Lyons M, Dodd LJ, Al-Nuaim A. An Investigation into the Lifestyle, Health Habits and Risk Factors of Young Adults. International Journal of Environmental Research and Public Health. 2015; 12(4):4380-4394. https://0-doi-org.brum.beds.ac.uk/10.3390/ijerph120404380
Chicago/Turabian StyleAl-Nakeeb, Yahya, Mark Lyons, Lorna J. Dodd, and Anwar Al-Nuaim. 2015. "An Investigation into the Lifestyle, Health Habits and Risk Factors of Young Adults" International Journal of Environmental Research and Public Health 12, no. 4: 4380-4394. https://0-doi-org.brum.beds.ac.uk/10.3390/ijerph120404380