
The State of Ambient Air Quality in Two Ugandan Cities: A Pilot Cross-Sectional Spatial Assessment

Abstract
:1. Introduction
2. Methods
2.1. Study Design
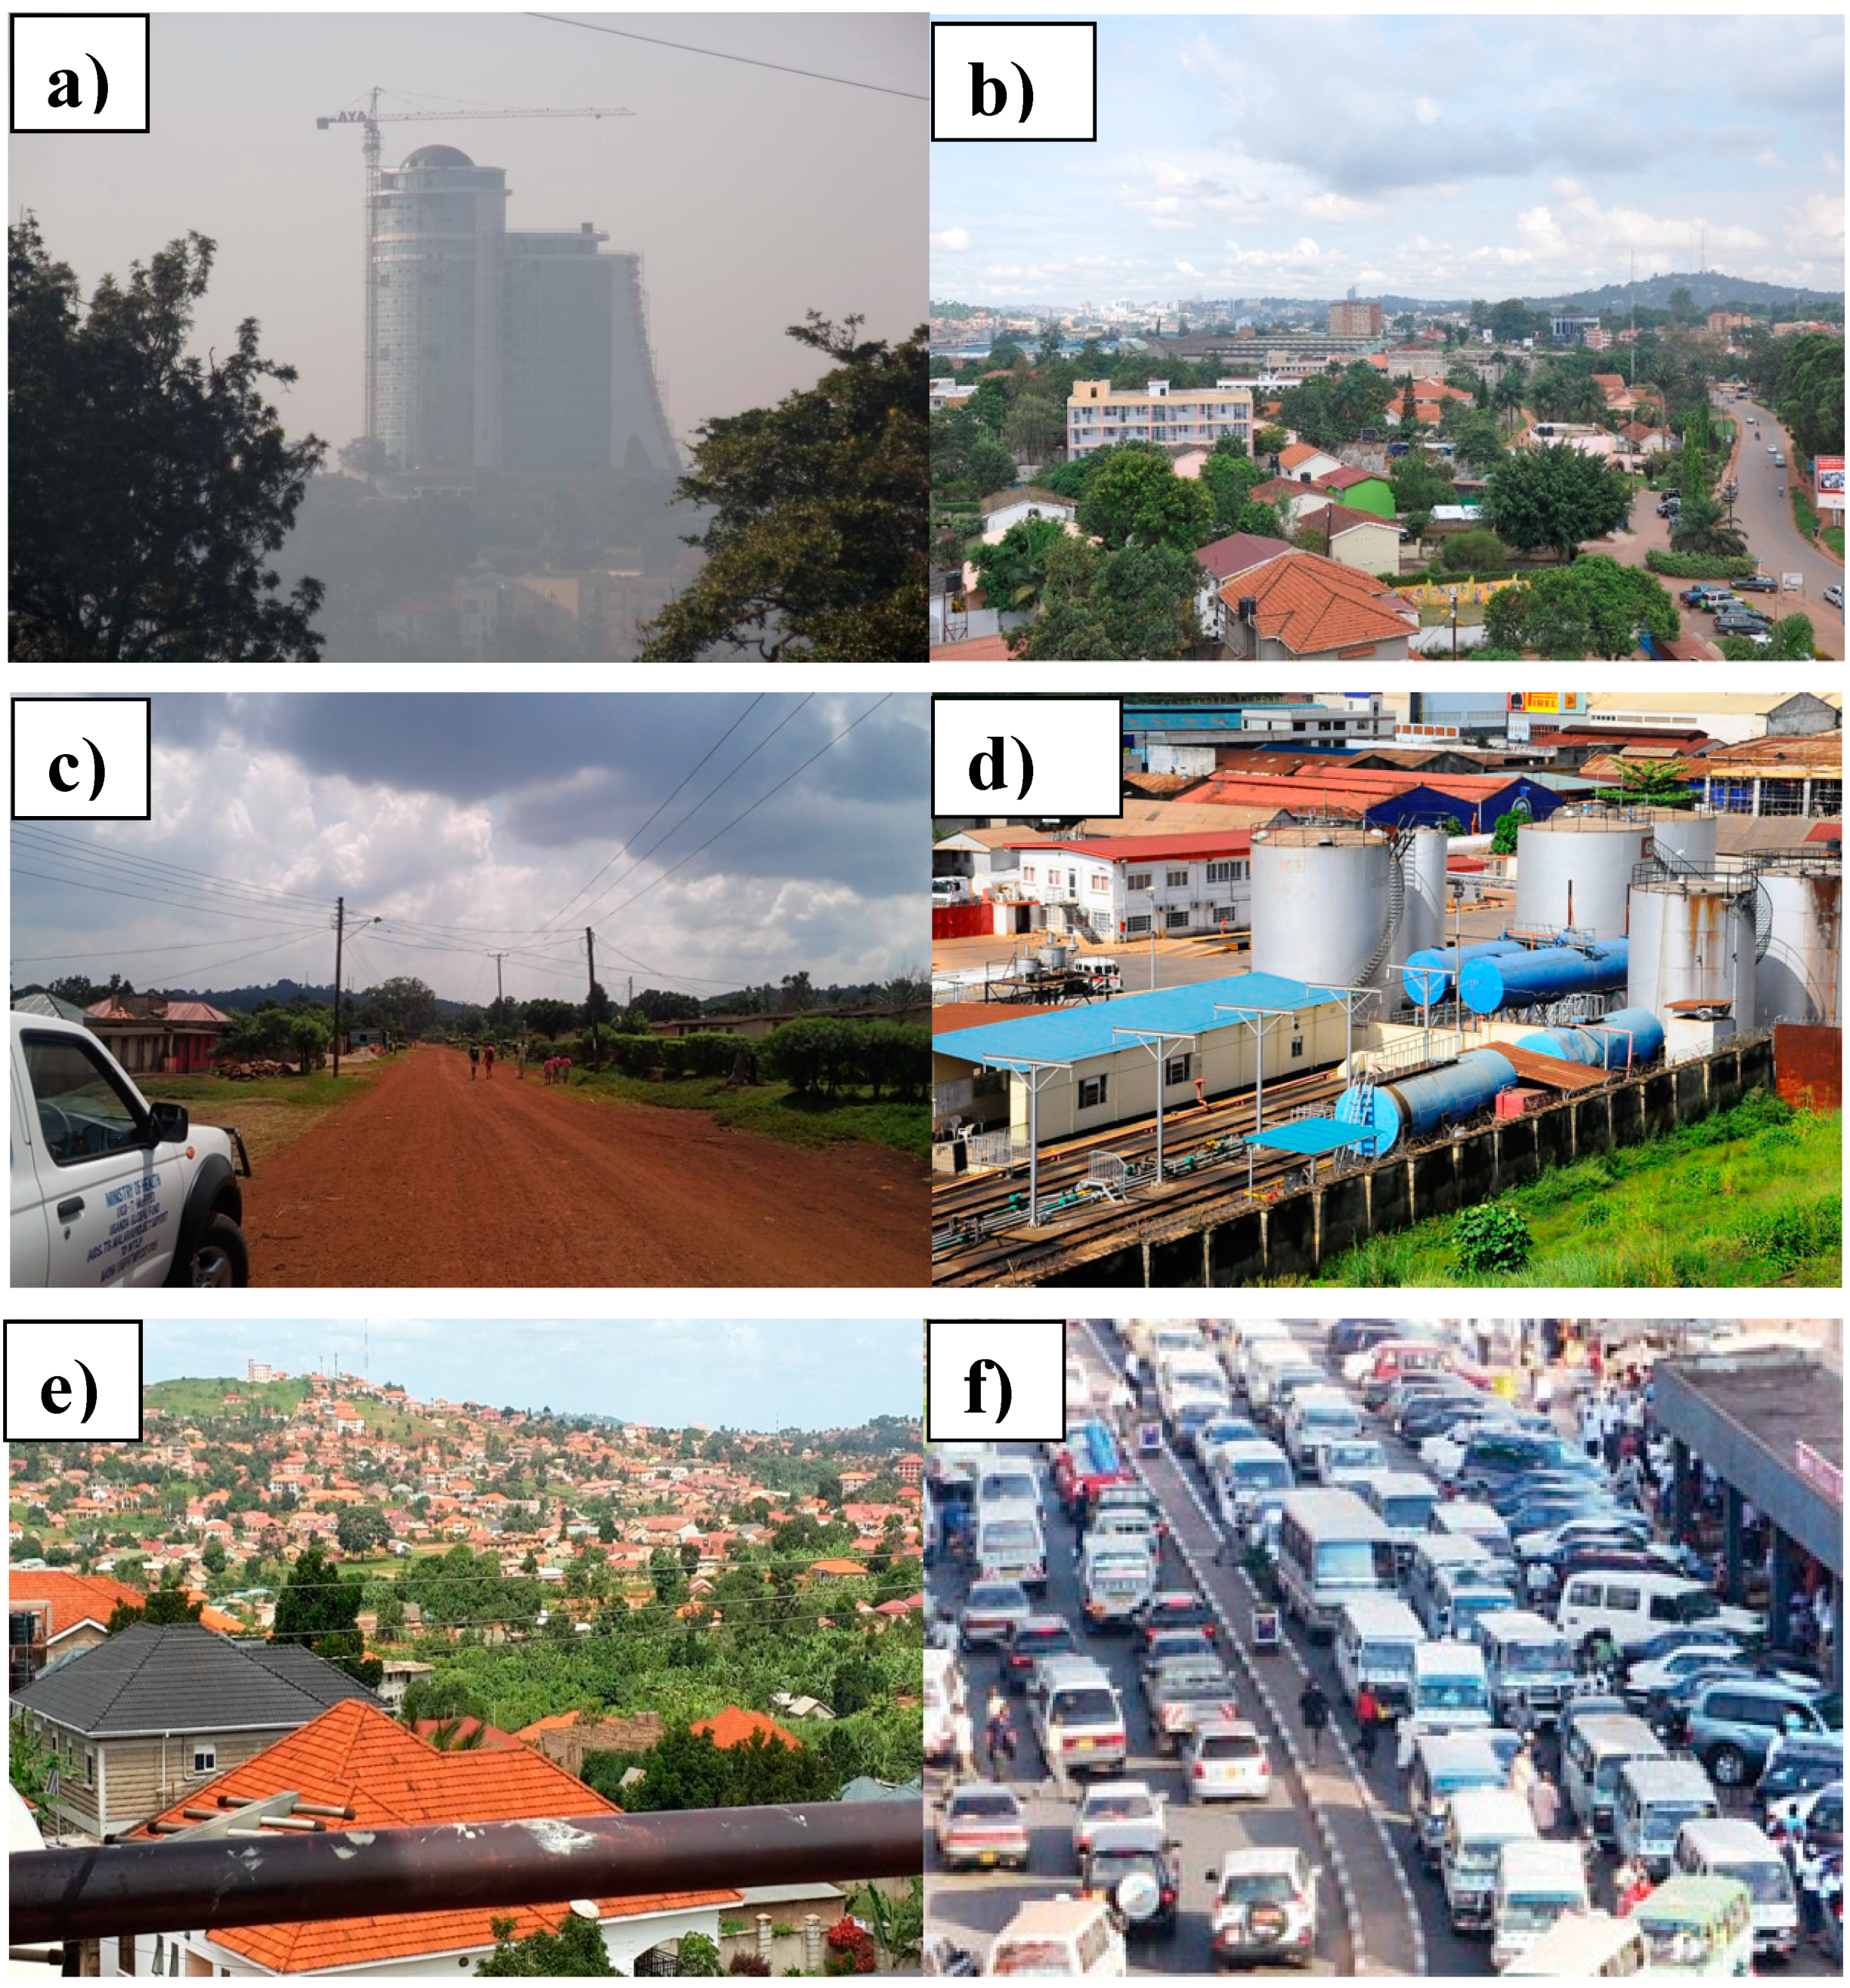
2.2. Study Sites and Monitoring Approaches

2.3. Air Pollutant Sampling Methods
2.4. Meteorological Measurements
2.5. Data Analysis
2.6. Ethics Approval
3. Results
3.1. Temperature and Humidity

| Sampling Date | Minimum Temperature °C | Maximum Temperature °C | Average Temperature °C | Average Relative Humidity % | Wind Speed Km/h | Precipitation mm |
|---|---|---|---|---|---|---|
| 30 June | 19 | 26 | 22 | 80 | 8 | 0.0 |
| 1 July | 18 | 26 | 22 | 77 | 8 | 0.0 |
| 2 July | 18 | 26 | 22 | 77 | 8 | 0.0 |
| 3 July | 19 | 26 | 22 | 80 | 10 | 0.0 |
| 4 July | 19 | 26 | 22 | 76 | 7 | 0.0 |
| 5 July | 17 | 26 | 22 | 76 | 9 | 0.0 |
| 6 July | 19 | 26 | 22 | 70 | 9 | 0.0 |
| 7 July | 18 | 25 | 22 | 81 | 11 | 0.0 |
| 8 July | 18 | 25 | 22 | 75 | 11 | 0.0 |
| 9 July | 19 | 20 | 20 | 96 | 4 | 0.0 |
| 10 July | 18 | 23 | --* | -- | -- | -- |
| 11 July | 17 | 24 | 20 | 76 | 11 | 0.0 |
| 12 July | 20 | 23 | 22 | 84 | 10 | 0.0 |
| 13 July | 19 | 25 | 22 | 76 | 9 | 0.0 |
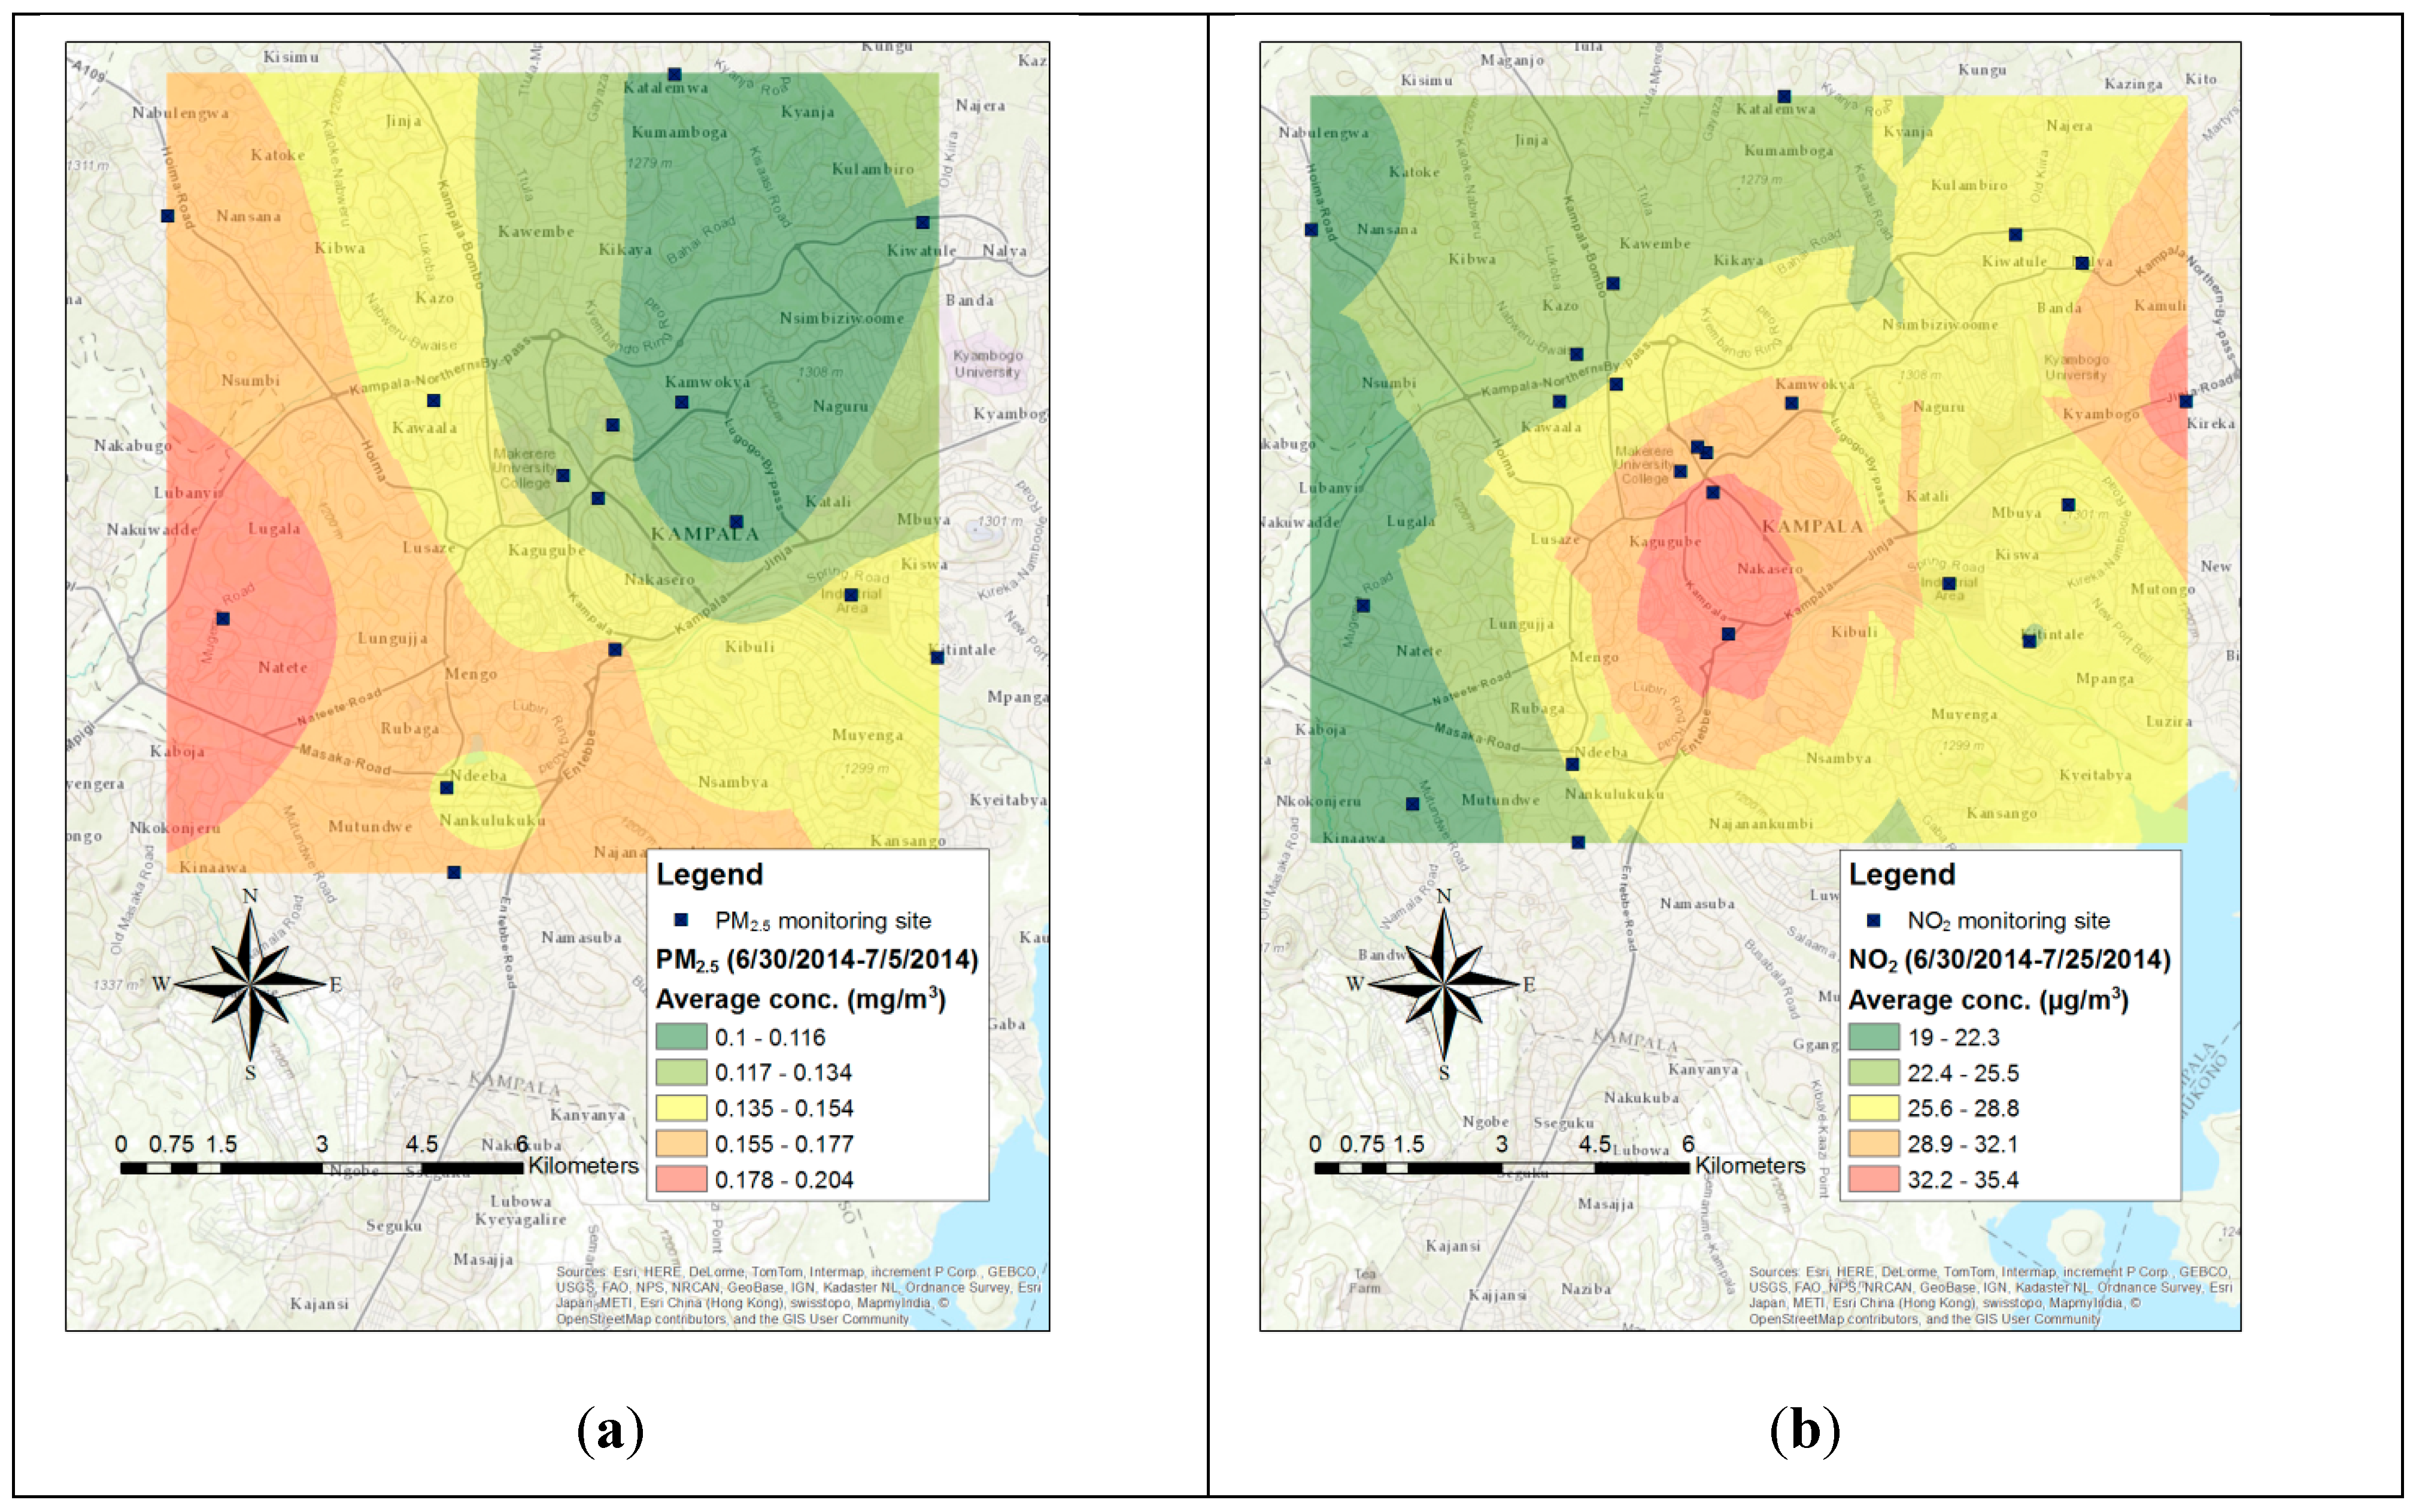
3.2. PM2.5

3.3. Gas Phase Pollutants
| Land Use Category | PM2.5 | NO2 | |||
|---|---|---|---|---|---|
| Mean (SD) 24 Hour Average | Mean (SD) Minimum | Mean (SD) Maximum | Mean (SD) NO2 (µg/M3) | Mean (SD) NO2 (Ppb) | |
| Commercial Area | 129.4 (38) | 4.82 (31) | 284.4 (89) | 32.19 (12.19) | 16.79 (6.49) |
| Industrial Area | 156 (0) | 8.2 (0) | 384 (0) | 22.69 (5.76) | 11.76 (2.99) |
| Residential Unpaved (Murram) Road | 152.6 (44) | 23.1 (35) | 346.1 (95) | 20.09 (5.67) | 11.61 (4.88) |
| Residential/Office Paved (Tarmac) | 88.3 (50) | 3.9 (27) | 155 (66) | 18.39 (4.39) | 11.43 (3.16) |
3.3.1. Nitrogen Dioxide
3.3.2. Sulfur Dioxide
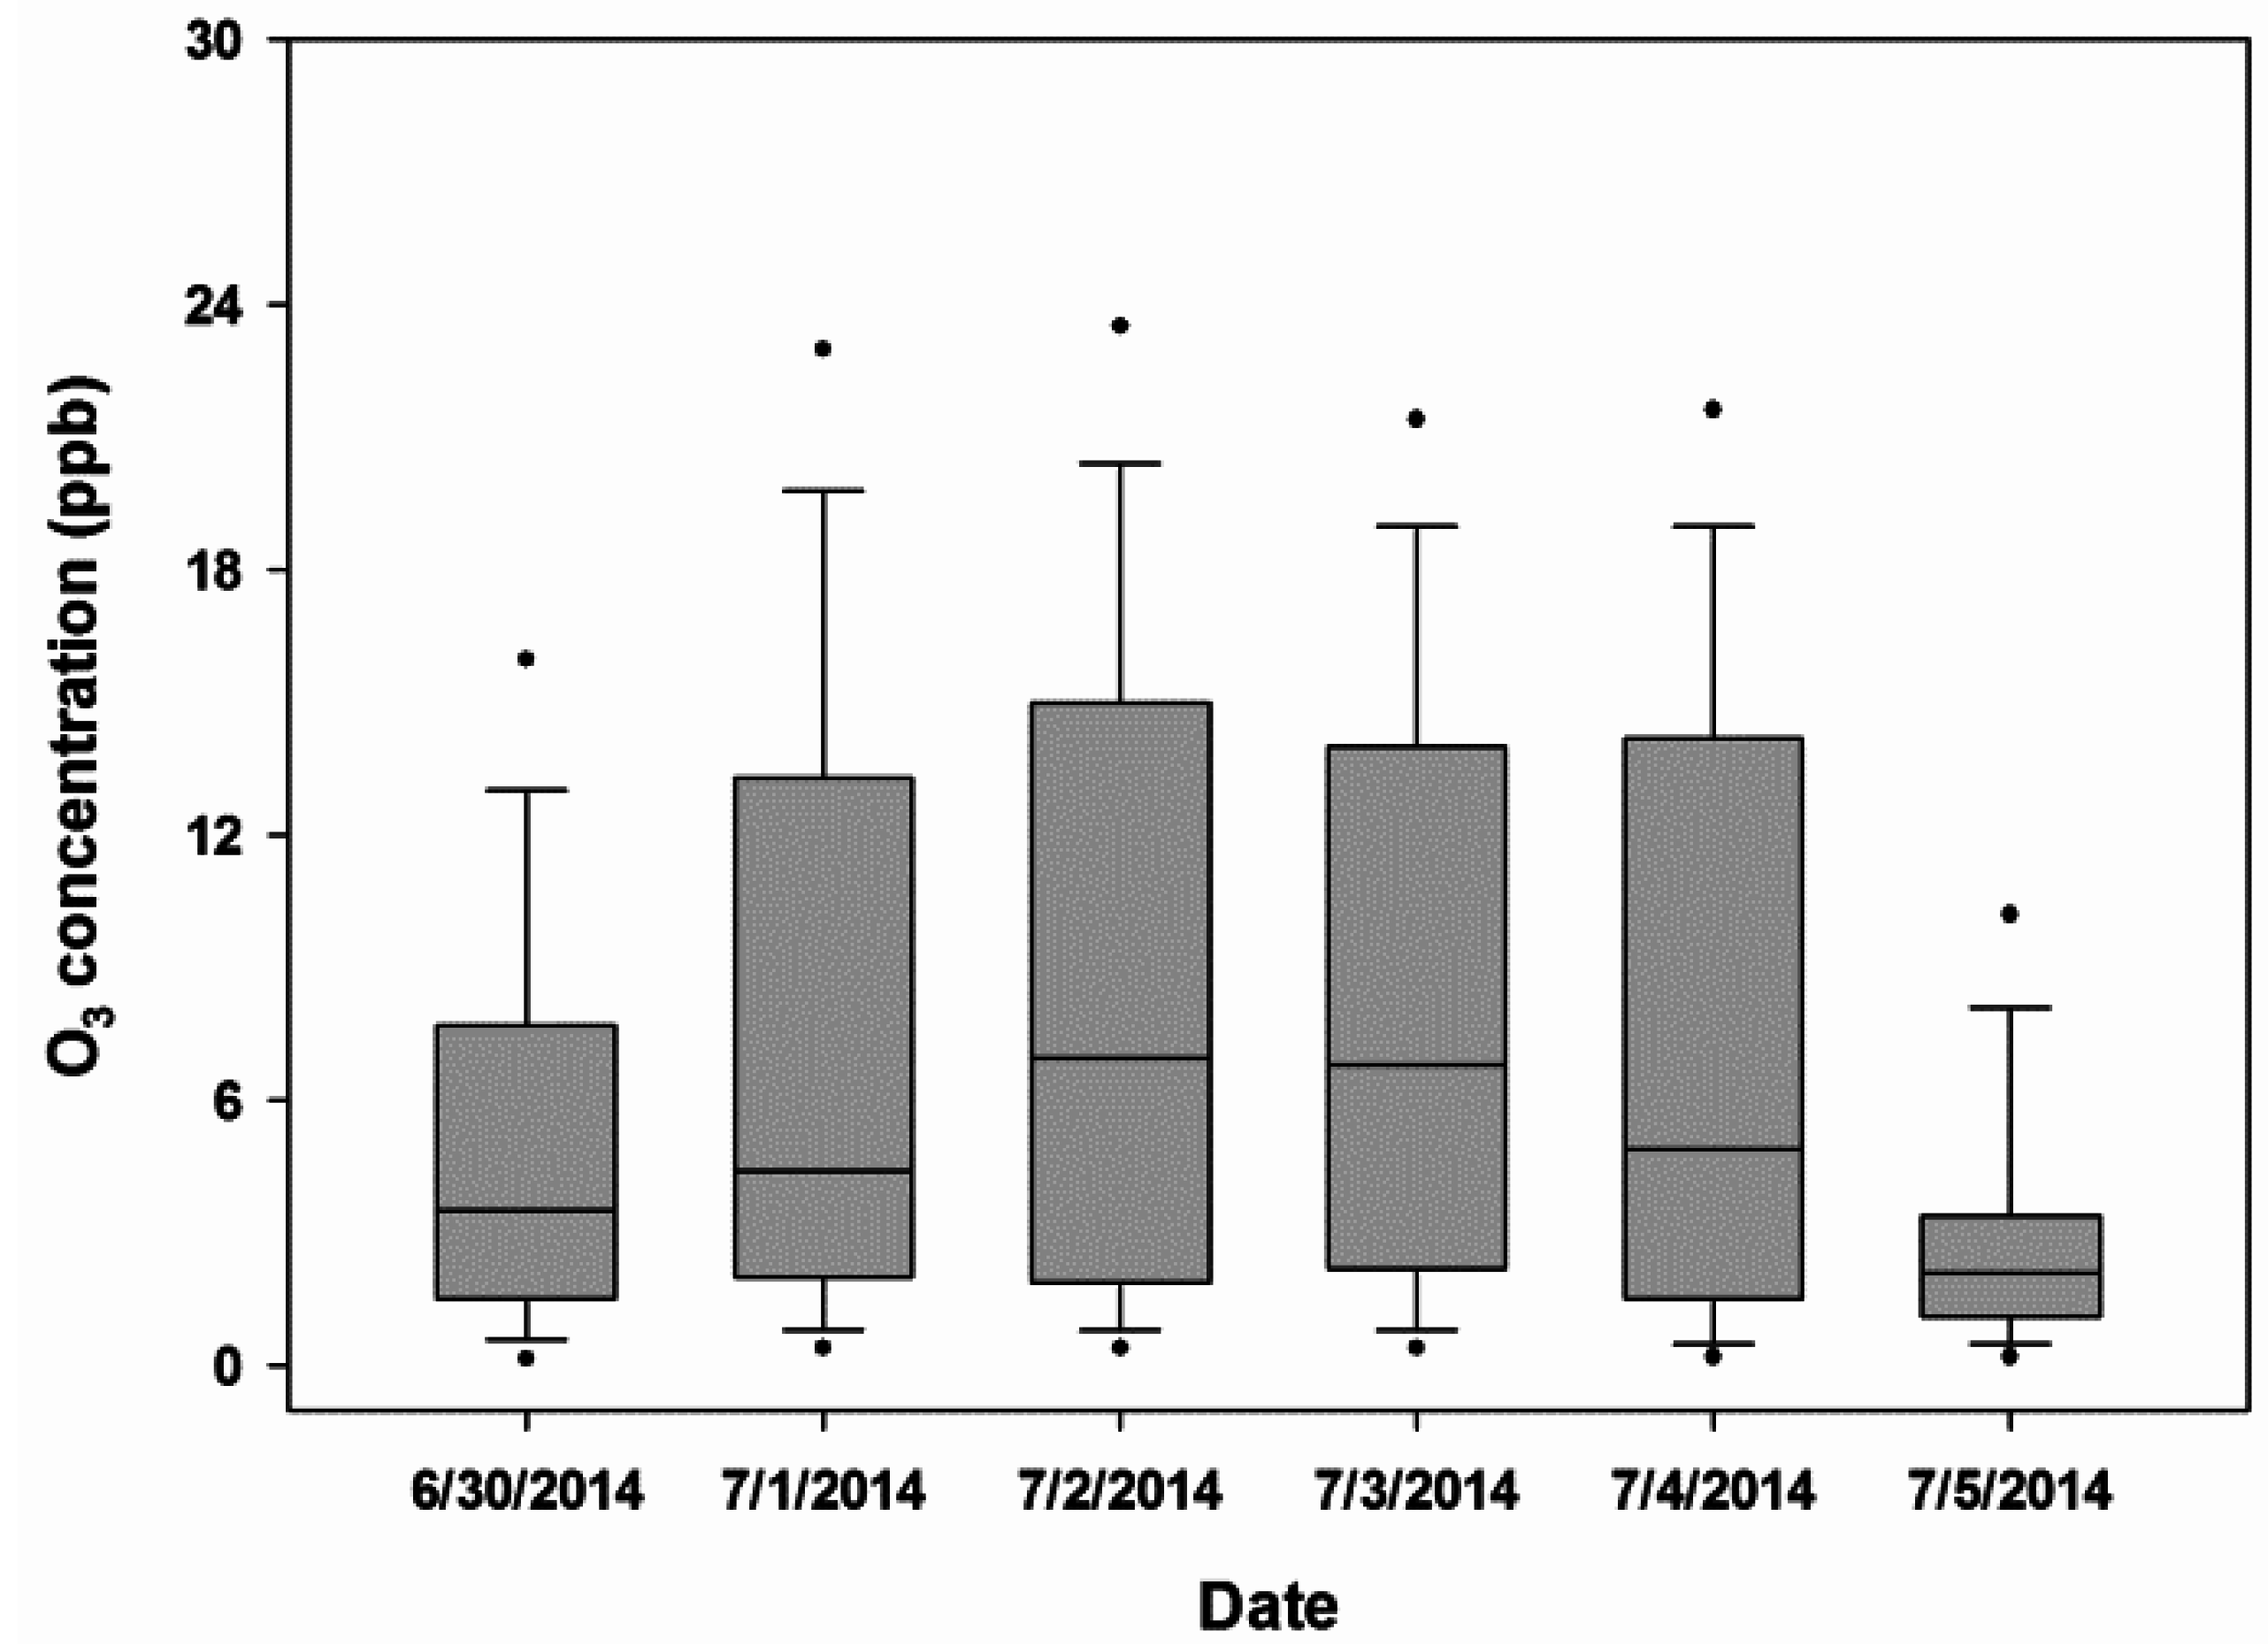
3.3.3. Ozone

4. Discussion
5. Conclusions
Supplementary Tables
| Site | City | Land Use | Test Length (H: Min) | PM 2.5 Concentration, µg/M3 | Time Min (H:Min:S) | Time Max (H:Min:S) | ||
|---|---|---|---|---|---|---|---|---|
| 24 hour Average | Min | Max | ||||||
| Bugolobi | Kampala | Residential/office paved (tarmac) road | 24:00 | 163 | 66 | 254 | 16:18 | 23:18:48 |
| Kampala Industrial Area | Kampala | Industrial area | 23:35 | 156 | 82 | 384 | 16:04:46 | 23:04:46 |
| Kisimira Road | Jinja | Residential/office paved (tarmac) road | 24:00 | 68 | 39 | 119 | 6:02:42 | 21:02:42 |
| Rippon garden Nile Avenue | Jinja | Residential/office paved (tarmac) road | 24:00 | 69 | 50 | 124 | 16:04:15 | 8:04:15 |
| School village Tenywa Road Walukuba East | Jinja | Residential unpaved (murram) road | 18:46 | 161 | 0 | 285 | 11:45:21 | 18:45:21 |
| Kabowa Gabunga Road | Kampala | Residential unpaved (murram) road | 24:00 | 156 | 40 | 362 | 14:45:47 | 7:45:47 |
| Kamwokya, Kyebando Road | Kampala | Commercial area | 24:00 | 88 | 0 | 217 | 13:05:53 | 14:05:53 |
| Katanga, Wandegeya | Kampala | Commercial area | 24:00 | 108 | 52 | 248 | 6:56:31 | 18:56:31 |
| Kawala Bwaise Road | Kampala | Residential unpaved (murram) road | 23:35 | 135 | 0 | 291 | 13:54:31 | 21:54:31 |
| Kiwatule Central 1 | Kampala | Residential unpaved (murram) road | 7:00 | 114 | 90 | 22 | 17:43:30 | 20:43:30 |
| Kololo Ekobo Road | Kampala | Residential/office paved (tarmac) road | 18:00 | 53 | 2 | 123 | 17:43:28 | 10:43:28 |
| Kyanja Nazareth Road | Kampala | Residential unpaved (murram) road | 24:00 | 100 | 55 | 317 | 11:15:43 | 21:15:43 |
| Lungujja Busega Kibumbiro | Kampala | Residential unpaved (murram) road | 22:09 | 240 | 0 | 535 | 7:38:18 | 8:38:18 |
| Mulago Mulago Hill Road | Kampala | Commercial area | 24:00 | 143 | 59 | 225 | 9:43:39 | 2:43:39 |
| Amir street Nakasero | Kampala | Commercial area | 19:00 | 187 | 85 | 434 | 16:14:20 | 2:14:20 |
| Nalukolongo Kweba Zone | Kampala | Residential unpaved (murram) road | 18:16 | 133 | 0 | 401 | 9:28:42 | 0:28:42 |
| Nansana Naluvule | Kampala | Residential unpaved (murram) road | 22:32 | 182 | 0 | 358 | 14:26:25 | 23:26:25 |
| Lourdel Road, wandegeya | Kampala | Commercial area | 17:00 | 121 | 45 | 298 | 21:57:34 | 1:57:34 |
| Site | Land Use | City | Exposure | NO2, total (µg) | NO2, µg/m3 | NO2 ppb |
|---|---|---|---|---|---|---|
| Amir Street–Nakasero | Commercial center | Kampala | 309.55 | 1.15 | 49.90 | 26.96 |
| Mutundwe–Kigaga Zone | Residential unpaved (murram) road | Kampala | 337.75 | 0.25 | 9.32 | 4.85 |
| Nalukolongo–Kweba Zone | Residential unpaved (murram) road | Kampala | 337.67 | 0.67 | 26.22 | 13.64 |
| Kawala–Bwaise Road | Residential unpaved (murram) road | Kampala | 339.50 | 0.62 | 24.33 | 12.66 |
| Kiwat ule Central I. | Residential unpaved (murram) road | Kampala | 336.00 | 0.56 | 22.08 | 11.48 |
| Bwaise–Makerere–Kavule Road | Residential unpaved (murram) road | Kampala | 308.43 | 0.54 | 23.33 | 12.13 |
| Bwaise, x Road | Commercial center | Kampala | 337.00 | 0.61 | 24.15 | 12.56 |
| Kabowa–Gabunga Road | Residential unpaved (murram) road | Kampala | 338.07 | 0.59 | 23.00 | 11.96 |
| Lungunja–Busega–Kibumbiro | Residential unpaved (murram) road | Kampala | 335.00 | 0.50 | 19.71 | 10.25 |
| Rippon Garden–Nile Avenue | Residential/office paved (tarmac) road | Jinja | 337.07 | 0.49 | 19.25 | 10.01 |
| School Village–Tenywa Road Walukuba East | Residential unpaved (murram) road | Jinja | 336.83 | 0.27 | 10.48 | 5.45 |
| Walukuba - Masese Road | Commercial center | Jinja | 336.42 | 0.29 | 11.14 | 5.79 |
| Mulago Hill Road 1 | Commercial center | Kampala | 343.55 | 0.59 | 22.79 | 11.85 |
| Mulago Hill Road 2 | Commercial center | Kampala | 311.63 | 0.78 | 31.78 | 16.53 |
| Bugolobi | Residential/office paved (tarmac) road | Kampala | 336.63 | 0.39 | 15.23 | 7.92 |
| Banda Zone B8–Banda Nalya Road | Commercial center | Kampala | 332.48 | 0.68 | 27.22 | 14.15 |
| Namugongo Road, Kireka | Commercial center | Kampala | 332.45 | 1.31 | 52.90 | 27.51 |
| Katanga, Wandegeya | Commercial center | Kampala | 331.50 | 0.81 | 32.72 | 17.02 |
| Kawempe–Mbogo Road | Residential/office paved (tarmac) road | Kampala | 333.50 | 0.61 | 24.14 | 12.55 |
| Nansana–Nalvule | Residential unpaved (murram) road | Kampala | 332.42 | 0.53 | 21.26 | 22.70 |
| Mbuya–Nadiope | Residential/office paved (tarmac) road | Kampala | 215.05 | 0.24 | 14.63 | 15.22 |
| Lourdel road, Wandegeya | Commercial center | Kampala | 360.00 | 1.13 | 42.08 | 21.88 |
| Kamwokya–Kyebando Road | Commercial center | Kampala | 336.92 | 0.79 | 31.22 | 16.23 |
| Kyanja–Nazereth Rd/Kyanja Road | Residential unpaved (murram) road | Kampala | 356.12 | 0.57 | 21.19 | 11.02 |
| 5th Street Industrial Area | Industrial area | Kampala | 334.02 | 0.67 | 26.67 | 13.87 |
| Nizam Road, Jinja center | Commercial center | Jinja | 335.50 | 0.69 | 27.37 | 14.23 |
| Industrial Area—Jinja | Industrial area | Jinja | 338.15 | 0.47 | 18.53 | 9.64 |
| Site | Land Use | City | Exposure | Total SO2 (µg) | SO2 (µg/m3) | SO2 (ppb) |
|---|---|---|---|---|---|---|
| Kabowa-Gabunga Road | Residential unpaved (murram) road | Kampala | 338.07 | 0.05 | 2.34 | 0.88 |
| Mulago Hill road 1 | Commercial centre | Kampala | 311.63 | 0.04 | 1.73 | 0.65 |
| Bugolobi | Residential/office paved (tarmac) road | Kampala | 336.63 | 0.04 | 1.81 | 0.68 |
| Banda Zone B8-Banda Nalya Road | Commercial centre | Kampala | 332.48 | 0.1 | 8.35 | 3.13 |
| Namugongo Road-Kireka road | Commercial centre | Kampala | 332.45 | 0.03 | 0.77 | 0.29 |
| Kawempe-Mbogo Road | Residential/office paved (tarmac) road | Kampala | 333.5 | 0.06 | 3.65 | 1.37 |
| Industrial Area-Jinja | Industrial area | Jinja | 338.15 | 0.09 | 7.31 | 2.74 |
Acknowledgements
Author Contributions
Conflicts of Interest
References
- 7 Million Premature Deaths Annually Linked to Air Pollution. Available online: http://www.who.int/mediacentre/news/releases/2014/air-pollution/en/ (accessed on 22 August 2014).
- World Health Organisation. Health Topics. Air Pollution. Available online: http://www.who.int/topics/air_pollution/en/ (accessed on 1 May 2014).
- Environmental Working Group. Body Burden–—The Pollution in Newborns. A Benchmark Investigation of Industrial Chemicals, Pollutants and Pesticides in Umbilical Cord Blood. Available online: http://www.ewg.org/research/body-burden-pollution-newborns (accessed on 14 July 2005).
- Salvi, S. Health effects of ambient air pollution in children. Paediatr. Respir. Rev. 2007, 8, 275–280. [Google Scholar] [CrossRef] [PubMed]
- Kajekar, R. Environmental factors and developmental outcomes in the lung. Pharmacol. Ther. 2007, 114, 129–145. [Google Scholar] [CrossRef] [PubMed]
- Fleischer, N.L.; Merialdi, M.; van Donkelaar, A.; Vadillo-Ortega, F.; Martin, R.V.; Betran, A.P.; Souza, J.P.; O’Neill, M. Outdoor air pollution, preterm birth, and low birth weight: analysis of the world health organization global survey on maternal and perinatal health. Environ. Health Perspect. 2014, 122, 425–430. [Google Scholar] [CrossRef] [PubMed]
- Fenger, J. Urban air quality. Atmospheric Environ. 1999, 33, 4877–4900. [Google Scholar] [CrossRef]
- Clean Air Act. Available online: http://www.epw.senate.gov/envlaws/cleanair.pdf (accessed on 22 August 2014).
- World Health Organization. WHO Air Quality Guidelines for Particulate Matter, Ozone, Nitrogen Dioxide and Sulfur Dioxide: Global Update 2005: Summary Of Risk Assessment; WHO: Geneva, Switzerland, 2006. [Google Scholar]
- National Ambient Air Quality Standards (NAAQS). Available online: http://www.epa.gov/air/criteria.html (accessed on 22 August 2014).
- Petkova, E.P.; Jack, D.W.; Volavka-Close, N.H.; Kinney, P.L. Particulate matter pollution in African cities. Air Quality Atmos. Health 2013, 6, 603–614. [Google Scholar] [CrossRef]
- Ambient (Outdoor) Air Pollution in Cities Database 2014. Available online: http://www.who.int/phe/health_topics/outdoorair/databases/cities/en/ (accessed on 22 August 2014).
- Khoder, M.I. Diurnal, seasonal and weekdays-weekends variations of ground level ozone concentrations in an urban area in greater Cairo. Environ. Monit. Assess. 2009, 149, 349–362. [Google Scholar] [CrossRef] [PubMed]
- Arku, R.E.; Vallarino, J.; Dionisio, K.L.; Willis, R.; Choi, H.; Wilson, J.G.; Hemphill, C.; Agyei-Mensah, S.; Spengler, J.D.; Ezzati, M. Characterizing air pollution in two low-income neighborhoods in Accra, Ghana. Sci Total Environ. 2008, 402, 217–231. [Google Scholar] [CrossRef] [PubMed]
- Moodley, K.G.; Singh, S.; Govender, S. Passive monitoring of nitrogen dioxide in urban air: A case study of Durban metropolis, South Africa. J. Environ. Manage. 2011, 92, 2145–2150. [Google Scholar] [CrossRef] [PubMed]
- Etyemezian, V.; Tesfaye, M.; Yimer, A.; Chow, J.; Mesfin, D.; Nega, T.; Nikolich, G.; Watson, J.G.; Wondmagegn, M. Results from a pilot-scale air quality study in Addis Ababa, Ethiopia. Atmos. Environ. 2005, 39, 7849–7860. [Google Scholar] [CrossRef]
- Jackson, M.M. Roadside concentration of gaseous and particulate matter pollutants and risk assessment in Dar-es-Salaam, Tanzania. Environ. Monit. Assess. 2005, 104, 385–407. [Google Scholar] [CrossRef] [PubMed]
- Lindén, J. Intra-urban air pollution in a rapidly growing Sahelian city. Environ. Int. 2012, 40, 51–62. [Google Scholar] [CrossRef] [PubMed]
- Josipovic, M.; Annegarn, H.J.; Kneen, M.A.; Pienaar, J.J.; Piketh, S.J. Concentrations, distributions and critical level exceedance assessment of SO2, NO2 and O3 in South Africa. Environ. Monit. Assess. 2010, 171, 181–196. [Google Scholar] [CrossRef] [PubMed]
- Kilabuko, J.H.; Matsuki, H.; Nakai, S. Air quality and acute respiratory illness in biomass fuel using homes in Bagamoyo, Tanzania. Int. J. Environ. Res. Public Health 2007, 4, 39–44. [Google Scholar] [CrossRef] [PubMed]
- El-Dars, F.M.S. Monitoring ambient sulfur dioxide levels at some residential environments in the Greater Cairo urban Region—Egypt. Environ. Monit. Assess. 2004, 95, 269–286. [Google Scholar] [CrossRef] [PubMed]
- Adon, M.; Glay-Lacaux, C.; Yoboue, V.; Delon, C.; Lacaux, J.P.; Castera, P.; Gardrat, E.; Pienaar, J.; Al Ourabi, H.; Laouali, D.; et al. Long term measurements of sulfur dioxide, nitrogen dioxide, ammonia, nitric acid and ozone in Africa using passive samplers. South Afr. J. Sci. 2007, 103, 336–342. [Google Scholar]
- Carmichael, G.R.; Ferm, M.; Thongboonchoo, N.; Woo, J.-H.; Chan, L.; Murano, K.; Viet, P.H.; Mossberg, C.; Bala, R.; Boonjawat, J. Measurements of sulfur dioxide, ozone and ammonia concentrations in Asia, Africa, and South America using passive samplers. Atmos. Environ. 2003, 37, 1293–1308. [Google Scholar] [CrossRef]
- Schwander, S.; Okello, C.D.; Freers, J.; Chow, J.C.; Watson, J.G.; Corry, M. Ambient particulate matter air pollution in Mpererwe District, Kampala, Uganda: A pilot study. J. Environ. Public Health 2014. [Google Scholar] [CrossRef] [PubMed]
- State of the Environment Report For Uganda 2010. Available online: http://library.health.go.ug/publications/service-delivery-public-health/environment-and-sanitation/state-environment-report (accessed on 22 August 2014).
- Uganda Statistical Abstract 2012. Available online: http://www.ubos.org/onlinefiles/uploads/ubos/pdf%20documents/2012StatisticalAbstract.pdf (accessed on 22 August 2014).
- District Profile. Available online: http://ww2.unhabitat.org/programmes/ump/documents/kampala_cds.doc (accessed on 22 August 2014).
- Jinja Municipality Profile. Available online: http://www.skelleftea.se/Skol%20och%20kulturkontoret/Innehallssidor/Bifogat/JINJA%20MUNICIPALITY%20PROFILE.pdf (accessed on 22 August 2014).
- Stewart, I.D.; Oke, T.R. Local climate zones for urban temperature studies. Bulletin Amer. Meteorol. Soc. 2012, 93, 1879–1900. [Google Scholar] [CrossRef]
- Kinney, P.L. Traffic impacts on PM(2.5) air quality in Nairobi, Kenya. Environ. Sci. Policy 2011, 14, 369–378. [Google Scholar] [CrossRef] [PubMed]
- Ofosu, F.G.; Hopke, P.K.; Aboh, I.J.; Bamford, S.A. Biomass burning contribution to ambient air particulate levels at Navrongo in the Savannah zone of Ghana. J. Air Waste Manag. Assoc. 2013, 63, 1036–1045. [Google Scholar] [CrossRef] [PubMed]
- Gaita, S.; Boman, J.; Gatari, M.; Pettersson, J.; Janhäll, S. Source apportionment and seasonal variation of PM 2.5 in a Sub-Saharan African city: Nairobi, Kenya. Atmos. Chem. Phys. 2014, 14, 9977–9991. [Google Scholar] [CrossRef]
- Mkoma, S.L.; Chi, X.; Maenhaut, W. Characteristics of carbonaceous aerosols in ambient PM10 and PM2.5 particles in Dar es Salaam, Tanzania. Sci Total Environ. 2010, 408, 1308–1314. [Google Scholar] [CrossRef] [PubMed]
© 2015 by the authors; licensee MDPI, Basel, Switzerland. This article is an open access article distributed under the terms and conditions of the Creative Commons Attribution license (http://creativecommons.org/licenses/by/4.0/).
Share and Cite
Kirenga, B.J.; Meng, Q.; Van Gemert, F.; Aanyu-Tukamuhebwa, H.; Chavannes, N.; Katamba, A.; Obai, G.; Molen, T.V.d.; Schwander, S.; Mohsenin, V. The State of Ambient Air Quality in Two Ugandan Cities: A Pilot Cross-Sectional Spatial Assessment. Int. J. Environ. Res. Public Health 2015, 12, 8075-8091. https://0-doi-org.brum.beds.ac.uk/10.3390/ijerph120708075
Kirenga BJ, Meng Q, Van Gemert F, Aanyu-Tukamuhebwa H, Chavannes N, Katamba A, Obai G, Molen TVd, Schwander S, Mohsenin V. The State of Ambient Air Quality in Two Ugandan Cities: A Pilot Cross-Sectional Spatial Assessment. International Journal of Environmental Research and Public Health. 2015; 12(7):8075-8091. https://0-doi-org.brum.beds.ac.uk/10.3390/ijerph120708075
Chicago/Turabian StyleKirenga, Bruce J., Qingyu Meng, Frederik Van Gemert, Hellen Aanyu-Tukamuhebwa, Niels Chavannes, Achilles Katamba, Gerald Obai, Thys Van der Molen, Stephan Schwander, and Vahid Mohsenin. 2015. "The State of Ambient Air Quality in Two Ugandan Cities: A Pilot Cross-Sectional Spatial Assessment" International Journal of Environmental Research and Public Health 12, no. 7: 8075-8091. https://0-doi-org.brum.beds.ac.uk/10.3390/ijerph120708075