
Factors Contributing to Hypoxia in the Minjiang River Estuary, Southeast China


Abstract
:1. Introduction
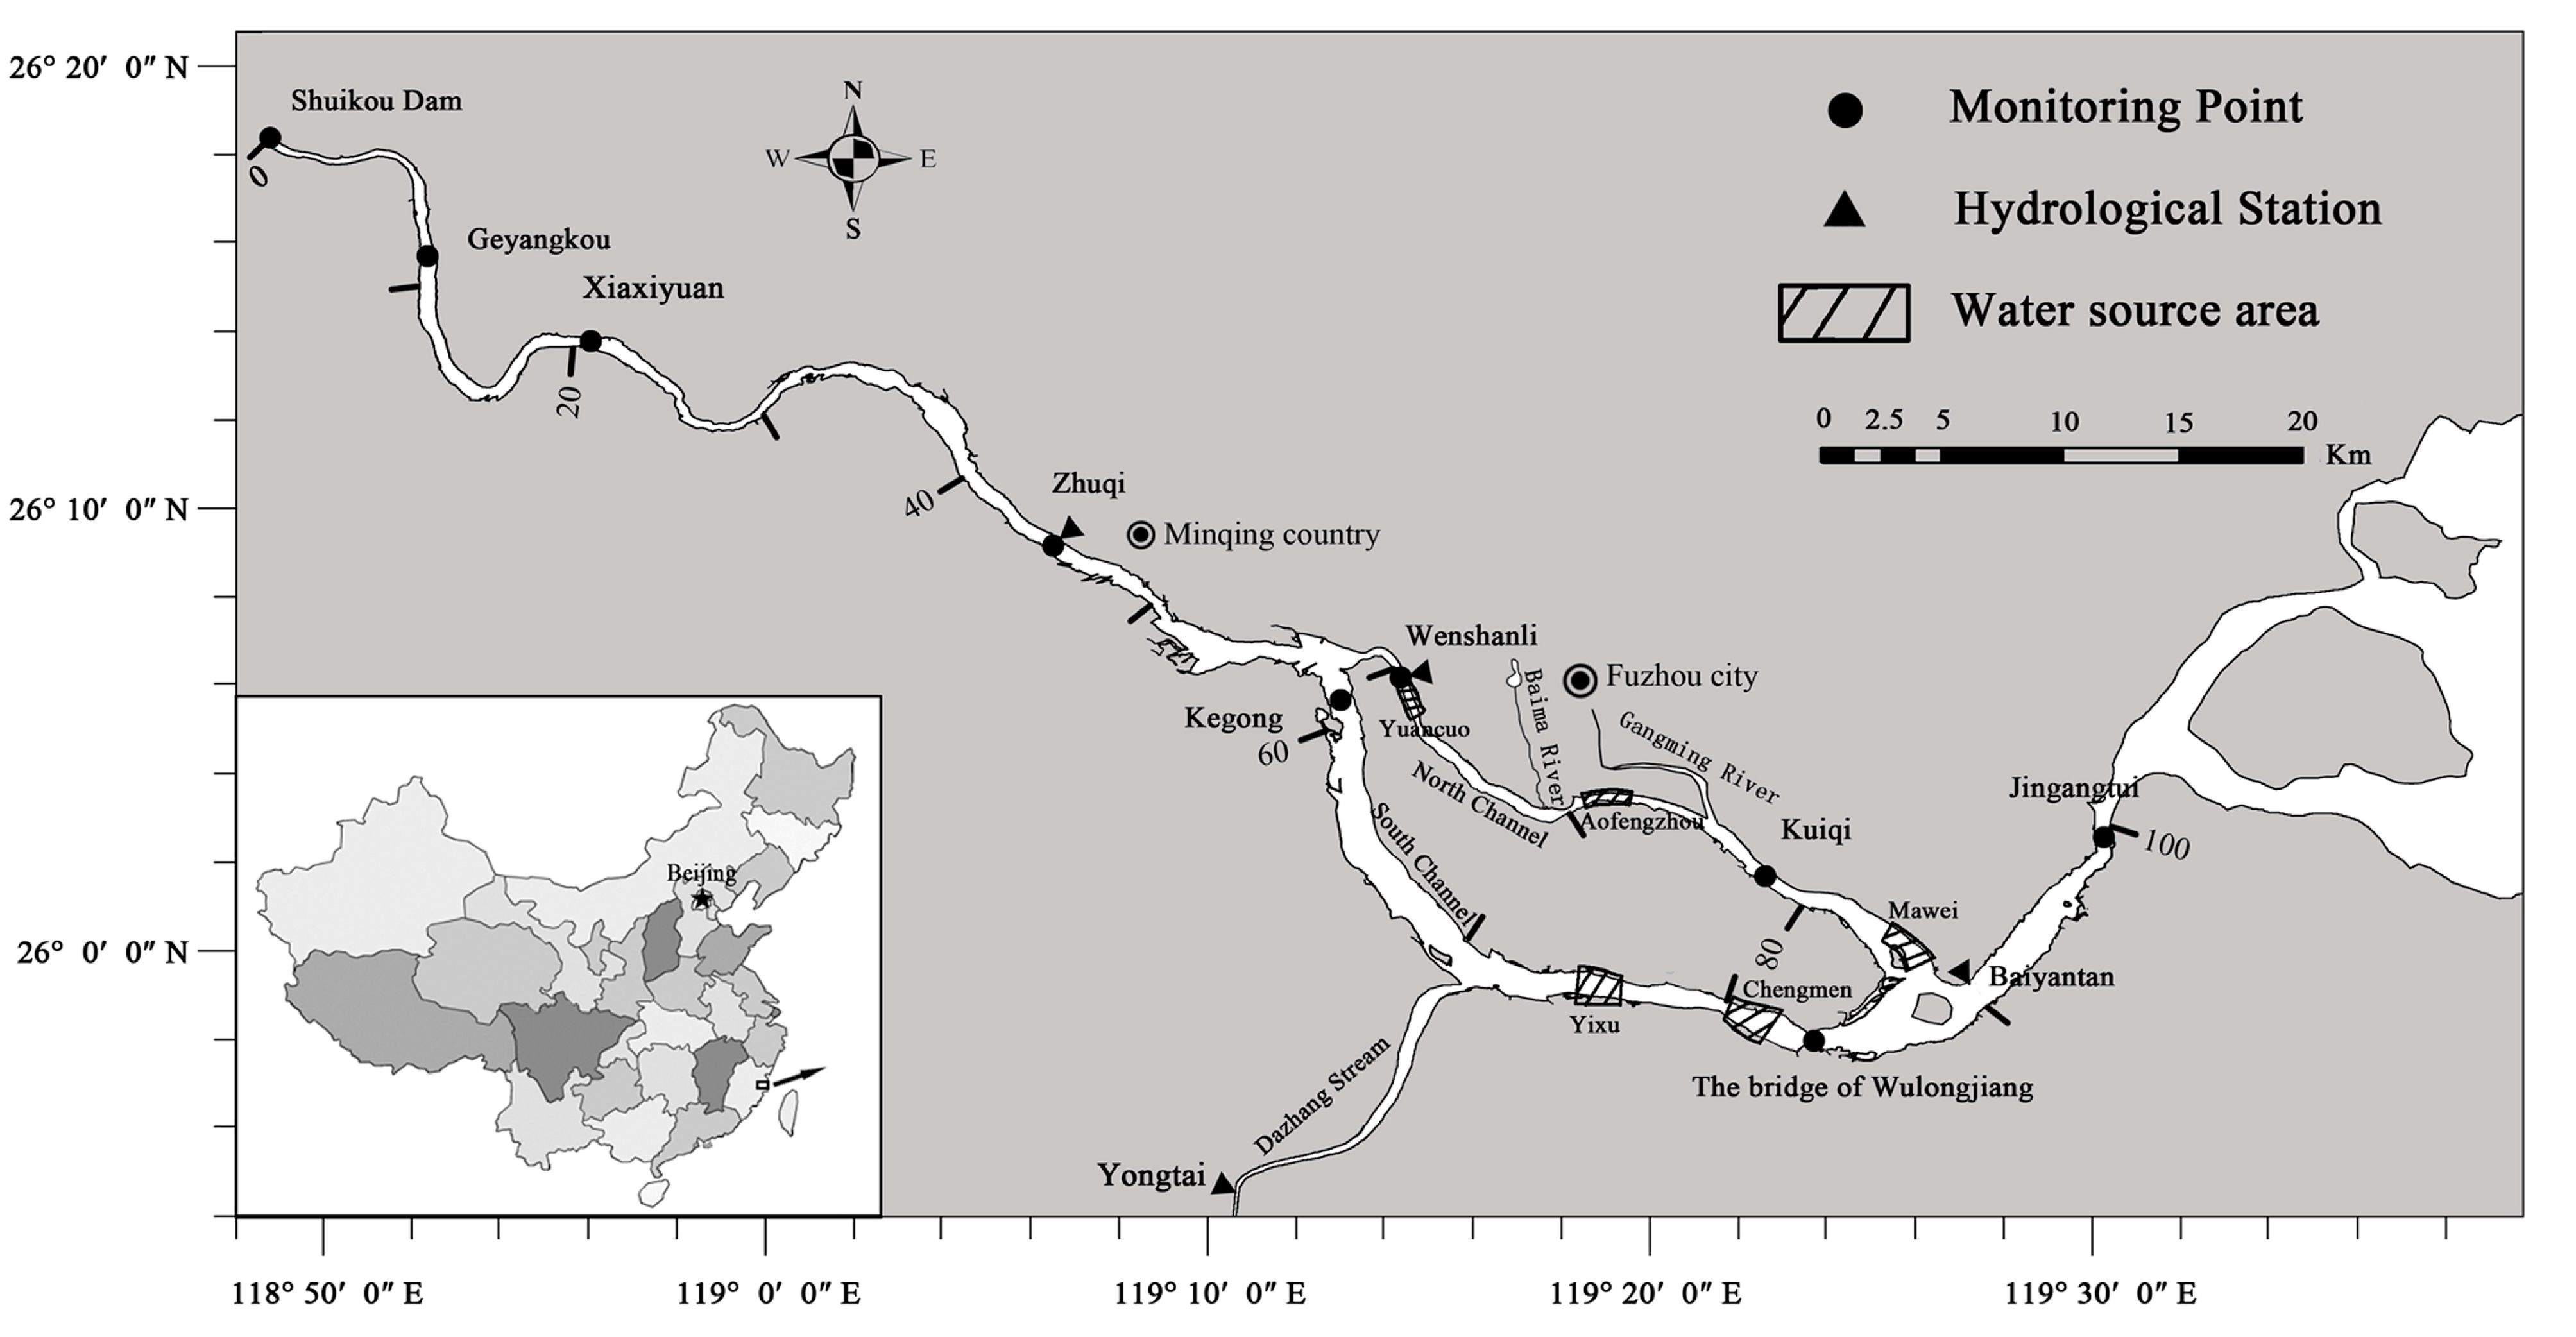
2. Research Area

3. Materials and Methods
4. Results and Discussion
4.1. Spatiotemporal Variations
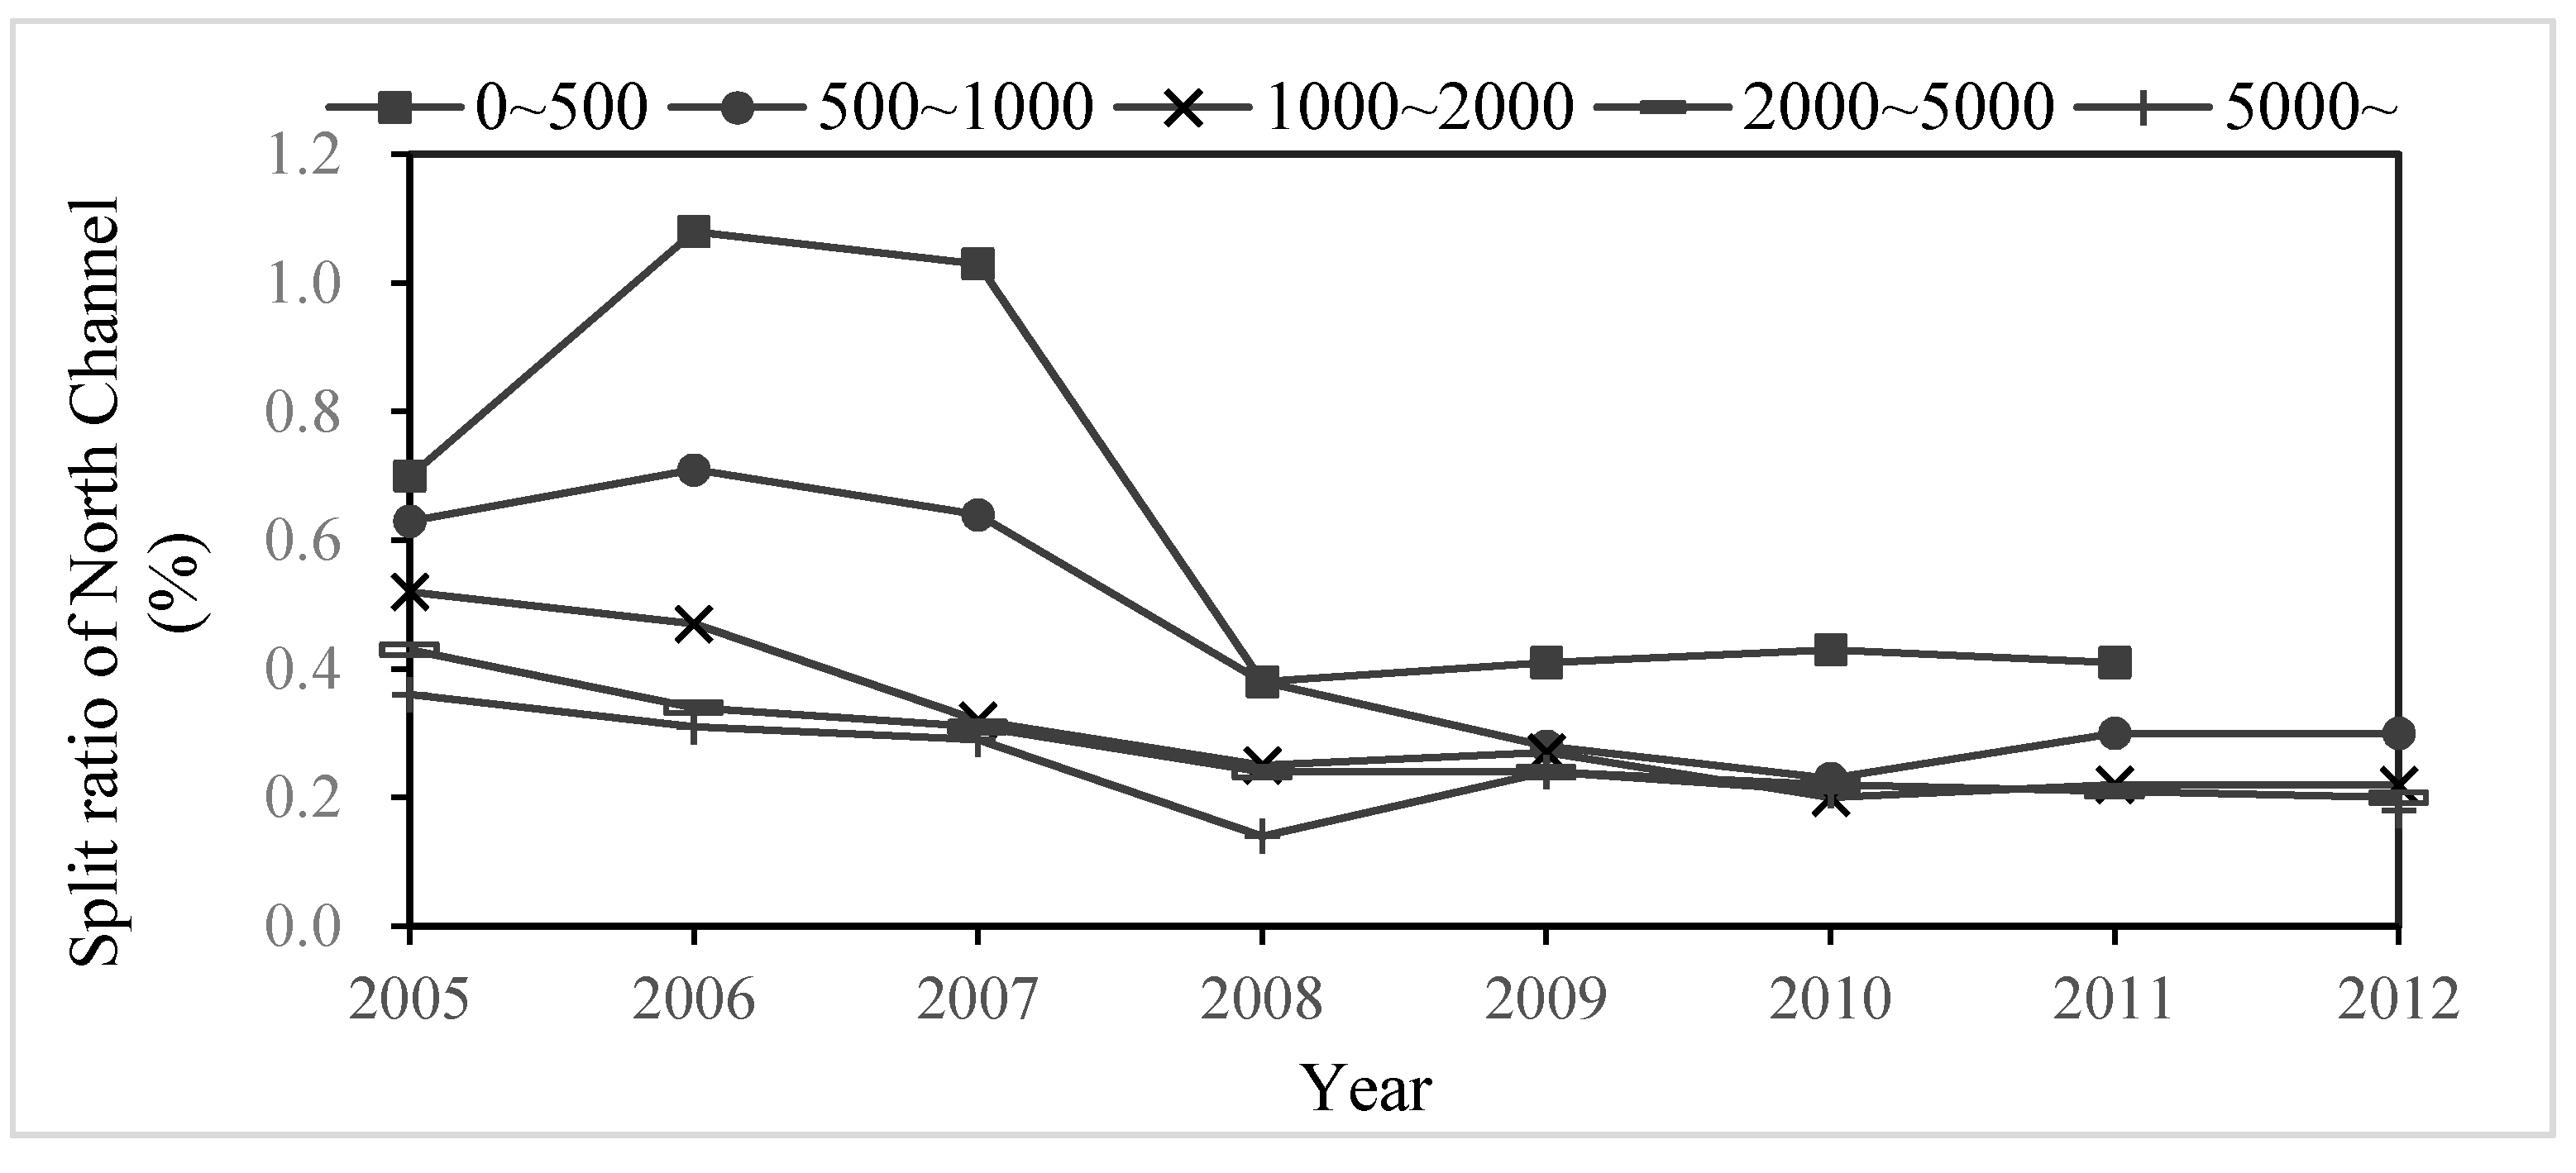
4.1.1. Variations of the Split Ratio of the North Channel

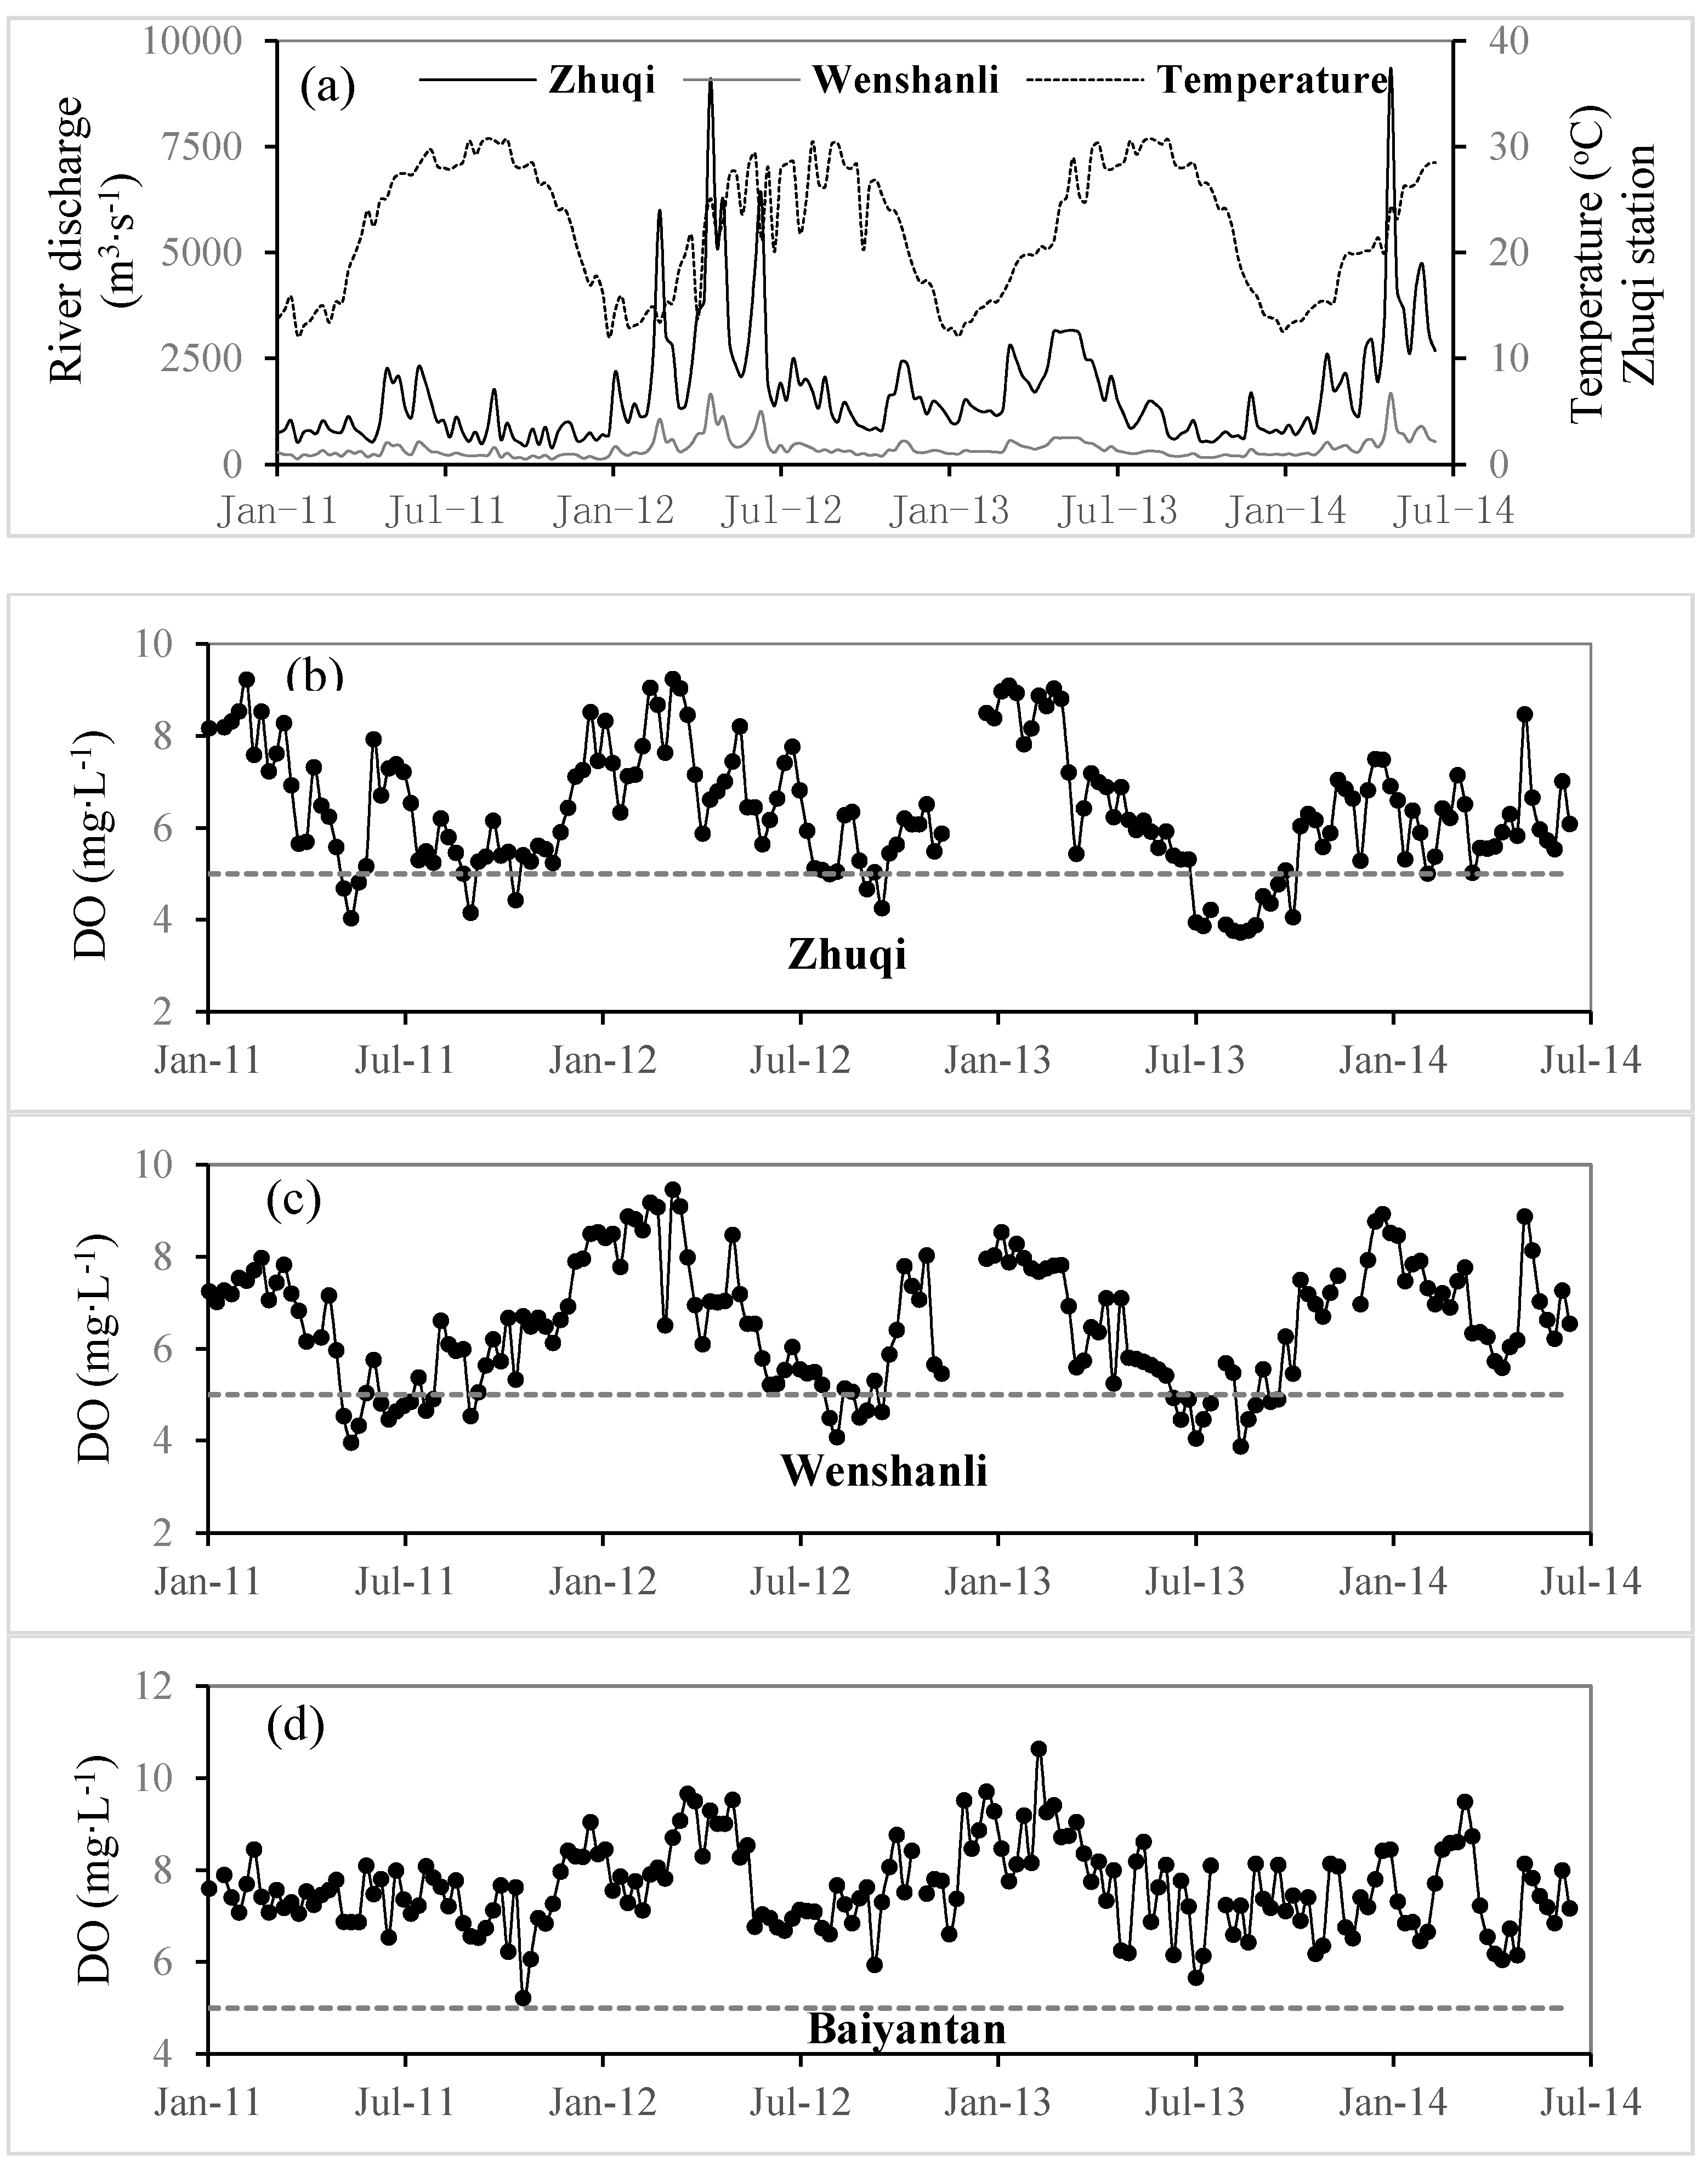
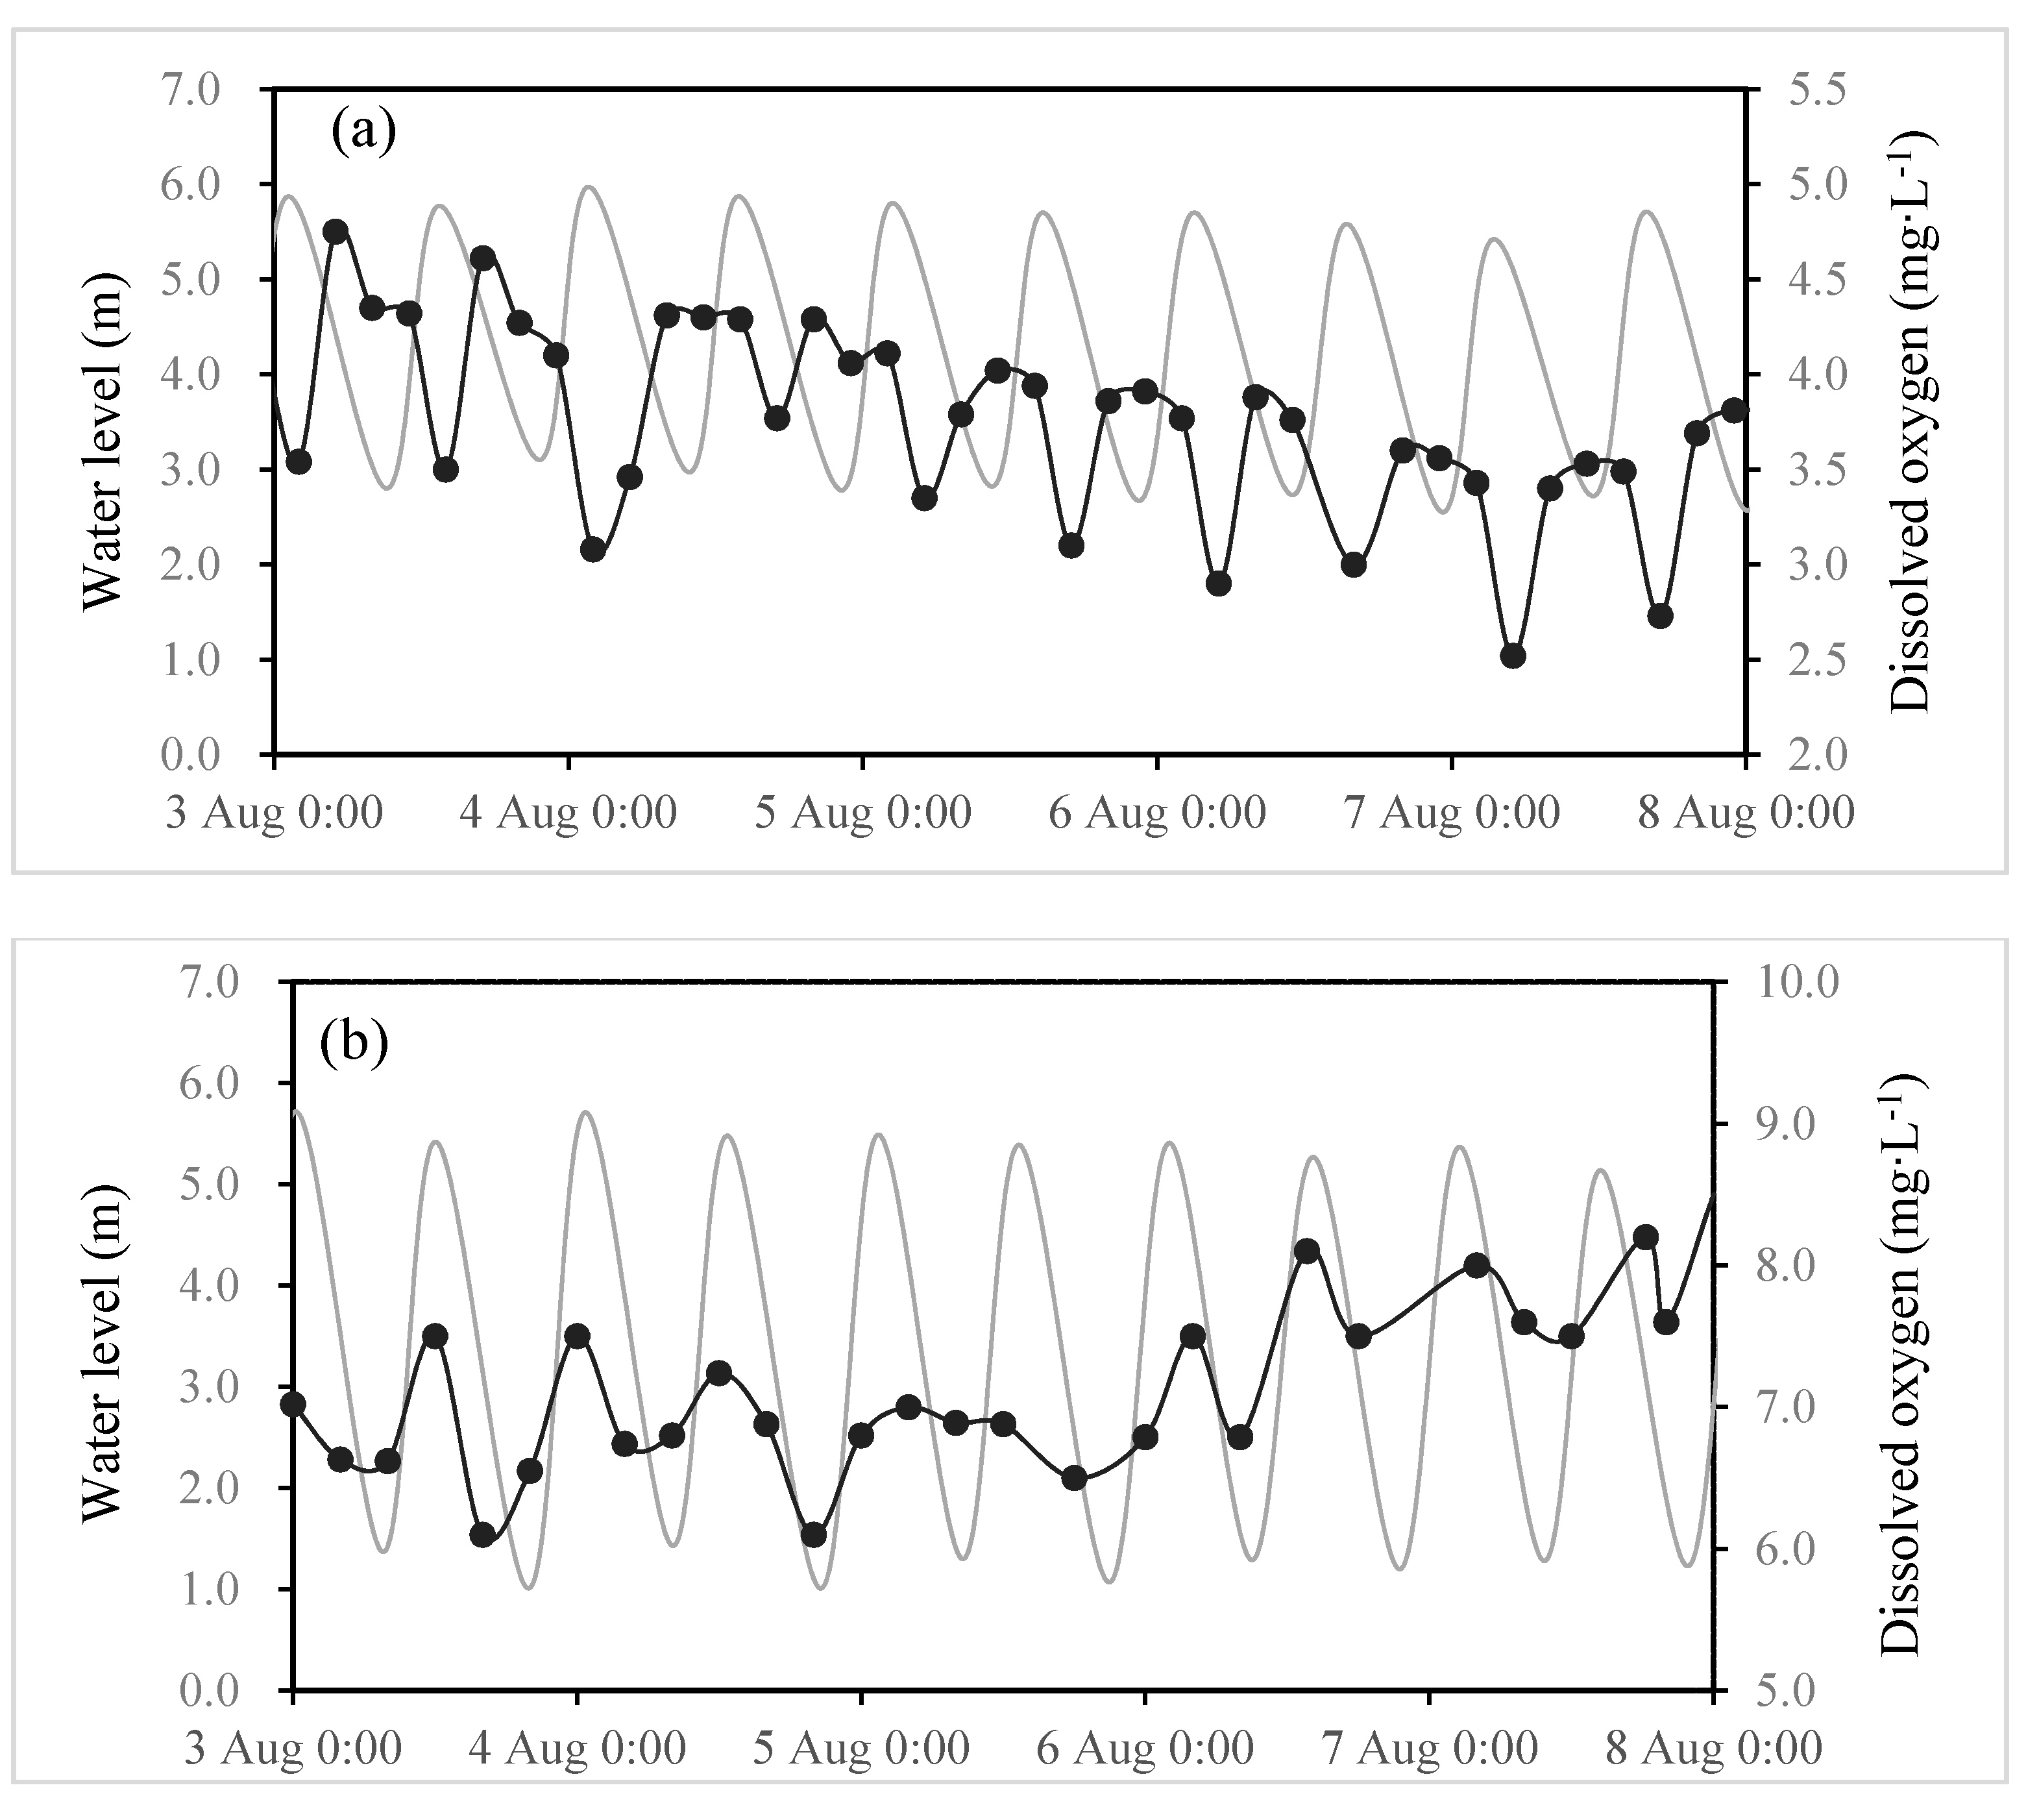
4.1.2. Seasonal Trends of Severe DO Depletion


| Hydrological Stations | Season | Dissolved Oxygen (DO) Contents (mg·L−1) | DO % of Saturation | Temperature (°C) | River Discharges (m3·s−1) |
|---|---|---|---|---|---|
| Zhuqi | Spring | 6.65 ± 0.91 | 75.31 ± 9.28 | 22.48 ± 2.35 | 2508 ± 1180 |
| 4.04–9.24 | 51.84–105.45 | 14.89–26.97 | 549–9352 | ||
| N = 295 | N = 295 | N = 295 | N = 368 | ||
| Summer | 5.80 ± 0.85 | 75.03 ± 10.36 | 29.23 ± 1.43 | 1968 ± 852 | |
| 3.73–7.93 | 50.73–103.35 | 26.62–30.36 | 480–6360 | ||
| N = 250 | N = 250 | N = 250 | N = 305 | ||
| Autumn | 5.36 ± 0.61 | 67.13 ± 6.43 | 26.25 ± 1.53 | 915 ± 322 | |
| 3.77–7.05 | 51.04–79.92 | 21.03–29.17 | 386–2419 | ||
| N = 215 | N = 215 | N = 215 | N = 273 | ||
| Winter | 7.42 ± 0.94 | 72.74 ± 9.08 | 14.45 ± 2.04 | 1184 ± 446 | |
| 5.01–9.23 | 50.03–90.19 | 11.94–18.73 | 520–5994 | ||
| N = 283 | N = 283 | N = 283 | N = 330 | ||
| Wenshanli (North Channel) | Spring | 6.67 ± 0.89 | 75.6 ± 9.28 | 22.77 ± 3.65 | 514 ± 200 |
| 3.96–9.46 | 50.82–105.17 | 15.24–27.49 | 176–1678 | ||
| N = 288 | N = 288 | N = 288 | N = 368 | ||
| Summer | 5.56 ± 0.62 | 72.05 ± 8.39 | 29.05 ± 0.92 | 420 ± 153 | |
| 3.88–7.27 | 52.8–95.07 | 27.86–30.77 | 200–1249 | ||
| N = 240 | N = 240 | N = 240 | N = 305 | ||
| Autumn | 6.07 ± 0.88 | 75.95 ± 9.27 | 26.46 ± 2.35 | 236 ± 62 | |
| 4.47–8.03 | 60.00–98.28 | 20.40–30.64 | 120–535 | ||
| N = 200 | N = 200 | N = 200 | N = 273 | ||
| Winter | 8.00 ± 0.51 | 78.14 ± 5.16 | 14.77 ± 1.45 | 277 ± 72 | |
| 6.92–9.18 | 64.22–91.48 | 12.17–18.63 | 126–1064 | ||
| N = 269 | N = 269 | N = 269 | N = 330 | ||
| Baiyantan | Spring | 7.93 ± 0.85 | 90.25 ± 10.14 | 22.07 ± 3.97 | |
| 6.05–9.66 | 69.12–113.89 | 12.60–29.10 | |||
| N = 321 | N = 321 | N = 321 | |||
| Summer | 7.21 ± 0.42 | 93.59 ± 7.04 | 29.01 ± 1.05 | ||
| 5.66–8.12 | 73.79–110.3 | 26.00–32.1 | |||
| N = 272 | N = 272 | N = 272 | |||
| Autumn | 7.23 ± 0.62 | 90.68 ± 7.63 | 26.34 ± 2.46 | ||
| 5.22–8.77 | 65.98–111.04 | 19.80–32.30 | |||
| N = 295 | N = 295 | N = 315 | |||
| Winter | 7.91 ± 0.78 | 78.17 ± 8.67 | 15.37 ± 1.94 | ||
| 5.86–10.64 | 48.37–107.86 | 10.80–20.20 | |||
| N = 304 | N = 304 | N = 304 |

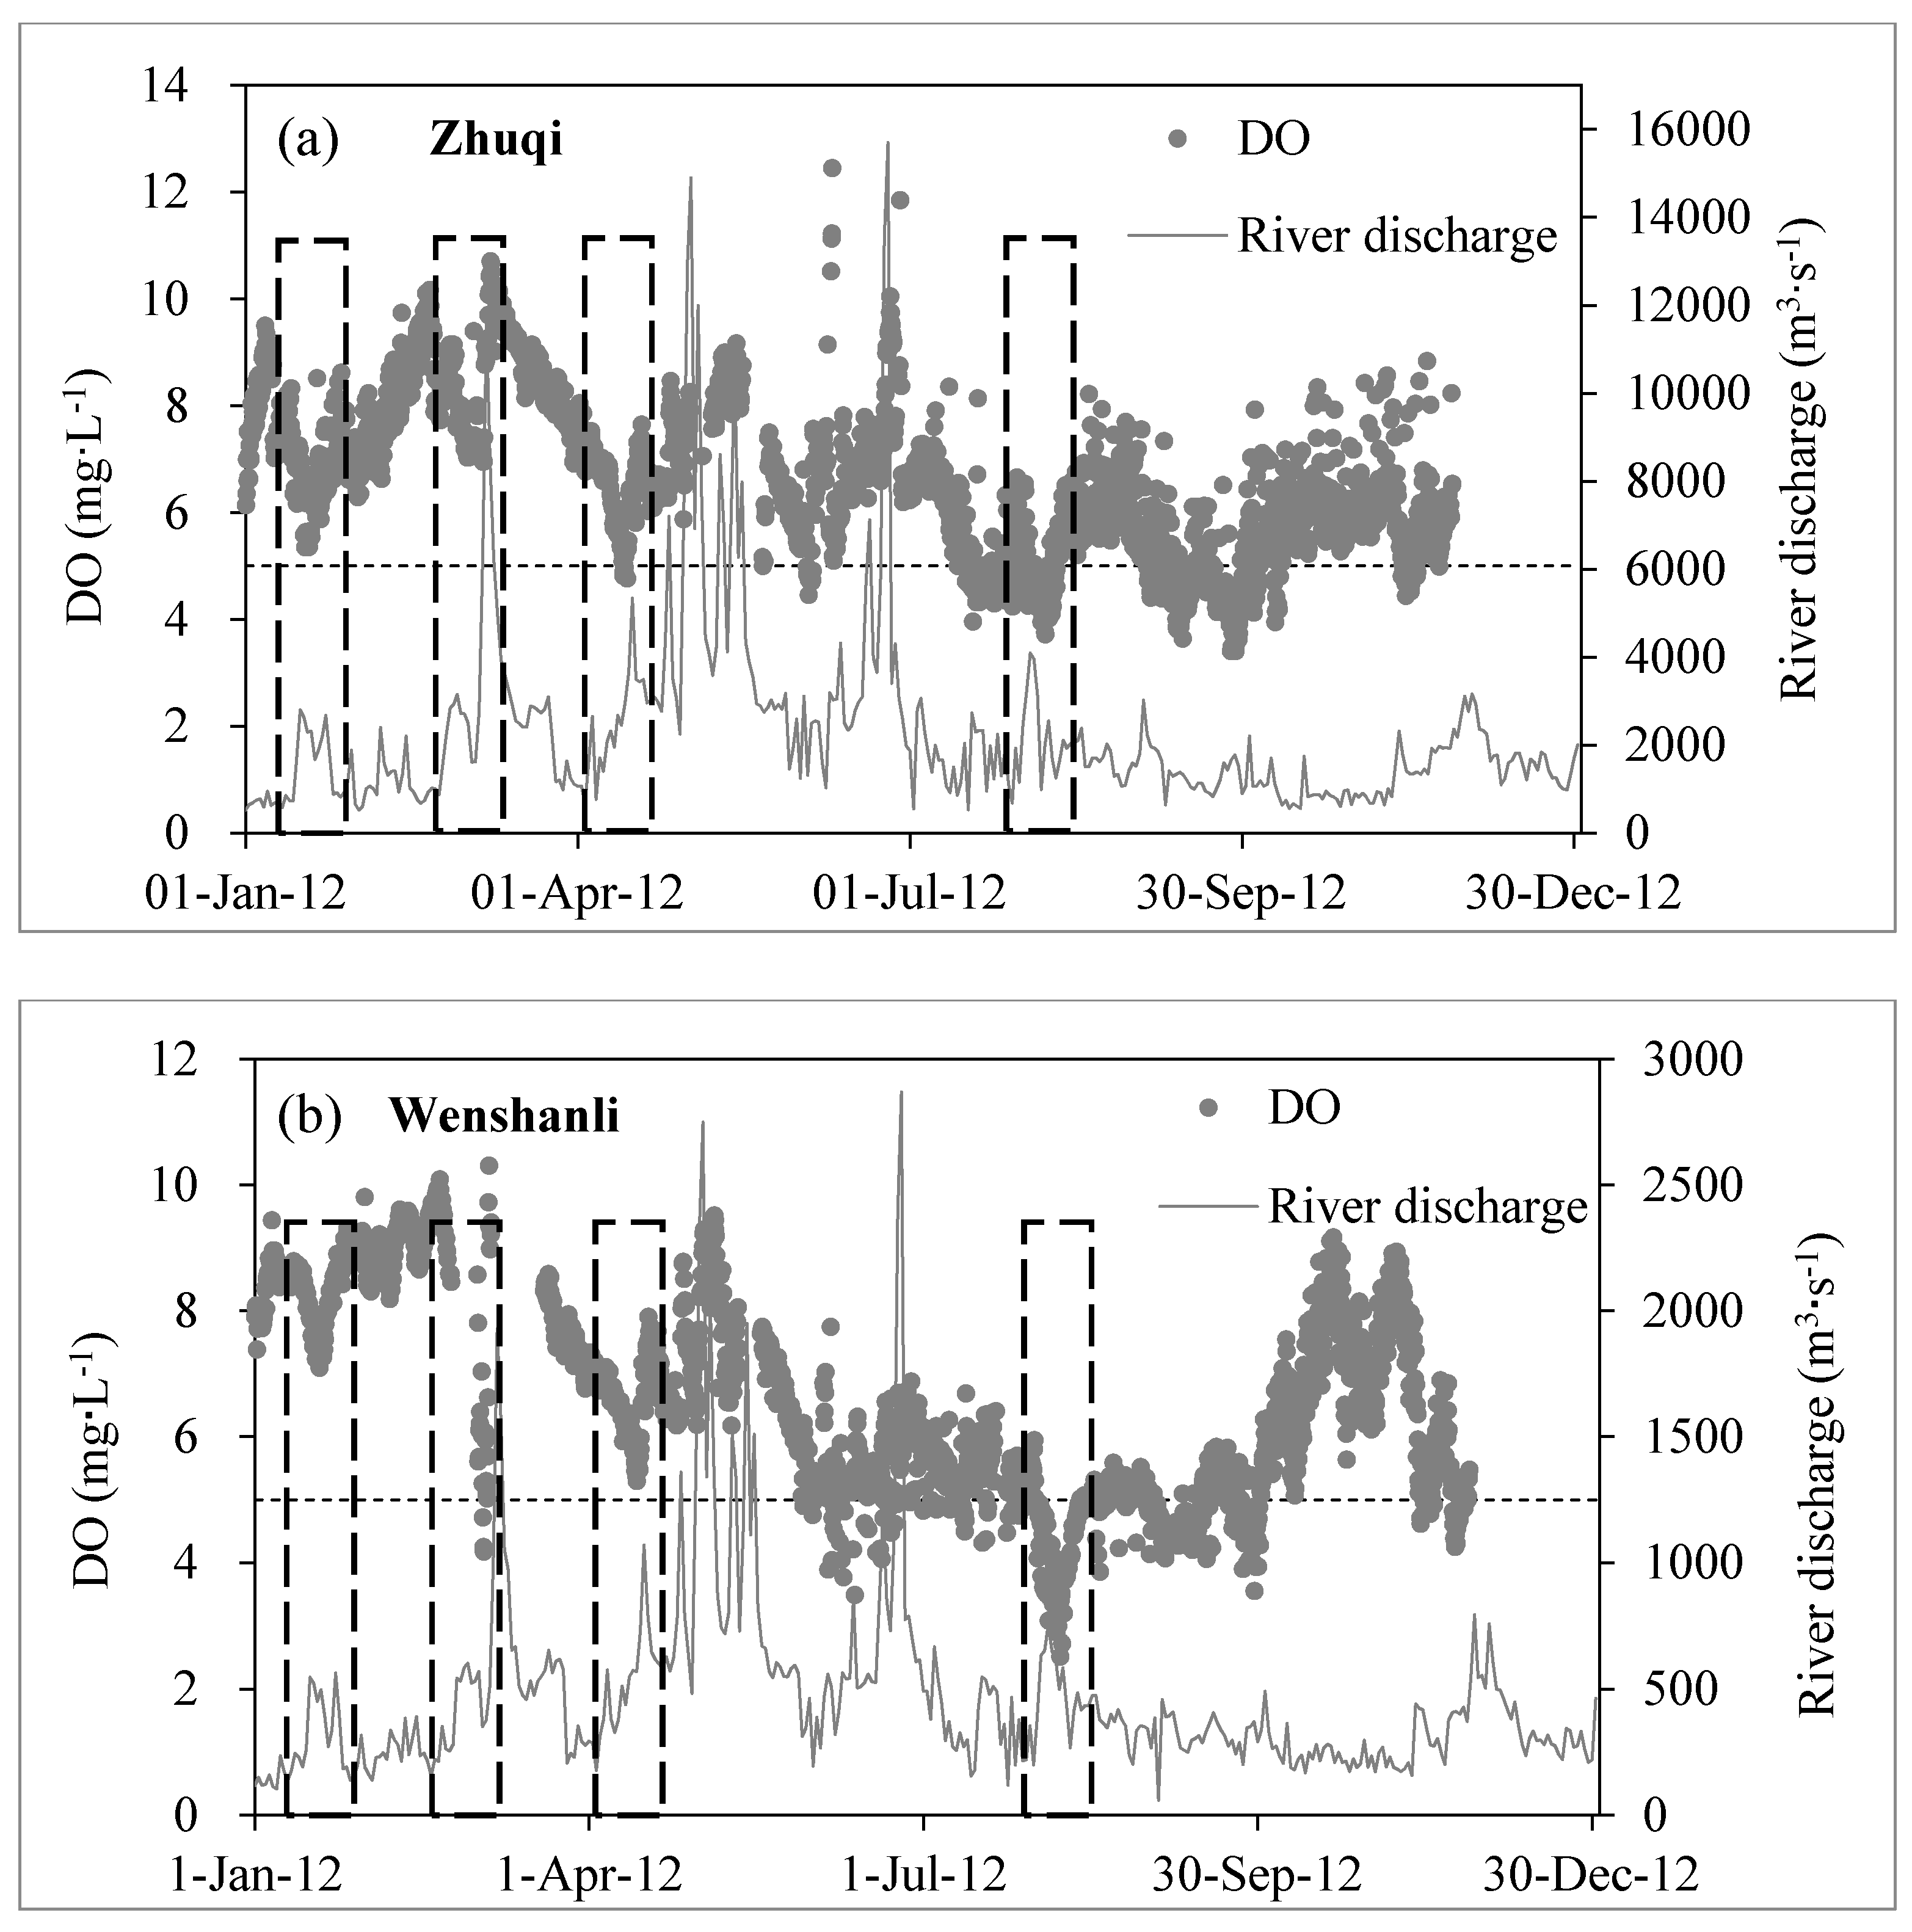
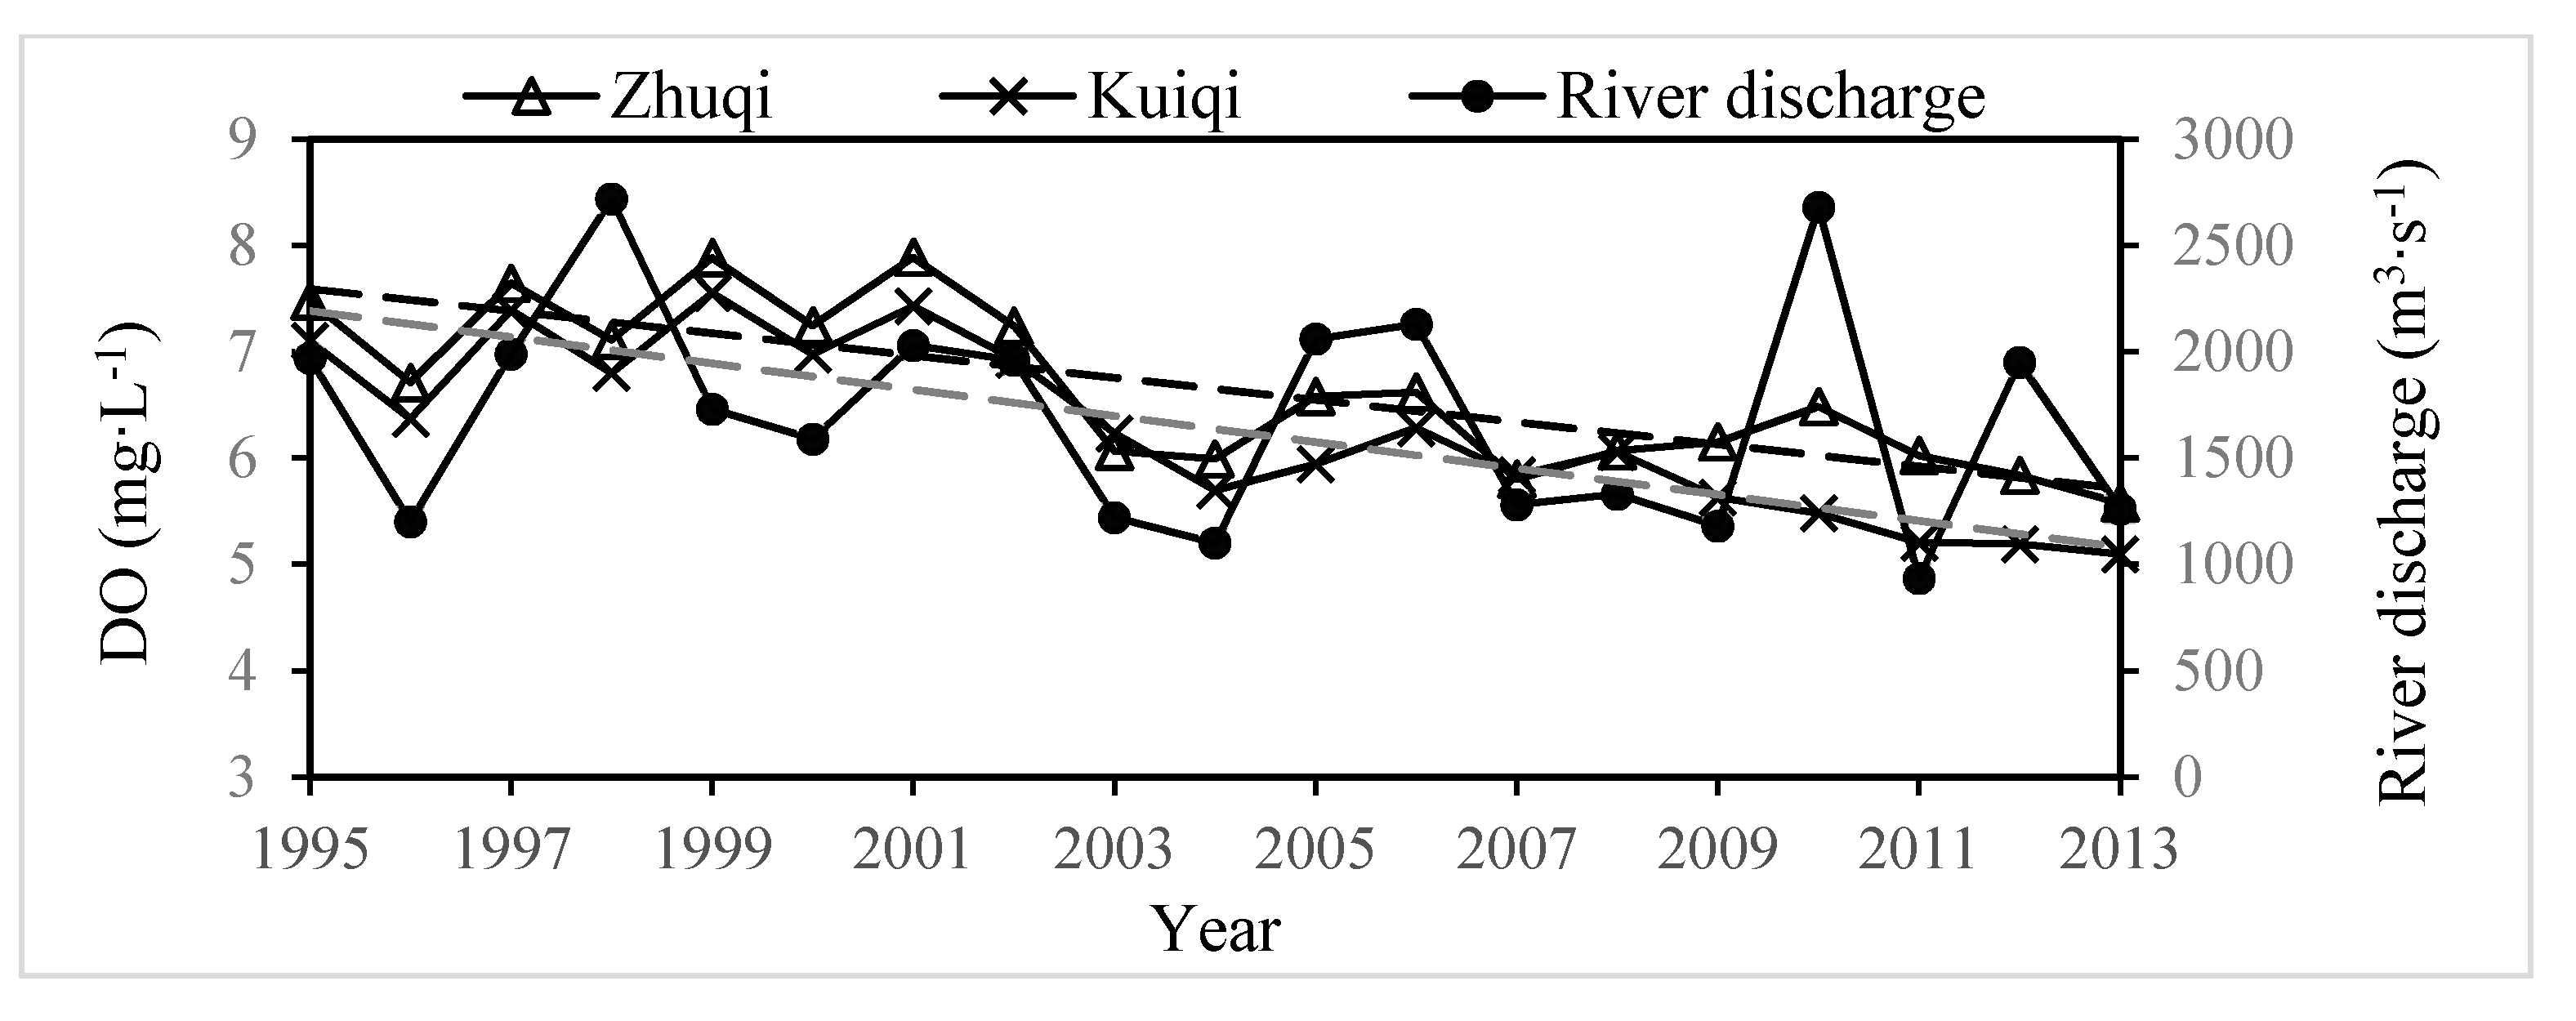
4.1.3. Correlation of DO with Flow/Temperature
| DO (mg/L) | Temperature | River Discharge |
|---|---|---|
| Zhuqi | −0.74 | 0.54 |
| Wenshanli | −0.81 | 0.23 |
| Baiyantan | −0.33 | 0.25 |
4.2. Location of DO Depletion
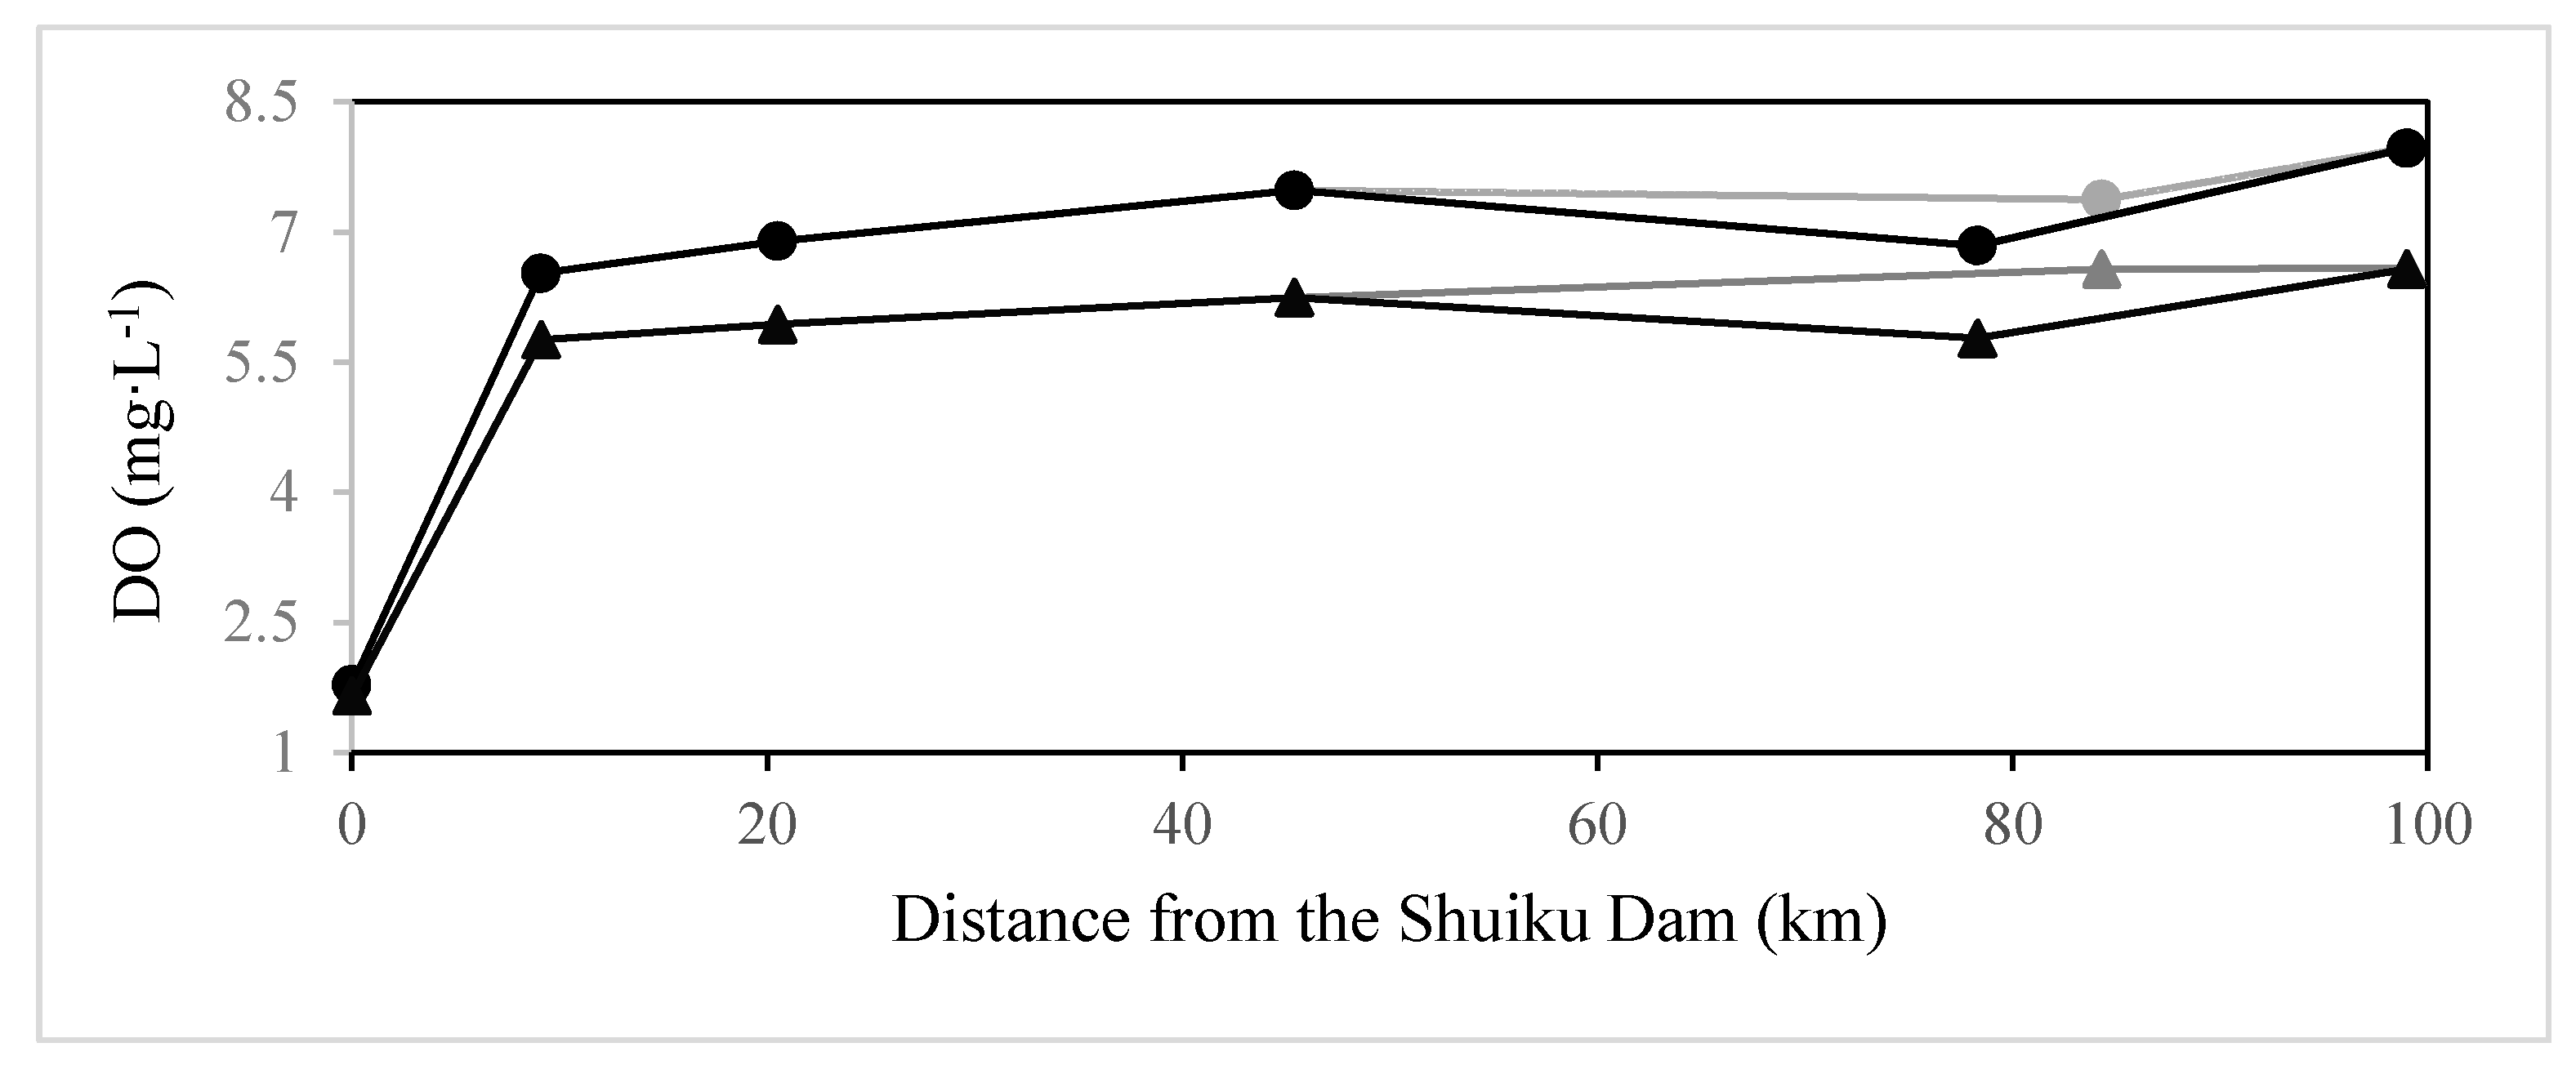
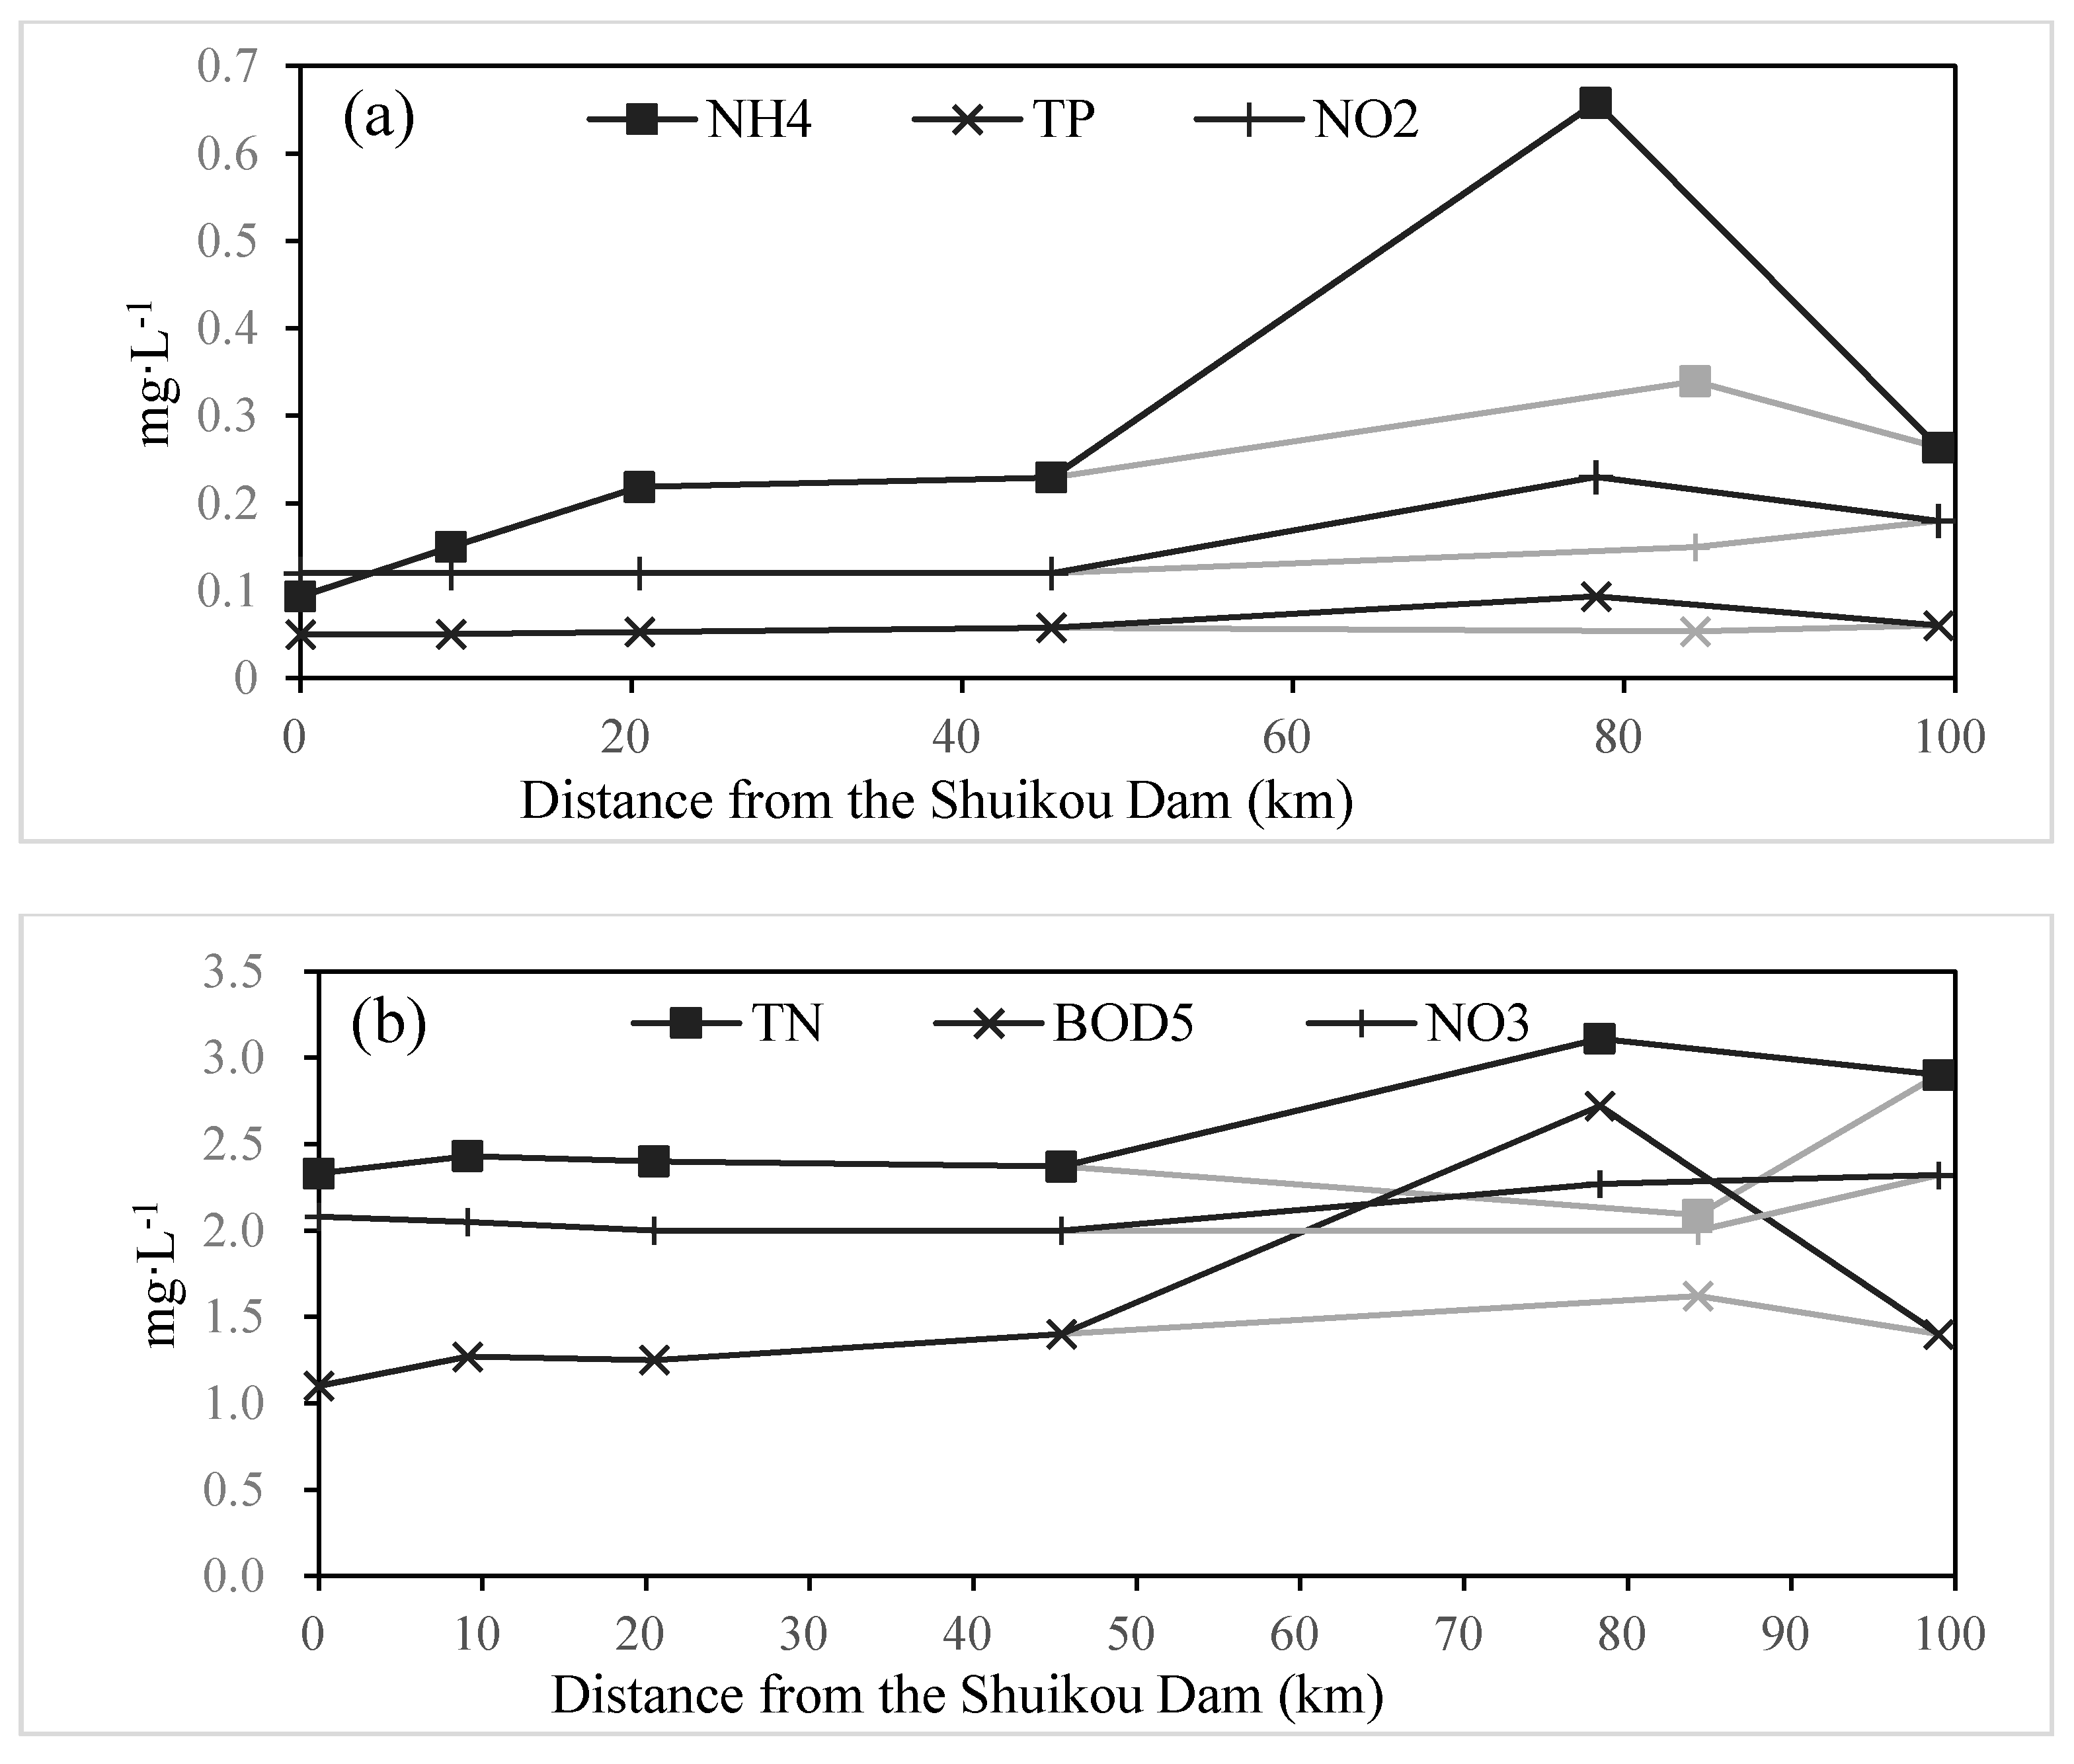
4.2.1. The Change of DO along the Minjiang River


4.2.2. Occurrence of a DO Depleted Water Mass Centered on the Municipal District of Fuzhou

4.3. The Trends

5. Conclusions
Acknowledgements
Author Contributions
Conflicts of Interest
References
- Dai, M.H.; Guo, X.G.; Zhai, W.D.; Yuan, L.Y.; Wang, B.W.; Wang, L.F.; Cai, P.H.; Tang, T.T.; Cai, W.J. Oxygen depletion in the upper reach of the Pearl River estuary during a winter drought. Mar. Chem. 2006, 102, 159–169. [Google Scholar]
- Wang, B.D.; Wei, Q.S.; Chen, J.F.; Xie, L.P. Annual cycle of hypoxia off the Changjiang (Yangtze River) Estuary. Mar. Environ. Res. 2012, 77, 1–5. [Google Scholar]
- Diaz, R.J.; Rosenberg, R. Spreading dead zones and consequences for marine ecosystems. Science 2008, 321, 926–929. [Google Scholar]
- Holmer, M. The effect of oxygen depletion on anaerobic organic matter degradation in marine sediments. Estuar. Coast. Shelf Sci. 1999, 48, 383–390. [Google Scholar]
- Lanoux, A.; Etcheber, H.; Schmidt, S.; Sottolichio, A.; Chabaud, G.; Richard, M.; Abril, G. Factors contributing to hypoxia in a highly turbid, macrotidal estuary (the Gironde, France). Environ. Sci. 2013, 15, 585–95. [Google Scholar]
- Justić, D.; Bierman, V.J.; Scavia, D.; Hetland, R.D. Forecasting gulf’s hypoxia: The next 50 years? Estuar Coast. 2007, 30, 791–801. [Google Scholar] [CrossRef]
- Levin, L.A.; Ekau, W.; Gooday, A.J.; Jorissen, F.; Middelburg, J.J.; Naqvi, S.W.A.; Neira, C.; Rabalais, N.N.; Zhang, J. Effects of natural and human-induced hypoxia on coastal benthos. Biogeosciences 2009, 6, 2063–2098. [Google Scholar] [CrossRef] [Green Version]
- Park, K.; Kuo, A.Y.; Neilson, B.J. A numerical model study of hypoxia in the tidal Rappahannock River of Cheasapeake bay. Estuar. Coast. Shelf Sci. 1996, 42, 563–581. [Google Scholar] [CrossRef]
- Xia, M.; Craig, P.M.; Wallen, C.M.; Stoddard, A.; Mandrup-Poulsen, J.; Peng, M.C.; Schaeffer, B.; Liu, Z.J. Influence of physical forcing on bottom-water dissolved oxygen within caloosahatchee River estuary, Florida. J. Environ. Eng. 2010, 136, 1032–1044. [Google Scholar] [CrossRef]
- Gattuso, J.P.; Frankignoulle, M.; Wollast, R. Carbon and carbonate metabolism in coastal aquatic ecosystems. Annu Rev. Ecol. Syst. 1998, 29, 405–434. [Google Scholar] [CrossRef]
- Abril, G.; Nogueira, M.; Etcheber, H.; Cabecadas, G.; Lemaire, E.; Brogueira, M.J. Behaviour of organic carbon in nine contrasting European estuaries. Estuar. Coast. Shelf Sci. 2002, 54, 241–262. [Google Scholar] [CrossRef]
- Diaz, R.J. Overview of hypoxia around the world. J. Environ. Qual. 2001, 30, 275–281. [Google Scholar] [CrossRef] [PubMed]
- Scavia, D.; Justic, D.; Bierman, V.J. Reducing hypoxia in the Gulf of Mexico: Advice from three models. Estuaries 2004, 27, 419–425. [Google Scholar] [CrossRef]
- Rabalais, N.N.; Turner, R.E.; Wiseman, W.J. Gulf of Mexico hypoxia, aka “the dead zone”. Annu Rev. Ecol. Syst. 2002, 33, 235–263. [Google Scholar] [CrossRef]
- Rabalais, N.N.; Diaz, R.J.; Levin, L.A.; Turner, R.E.; Gilbert, D.; Zhang, J. Dynamics and distribution of natural and human-caused hypoxia. Biogeosciences 2010, 7, 585–619. [Google Scholar] [CrossRef]
- Li, D.J.; Zhang, J.; Huang, D.J.; Wu, Y.; Liang, J. Oxygen depletion off the Changjiang (Yangtze River) estuary. Sci. China Ser. D. 2002, 45, 1137–1146. [Google Scholar] [CrossRef]
- Yin, K.D.; Lin, Z.F.; Ke, Z.Y. Temporal and spatial distribution of dissolved oxygen in the Pearl River estuary and adjacent coastal waters. Cont. Shelf Res. 2004, 24, 1935–1948. [Google Scholar] [CrossRef]
- Abril, G.; Riou, S.A.; Etcheber, H.; Frankignoulle, M.; de Wit, R.; Middelburg, J.J. Transient, tidal time-scale, nitrogen transformations in an estuarine turbidity maximum-fluid mud system (The Gironde, south-west France). Estuar. Coast. Shelf Sci. 2000, 50, 703–715. [Google Scholar] [CrossRef]
- Wang, B.D. Hydromorphological mechanisms leading to hypoxia off the Changjiang estuary. Mar. Environ. Res. 2009, 67, 53–58. [Google Scholar] [CrossRef] [PubMed]
- Zhu, Z.Y.; Zhang, J.; Wu, Y.; Zhang, Y.Y.; Lin, J.; Liu, S.M. Hypoxia off the Changjiang (Yangtze River) estuary: Oxygen depletion and organic matter decomposition. Mar. Chem. 2011, 125, 108–116. [Google Scholar] [CrossRef]
- Rabalais, N.N.; Turner, R.E.; Wiseman, W.J. Hypoxia in the Gulf of Mexico. J. Environ. Qual. 2001, 30, 320–329. [Google Scholar] [CrossRef] [PubMed]
- Garnier, J.; Servais, P.; Billen, G.; Akopian, M.; Brion, N. Lower Seine river and estuary (France) carbon and oxygen budgets during low flow. Estuaries 2001, 24, 964–976. [Google Scholar] [CrossRef]
- Balls, P.W.; Brockie, N.; Dobson, J.; Johnston, W. Dissolved oxygen and nitrification in the upper Forth estuary during summer (1982–1992): Patterns and trends. Estuar. Coast. Shelf Sci. 1996, 42, 117–134. [Google Scholar] [CrossRef]
- Hellings, L.; Dehairs, F.; Van Damme, S.; Baeyens, W. Dissolved inorganic carbon in a highly polluted estuary (the Scheldt). Limnol. Oceanogr. 2001, 46, 1406–1414. [Google Scholar] [CrossRef]
- Abril, G.; Etcheber, H.; Delille, B.; Frankignoulle, M.; Borges, A.V. Carbonate dissolution in the turbid and eutrophic Loire estuary. Mar. Ecol. Prog Ser. 2003, 259, 129–138. [Google Scholar] [CrossRef]
- Ritter, C.; Montagna, P.A. Seasonal hypoxia and models of benthic response in a Texas bay. Estuaries 1999, 22, 7–20. [Google Scholar] [CrossRef]
- Borsuk, M.E.; Stow, C.A.; Luettich, R.A.; Paerl, H.W.; Pinckney, J.L. Modelling oxygen dynamics in an intermittently stratified estuary: Estimation of process rates using field data. Estuar. Coast. Shelf Sci. 2001, 52, 33–49. [Google Scholar] [CrossRef]
- Zhang, Z.L.; Hong, H.S.; Zhou, J.L.; Yu, G. Phase association of polycyclic aromatic hydrocarbons in the Minjiang river estuary, China. Sci. Total Environ. 2004, 323, 71–86. [Google Scholar] [CrossRef] [PubMed]
- Hu, X.S.; Wu, C.Z.; Hong, W.; Qiu, R.Z.; Li, J.; Hong, T. Forest cover change and its drivers in the upstream area of the Minjiang river, China. Ecol. Indic. 2014, 46, 121–128. [Google Scholar] [CrossRef]
- Yang, Y.S.; Chen, G.S.; Guo, J.F.; Xie, J.S.; Wang, X.G. Soil respiration and carbon balance in a subtropical native forest and two managed plantations. Plant. Ecol. 2007, 193, 71–84. [Google Scholar] [CrossRef]
- Huang, Y.F. The Minjiang river bed downstream evolution and impact studies. Chin. Water Sci. Technol. 2010, 4, 15–17. (In Chinese) [Google Scholar]
- Lan, L. Two Dimensional Hydrodynamic and Water Quality Modeling for the North Branch of Lower Minjiang River. Master Thesis, Fujian Normal University, Fuzhou, Fujian, China, 2007. [Google Scholar]
- Taihu Basin Authority of Ministry of Water Resources. Available online: http://218.1.102.99:8100/indexWater.html (accessed on 10 August 2015).
- Fujian Provincal Department of Environmental Protection. Available online: http://www.fjepb.gov.cn/hbywzl/kjjc/hjzl/qsszzb/index_4.htm (accessed on 10 August 2015).
- Shen, J.; Haas, L. Calculating age and residence time in the tidal York River using three-dimensional model experiments. Estuar. Coast. Shelf Sci. 2004, 61, 449–461. [Google Scholar] [CrossRef]
- Shen, J.; Wang, H.V. Determining the age of water and long-term transport timescale of the Chesapeake bay. Estuar. Coast. Shelf Sci. 2007, 74, 585–598. [Google Scholar] [CrossRef]
- Talke, S.A.; de Swart, H.E.; de Jonge, V.N. An idealized model and systematic process study of oxygen depletion in highly Turbid estuaries. Estuar. Coast. 2009, 32, 602–620. [Google Scholar] [CrossRef]
- Xia, M.; Craig, P.M.; Wallen, C.M.; Stoddard, A.; Mandrup-Poulsen, J.; Peng, M.C.; Schaeffer, B.; Liu, Z.J. Numerical simulation of salinity and dissolved oxygen at Perdido bay and adjacent coastal ocean. J. Coastal Res. 2011, 27, 73–86. [Google Scholar] [CrossRef]
- Gilbert, D.; Rabalais, N.N.; Diaz, R.J.; Zhang, J. Evidence for greater oxygen decline rates in the coastal ocean than in the open ocean. Biogeosciences 2010, 7, 2283–2296. [Google Scholar] [CrossRef]
- Etcheber, H.; Schmidt, S.; Sottolichio, A.; Maneux, E.; Chabaux, G.; Escalier, J.M.; Wennekes, H.; Derriennic, H.; Schmeltz, M.; Quemener, L.; et al. Monitoring water quality in estuarine environments: Lessons from the MAGEST monitoring program in the Gironde fluvial-estuarine system. Hydrol. Earth Syst. Sci. 2011, 15, 831–840. [Google Scholar] [CrossRef]
- Rubio-Arias, H.; Contreras-Caraveo, M.; Quintana, R.M.; Saucedo-Teran, R.A.; Pinales-Munguia, A. An overall water quality index (WQI) for a man-made aquatic reservoir in Mexico. Int. J. Environ. Res. Public Health 2012, 9, 1687–1698. [Google Scholar] [CrossRef] [PubMed]
- Xie, R.R.; Pang, Y.; Bao, K. Spatiotemporal distribution of water environmental capacity—A case study on the western areas of Taihu lake in Jiangsu province, China. Environ. Sci. Pollut. Res. 2014, 21, 5465–5473. [Google Scholar] [CrossRef] [PubMed]
- Odjadjare, E.E.O.; Obi, L.C.; Okoh, A.I. Municipal wastewater effluents as a source of listerial pathogens in the aquatic milieu of the eastern Cape province of South Africa: A concern of public health importance. Int. J. Environ. Res. Public Health 2010, 7, 2376–2394. [Google Scholar] [CrossRef] [PubMed]
© 2015 by the authors; licensee MDPI, Basel, Switzerland. This article is an open access article distributed under the terms and conditions of the Creative Commons Attribution license (http://creativecommons.org/licenses/by/4.0/).
Share and Cite
Zhang, P.; Pang, Y.; Pan, H.; Shi, C.; Huang, Y.; Wang, J. Factors Contributing to Hypoxia in the Minjiang River Estuary, Southeast China. Int. J. Environ. Res. Public Health 2015, 12, 9357-9374. https://0-doi-org.brum.beds.ac.uk/10.3390/ijerph120809357
Zhang P, Pang Y, Pan H, Shi C, Huang Y, Wang J. Factors Contributing to Hypoxia in the Minjiang River Estuary, Southeast China. International Journal of Environmental Research and Public Health. 2015; 12(8):9357-9374. https://0-doi-org.brum.beds.ac.uk/10.3390/ijerph120809357
Chicago/Turabian StyleZhang, Peng, Yong Pang, Hongche Pan, Chengchun Shi, Yawen Huang, and Jianjian Wang. 2015. "Factors Contributing to Hypoxia in the Minjiang River Estuary, Southeast China" International Journal of Environmental Research and Public Health 12, no. 8: 9357-9374. https://0-doi-org.brum.beds.ac.uk/10.3390/ijerph120809357