
Association between Ambient Air Pollution and Asthma Prevalence in Different Population Groups Residing in Eastern Texas, USA


Abstract
:1. Introduction
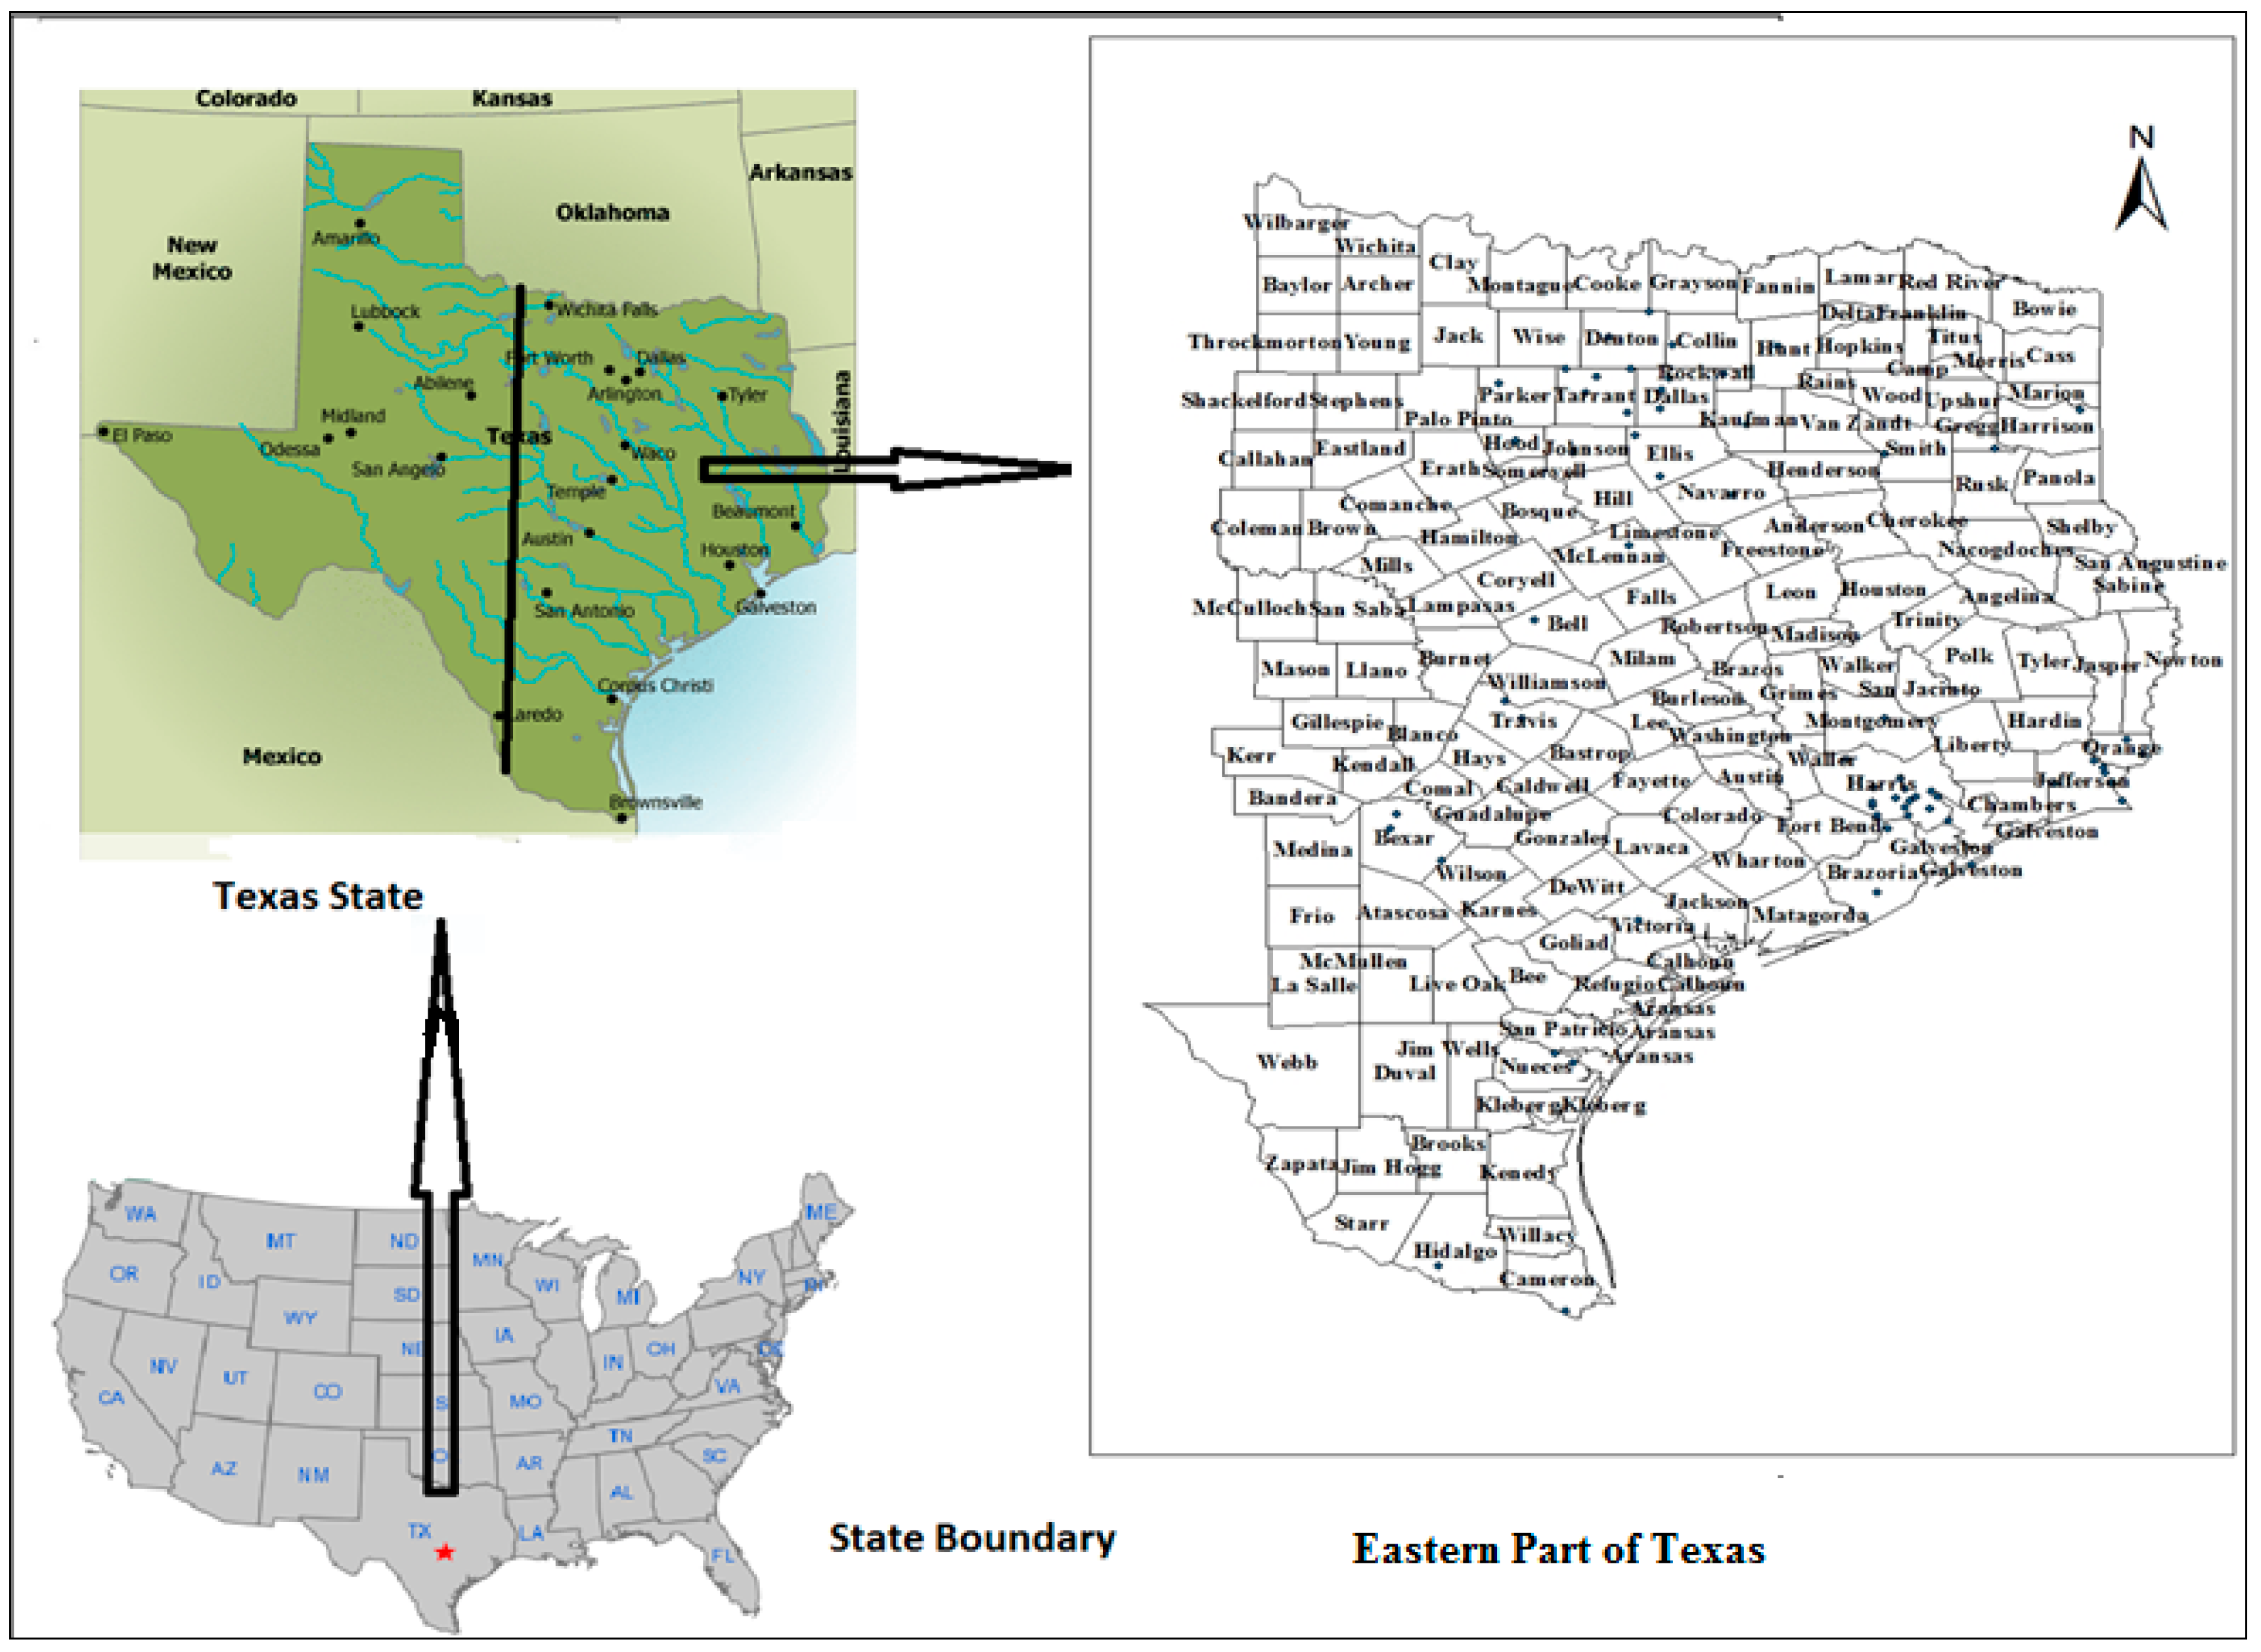
2. Study Area
3. Data
3.1. Asthma Data
3.2. Air Pollution Data
3.2.1. Statistical Analyses of Air Pollution Data
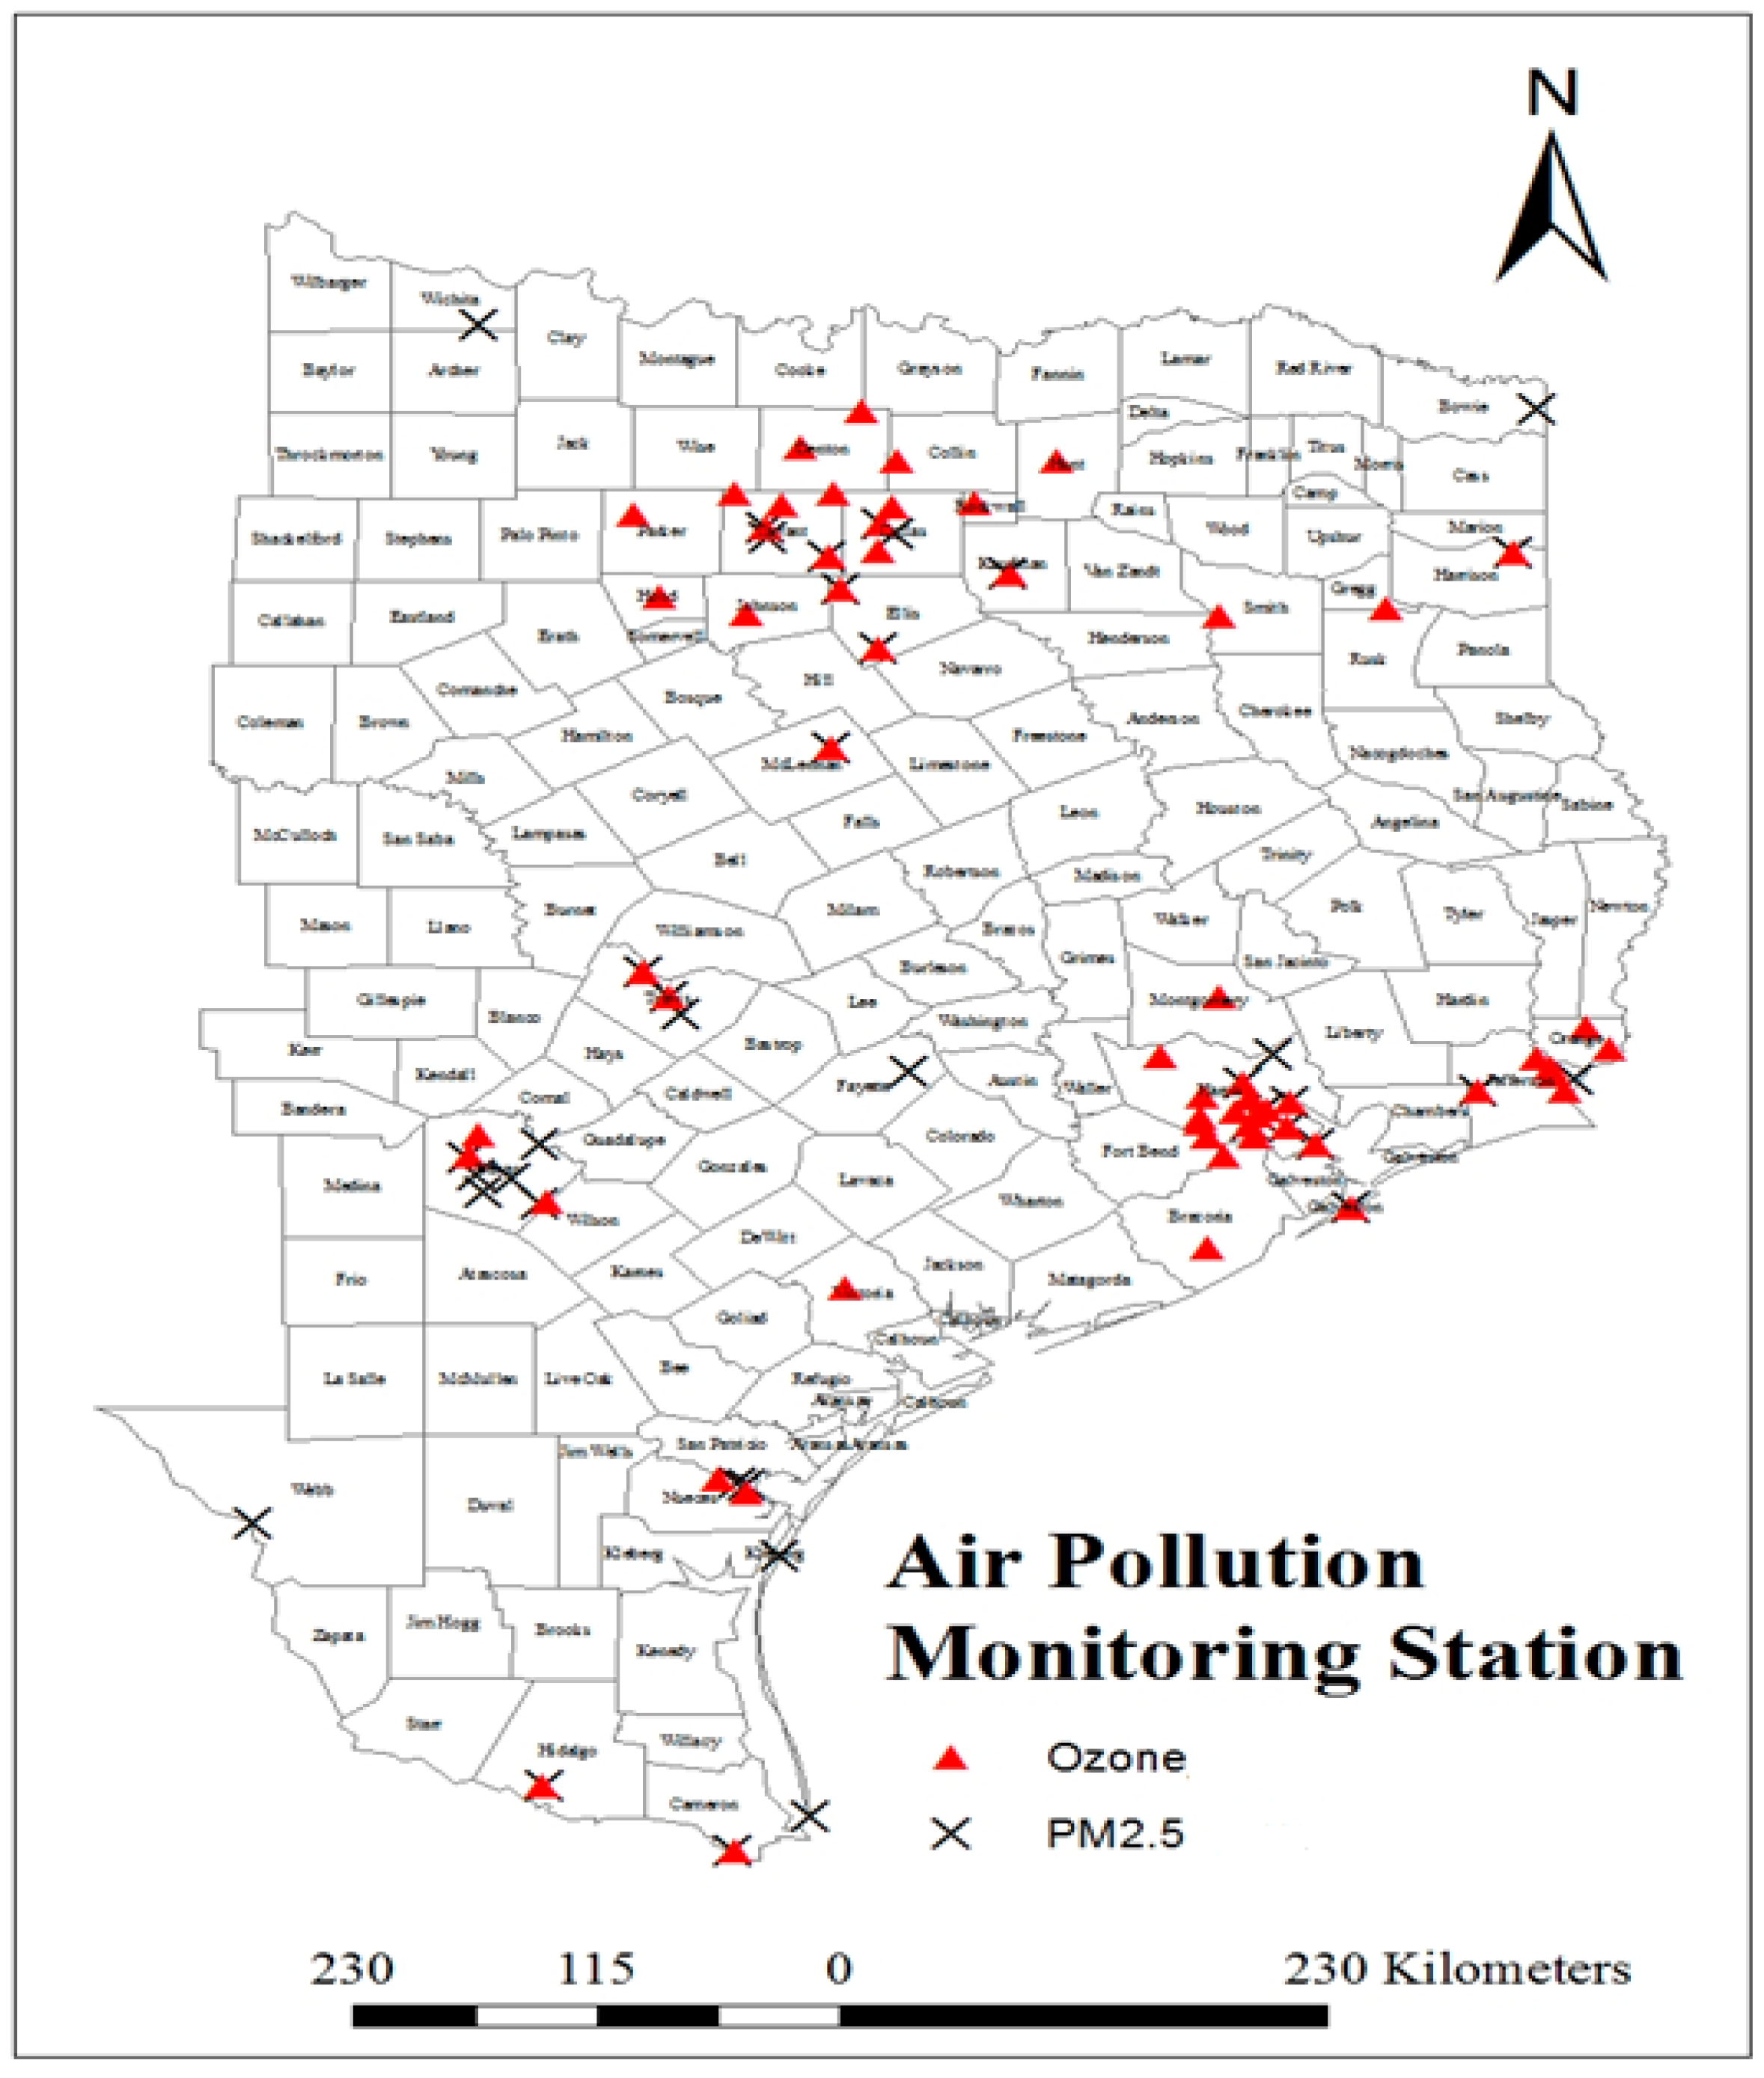
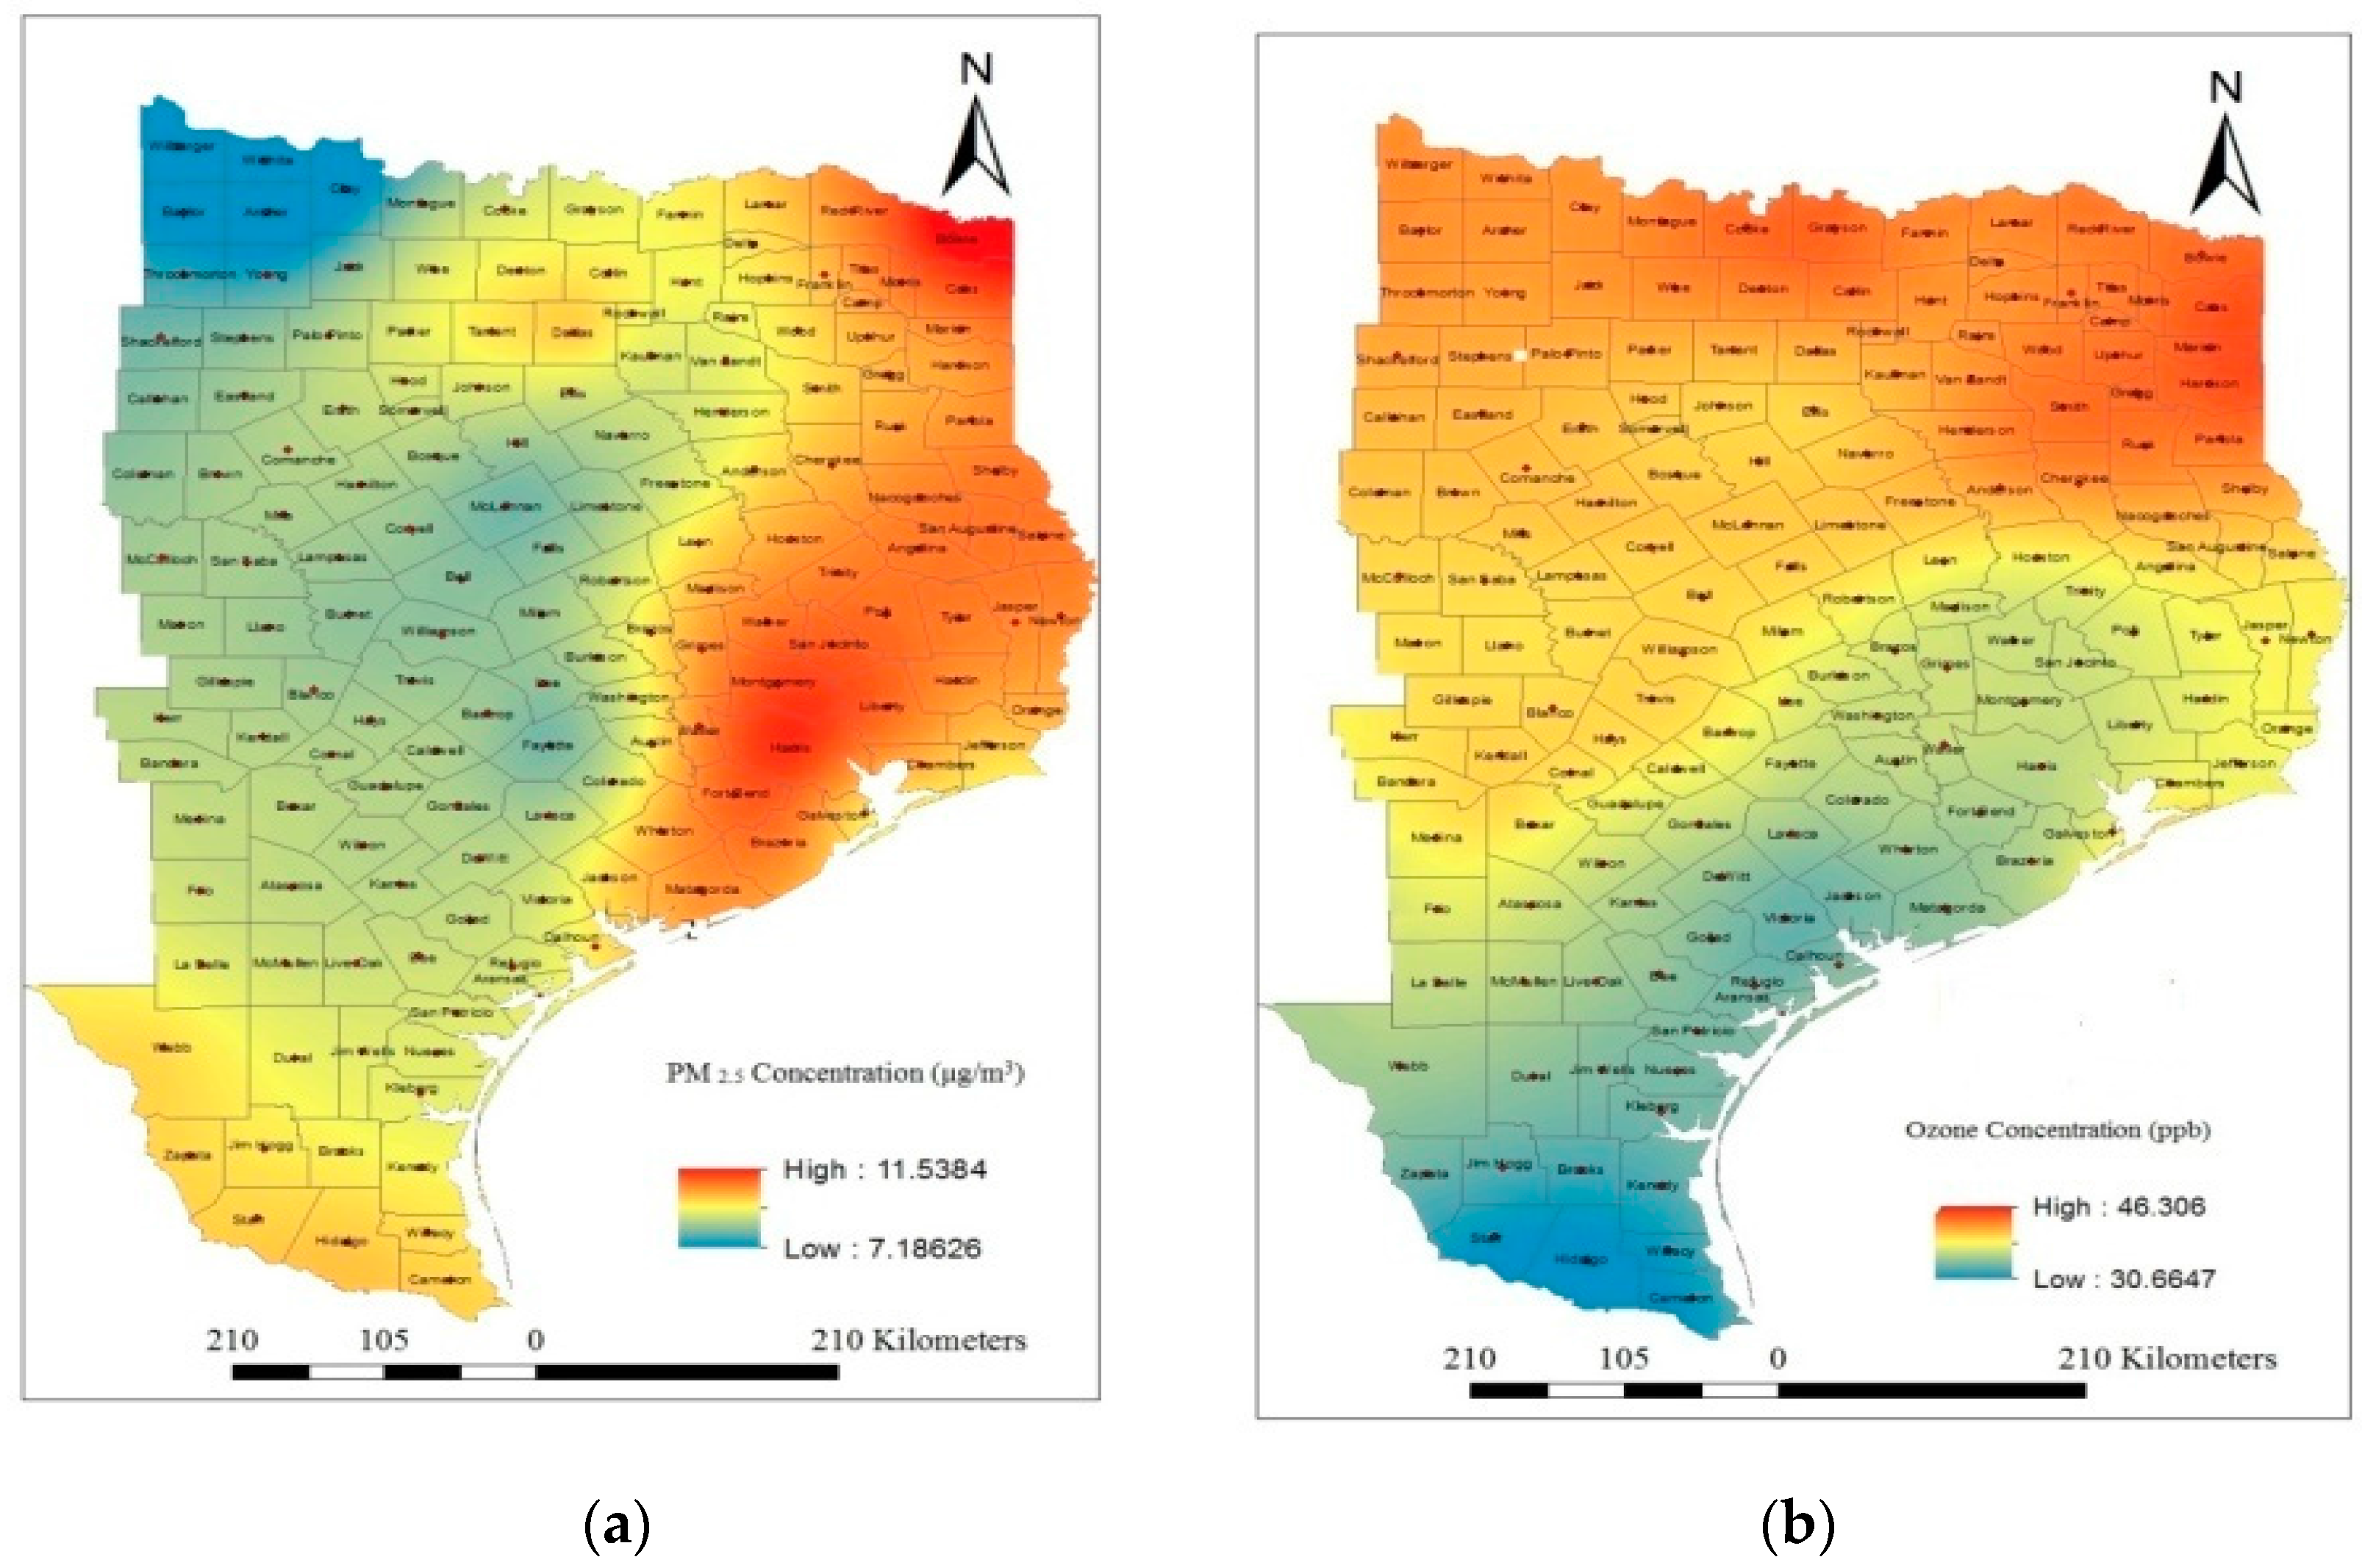
3.2.2. Spatial Analysis of Air Pollution Data
4. Results and Discussion
Correlation Analyses
Cross Correlation Analyses
Autocorrelation Analyses
5. Limitations of the Study
6. Conclusions
Acknowledgments
Author Contributions
Conflicts of Interest
References
- Cohen, A.J.; Anderson, H.R.; Ostra, B.; Dev Pandey, K.; Krzyzanowski, M.; Kunzli, N.; Guschmidt, K.; Pope, A.; Romieu, I.; Samet, J.M.; et al. The Global burden of disease due to outdoor air pollution. J. Toxicol. Environ. Health A 2005, 68, 1–7. [Google Scholar] [CrossRef] [PubMed]
- Global Burden of Disease Study 2010. Available online: http://www. thelancet.com/themed/global-burden-of-disease (accessed on 18 December 2015).
- Künzli, N.; Kaiser, R.; Medina, S.; Studnicka, M.; Chanel, O.; Filliger, P.; Herry, M.; Horak, F., Jr.; Puybonnieux-Texier, V.; Quénel, P.; et al. Public-health impact of outdoor and traffic-related air pollution: A European assessment. Lancet 2000, 356, 795–801. [Google Scholar] [CrossRef]
- Valent, F.; Little, D.; Bertollini, R.; Nemer, L.; Barbone, F.; Tamburlini, G. Burden of disease attributable to selected environmental factors and injury among children and adolescents in Europe. Lancet 2003, 363, 2032–2039. [Google Scholar] [CrossRef]
- Levy, J.I.; Hammitt, J.K.; Spengler, J.D. Estimating the mortality impacts of particulate matter: What can be learned from between-study variability? Environ. Health Perspect. 2000, 108, 109–117. [Google Scholar] [CrossRef] [PubMed]
- Carey, I.M.; Atkinson, R.W.; Kent, A.J.; van Staa, T.; Cook, D.G.; Anderson, H.R. Mortality associations with long-term exposure to outdoor air pollution in a national English cohort. Am. J. Respir. Crit. Care Med. 2013, 187, 1226–1233. [Google Scholar] [CrossRef] [PubMed]
- Goodman, P.G.; Dockery, D.W.; Clancy, L. Cause-specific mortality and the extended effects of particulate pollution and temperature exposure. Environ. Health Perspect. 2004, 112, 179–185. [Google Scholar] [CrossRef] [PubMed]
- Schwartz, J. The effects of particulate air pollution on daily deaths: A multi-city case-crossover analysis. Occup. Environ. Med. 2004, 61, 956–961. [Google Scholar] [CrossRef] [PubMed]
- Analitis, A.; Katsouyanni, K.; Dimakopoulou, K.; Samoli, E.; Nikoloulopoulos, A.K.; Petasakis, Y.; Touloumi, G.; Schwartz, J.; Anderson, H.R.; Cambra, K.; et al. Short-term effects of ambient particles on cardiovascular and respiratory mortality. Epidemiology 2006, 17, 230–233. [Google Scholar] [CrossRef] [PubMed]
- Choi, M.; Curriero, F.C.; Johantgen, M.; Mills, M.E.; Sattler, B.; Lipscomb, J. Association between ozone and emergency department visits: An ecological study. Int. J. Environ. Health Res. 2011, 21, 201–221. [Google Scholar] [CrossRef] [PubMed]
- Bild, D.E.; Bluemke, D.A.; Burke, G.L.; Detrano, R.; Diez Roux, A.V.; Folsom, A.R.; Greenland, P.; Jacob, D.R., Jr.; Kronmal, R.; Liu, K.; et al. Multi-Ethnic Study of Atherosclerosis: Objectives and design. Am. J. Epidemiol. 2002, 156, 871–881. [Google Scholar] [CrossRef]
- Chen, H.; Goldberg, M.S.; Villeneuve, P.J. A systematic review of the relation between long-term exposure to ambient air pollution and chronic diseases. Rev. Environ. Health 2008, 23, 243–297. [Google Scholar] [PubMed]
- Szpiro, A.A.; Sampson, P.D.; Lumley, T.; Adar, S.D.; Kaufman, J.D. Predicting intra-urban variation in air pollution concentrations with complex spatio-temporal dependencies. Environmetrics 2009, 21, 606–631. [Google Scholar] [CrossRef] [PubMed]
- Cohen, M.A.; Adar, S.D.; Allen, R.W.; Avol, E.; Curl, C.L.; Gould, T.; Hardie, D.; Ho, A.; Kinney, P.; Larson, T.V.; et al. Approach to estimating participant pollutant exposures in the Multi-Ethnic Study ofAtherosclerosis and Air Pollution (Mesa Air). Environ. Sci. Technol. 2009, 43, 4687–4693. [Google Scholar] [CrossRef] [PubMed]
- Sampson, P.D.; Szpiro, A.A.; Sheppard, L.; Lindstom, J.; Kaufman, J.D. Pragmatic estimation of a spatio-temporal air quality model with irregular monitoring data. Atmos. Environ. 2011, 45, 6593–6606. [Google Scholar] [CrossRef]
- Kaufman, J.D.; Adar, S.D.; Allen, R.W.; Barr, R.G.; Budoff, M.J.; Burke, G.L.; Casillas, A.M.; Cohen, M.A.; Curl, C.L.; Daviglus, M.L.; et al. Prospective study of particulate air pollution exposures, subclinical atherosclerosis, and clinical cardiovascular disease: The Multi-Ethnic Study of Atherosclerosis and Air Pollution (Mesa Air). Am. J. Epidemiol. 2012, 176, 825–837. [Google Scholar] [CrossRef] [PubMed]
- Pope, C.A., III; Burnett, R.T.; Thurston, G.D.; Thun, M.J.; Calle, E.E.; Krewski, D.; Godleski, J.J. Cardiovascular mortality and long-term exposure to particulate air pollution: Epidemiological evidence of general pathophysiological pathways of disease. Circulation 2004, 109, 71–77. [Google Scholar] [CrossRef] [PubMed]
- U.S. Environmental Protection Agency. Integrated Science Assessment for Particulate Matter. December 2009. Available online: http://www.epa.gov/ncea/pdfs/partmatt/Dec2009/PM_ISA_full.pdf (accessed on 13 December 2014). [Google Scholar]
- Miller, K.A.; Siscovick, D.S.; Sheppard, L.; Shepherd, K.; Sullivan, J.H.; Anderson, G.L.; Kaufman, J.D. Longterm exposure to air pollution and incidence of cardiovascular events in women. New Engl. J. Med. 2007, 356, 447–458. [Google Scholar] [CrossRef] [PubMed]
- U.S. Environmental Protection Agency. Air Quality Criteria for Ozone and Related Photochemical Oxidants. February 2006. Available online: http://oaspub.epa.gov/eims/eimscomm.getfile?p_download_id=456384 (accessed on 13 December 2014). [Google Scholar]
- Brook, R.D.; Rajagopalan, S.; Pope, C.A., III; Brook, J.R.; Bhatnagar, A.; Diez-Roux, A.V.; Holguin, F.; Hong, Y.; Luepker, R.V.; Mittleman, M.A.; et al. Particulate matter air pollution and cardiovascular disease: An update to the scientific statement from the American Heart Association. Circulation 2010, 121, 2331–2378. [Google Scholar] [CrossRef] [PubMed]
- Delfino, R.J.; Coate, B.D.; Zeiger, R.S.; Seltzer, J.M.; Street, D.H.; Koutrakis, P. Daily asthma severity in relation to personal ozone exposures and outdoor fungal spores. Am. J. Respir. Crit. Care Med. 1996, 154, 633–641. [Google Scholar] [CrossRef] [PubMed]
- Delfino, R.J.; Zeiger, R.S.; Seltzer, J.M.; Street, D.H.; Matteucci, R.M.; Anderson, P.R.; Koutrakis, P. The effect of outdoor fungal spore concentrations on daily asthma severity. Environ. Health Perspect. 1997, 105, 622–635. [Google Scholar] [CrossRef] [PubMed]
- Gorai, A.K.; Tuluri, F.; Tchounwou, P.B. A GIS based approach for assessing the Association between Air Pollution and Asthma in New York State, USA. Int. J. Environ. Res. Publ. Health 2014, 11, 4845–4869. [Google Scholar] [CrossRef] [PubMed]
- CDC. National Health Interview Survey Data 2011. Available online: http://www.cdc.gov/nchs/nhis.htm (accessed on 20 October 2014).
- Barnett, S.B.; Nurmagambetov, T.A. Costs of asthma in the United States: 2002–2007. J. Allergy Clin.Immunol. 2011, 127, 145–152. [Google Scholar] [CrossRef] [PubMed]
- Health Data Interactive. In Center for Disease Control and Prevention and National Center for Health Statistic, Online Server. Public Reports. Mortality and Life Expectancy. Mortality by Underlying Cause, Ages 18+ 2009. 2009. Available online: http://205.207.175.93/hdi/ReportFolders/ReportFolders.aspx (accessed on 18 December 2015).
- National Center for Environmental Health: Asthma’s Impacton the Nation. In Center for Disease Control and Prevention. 2012. Available online: http://www.cdc.gov/asthma/impacts_nation/AsthmaFactSheet.pdf (accessed on 18 December 2015).
- Akinbami, L.J.; Moorman, J.E.; Bailey, C.; Zahran, H.S.; King, M.; Johnson, C.A.; Liu, X. Trends in Asthma Prevalence, Health Care Use, and Mortality in the United States, 2001–2010. In NCHS Data Brief; 2012; 94. Available online: http://www.cdc.gov/nchs/data/databriefs/db94.pdf (accessed on 18 December 2015). [Google Scholar]
- American Academy of Pediatrics Committee on Environmental Health. Ambient air pollution: Health hazards to children. Pediatrics 2004, 114, 1699–1707. [Google Scholar] [CrossRef]
- Trasande, L.; Thurston, G.D. The role of air pollution in asthma and other pediatric morbidities. J. Allergy Clin. Immunol. 2005, 115, 689–699. [Google Scholar] [CrossRef] [PubMed]
- Moorman, J.E.; Rudd, R.A.; Johnson, C.A.; King, M.; Minor, P.; Bailey, C.; Scalia, M.R.; Lara, J.; Akinbami, L.J. National surveillance for asthma–United States, 1980–2004. MMWR Surveill. Summ. 2007, 56, 1–54. [Google Scholar] [PubMed]
- Schwartz, J.; Zanobetti, A. Using meta-smoothing to estimate dose-response trends across multiple studies, with application to air pollution and daily death. Epidemiology 2000, 11, 666–672. [Google Scholar] [CrossRef] [PubMed]
- Gold, D.R.; Damokosh, A.I.; Pope, C.A.; Dockery, D.W.; McDonnell, W.F.; Serrano, P.; Retama, A.; Castillejos, M. Particulate and ozone pollutant effects on the respiratory function of children in southwest Mexico City. Epidemiology 1999, 10, 8–16. [Google Scholar] [CrossRef] [PubMed]
- Bell, M.L.; McDermott, A.; Zeger, S.L.; Samet, J.M.; Dominici, F. Ozone and short-term mortality in 95 US urban communities, 1987–2000. JAMA 2004, 292, 2372–2378. [Google Scholar] [CrossRef] [PubMed]
- Filleul, L.; Cassadou, S.; Medina, S.; Fabres, P.; Lefranc, A.; Eilstein, D.; le Tertre, A.; Pascal, L.; Chardon, B.; Blanchard, M.; et al. The relation between temperature, ozone, and mortality in nine French cities during the heat wave of 2003. Environ. Health Perspect. 2006, 114, 1344–1347. [Google Scholar] [CrossRef] [PubMed]
- Halonen, J.I.; Lanki, T.; Tiittanen, P.; Niemi, J.V.; Loh, M.; Pekkanen, J. Ozone and cause-specific cardiorespiratory morbidity and mortality. J. Epidemiol. Community Health. 2010, 64, 814–820. [Google Scholar] [CrossRef] [PubMed]
- Cassino, C.; Ito, K.; Bader, I.; Ciotoli, C.; Thurston, G.; Reibman, J. Cigarette smoking andozone-associated emergency department use for asthma by adults in New York City. Am. J. Respir. Crit. Care Med. 1999, 159, 1773–1779. [Google Scholar] [CrossRef] [PubMed]
- Jaffe, D.H.; Singer, M.E.; Rimm, A.A. Air pollution and emergency department visits for asthma among Ohio medicaid recipients, 1991–1996. Environ. Res. 2003, 91, 21–28. [Google Scholar] [CrossRef]
- Peel, J.L.; Tolbert, P.E.; Klein, M.; Metzger, K.B.; Flanders, W.D.; Todd, K.; Mulholland, J.A.; Ryan, P.B.; Frumkin, H. Ambient air pollution and respiratory emergency department visits. Epidemiology 2005, 16, 164–174. [Google Scholar] [CrossRef] [PubMed]
- Wilson, A.M.; Wake, C.P.; Kelly, T.; Salloway, J.C. Air pollution, weather, and respiratory emergency room visits in two northern New England cities: An ecological time-series study. Environ. Res. 2005, 97, 312–321. [Google Scholar] [CrossRef] [PubMed]
- Stieb, D.M.; Szyszkowicz, M.; Rowe, B.H.; Leech, J.A. Air pollution and emergency department visits for cardiac and respiratory conditions: A multi-city time-series analysis. Environ. Health 2009, 8. [Google Scholar] [CrossRef] [PubMed]
- Thurston, G.D.; Ito, K.; Hayes, C.G.; Bates, D.V.; Lippmann, M. Respiratory hospital admissions and summertime haze air pollution in Toronto, Ontario: Consideration of the role of acid aerosols. Environ. Res. 1994, 65, 271–290. [Google Scholar] [CrossRef] [PubMed]
- Anderson, W.; Prescott, G.J.; Packham, S.; Mullins, J.; Brookes, M.; Seaton, A. Asthma admissions and thunderstorms: A study of pollen, fungal spores, rainfall, and ozone. QJM 2001, 94, 429–433. [Google Scholar] [CrossRef] [PubMed]
- Lee, J.T.; Cho, Y.S.; Son, J.Y. Relationship between ambient ozone concentrations and daily hospital admissions for childhood asthma/atopic dermatitis in two cities of Korea during 2004–2005. Int. J. Environ. Health Res. 2010, 20, 1–11. [Google Scholar] [CrossRef] [PubMed]
- Ito, K.; Thurston, G.D.; Silverman, R.A. Characterization of PM2.5, gaseous pollutants, and meteorological interactions in the context of time-series health effects models. J. Expo. Sci. Environ. Epidemiol. 2007, 17 (Suppl. 2), S45–S60. [Google Scholar] [CrossRef] [PubMed]
- Strickland, M.J.; Darrow, L.A.; Klein, M.; Flanders, W.D.; Sarnat, J.A.; Waller, L.A.; Sarnat, S.E.; Mulholland, J.A.; Tolbert, P.E. Short-term associations between ambient air pollutants and pediatric asthma emergency department visits. Am. J. Respir. Crit. Care Med. 2010, 182, 307–316. [Google Scholar] [CrossRef] [PubMed]
- Akinbami, L.J.; Lynch, C.D.; Parker, J.D.; Woodruff, T.J. The association between childhood asthma prevalence and monitored air pollutants in metropolitan areas, United States, 2001–2004. Environ. Res. 2010, 110, 294–301. [Google Scholar] [CrossRef] [PubMed]
- Silverman, R.A.; Ito, K. Age-related association of fine particles and ozone with severe acute asthma in New York City. J. Allergy Clin. Immunol. 2010, 125, 367–373. [Google Scholar] [CrossRef] [PubMed]
- Dong, G.H.; Chen, T.; Liu, M.M.; Wang, D.; Ma, Y.N.; Ren, W.H.; Lee, Y.L.; Zhao, Y.D.; He, Q.C. Gender differences and effect of air pollution on asthma in children with and without allergic predisposition: Northeast Chinese children health study. PLoS ONE 2011, 6. [Google Scholar] [CrossRef] [PubMed]
- Samoli, E.; Nastos, P.T.; Paliatsos, A.G.; Katsouyanni, K.; Priftis, K.N. Acute effects of air pollution on pediatric asthma exacerbation: Evidence of association and effect modification. Environ. Res. 2011, 111, 418–424. [Google Scholar] [CrossRef] [PubMed]
- Zeka, A.; Zanobetti, A.; Schwartz, J. Individual-level modifiers of the effects of particulate matter on daily mortality. Am. J. Epidemiol. 2006, 163, 849–859. [Google Scholar] [CrossRef] [PubMed]
- Ostro, B.; Feng, W.Y.; Broadwin, R.; Malig, B.; Green, S.; Lipsett, M. The impact of components of fine particulate matter on cardiovascular mortality in susceptible subpopulations. Occup. Environ. Med. 2008, 65, 750–756. [Google Scholar] [CrossRef] [PubMed]
- Bell, M.L.; Dominici, F. Effect modification by community characteristics on the short-term effects of ozone exposure and mortality in 98 US Communities. Am. J. Epidemiol. 2008, 167, 986–997. [Google Scholar] [CrossRef] [PubMed]
- Apelberg, B.J.; Buckley, T.J.; White, R.H. Socioeconomic and racial disparities in cancer risk from air toxics in Maryland. Environ. Health Perspect. 2005, 113, 693–699. [Google Scholar] [CrossRef] [PubMed]
- Tian, J.; Wilson, J.G.; Zhan, F.B. Female breast cancer mortality clusters within racial groups in the United States. Health Place 2010, 16, 209–218. [Google Scholar] [CrossRef] [PubMed]
- U.S. Environmental Protection Agency, 2007. Integrated Review Plan for the Primary National Ambient Air Quality Standard for Nitrogen Dioxide. Available online: http://www.epa.gov/ttn/naaqs/standards/nox/data/20070823_nox_review_plan_final.pdf (accessed on 18 December 2015).
- U.S. Environmental Protection Agency, 2012. U.S. Federal Register: Secondary National Ambient Air Quality Standards for Oxides of Nitrogen and Sulfur. Available online: http://www.gpo.gov/fdsys/pkg/FR-2012-04-03/pdf/2012-7679.pdf (accessed on 18 December 2015).
- Schildcrout, J.S.; Sheppard, L.; Lumley, T.; Slaughter, J.C.; Koenig, J.Q.; Shapiro, G.G. Ambient air pollution and asthma exacerbations in children: An eight city analysis. Am. J. Epidemiol. 2006, 64, 505–517. [Google Scholar] [CrossRef] [PubMed]
- U.S. Census Bureau, Resident Population Data—2010 Census. Available online: http://www.census.gov/2010census/ (accessed on 13 December 2013).
- U.S. Census Bureau, State Area Measurement. Available online: http://www.census.gov/geo/reference/state-area.html (accessed on 13 December 2013).
- Texas State Department of Health, Public Health Information Group. National Asthma Survey Report Data Obtained through Personal Request on March 2015.
- International Classification of Diseases (Ninth Revision, Clinical Modification); Department of Health and Human Services, Public Health Service, U.S.: Washington, DC, USA, 1988.
- U.S. Environmental Protection Agency, Technology Transfer Network (TTN) Air Quality System (AQS) Data Mart. Available online: http://www.epa.gov/airdata/ad_rep_mon.html/ (accessed on 15 December 2013).
- Oliver, M.A.; Webster, R. Kriging: A method of interpolation for geographical information science. Int. J. Geogr. Inf. Sci. 1990, 4, 313–332. [Google Scholar] [CrossRef]
- ESRI. Using analytic tools when generating surfaces. In Geostatistical Analyst Extension; ESRI Inc.: Redlands, CA, USA, 2001. [Google Scholar]
- Webster, R.; Oliver, M.A. Geostatistics for Environmental Scientists (Statistics in Practice); John Wiley & Sons Ltd.: Chichester, UK, 2007. [Google Scholar]
- Elliott, P.; Wartenberg, D. Spatial epidemiology: Current approaches and future challenges. Environ. Health Persp. 2004, 112, 998–1006. [Google Scholar] [CrossRef]
- Nuckols, J.R.; Ward, M.H.; Jarup, L. Using geographic information systems for exposure assessment in environmental epidemiology studies. Environ. Health Persp. 2004, 112, 1007–1015. [Google Scholar] [CrossRef]
- Brauer, M.; Hoek, G.; van Vliet, P.; Meliefste, K.; Fischer, P.; Gehring, U.; Heinrich, J.; Cyrys, J.; Bellander, T.; Lewne, M.; et al. Estimating long-term average particulate air pollution concentrations: Application of traffic indicators and geographic information systems. Epidemiology 2003, 14, 228–239. [Google Scholar] [CrossRef] [PubMed]
- Cockings, S.; Dunn, C.E.; Bhopal, R.S.; Walker, D.R. Users’ perspectives on epidemiological, GIS and point pattern approaches to analyzing environment and health data. Health Place 2004, 10, 169–182. [Google Scholar] [CrossRef] [PubMed]
- Gotway, C.; Young, L.J. Combining incompatible spatial data. J. Am. Stat. Assoc. 2002, 97, 632–647. [Google Scholar] [CrossRef]
- Scoggins, A.; Kjellstrom, T.; Fisher, G.; Connor, J.; Gimson, N. Spatial analysis of annual air pollution exposure and mortality. Sci. Total Environ. 2004, 321, 71–85. [Google Scholar] [CrossRef] [PubMed]
- Jerrett, M.; Burnett, R.T.; Ma, R.; Pope, C.A., 3rd; Krewski, D.; Newbold, K.B.; Thurston, G.; Shi, Y.; Finkelstein, N.; Calle, E.E.; et al. Spatial analysis of air pollution and mortality in Los Angeles. Epidemiology 2005, 16, 727–736. [Google Scholar] [CrossRef] [PubMed]
- Gorai, A.K.; Tuluri, F.; Tchounwou, P.B.; Shaw, N.; Jain, K.G. Establishing the association between quarterly/seasonal air pollution exposure and asthma using geospatial approach. Aerosol Air Qual. Res. 2015, 15, 1525–1544. [Google Scholar] [CrossRef]
- Rashidi, M.; Ramesht, M.H.; Zohary, M.; Poursafa, P.; Kelishadi, R.; Rashidi, Z.; Rouzbahani, R. Relation of air pollution with epidemiology of respiratory diseases in isfahan, Iran from 2005 to 2009. J. Res. Med.Sci. 2013, 18, 1074–1079. [Google Scholar] [PubMed]
- Le, T.G.; Ngo, L.; Mehta, S.; Do, V.D.; Thach, T.Q.; Vu, X.D.; Nguyen, D.T.; Cohen, A. Effects of short-term exposure to air pollution on hospital admissions of young children for acute lower respiratory infections in Ho Chi Minh City, Vietnam. Res. Rep. Health Eff. Inst. 2012, 169, 5–72. [Google Scholar] [PubMed]
- Gouveia, N.; Fletcher, T. Time series analysis of air pollution and mortality: effects by cause, age and socioeconomic status. J. Epidemiol. Community Health 2000, 54, 750–755. [Google Scholar] [CrossRef] [PubMed]
- Kan, H.; Chen, B.; Zhao, N.; London, S.J.; Song, G.; Chen, G.; Zhang, Y.; Jiang, L. A time-series study of ambient air pollution and daily mortality in Shanghai, China. Res. Rep. Health Eff. Inst. 2010, 154, 17–78. [Google Scholar] [CrossRef] [PubMed]
- Thurston, G.D. A critical review of PM10-mortality time-series studies. J. Expo. Anal. Environ. Epidemiol. 1996, 6, 3–21. [Google Scholar] [PubMed]
- Touloumi, G.; Pocock, S.J.; Katsouyanni, K.; Trichopoulos, D. Short-term effects of air pollution on daily mortality in Athens: A time-series analysis. Int. J. Epidemiol. 1994, 23, 957–967. [Google Scholar] [CrossRef] [PubMed]
- Schwartz, J.; Dockery, D.W. Particulate air pollution and daily mortality in Steubenville, Ohio. Am. J. Epidemiol. 1992, 135, 12–19. [Google Scholar] [PubMed]
- Sartor, F.; Snacken, R.; Demuth, C.; Walckiers, D. Temperature, ambient ozone levels, and mortality during summer, 1994, in Belgium. Environ. Res. 1995, 70, 105–113. [Google Scholar] [CrossRef] [PubMed]
- Dockery, D.W.; Schwartz, J.; Spengler, J.D. Air pollution and daily mortality: Associations with particulates and acid aerosols. Environ. Res. 1992, 59, 362–373. [Google Scholar] [CrossRef]
- Wordley, J.; Walters, S.; Ayres, J.G. Short term variations in hospital admissions and mortality and particulate air pollution. Occup. Environ. Med. 1997, 54, 108–116. [Google Scholar] [CrossRef] [PubMed]
- Borja-Aburto, V.H.; Loomis, D.P.; Bangdiwala, S.I.; Shy, C.M.; Rascon-Pacheco, R.A. Ozone, suspended particulates, and daily mortality in Mexico City. Am. J. Epidemiol. 1997, 145, 258–268. [Google Scholar] [CrossRef] [PubMed]
- Ballester, F.; Corella, D.; Perez-Hoyos, S.; Hervás, A. Air pollution and mortality in Valencia, Spain: A study using the APHEA methodology. J. Epidemiol. Community Health 1996, 50, 527–533. [Google Scholar] [CrossRef] [PubMed]
- Sunyer, J.; Castellsague, J.; Sáez, M.; Tobias, A.; Antó, J.M. Air pollution and mortality in Barcelona. J. Epidemiol. Community Health 1996, 50, S76–S80. [Google Scholar] [CrossRef] [PubMed]
- Pope, C.A.; Schwartz, J.; Ransom, M.R. Daily mortality and PM10 pollution in Utah Valley. Arch. Environ. Health 1992, 47, 211–217. [Google Scholar] [CrossRef] [PubMed]
- Schwartz, J. What are people dying of on high air pollution days? Environ. Res. 1994, 64, 26–35. [Google Scholar] [CrossRef] [PubMed]


| Items | Minimum | Maximum | Mean | Standard Deviation | Minimum | Maximum | Mean | Standard Deviation |
|---|---|---|---|---|---|---|---|---|
| First Quarter of 2010 (Q1) | Second Quarter of 2010 (Q2) | |||||||
| ADR * | 0 | 10.89 | 1.92 | 2.40 | 0 | 10.11 | 1.21 | 1.80 |
| PM2.5 ** | 5.5 | 11.7 | 8.3 | 1.42 | 6.8 | 13.2 | 10.5 | 1.30 |
| Ozone *** | 30.2 | 42.5 | 37.0 | 2.64 | 33.3 | 49.7 | 42.2 | 3.85 |
| Third Quarter of 2010 (Q3) | Fourth Quarter of 2010 (Q4) | |||||||
| ADR | 0 | 5.46 | 0.75 | 1.27 | 0 | 10.89 | 1.35 | 1.97 |
| PM2.5 | 8.7 | 14.6 | 11.0 | 1.24 | 6.1 | 11.3 | 9.1 | 1.26 |
| Ozone | 25.8 | 49.8 | 38.4 | 5.50 | 31.9 | 42.8 | 38.3 | 2.28 |
| Parameter | Type of Variogram Model | ME | RMSE | ASE | MSE | RMSSE |
|---|---|---|---|---|---|---|
| PM2.5 | Stable | 0.099 | 0.75 | 0.85 | 0.06 | 0.88 |
| Ozone | Stable | −0.090 | 1.40 | 1.63 | −0.03 | 0.99 |
| Items | Pearson Correlations Coefficients | ||||||||||
|---|---|---|---|---|---|---|---|---|---|---|---|
| PM2.5 | Ozone | AR_All | AR_Black | AR_White | AR_Hispanic | AR_Male | AR_Female | AR_LT_5Y | AR_5–65Y | AR_GT_65Y | |
| PM2.5 | 1 | ||||||||||
| Ozone | −0.100 | 1 | |||||||||
| AR_All | 0.244 ** | −0.095 | 1 | ||||||||
| AR_Black | 0.148 | 0.082 | 0.214 ** | 1 | |||||||
| AR_White | 0.181 * | 0.222 ** | 0.733 ** | 0.258 ** | 1 | ||||||
| AR_Hispanic | 0.039 | −0.003 | 0.134 | 0.065 | −0.061 | 1 | |||||
| AR_Male | 0.156 | −0.007 | 0.617 ** | 0.477 ** | 0.562 ** | 0.210 ** | 1 | ||||
| AR_Female | 0.205 ** | 0.003 | 0.858 ** | 0.306 ** | 0.767 ** | 0.122 | 0.655 ** | 1 | |||
| AR_LT_5Y | 0.086 | −0.037 | 0.048 | 0.132 | −0.021 | 0.018 | 0.149 | 0.066 | 1 | ||
| AR_5-65Y | 0.111 | −0.081 | 0.399 ** | 0.361 ** | 0.401 ** | 0.038 | 0.550 ** | 0.497 ** | 0.074 | 1 | |
| AR_GT_65Y | 0.130 | −0.022 | 0.499 ** | 0.482 ** | 0.529 ** | 0.157 * | 0.755 ** | 0.624 ** | 0.071 | 0.461 ** | 1 |
| Items | First Quarter (Q1) | Second Quarter (Q2) | Third Quarter (Q3) | Fourth Quarter (Q4) | ||||
|---|---|---|---|---|---|---|---|---|
| PM2.5 | Ozone | PM2.5 | Ozone | PM2.5 | Ozone | PM2.5 | Ozone | |
| AR_All | 0.104 | 0.099 | 0.125 | 0.057 | 0.116 | −0.009 | 0.053 | 0.108 |
| AR_Black | 0.012 | 0.073 | 0.142 | −0.023 | 0.054 | −0.135 | 0.032 | 0.026 |
| AR_White | 0.108 | 0.063 | 0.083 | 0.031 | 0.041 | 0.001 | 0.039 | 0.063 |
| AR_Hispanic | 0.177 * | −0.042 | 0.014 | 0.151 | 0.147 | 0.119 | 0.004 | 0.018 |
| AR_Male | 0.050 | −0.027 | 0.038 | 0.137 | 0.088 | 0.033 | −0.045 | −0.072 |
| AR_Female | 0.031 | 0.001 | 0.146 | −0.253 ** | 0.075 | 0.072 | 0.090 | 0.092 |
| AR_LT_5Y | −0.051 | 0.086 | 0.070 | −0.063 | −0.021 | −0.103 | 0.004 | 0.041 |
| AR_5–65Y | −0.055 | −0.054 | 0.157 | −0.162 * | 0.004 | −0.144 | 0.173 * | −0.109 |
| AR_GT_65Y | 0.077 | −0.012 | 0.115 | −0.027 | 0.024 | −0.088 | 0.104 | −0.120 |
| Entire Population Group | |||||||||
|---|---|---|---|---|---|---|---|---|---|
| Q1 | Q2 | Q3 | Q4 | ||||||
| Q1 | 1 | ||||||||
| Q2 | 0.684 ** | 1 | |||||||
| Q3 | 0.568 ** | 0.606 ** | 1 | ||||||
| Q4 | 0.657 ** | 0.781 ** | 0.503 ** | 1 | |||||
| Female Population Group | Male Population Group | ||||||||
| Q1 | Q2 | Q3 | Q4 | Q1 | Q2 | Q3 | Q4 | ||
| Q1 | 1 | Q1 | 1 | ||||||
| Q2 | 0.587 ** | 1 | Q2 | 0.773 ** | 1 | ||||
| Q3 | 0.622 ** | 0.742 ** | 1 | Q3 | 0.707 ** | 0.775 ** | 1 | ||
| Q4 | 0.547 ** | 0.610 ** | 0.591 ** | 1 | Q4 | 0.755 ** | 0.713 ** | 0.749 ** | 1 |
| Black Population Group | White Population Group | ||||||||
| Q1 | Q2 | Q3 | Q4 | Q1 | Q2 | Q3 | Q4 | ||
| Q1 | 1 | Q1 | 1 | ||||||
| Q2 | 0.678 ** | 1 | Q2 | 0.613 ** | 1 | ||||
| Q3 | 0.674 ** | 0.667 ** | 1 | Q3 | 0.583 ** | 0.749 ** | 1 | ||
| Q4 | 0.921 ** | 0.722 ** | 0.757 ** | 1 | Q4 | 0.701 ** | 0.489 ** | 0.435 ** | 1 |
| Hispanic Population Group | <5 Years Age Group | ||||||||
| Q1 | Q2 | Q3 | Q4 | Q1 | Q2 | Q3 | Q4 | ||
| Q1 | 1 | Q1 | 1 | ||||||
| Q2 | 0.155 | 1 | Q2 | 0.804 ** | 1 | ||||
| Q3 | 0.968 ** | 0.034 | 1 | Q3 | 0.662 ** | 0.636 ** | 1 | ||
| Q4 | 0.186 * | 0.701 ** | 0.044 | 1 | Q4 | 0.753 ** | 0.620 ** | 0.752 ** | 1 |
| 5–65 Years Age Group | ≥ 65 Years Age Group | ||||||||
| Q1 | Q2 | Q3 | Q4 | Q1 | Q2 | Q3 | Q4 | ||
| Q1 | 1 | Q1 | 1 | ||||||
| Q2 | 0.685 ** | 1 | Q2 | 0.587 ** | 1 | ||||
| Q3 | 0.643 ** | 0.879 ** | 1 | Q3 | 0.714 ** | 0.763 ** | 1 | ||
| Q4 | 0.614 ** | 0.805 ** | 0.815 ** | 1 | Q4 | 0.773 ** | 0.725 ** | 0.837 ** | 1 |
© 2016 by the authors; licensee MDPI, Basel, Switzerland. This article is an open access article distributed under the terms and conditions of the Creative Commons by Attribution (CC-BY) license (http://creativecommons.org/licenses/by/4.0/).
Share and Cite
Gorai, A.K.; Tchounwou, P.B.; Tuluri, F. Association between Ambient Air Pollution and Asthma Prevalence in Different Population Groups Residing in Eastern Texas, USA. Int. J. Environ. Res. Public Health 2016, 13, 378. https://0-doi-org.brum.beds.ac.uk/10.3390/ijerph13040378
Gorai AK, Tchounwou PB, Tuluri F. Association between Ambient Air Pollution and Asthma Prevalence in Different Population Groups Residing in Eastern Texas, USA. International Journal of Environmental Research and Public Health. 2016; 13(4):378. https://0-doi-org.brum.beds.ac.uk/10.3390/ijerph13040378
Chicago/Turabian StyleGorai, Amit Kr., Paul B. Tchounwou, and Francis Tuluri. 2016. "Association between Ambient Air Pollution and Asthma Prevalence in Different Population Groups Residing in Eastern Texas, USA" International Journal of Environmental Research and Public Health 13, no. 4: 378. https://0-doi-org.brum.beds.ac.uk/10.3390/ijerph13040378