Article

High Vaccination Coverage among Children during Influenza A(H1N1)pdm09 as a Potential Factor of Herd Immunity

1
Department of Epidemiology, Infectious Disease Control and Prevention, Institute of Biomedical and Health Sciences, Hiroshima University, Hiroshima 734-8551, Japan
2
Hiroshima City Funairi Citizens Hospital, Hiroshima 730-0844, Japan
3
Department of Infectious Diseases, Hiroshima University Hospital, Hiroshima 734-8551, Japan
4
Hiroshima Prefectural Center for Disease Control and Prevention, Hiroshima 734-0007, Japan
*
Author to whom correspondence should be addressed.
Int. J. Environ. Res. Public Health 2016, 13(10), 1017; https://0-doi-org.brum.beds.ac.uk/10.3390/ijerph13101017
Submission received: 13 July 2016 / Revised: 5 October 2016 / Accepted: 6 October 2016 / Published: 17 October 2016

Abstract

:
The objective of this study was to identify factors related to the expansion of infection and prevention of influenza A(H1N1)pdm09. A retrospective non-randomized cohort study (from June 2009 to May 2010) on influenza A(H1N1)pdm09 was conducted in a sample of residents from Hiroshima Prefecture, Japan. The cumulative incidence of the influenza A(H1N1)pdm09 and the pandemic vaccine effectiveness (VE) were estimated. The response rate was 53.5% (178,669/333,892). Overall, the odds ratio of non-vaccinated group to vaccinated group for cumulative incidence of influenza A(H1N1)pdm09 was 2.18 (95% confidence interval (CI): 2.13–2.23) and the VE was 43.9% (CI: 42.8–44.9). The expansion of infection, indicating the power of transmission from infected person to susceptible person, was high in the 7–15 years age groups in each area. In conclusion, results from this survey suggested that schoolchildren-based vaccination rate participates in determining the level of herd immunity to influenza and children might be the drivers of influenza transmission. For future pandemic preparedness, vaccination of schoolchildren may help to prevent disease transmission during influenza outbreak.

1. Introduction

In the 20th century, there were three influenza pandemics: the 1918–1919 Spanish flu (A/H1N1), the 1957–1958 Asian flu (A/H2N2), and the 1968–1969 Hong Kong flu (A/H3N2) [1]. In the early 21st century, influenza A(H1N1)pdm09 began in Mexico and the USA in April 2009 and rapidly spread globally. In Japan, the first case of H1N1 infection was confirmed in May 2009, after which the disease spread quickly across the nation. Between May 2009 and August 2010, influenza A(H1N1)pdm09 affected approximately 21 million people and caused 203 deaths among 127 million people in the country [2]. Under abnormal situations such as the 2009 influenza pandemic, it would be beneficial to identify the route of infection, analyze pandemic dynamics and build a vaccination strategy to safeguard against the pandemic. Avoiding infection has an impact on medical and economic burden [3]. Influenza vaccine effectiveness is not always evident [4,5]. Herd immunity refers to the resistance of a community against a given disease to which a large proportion of individual in the community are immune [6]. Nearly 80% to 90% immune population are required to establish herd immunity against influenza viruses [7]. Japan experienced low excess mortality from influenza when the country adopted the strategy to administer seasonal influenza vaccines to schoolchildren in the 1970s and 1980s, but excess mortality increased in the 1990s, when group vaccinations were halted [8,9,10]. The Japanese government started the administration of the pandemic monovalent vaccine in November 2009 in a priority phased manner to effectively address the 2009 pandemic influenza. The priority was given to pregnant women and patients with diseases that could be aggravated by influenza A(H1N1)pdm09 [11]. To provide information for planning preventative measures against influenza infection, it is crucial to evaluate pandemic influenza transmission among humans. However, there are a few studies that have addressed the relationship between pandemic dynamics and preventative action including vaccine [12] and hand hygiene [13,14].
In an effort to identify factors related to the prevention of H1N1 influenza infection in Hiroshima Prefecture, we analyzed existing data from a survey (n = 176,113) on the 2009 pandemic H1N1 influenza infection carried out by the Regional Health Care Council of Hiroshima Prefecture. We considered strategies against the pandemic, the vaccine effectiveness (VE), and the associations between herd immunity and cumulative incidence. We also estimated the expansion of H1N1 influenza infection using a mathematical model, and considered the factors that affect the dynamics of a pandemic using survey skills.

2. Materials and Methods

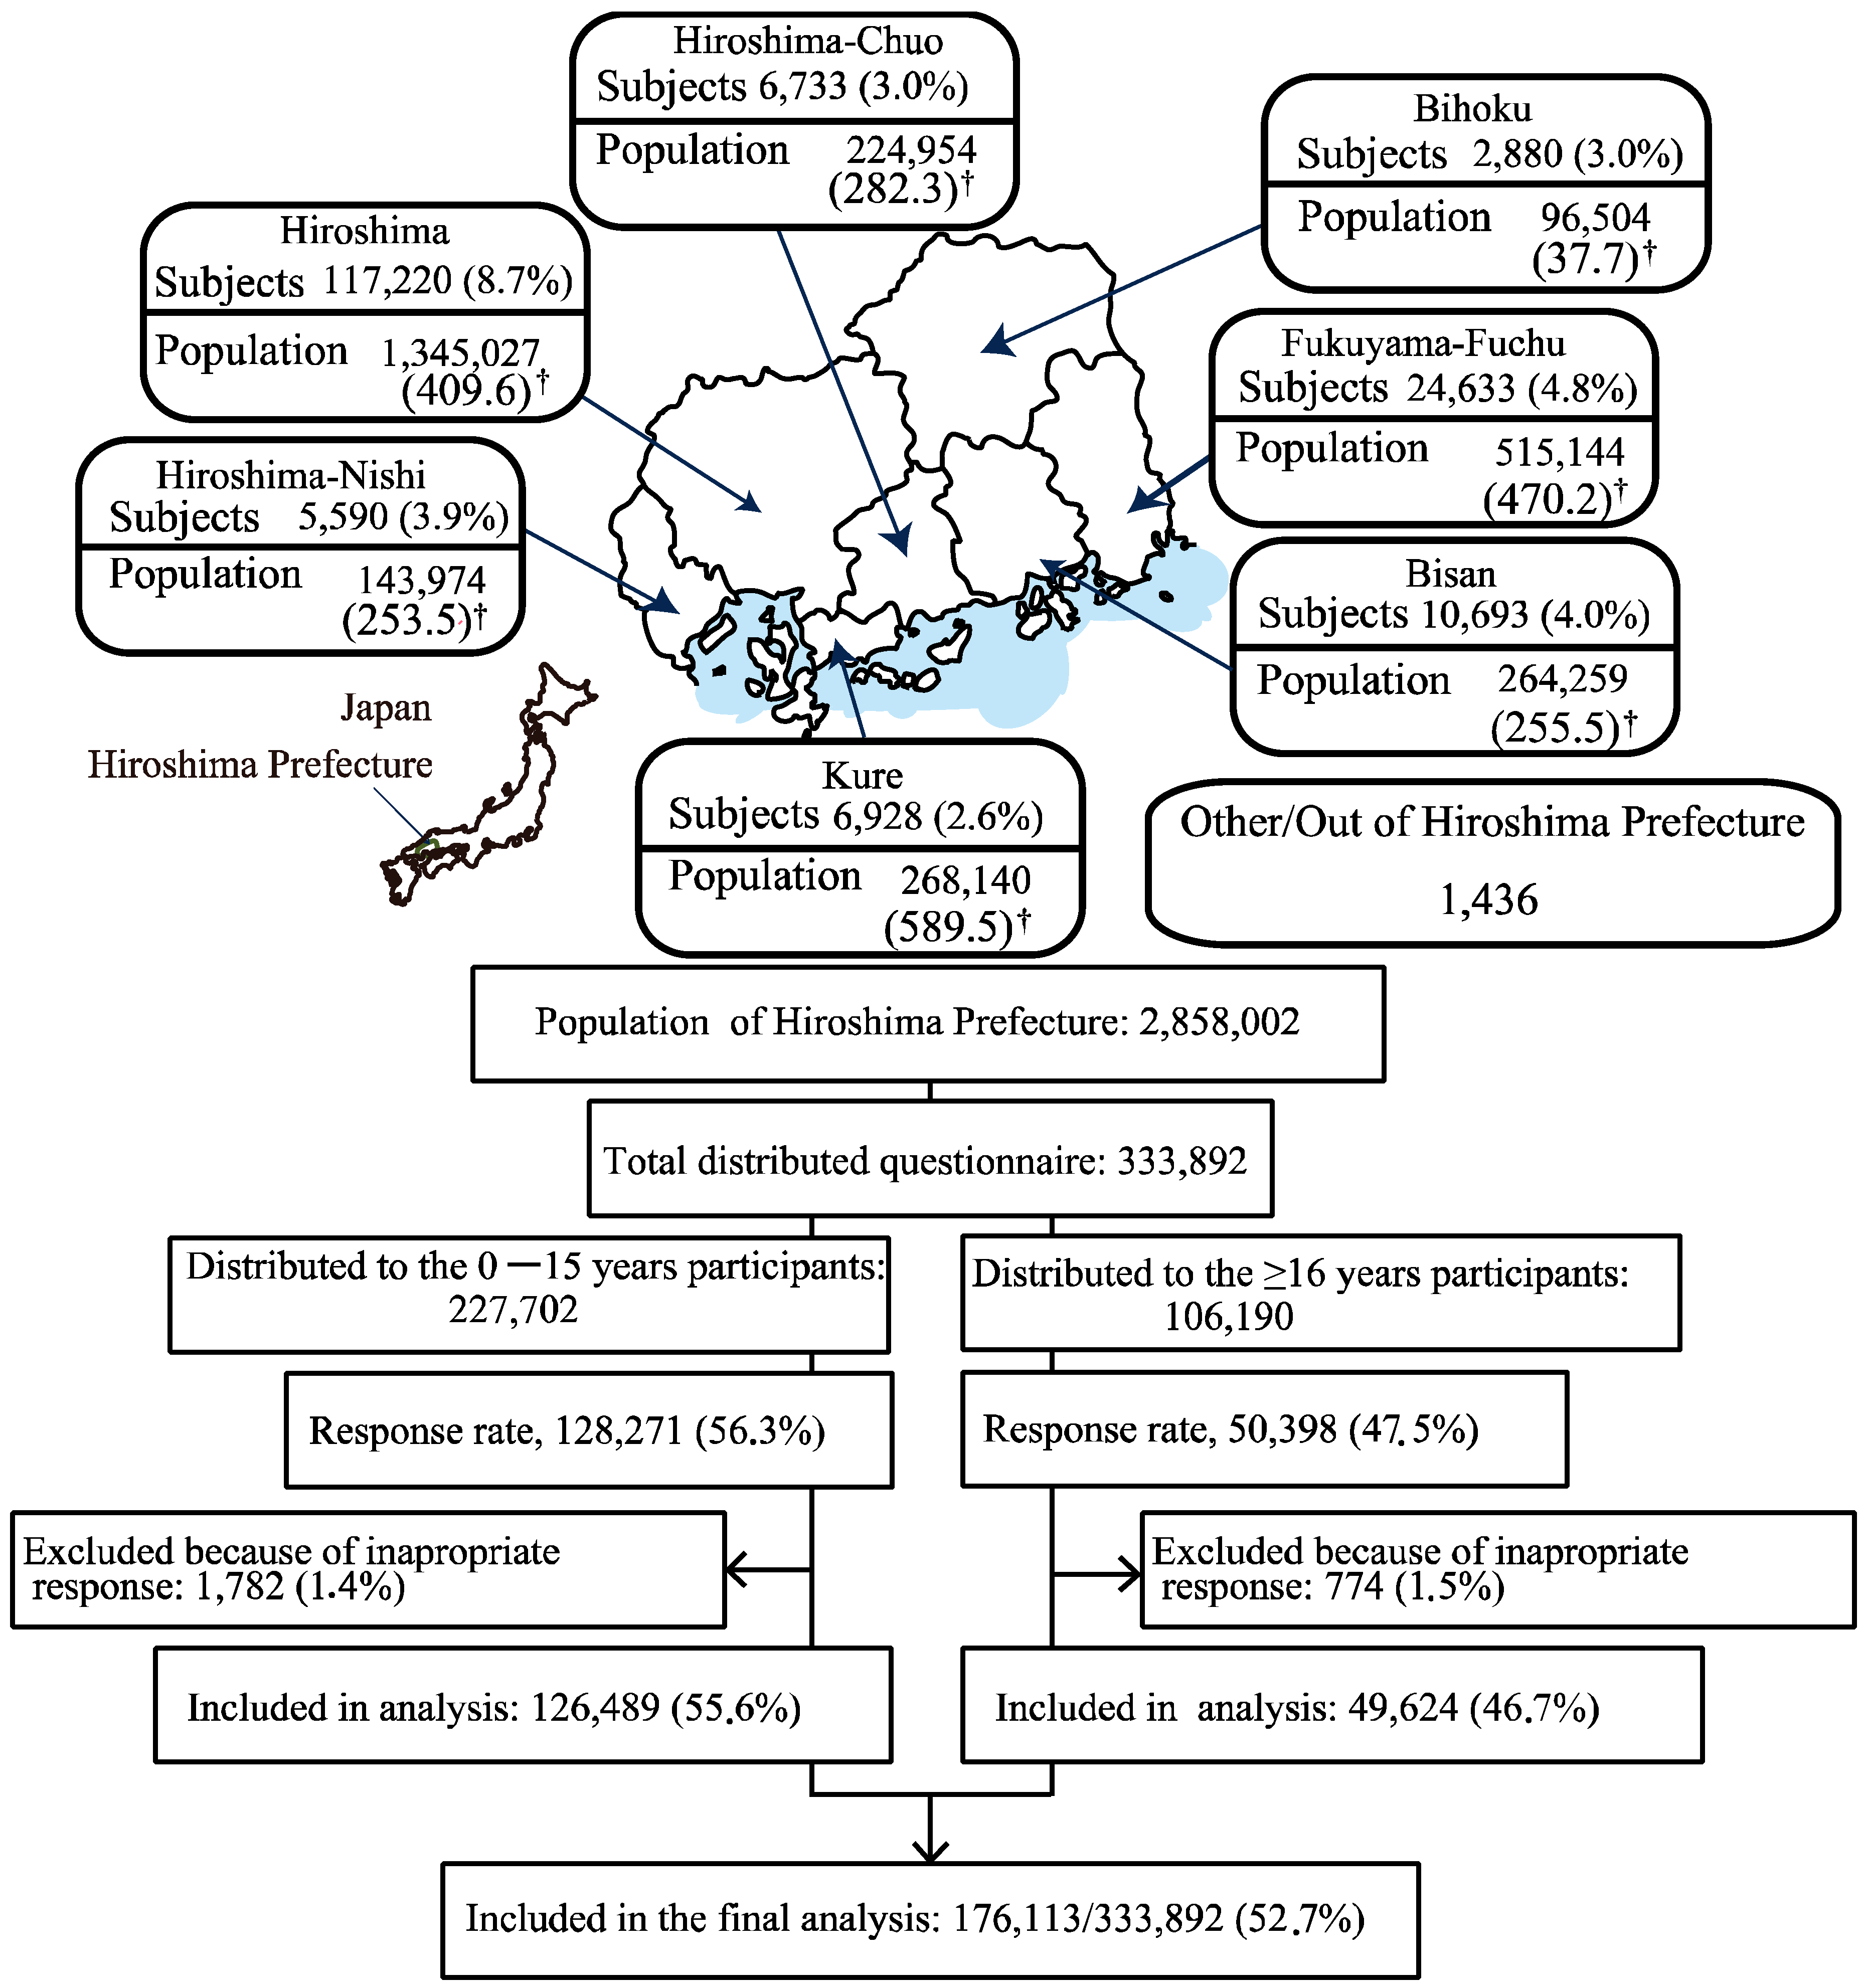
2.1. Study Design and Participants

To identify potential factors of herd immunity during influenza A(H1N1)pdm09, between July and October 2010, the Regional Health Care Council of Hiroshima Prefecture carried out a retrospective non-randomized cohort study (from June 2009 to May 2010) on the 2009 H1N1 influenza infection among 176,113 individuals (82,738 males, and 93,375 females). The survey included schoolchildren (belonging to kindergartens, primary schools, middle schools, and high schools), community residents and workers from factories/companies. The survey took place in Hiroshima Prefecture located in the Western region of Japan. In March 2009, the prefecture of Hiroshima was inhabited by 2,858,002 people [15] and consisted of seven medical areas (Figure 1, Table 1).
All individuals who lived or worked in Hiroshima Prefecture were considered as potential participants. They were contacted through their supervisors (workers in factories), medical doctors (elderly), and parents/guardians (children); invitation letters containing a brief explanation of the survey were mailed to all the supervisors. Those interested in the survey attended a briefing meeting held at a local community center. Participation was on a voluntary basis and being present in Hiroshima Prefecture during the survey was the inclusion criteria. Living outside of Hiroshima Prefecture was the exclusion criteria except for logistic regression analysis.

2.2. Questionnaires

Participants were asked to fill out an anonymous, self-administered questionnaire on paper, with younger participants (0–15 years) being helped by their parents or legal guardians.
We used two similar questionnaires (originally written in Japanese language; Supplementary File), one for participants aged 0–15 years and another one for those over 16 years. The two questionnaires were designed by the Regional Health Care Council of Hiroshima Prefecture and consisted of fourteen items each (open and multiple-choice answers) divided into two parts. The first part included three items for recording participants’ characteristics such as living area, age or age group and gender. The second part specifically addressed beliefs and information sources related to the 2009 influenza outbreak and the experience of infection with influenza A(H1N1)pdm09. The following eight questions provide a generic explanation of the content of the eleven items used in the second part of each questionnaire:
  • What was the most helpful information about influenza A(H1N1)pdm09?
  • Have you/your child had influenza A(H1N1)pdm09 infection?
  • Did a doctor confirm your influenza A(H1N1)pdm09 infection between June 2009 to May 2010? Which month was it?
  • How many people are living together in your family?
  • Which preventative action did you take against influenza A(H1N1)pdm09?
  • Have you/your child been vaccinated against influenza A(H1N1)pdm09?
  • What is the reason for being vaccinated?
  • What is the reason for not being vaccinated?
For feasibility purposes, the participants were divided into two groups: 0–15 years and 16 years or above. However, in the analysis, more than two age-specific groups were used. Positive case of influenza A(H1N1)pdm09 was defined as any positive answer to the following question: “Did a doctor confirm your influenza A(H1N1)pdm09 infection?”

2.3. Statistical Analysis

We calculated period prevalence per month (from June 2009 to May 2010), vaccination rates, overall cumulative incidence, cumulative incidence by vaccine status and odds ratio (OR), VE, and expansion of infection. In addition, we used logistic regression models to clarify the relationship between these estimated indicators and preventative measures.

2.3.1. Period Prevalence by Month (June 2009 to May 2010)

To estimate period prevalence, the number of participants affected per month was stratified by gender, medical administration area and age group (0; 1–3; 4–6; 7–9; 10–12; 13–15; 16–19; 20–29; 30–39; 40–49; 50–59; 60–69; 70–79; and ≥80 years).

2.3.2. Vaccination rates (from November 2009 to May 2010)

Vaccination rate was obtained using:
Vaccination   rate   =   Number   of   participants   vaccinated ( Number   of   participants )     ( Number   of   participants   infected   up   to   October   2009 ) ×   100

2.3.3. Overall Cumulative Incidence (from November 2009 to May 2010)

Overall cumulative influenza incidence was estimated using the following formula:
Overall   cumulative   incidence   =   Number   of   infected   participants   from   November   2009   to   May   2010 Number   of   participants   ×   100

2.3.4. Cumulative Incidence by Vaccine Status and Odds Ratio (November 2009 to May 2010)

Participants who were infected with influenza A(H1N1)pdm09 before implementation of influenza A(H1N1)pdm09 mass vaccination were excluded (because the vaccination campaign was launched in November 2009 [11]). We further excluded those with missing vaccination data. They were placed into one of the twelve age groups (0; 1–3; 4–6; 7–9; 10–12; 13–15; 16–19; 20–29; 30–39; 40–49; 50–59; and ≥60 years). The following formulae were used:
Cumulative   incidence   for   vaccinated   group   =   Number   of   infected   participants   in   vaccinated   group   from   November   2009   to   May   2010 Number   of   vaccinated   participants     ×   100
Odds ratios of non-vaccinated group to vaccinated group for cumulative incidence of influenza A(H1N1)pdm09 were estimated using:
OR   for   cumulative   incidence   =   ( Number   of   infected   participants   in   non - vaccinated   group ) ( Number   of   non - infected   participants   in   non - vaccinated   group ) ( Number of infected participants in vaccinated group ) ( Number of non - infected participants in vaccinated group )
Furthermore, differences in ORs stratified by medical administration area, age group, and gender were examined using the Breslow-Day test.

2.3.5. Vaccine Effectiveness (from November 2009 to May 2010)

We estimated VE as follows:
VE   =   ( Cumulative   incidence   of   non - vaccinated   group )     ( Cumulative   incidence   of   vaccinated   group )   ( Cumulative   incidence   of   non - vaccinated   group )

2.3.6. Correlation between Vaccination Rates and Cumulative Incidence

In order to assess the impact of age-specific vaccination program on herd immunity, we explored the correlation between age-specific vaccination rates and cumulative incidence for the overall area. In other words, we confirmed the age group that should be vaccinated to reduce cumulative incidence in the area.

2.3.7. Logistic Regression Analysis for Preventing Infection

Logistic regression analysis was performed with the infection with influenza A(H1N1)pdm09 as the objective variable for all participants and subgroups (participants aged 0–15 years, and those aged ≥16 years). Gender, age group, medical administration area, source of helpful information related to the influenza A(H1N1)pdm09 outbreak, and preventative measures against influenza were the explanatory variables. The baseline group was defined as gender “female”, medical administration area “Hiroshima”, age group “4–6 years” (for all participants and those aged 0–15 years) or “30–39 years” (for participants ≥16 years), “no information was helpful”, and “did not pay attention to anything”.

2.3.8. Expansion of Infection

We defined expansion of infection as a probability of infection in sensitive persons when they had contact with infected persons. Participants who did not provide valid responses on the gender, age and medical administration area were excluded. Therefore, a total of 175,345 responses were available to estimate the expansion of infection. Multi-type epidemic model was used to determine the expansion of infection per group [16]. The groups were stratified by gender, age group, and medical administration area. Parameters of the model were estimated using the maximum likelihood method.
Furthermore, multiple linear regression analysis was used to assess the relationship between the expansion of infection and the studied parameters. This model included the following explanatory variables: medical administration area, age groups, gender, household size, and preventive measures (vaccination, thorough gargling/hand hygiene, use of a mask, cough etiquette, avoidance of being in crowds, and getting plenty of rest). The 4–6 year group was considered as the baseline age group, and Hiroshima was considered as the baseline medical administration area.
The significant level was set as p < 0.05. JMP version 9 (SAS Institute Inc., Cary, NC, USA) was used for analyses.

2.4. Ethics Approval and Consent to Participate

This study was approved by the ethics committee for epidemiological research at Hiroshima University (epidemiology No. 411). Specifically, the informed consent for the survey was also included in the application form to the ethics committee. Participants who submitted the questionnaire were considered to be in agreement with it. After submitting the questionnaire, participants could not opt out because the survey was performed anonymously.

3. Results

3.1. Participants’ Characteristics

A total of 333,892 questionnaires were distributed, and responses were received from 178,669 participants (response rate, 53.5%). There were 1.4% surveys (2556/178,669) excluded from analysis because of missing data. Therefore, the final sample included 176,113 (98.6%) participants. This is equivalent to 6.2% of the population of Hiroshima Prefecture [15].
The majority (71.8%) of the participants were aged 0–15 years. Comparatively, there were relatively more females (n = 93,375; 53.0%) than males (n = 82,738; 47.0%).

3.2. Vaccination Rates

As presented in Table 2, the overall vaccination rate against influenza A(H1N1)pdm09 was 36.5%. There were significant differences in vaccination rates regarding gender, age, and area. As for age-specific vaccination rates, participants aged ≥70 years and those aged 1–6 years were found with higher rates as compared with other age groups.

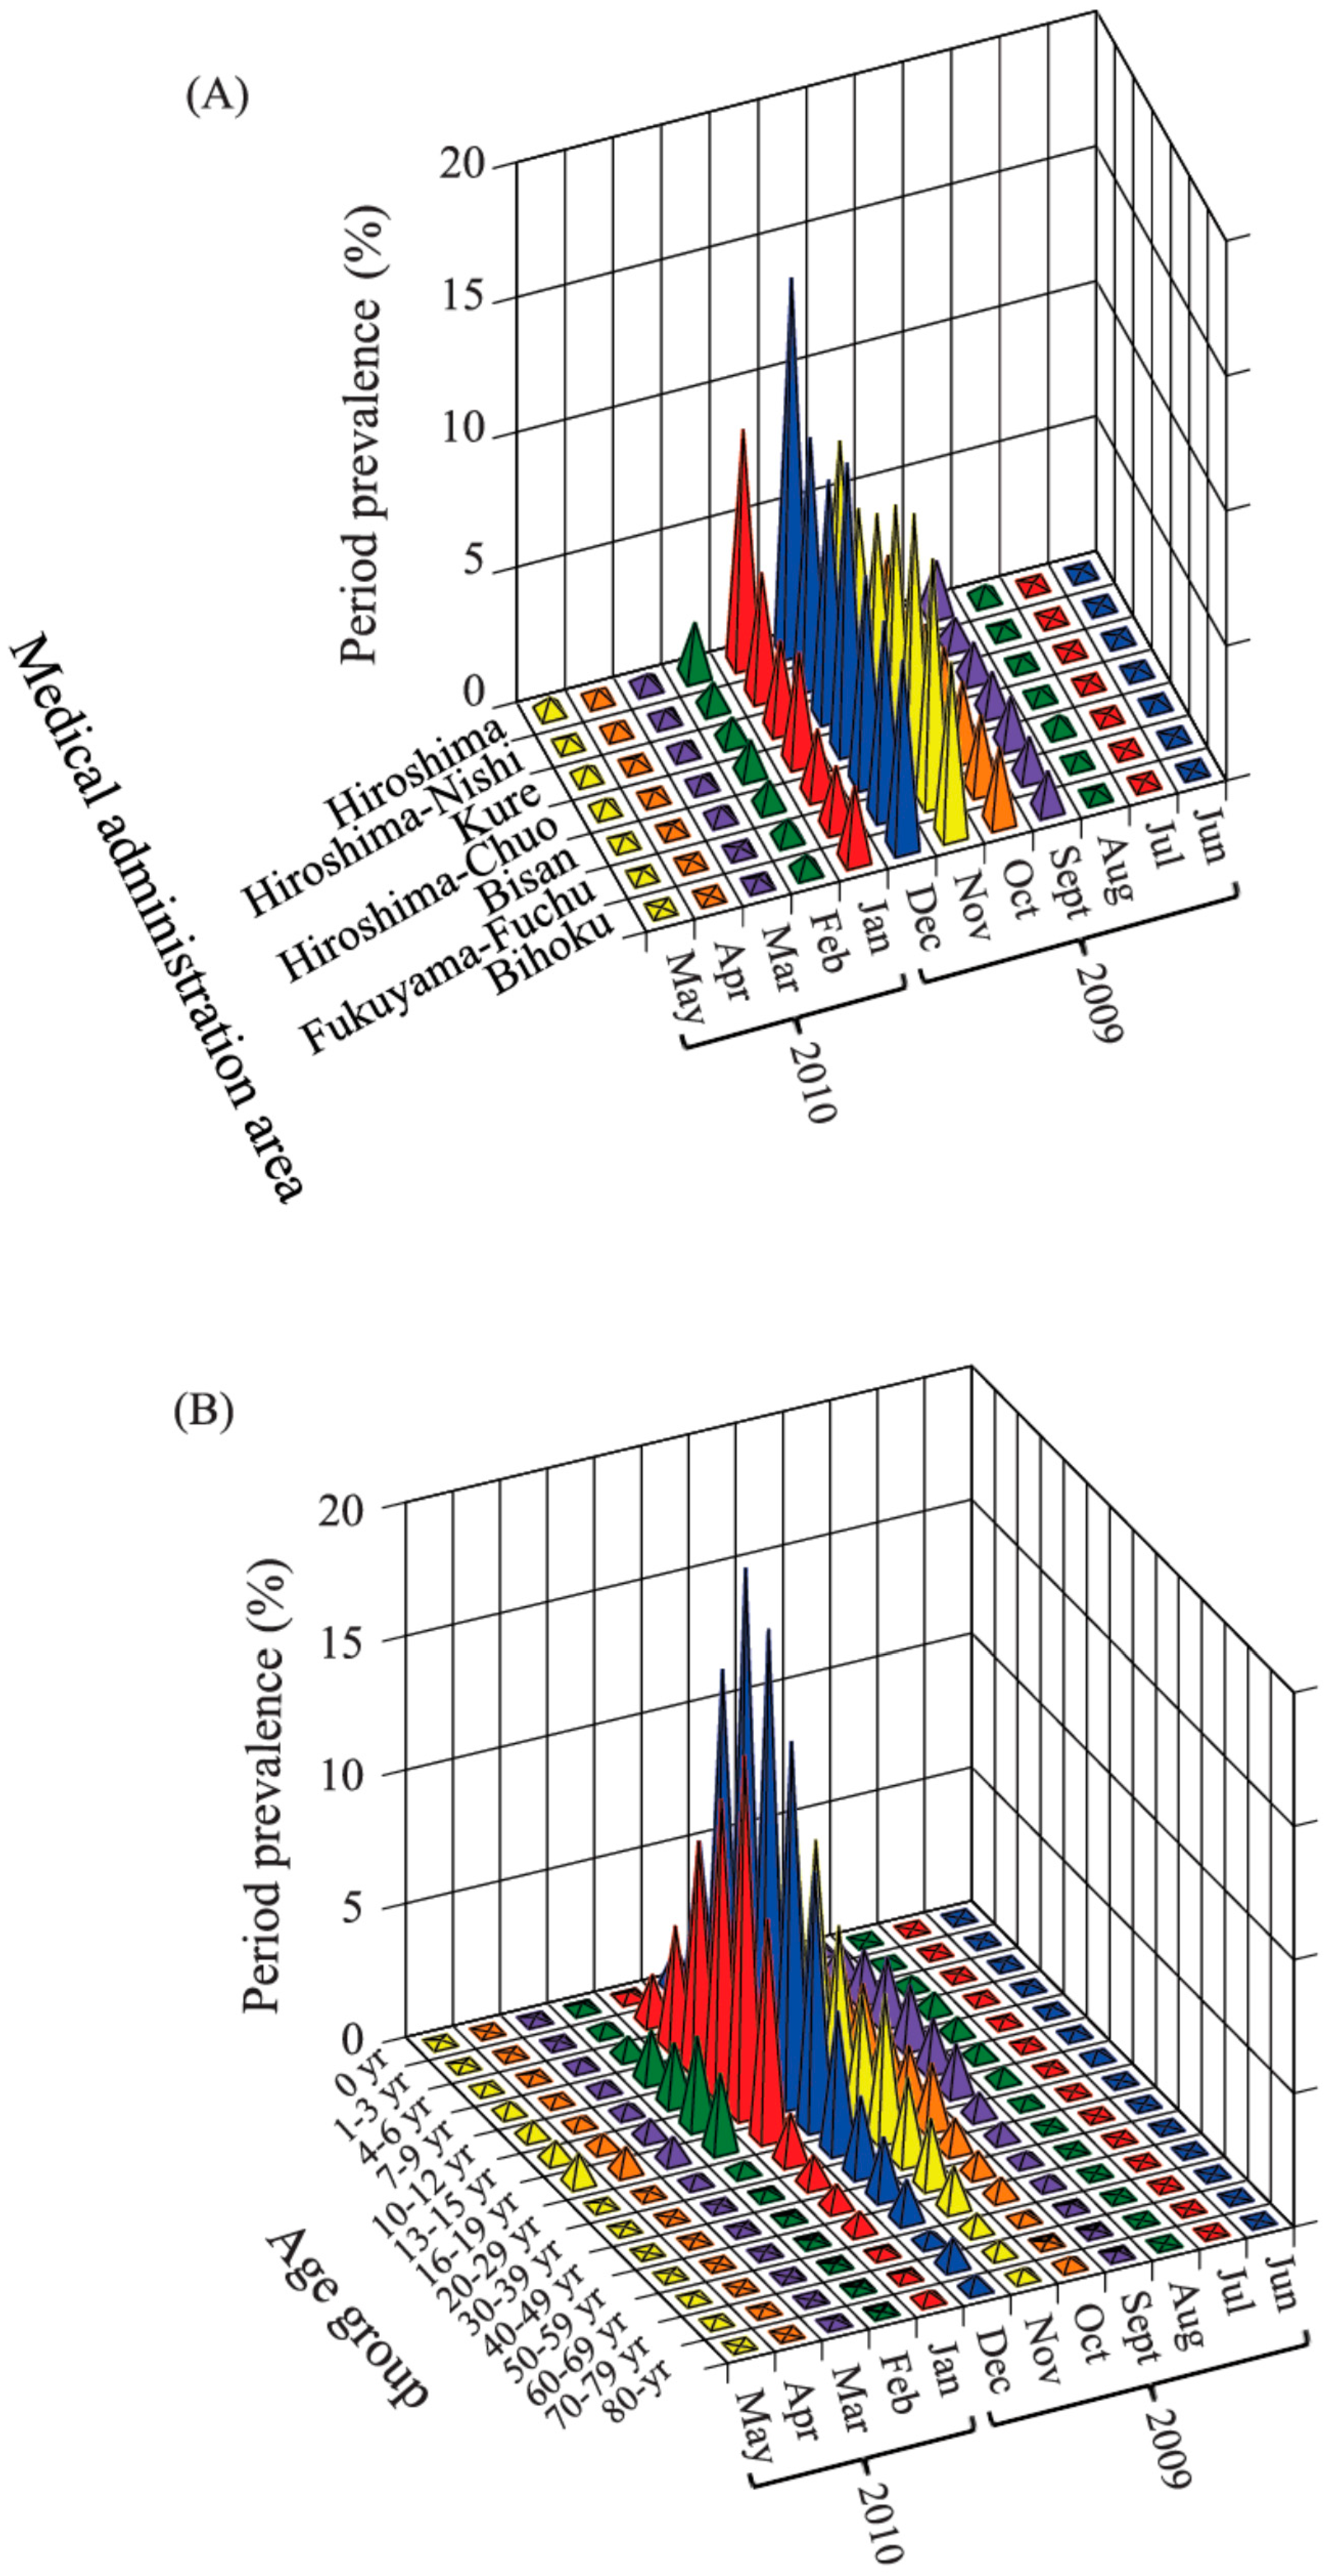
3.3. Period Prevalence

From June 2009 to May 2010, the period prevalence peaked in November in the Hiroshima-Nishi, Hiroshima, Kure, Hiroshima-Chuo, and Bihoku medical administration areas (from 6.9% to 13.8%), with Hiroshima (13.8%) and Hiroshima-Chuo (10.6%) displaying particularly high values. However, it peaked in December in Bisan and Fukuyama-Fuchu, and then decreased rapidly in January in all medical administration areas (Figure 2).
Age-specific period prevalence of participants aged 4–19 years and ≥70 peaked in November (from 0.5% to 13.6%), and that of those aged 1–3 years and 20–69 years peaked in December (from 0.7% to 7.2%). The period prevalence for both males (10,429/82,738; 12.6%) and females (10,251/93,375; 11.0%) peaked in November.

3.4. Overall Cumulative Incidence of Influenza, OR of Cumulative Incidence and VE Based on Vaccination Status

A total of 169,105 responses were available to estimate Influenza vaccine effectiveness and its cumulative incidence, 122,529 for the participants aged 0–15 years, and 46,576 for those aged 16 and over. As shown in Table 3, cumulative influenza incidence was significantly lower in the vaccinated group (18.9%) as compared with the non-vaccinated group (33.7%), with an OR of non-vaccinated group to vaccinated group for cumulative incidence of influenza A(H1N1)pdm09 and VE of 2.18 (95% CI: 2.13–2.23; p < 0.001) and 43.9% (95% CI: 42.8–44.9; p < 0.001), respectively. In the 1–3 years and 4–6 years groups, the ORs for cumulative incidences were 3.52 (95% CI: 3.25–3.81; p < 0.001) and 3.40 (95% CI: 3.25–3.56; p < 0.001), respectively. VE was 64.2% (95% CI: 61.6–66.6; p < 0.001) and 55.8% (95% CI: 54.3–57.2; p < 0.001) for the two groups, respectively. Compared to other age groups, these groups exhibited strong associations between vaccination and cumulative incidence. However, there was almost no association between vaccination and cumulative incidence in the 16–19 years age group (OR of cumulative incidence, 1.02; 95% CI: 0.95–1.10; p = 0.5214). In the 0-year groups, cumulative incidence was higher in the vaccinated groups compared to the non-vaccinated ones (OR, 0.35; 95% CI: 0.17–0.71; p = 0.0038). OR for cumulative incidence was from 1.59 to 2.68 (all p < 0.001) and VE was 28.0%–60.2% in the groups from 7–9 years to 50–59 years, except for 16–19 years.
In all medical administration areas, cumulative incidence was significantly higher in the non-vaccinated groups than in the vaccinated groups (p < 0.001). ORs in all the areas were ≥1.9.

3.5. Correlation between Cumulative Incidence and Vaccination Rate

Table 4 shows the correlation coefficients of area-specific vaccination rates of every age group and the area-specific overall cumulative incidence.
Our results indicate that medical administration areas with high vaccination rates for the 4–6 years and 10–12 years groups had significantly lower overall cumulative incidence. Correlation coefficients were −0.81 (p = 0.0266) for the 4–6 years group and −0.83 (p = 0.0212) for the 10–12 years group. However, the above correlation could not be detected in the rest of the groups.

3.6. Factors Associated with Influenza Infection

Table 5 presents the results of the multivariate analyses of the association between infection with influenza and studied parameters. We found that the results related to gender, medical administration area, age group, and helpful information were similar.
Overall, males were more susceptible to infection than females in the 0–15 years (adjusted OR 1.13; p < 0.001).
As for age groups, OR for cumulative incidence was significantly lower in the 0 year and 1–3 years groups as compared to the 4–6 years group (p < 0.001). However, it was significantly higher in the 7–9 years, 10–12 years, and 13–15 years groups (p < 0.001). ORs for cumulative incidence were significantly higher in the 16–19 years and 20–29 years groups compared to the 30–39 years group (p < 0.001). Furthermore, OR of cumulative incidence was significantly lower in the participants aged 40 years or over as compared to that in the 30–39 years group (p < 0.001).
As for medical administration area, Kure (p < 0.001) and Bihoku (p < 0.05) had significantly lower OR for cumulative incidence compared to Hiroshima. Except Hiroshima-Chuo, all medical administration areas had also significantly lower OR than Hiroshima in those aged 16 and over (Bihoku p < 0.05, all others p < 0.001). With the exception of Hiroshima-Chuo, in all the participants, Hiroshima-Nishi, Kure, Bisan, Fukuyama-Fuchu, and Bihoku had a significantly lower OR of cumulative incidence compared to Hiroshima (Hiroshima-Nishi p < 0.05, Bisan and Bihoku p < 0.01, all others p < 0.001).
As for preventative action, participants who were vaccinated had a low OR of cumulative incidence in both the 0–15 years participants (adjusted OR 0.55; p < 0.001) and all the participants (adjusted OR 0.62; p < 0.001). Participants aged 16 and over had a high OR of cumulative incidence (p < 0.001), except those who observed preventive measures such as “gargling and hand hygiene”.

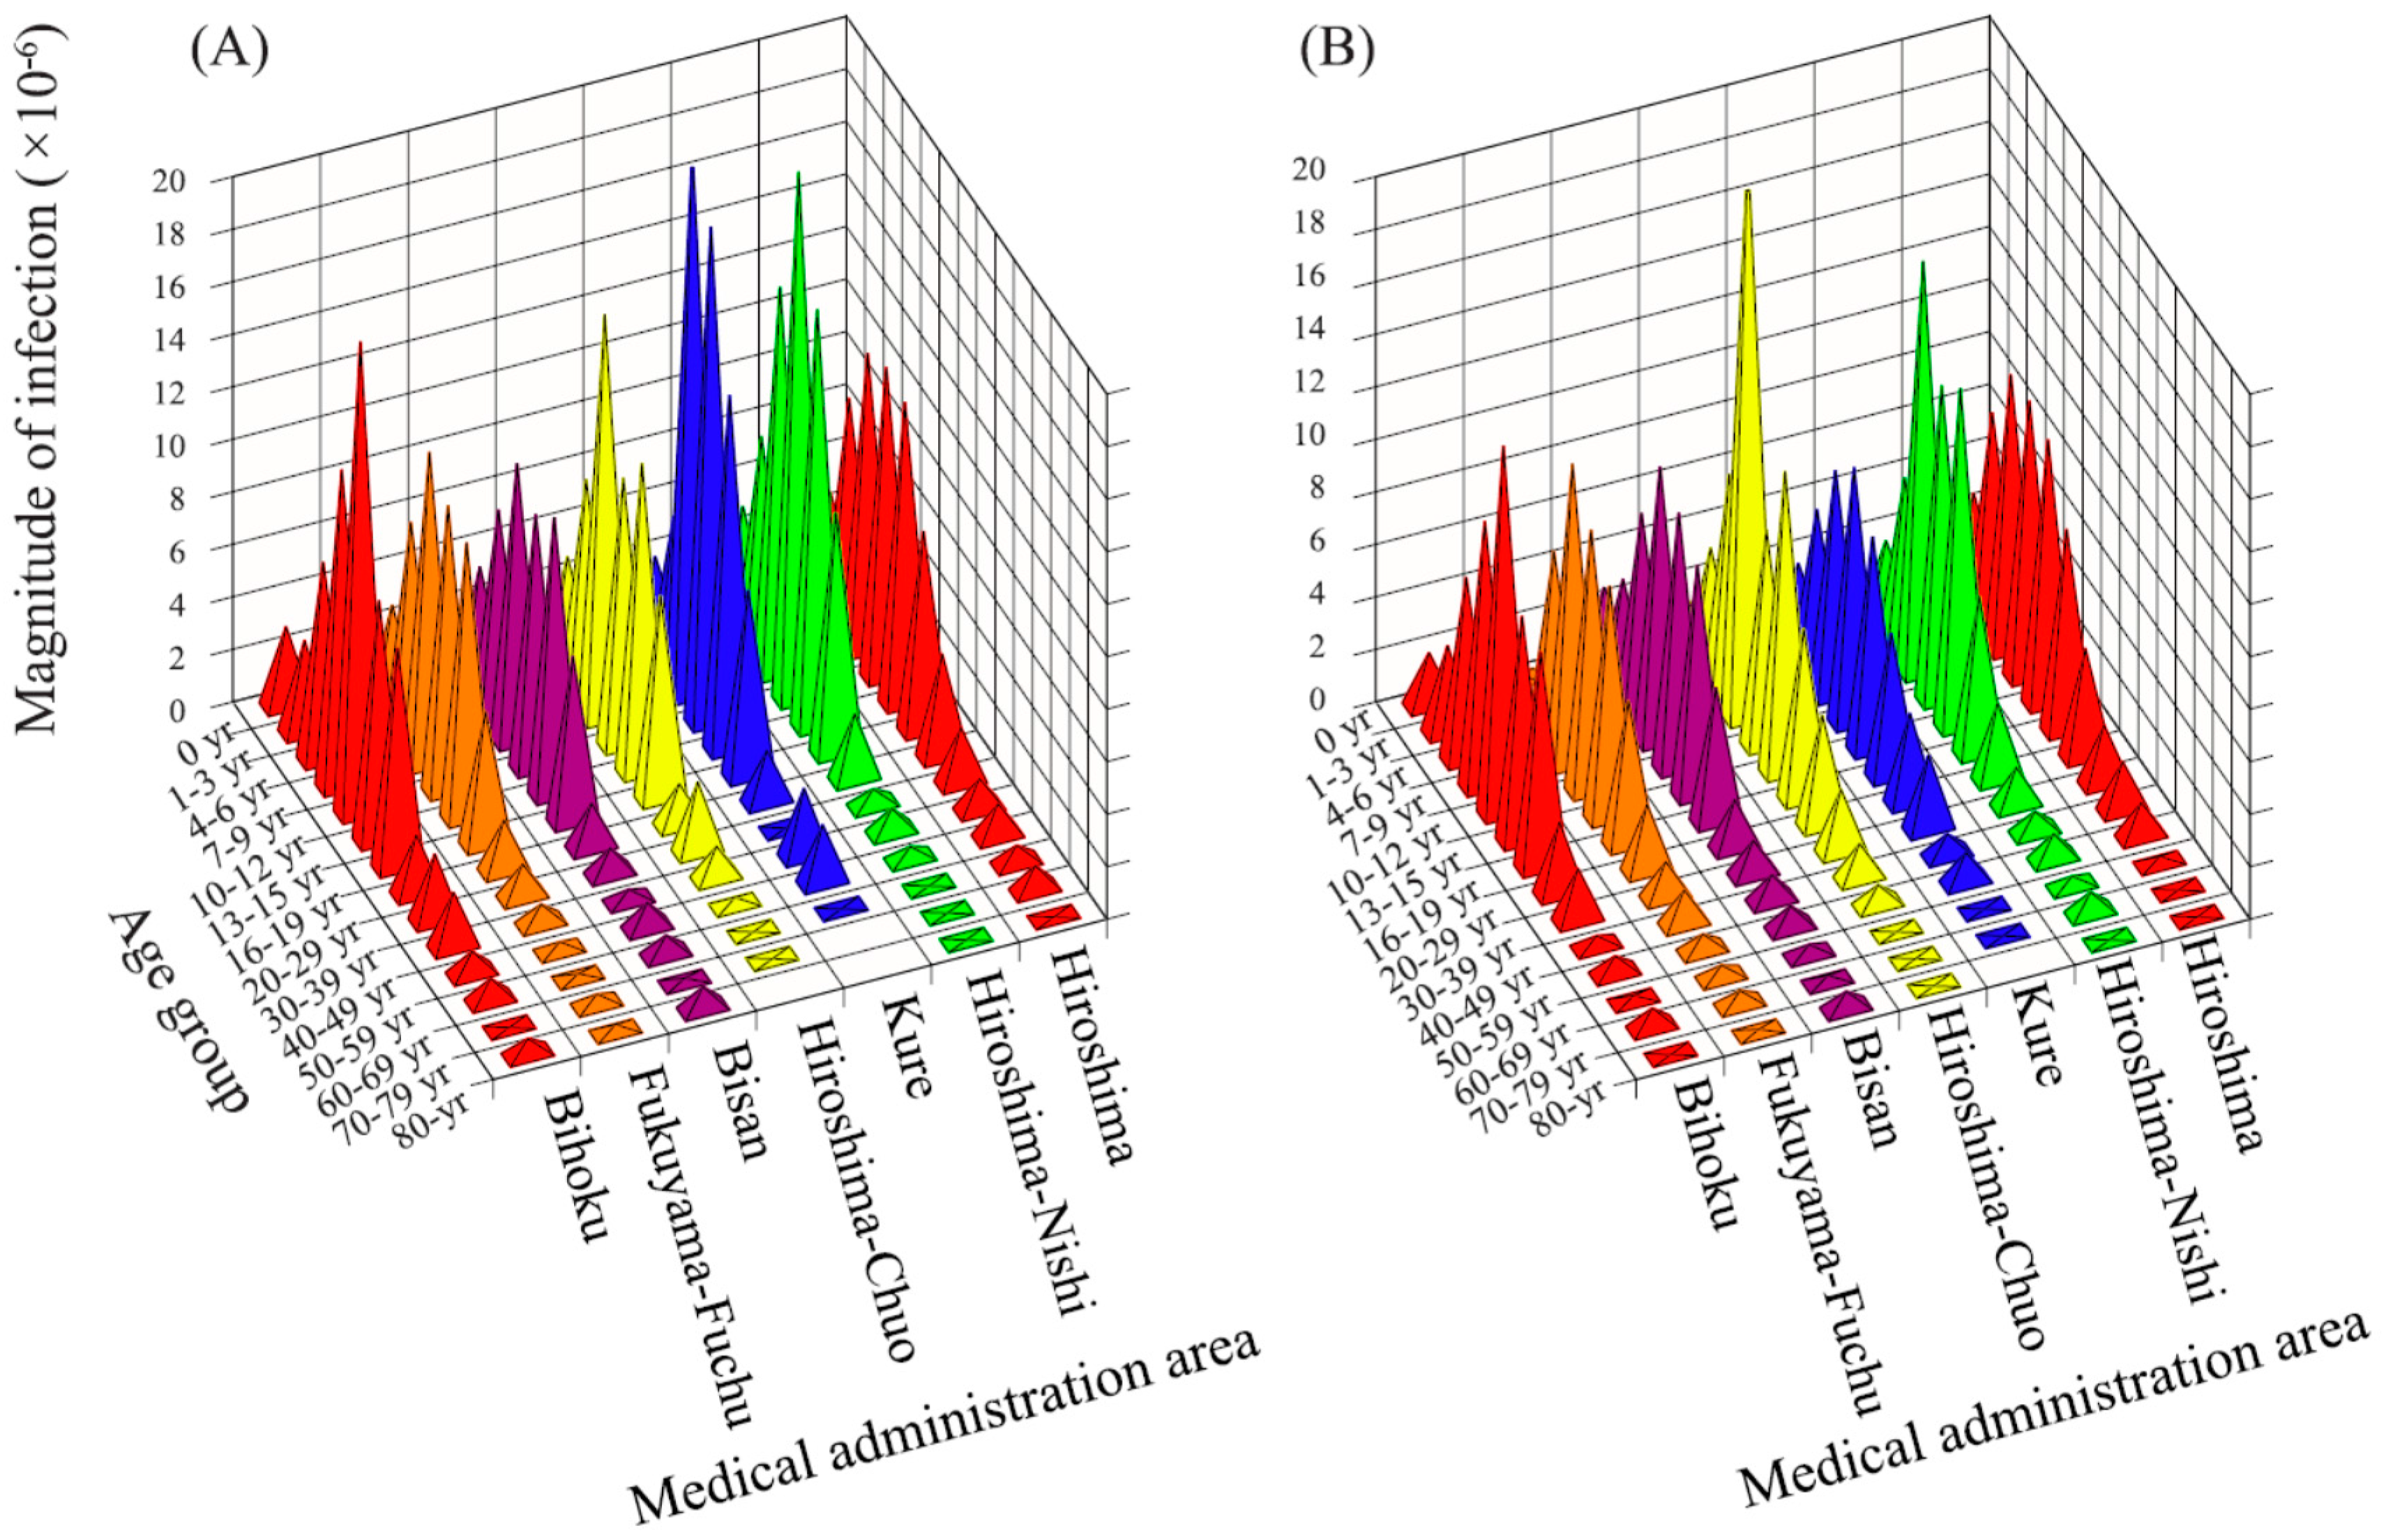
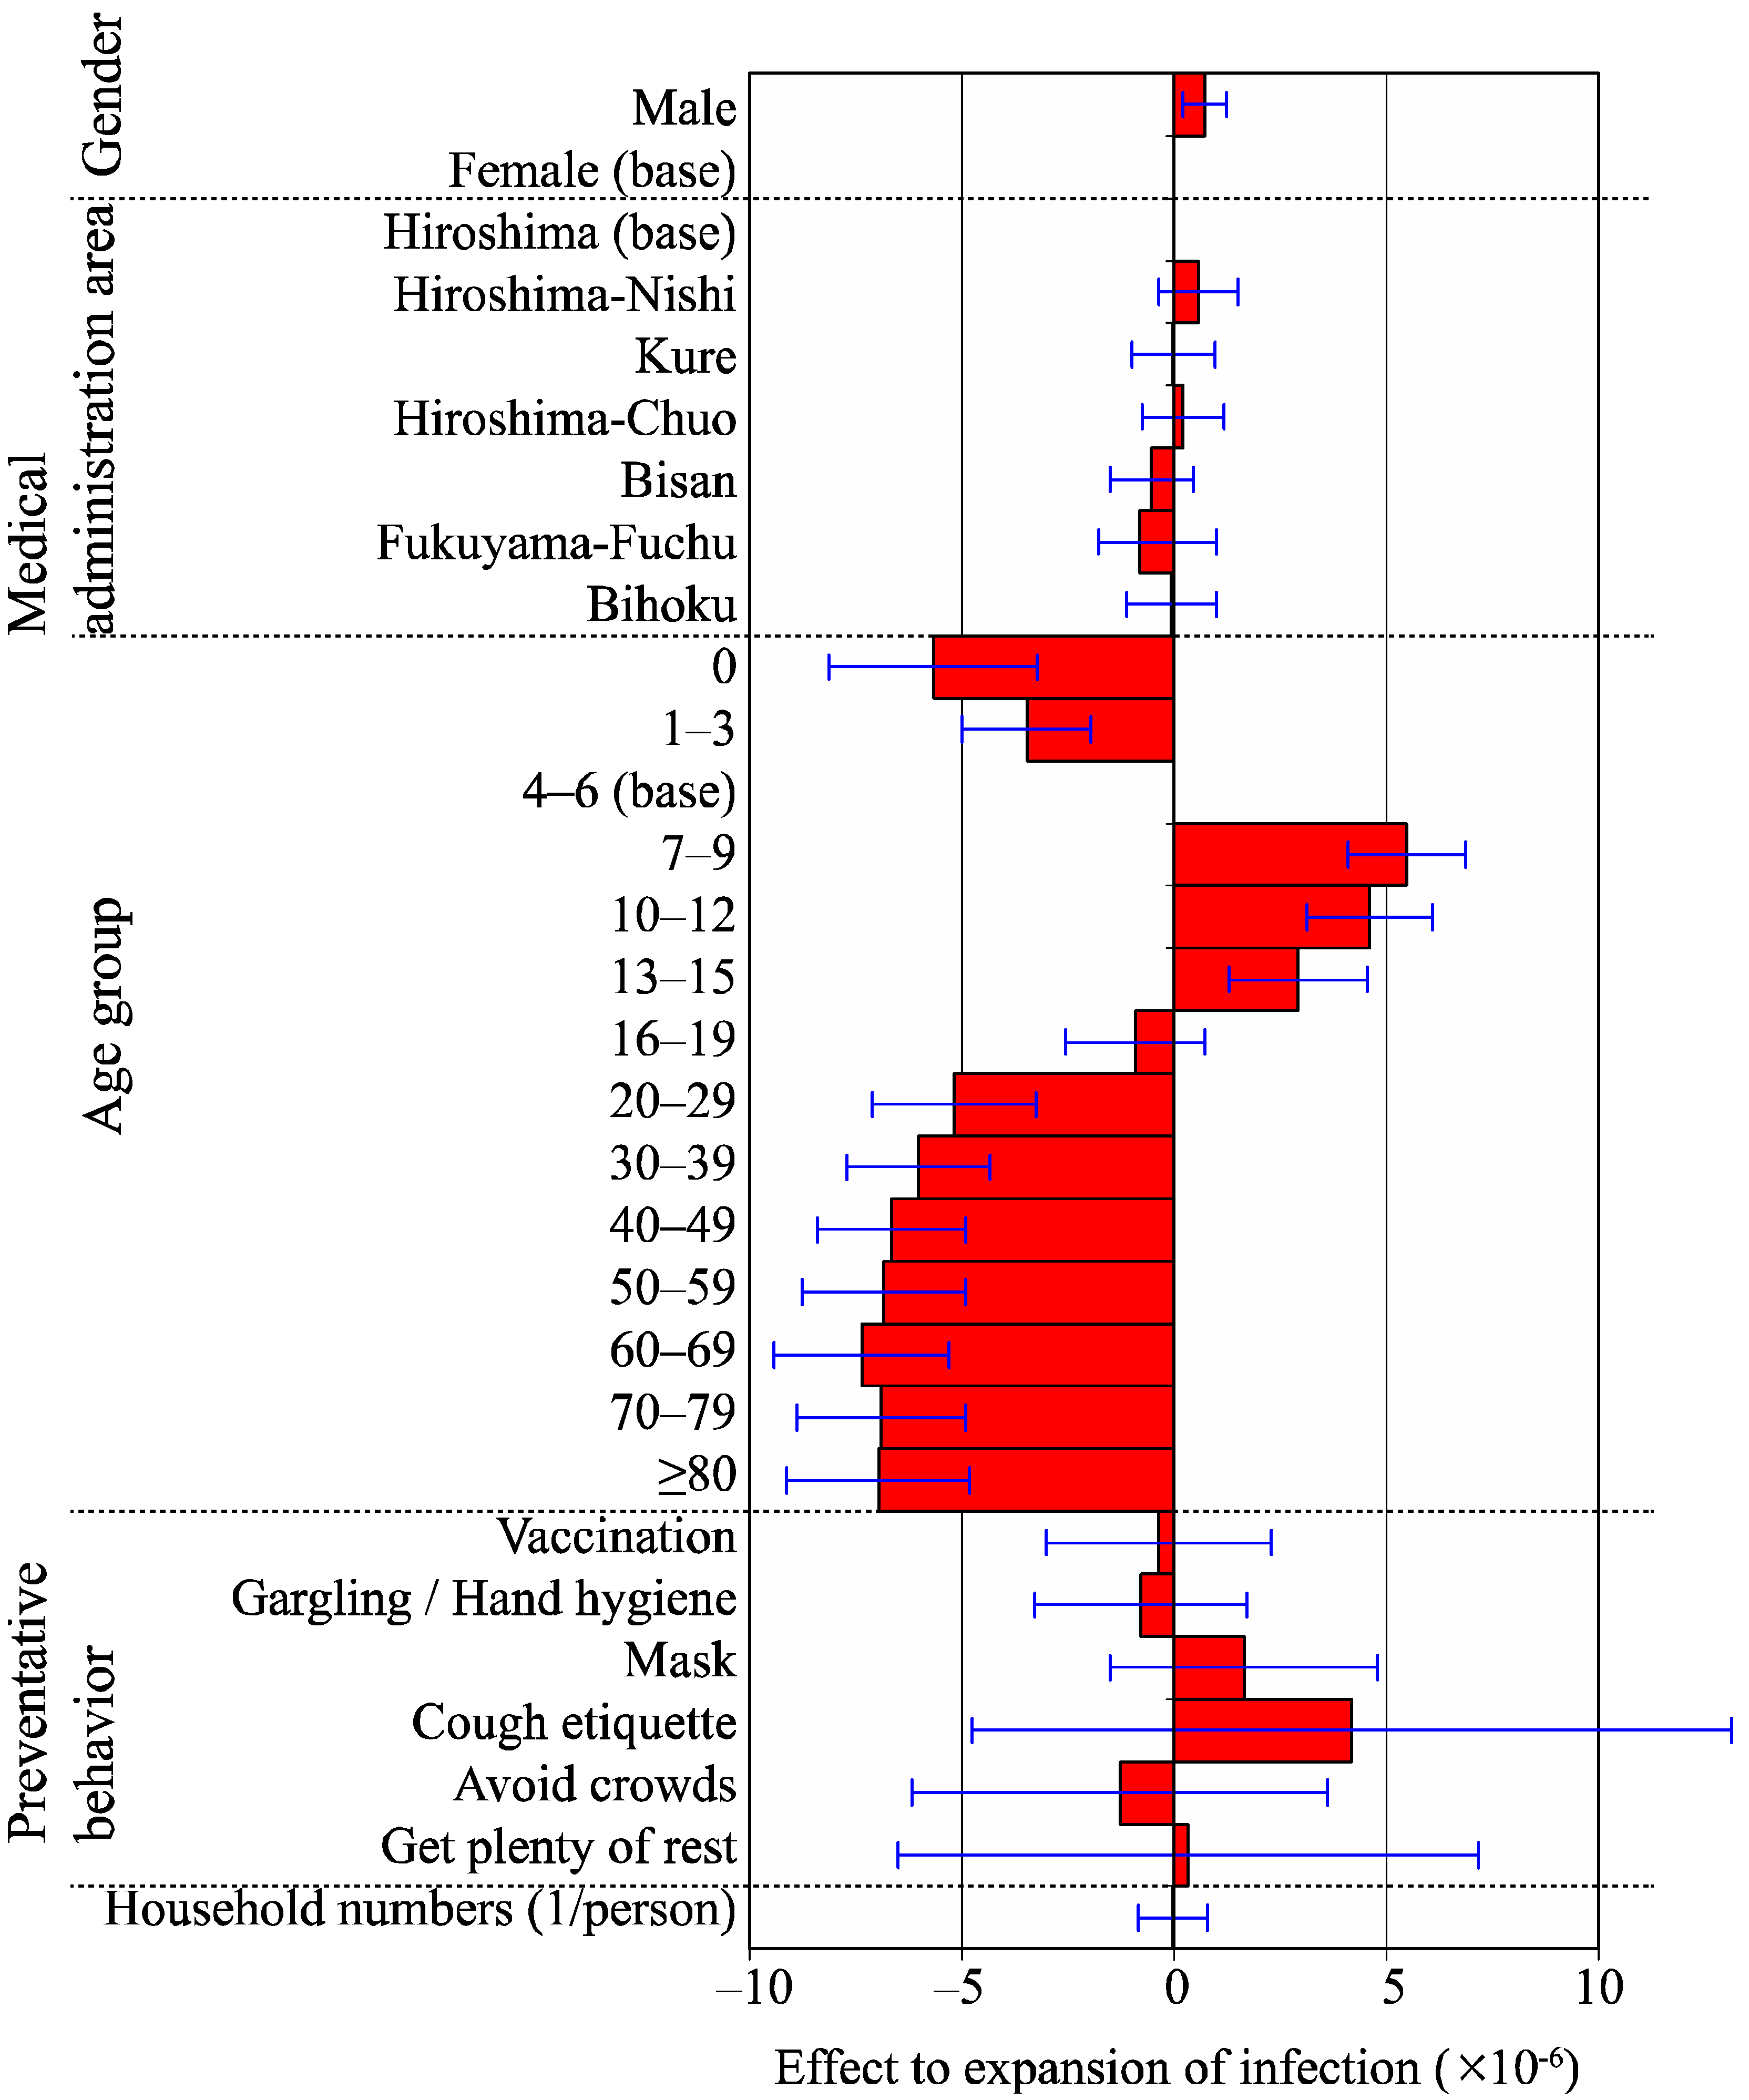
3.7. Expansion of Infection

The expansion of infection per group is shown in Figure 3. The expansion of infection was higher in the 7–9, 10–12, and 13–15 years age groups in every medical administration area and gender.
The results of the multivariate analysis on the association between the expansion of infection and each factor are displayed in Figure 4. The coefficient of determination was 0.85. A significant difference in the expansion of infection was found between genders; being higher in the male group (p < 0.05). The expansion of infection was the highest in the 7–9 years age group, indicating a value that is 5.49 × 10⁻⁶ higher than that in the base group (4–6 years age group). It was followed by the 10–12 years age group and the 13–15 years age group, showing values that were higher by a factor of 4.62 × 10⁻⁶ and 2.92 × 10⁻⁶ than the base group, respectively (p < 0.05 for both).
When the effect of the expansion of the infection factor is positive, the person with the factor has a high tendency of spreading infection. The baseline group was defined as gender “Female”, medical administration area “Hiroshima”, and age group “4–6 years”. The effect of the expansion of the infection of household members correlates to a decrease or increase in the expansion of the infection at an increasing rate of one person per household.

4. Discussion

In this study, we analyzed data from a retrospective non-randomized cohort study on the influenza A(H1N1)pdm09 infection carried out in 176,113 residents of Hiroshima Prefecture. The results show that vaccinations during the influenza A(H1N1)pdm09 effectively reduced the cumulative incidence. In particular, vaccination for children was found to be effective in lowering the overall cumulative incidence in all medical administration areas.
Cumulative incidence was higher in the non-vaccinated groups than in the vaccinated groups in all of the medical administration areas during the pandemic. As for the age groups, the effectiveness of the seasonal H1N1 influenza vaccine among individuals has been previously reported [12,17,18,19,20]. In particular, this study revealed that vaccination had a strong preventative effect in people aged 1–3 years, 4–6 years, 20–29 years, and 30–39 years. The effect of vaccination in elderly populations appeared to be small, but since cumulative incidence in elderly people was low, the effect of vaccination cannot be directly inferred from the results. The same conclusion can be drawn for the 0 year age group. Furthermore, no children under six months were vaccinated. It might have had an effect on the VE. Although the 16–19 years age group exhibited high period prevalence from the onset of this pandemic, this group was given a low priority for vaccination. The VE was also low in this age group (16–19 years), but the precise explanation for this is unknown. In Japan, most high school students (16–18 years old) were vaccinated against influenza A(H1N1)pdm09 before university entrance exams around February. A student with confirmed influenza A(H1N1)pdm09 infection is likely not to be allowed to pass entrance exams. Therefore, some of the high school students might have been vaccinated after being infected by influenza A(H1N1)pdm09, thus reducing the vaccine effectiveness. These results may indicate that when the influenza vaccine is administered after the influenza A(H1N1)pdm09 epidemic peak, the vaccine effectiveness is reduced. In general, the effectiveness of vaccination would be expected to vary by age group based on the age-associated lifestyle habits, and by regional characteristics, such as population density and age structure. However, an overall OR of cumulative incidence of more than 2.0 and the large reduction in cumulative incidence seen with vaccination in the 4–6 years, 7–9 years, and 10–12 years groups indicate that vaccination strongly influenced the incidence of the 2009 influenza pandemic.
This study suggests that during the 2009 influenza pandemic, vaccinating schoolchildren was effective in creating a level of herd immunity in all of the medical administration areas. In the USA, influenza vaccinations have been reported to improve school attendance rates [21], and vaccinating children for influenza has been found to induce herd immunity in elderly populations [22]. Our findings support a possible sizable effect of schoolchildren (elementary to junior high school) on the spread of infection to the whole population. Since school-age populations can amplify seasonal influenza epidemics, Japan administered preventative vaccinations to schoolchildren from 1962 to 1994 as a public health measure to prevent epidemics from spreading throughout the community [10]. When this practice was halted, vaccination became voluntary. However, excess mortality from influenza was lower in Japan during the 1970s and 1980s when schoolchildren were being vaccinated, and increased when the practice was stopped in the 1990s [9]. A previous study reported that discontinuation of vaccination of schoolchildren was responsible for the increase in influenza-associated deaths among young children in the 1990s [23]. Influenza vaccines have also been reported to be cost-effective [24]. Using a mathematical epidemiological model, Nishiura et al. [25] found that during the H1N1 outbreak, infections may have spread among individuals aged 20 years and above. When making decisions on vaccination priority, not only high-risk populations should be targeted, but also populations with a potentially higher potential for transmission. Creating a system that can quickly and strongly recommend the vaccination of populations that have characteristics similar to the younger groups in this study, that is, populations who lack immunity to pandemic influenza and people who live in group settings, could be an effective method of prevention.
We examined the effect of each group on the period prevalence by defining the probability of transmission when infected persons had contact with susceptible persons as the expansion of infection. The expansion of infection estimated in this study was based on the multi-type epidemic model [16]. Although this enables a simulation based on real period prevalence by reflecting the action pattern by group, each parameter is difficult to estimate in the multi-type epidemic model using actual period prevalence data because of a large number of parameters to be estimated. Other models have been used to estimate the basic reproduction number per group in some studies. However, only a few studies, which targeted fewer groups, such as children versus adults, were able to estimate using real data [25,26]. Thus, to our best knowledge, no detailed study that divides the population by age or gender has been previously conducted. In our estimation, the expansion of infection was higher in the 7–15 years age group. These results could suggest that those groups could potentially make a large impact on the spread of infection. Previous studies reported that children play major roles in the spread of influenza within families or schools [27,28,29,30]. High contact frequency among schoolchildren can be considered as a causative factor of this phenomenon [31,32,33].
The results of the estimation of the expansion of infection per group indicate the group responsible for the spread of infection. The group with high expansion of infection should be targeted for operational policies. The recommended policy is school closure based on the results of this study that schoolchildren contribute to the spread of infection. In fact, the efficacy of school closure in the influenza A(H1N1)pdm09 period was reported in previous studies [34,35].
Two analyses regarding preventative action were performed in this study. The first analysis was an association between infection with influenza A(H1N1)pdm09 and preventative action. Participants aged 16 years and above who carefully observed preventative measures, such as gargling and hand hygiene, had a low probability of contracting influenza. Similarly, those in the 0–15 years age group and the combined analysis of all participants who were vaccinated were likely to resist against the influenza A(H1N1)pdm09. On the other hand, vaccination does not require knowledge of a skill and it can prevent children from contracting the influenza A(H1N1)pdm09 virus. The second analysis was the association between the expansion of infection (which could be an indirect indication of the power of transmission) and preventative action. No preventative action had a significant impact on controlling the spread of infection. Our results are inconsistent with previous reports that demonstrated the efficacy of preventative actions such as hand hygiene [14,36]. These differences might be explained by the difference in study designs. Our study was not an interventional study. Therefore, not all the participants observed preventive measures against influenza A(H1N1)pdm09 infection. However, the previous two studies were randomized controlled trials where participants in the intervention groups are likely to comply with preventive measures.
This study has several limitations. Firstly, we cannot show any causation from the results because this is a survey, but we took time relation into consideration to investigate the timing of infection. Secondly, data from this study were collected for practical purposes related to future influenza pandemics preparedness, and the number of younger (0–15 years) participants was higher than that of the elderly. However, our questionnaire survey covered all age groups and areas. Thirdly, the number of participants who reported having been infected with the influenza A(H1N1)pdm09 virus may be incorrect, since the diagnosis was based on answers from a questionnaire, but we distinguished whether they thought that they have been infected with the influenza A(H1N1)pdm09 virus and whether they were diagnosed with the influenza A(H1N1)pdm09 infection. Fourthly, we assumed no difference in the likelihood of infection in our model because nobody had antibody against influenza A(H1N1)pdm09 [37], but we did not take into consideration other biological characteristics. In addition, regarding the assumption that all infected persons would be cured by the following month based on the infection period of influenza, we created a model based on the monthly period prevalence of influenza even though the infectious state of influenza changes on a daily basis.
Fifthly, this study relied on voluntary response samples, with participants not being randomly selected. As a result, children (0–15) were oversampled (71.8% of the participants). Therefore, our surveys may be vulnerable to selection bias. However, the later concerns are mitigated by the fact that the sample size was deemed appropriate (n = 176,113) and the recruitment covered all areas and generations. People were likely to participate in this survey because the study was conducted by the Regional Health Care Council of Hiroshima Prefecture, which represents the Japanese government. Therefore, the effect of the bias seems to be small as compared with regular questionnaire surveys conducted in Japan.
Finally, this study contains recall bias. However, participants who were infected with influenza may remember clearly their preventative actions.

5. Conclusions

After the influenza A(H1N1)pdm09 outbreak, the Regional Health Care Council of Hiroshima Prefecture conducted a large survey of 176,113 people to address influenza outbreak preparedness. There are important findings that emerged from this study. Firstly, the vaccination of children created a level of herd immunity against influenza among the greater community. When an influenza pandemic occurs and vaccine supplies are limited, vaccinations should not only be provided to populations at high risk of mortality but also to groups that may spread the infection, with the aim of reducing the scale of the outbreak and lowering the overall risk of mortality. Secondly, schoolchildren have the high power to transmit the infection to others that we evaluate as the expansion of infection. Evaluating the dynamics of various infections by using expansion of infection as an index is considered to be helpful for devising infection-preventative measures in the future.

Supplementary Materials

The following are available online at www.mdpi.com/1660-4601/13/10/1017/s1, Supplementary File: Sample items used to assess factors related to the expansion of infection and prevention of the influenza A(H1N1)pdm09.

Acknowledgments

We thank Yoshinori Yasui from the Infectious Disease Surveillance Center, National Institute of Infectious Diseases, Tokyo, Japan for the evaluation of this survey from his specialty. We are deeply indebted to Toru Ichikawa, Syun Ito, Takemasa Sakaguchi, Yukiharu Sakaya, Toshinari Shimoe, Fumihiko Chikasue, Masao Naito, Koichiro Nakajima, Tadashi Nagata, Yasuro Nitta, Yoshihiro Fujigami, Junichi Fuse, Syoji Murao, Michiya Yokozaki, Takashi Yokoyama and Masumi Kishimoto, members of the Regional Health Care Council of Hiroshima Prefecture, Hiroshima, Japan for the management of the survey. We thank the following members for their contributions in this survey: Keiichi Hiramatsu, Syuzo Toyota, Yoshimi Hidani, Kozi Watanabe and Masanori Horie, (Hiroshima Prefectural area), Kotaro Nagasaki and Shinichi Sawazaki (Hiroshima medical administration area), Toshihiko Arata (Hiroshima-Nishi medical administration area), Yutaka Hara (Kure medical administration area), Masakazu Yamazaki and Syuichi Hatano, (Hiroshima-Chuo medical administration area), Akio Nakabayashi (Bisan medical administration area), Mutsuo Kamegawa (Fukuyama-Fuchu medical administration area), Syogo Hoshida (Bihoku medical administration area) and Noriyuki Manabe (occupational physician), members of Hiroshima Prefectural Medical Association, Hiroshima, Japan. This survey was supported Hiroshima Prefecture Board of Health and Welfare, Hiroshima, Japan, Hiroshima Prefecture Board of Education, Hiroshima, Japan and Hiroshima Prefectural nursery Federation, Hiroshima, Japan. We also thank Muzembo Basilua Andre from Hiroshima University, Hiroshima, Japan for his help editing in English.

Author Contributions

Toshihiko Matsuoka, Masao Kuwabara and Junko Tanaka conceived and designed the study; Toshihiko Matsuoka, Jiturou Yanagida, Hiroki Ohge and Masao Kuwabara were involved in data acquisition; Tomoki Sato and Tomoyuki Akita analyzed and interpreted the data; and Toshihiko Matsuoka, Tomoki Sato, Tomoyuki Akita, Jiturou Yanagida, Hiroki Ohge, Masao Kuwabara, and Junko Tanaka made substantive contribution in drafting the manuscript. All authors read and approved the manuscript version to be published.

Conflicts of Interest

The authors declare no conflict of interest.

References

  1. World Health Organization. Geneva. Influenza. Fact Sheet No.211 Revised March 2014. Available online: http://www.who.int/mediacentre/factsheets/fs211/en/ (accessed on 1 March 2014).
  2. National Institute of Infectious Diseases, Japan. Infectious Agents Surveillance Report: One Year Since the 2009 Pandemic (H1N1). Available online: http://idsc.Nih.Go.Jp/iasr/31/367/inx367.Html (accessed on 1 March 2014).
  3. Cabinet Secretariat in Japan. Tokyo National Action Plan for Pandemic Influenza and New Infectious Diseases. 2013. Available online: http://www.Cas.Go.Jp/jp/seisaku/ful/keikaku.Html (accessed on 17 April 2016). [Google Scholar]
  4. King, J.C., Jr.; Stoddard, J.J.; Gaglani, M.J.; Moore, K.A.; Magder, L.; McClure, E.; Rubin, J.D.; Englund, J.A.; Neuzil, K. Effectiveness of school-based influenza vaccination. N. Engl. J. Med. 2006, 355, 2523–2532. [Google Scholar] [CrossRef] [PubMed]
  5. Baxter, R.; Lee, J.; Fireman, B. Evidence of bias in studies of influenza vaccine effectiveness in elderly patients. J. Infect. Dis. 2010, 201, 186–189. [Google Scholar] [CrossRef] [PubMed]
  6. Gordis, L. Epidemiology, 4th ed.; Sanders Elsevier: Philadelphia, PA, USA, 2009; pp. 24–25. [Google Scholar]
  7. Plans-Rubio, P. The vaccination coverage required to establish herd immunity against influenza viruses. Prev. Med. 2012, 55, 72–77. [Google Scholar] [CrossRef] [PubMed]
  8. Reichert, T.A.; Sugaya, N.; Fedson, D.S.; Glezen, W.P.; Simonsen, L.; Tashiro, M. The Japanese experience with vaccinating schoolchildren against influenza. N. Engl. J. Med. 2001, 344, 889–896. [Google Scholar] [CrossRef] [PubMed]
  9. Sugaya, N. Influenza vaccination and excess mortality—A reevaluation of group vaccination of students in Japan. Influenza 2007, 8, 31–34. [Google Scholar]
  10. Kawai, S.; Nanri, S.; Ban, E.; Inokuchi, M.; Tanaka, T.; Tokumura, M.; Kimura, K.; Sugaya, N. Influenza vaccination of schoolchildren and influenza outbreaks in a school. Clin. Infect. Dis. 2011, 53, 130–136. [Google Scholar] [CrossRef] [PubMed]
  11. Regional Health Care Council of Hiroshima Prefecture. Report on a Survey of the 2009 Influenza (H1N1) Infection; Regional Health Care Council of Hiroshima Prefecture: Hiroshima, Japan, 2013; pp. 152–155. [Google Scholar]
  12. Osterholm, M.T.; Kelley, N.S.; Sommer, A.; Belongia, E.A. Efficacy and effectiveness of influenza vaccines: A systematic review and meta-analysis. Lancet Infect. Dis. 2012, 12, 36–44. [Google Scholar] [CrossRef]
  13. Aiello, A.E.; Murray, G.F.; Perez, V.; Coulborn, R.M.; Davis, B.M.; Uddin, M.; Shay, D.K.; Waterman, S.H.; Monto, A.S. Mask use, hand hygiene, and seasonal influenza-like illness among young adults: A randomized intervention trial. J. Infect. Dis. 2010, 201, 491–498. [Google Scholar] [CrossRef] [PubMed]
  14. Cowling, B.J.; Chan, K.H.; Fang, V.J.; Cheng, C.K.; Fung, R.O.; Wai, W.; Sin, J.; Seto, W.H.; Yung, R.; Chu, D.W.; et al. Facemasks and hand hygiene to prevent influenza transmission in households: A cluster randomized trial. Ann. Intern. Med. 2009, 151, 437–446. [Google Scholar] [CrossRef] [PubMed]
  15. Hiroshima Prefecture in Japan. Hiroshima. Population by Estimate (May 2010). Available online: http://www.Pref.Hiroshima.Lg.Jp/soshiki/21/jinkougeppojinkousuiih2203.html (accessed on 17 April 2016).
  16. Britton, T. Estimation in multitype epidemics. J. R. Stat. Soc. Ser. B-Stat. Methodol. 1998, 60, 663–679. [Google Scholar] [CrossRef]
  17. Shinjoh, M.; Sugaya, N.; Yamaguchi, Y.; Tomidokoro, Y.; Sekiguchi, S.; Mitamura, K.; Fujino, M.; Shiro, H.; Komiyama, O.; Taguchi, N.; et al. Effectiveness of trivalent inactivated influenza vaccine in children estimated by a Test-negative case-control design study based on influenza rapid diagnostic test results. PLoS ONE 2015, 10, e0136539. [Google Scholar] [CrossRef] [PubMed]
  18. Jefferson, T.; Di Pietrantonj, C.; Al-Ansary, L.A.; Ferroni, E.; Thorning, S.; Thomas, R.E. Vaccines for preventing influenza in the elderly. Cochrane Database Syst. Rev. 2010, CD004876. [Google Scholar] [CrossRef]
  19. Jefferson, T.; Di Pietrantonj, C.; Rivetti, A.; Bawazeer, G.A.; Al-Ansary, L.A.; Ferroni, E. Vaccines for preventing influenza in healthy adults. Cochrane Database Syst. Rev. 2010, CD001269. [Google Scholar] [CrossRef]
  20. Jefferson, T.; Rivetti, A.; Di Pietrantonj, C.; Demicheli, V.; Ferroni, E. Vaccines for preventing influenza in healthy children. Cochrane Database Syst. Rev. 2012, 8, CD004879. [Google Scholar] [PubMed]
  21. Pannaraj, P.S.; Wang, H.L.; Rivas, H.; Wiryawan, H.; Smit, M.; Green, N.; Aldrovandi, G.M.; El Amin, A.N.; Mascola, L. School-located influenza vaccination decreases laboratory-confirmed influenza and improves school attendance. Clin. Infect. Dis. 2014, 59, 325–332. [Google Scholar] [CrossRef] [PubMed]
  22. Cohen, S.A.; Chui, K.K.; Naumova, E.N. Influenza vaccination in young children reduces influenza-associated hospitalizations in older adults, 2002–2006. J. Am. Geriatr. Soc. 2011, 59, 327–332. [Google Scholar] [CrossRef] [PubMed]
  23. Sugaya, N.; Takeuchi, Y. Mass vaccination of schoolchildren against influenza and its impact on the influenza-associated mortality rate among children in Japan. Clin. Infect. Dis. 2005, 41, 939–947. [Google Scholar] [CrossRef] [PubMed]
  24. Pitman, R.J.; Nagy, L.D.; Sculpher, M.J. Cost-effectiveness of childhood influenza vaccination in England and Wales: Results from a dynamic transmission model. Vaccine 2013, 31, 927–942. [Google Scholar] [CrossRef] [PubMed]
  25. Nishiura, H.; Castillo-Chavez, C.; Safan, M.; Chowell, G. Transmission potential of the new influenza A(H1N1) virus and its age-specificity in Japan. Euro Surveill. 2009, 14, 19227. [Google Scholar] [PubMed]
  26. Tsukui, S. Case-Based Surveillance of Pandemic (H1N1) 2009 in Maebashi City, Japan. Jpn. J. Infect. Dis. 2012, 65, 132–137. [Google Scholar] [PubMed]
  27. Papenburg, J.; Baz, M.; Hamelin, M.E.; Rheaume, C.; Carbonneau, J.; Ouakki, M.; Rouleau, I.; Hardy, I.; Skowronski, D.; Roger, M.; et al. Household transmission of the 2009 pandemic A/H1N1 influenza virus: elevated laboratory-confirmed secondary attack rates and evidence of asymptomatic infections. Clin. Infect. Dis. 2010, 51, 1033–1041. [Google Scholar] [CrossRef] [PubMed]
  28. Chang, L.Y.; Chen, W.H.; Lu, C.Y.; Shao, P.L.; Fan, T.Y.; Cheng, A.L.; Huang, L.M. Household transmission of Pandemic (H1N1) 2009 Virus, Taiwan. Emerg. Infect. Dis. 2011, 17, 1928–1931. [Google Scholar] [CrossRef] [PubMed]
  29. France, A.M.; Jackson, M.; Schrag, S.; Lynch, M.; Zimmerman, C.; Biggerstaff, M.; Hadler, J. Household transmission of 2009 influenza A (H1N1) virus after a school-based outbreak in New York City, April–May 2009. J. Infect. Dis. 2010, 201, 984–992. [Google Scholar] [CrossRef] [PubMed]
  30. Calatayud, L.; Kurkela, S.; Neave, P.E.; Brock, A.; Perkins, S.; Zuckerman, M.; Sudhanva, M.; Bermingham, A.; Ellis, J.; Pebody, R.; et al. Pandemic (H1N1) 2009 virus outbreak in a school in London, April–May 2009: An observational study. Epidemiol. Infect. 2010, 138, 183–191. [Google Scholar] [CrossRef] [PubMed]
  31. Eames, K.T.; Tilston, N.L.; Brooks-Pollock, E.; Edmunds, W.J. Measured dynamic social contact patterns explain the spread of H1N1v influenza. PLoS Comput. Biol. 2012, 8, e1002425. [Google Scholar] [CrossRef] [PubMed]
  32. DeStefano, F.; Haber, M.; Currivan, D.; Farris, T.; Burrus, B.; Stone-Wiggins, B.; McCalla, A.; Guled, H.; Shih, H.; Edelson, P.; et al. Factors associated with social contacts in four communities during the 2007–2008 influenza season. Epidemiol. Infect. 2011, 139, 1181–1190. [Google Scholar] [CrossRef] [PubMed]
  33. Eshima, N.; Tokumaru, O.; Hara, S.; Bacal, K.; Korematsu, S.; Tabata, M.; Karukaya, S.; Yasui, Y.; Okabe, N.; Matsuishi, T. Sex- and age-related differences in morbidity rates of 2009 pandemic influenza A H1N1 virus of swine origin in Japan. PLoS ONE 2011, 6, e19409. [Google Scholar] [CrossRef] [PubMed]
  34. Filleul, L.; D’Ortenzio, E.; Kermarec, F.; Le Bot, F.; Renault, P. Pandemic influenza on Reunion Island and school closure. Lancet Infect. Dis. 2010, 10, 294–295. [Google Scholar] [CrossRef]
  35. Cauchemez, S.; Valleron, A.J.; Boelle, P.Y.; Flahault, A.; Ferguson, N.M. Estimating the impact of school closure on influenza transmission from Sentinel data. Nature 2008, 452, 750–754. [Google Scholar] [CrossRef] [PubMed]
  36. Talaat, M.; Afifi, S.; Dueger, E.; El-Ashry, N.; Marfin, A.; Kandeel, A.; Mohareb, E.; El-Sayed, N. Effects of hand hygiene campaigns on incidence of laboratory-confirmed influenza and absenteeism in schoolchildren, Cairo, Egypt. Emerg. Infect. Dis. 2011, 17, 619–625. [Google Scholar] [CrossRef] [PubMed]
  37. Sugaya, N.; Mitamura, K.; Yamazaki, M.; Tamura, D.; Ichikawa, M.; Kimura, K.; Kawakami, C.; Kiso, M.; Ito, M.; Hatakeyama, S.; et al. Lower clinical effectiveness of oseltamivir against influenza B contrasted with influenza A infection in children. Clin. Infect. Dis. 2007, 44, 197–202. [Google Scholar] [CrossRef] [PubMed]
Figure 1. Map of Hiroshima Prefecture by place of living and flow chart of the study population. Hiroshima Prefecture is located in the west of Japan. The prefecture is divided into seven medical administration areas. Subjects living outside of Hiroshima Prefecture were only used for logistic regression analysis. refers to population density (people per km2).
Ijerph 13 01017 g001
Figure 2. Period prevalence (%) from June 2009 to May 2010. Period prevalence is shown by: area (A); and age (B).
Ijerph 13 01017 g002
Figure 3. The expansion of infection. The expansion of infection is shown by age group and by medical administration area: male (A); and female (B).
Ijerph 13 01017 g003
Figure 4. Effect of each factor to the expansion of infection. Estimated coefficient of each factor by multivariate linear regression (which means effect to expansion of infection) was shown as bar chart. The expansion of infection was higher in the male group (p < 0.05) as compared with the female group. It was also higher in the 7–9 years age group, followed by the 10–12 years age group and the 13–15 years age group as compared with the base group (4–6 years age group; p < 0.05).
Ijerph 13 01017 g004
Table 1. General characteristics of the participants.
GenderMaleFemaleTotal
n (%)n (%)n (%)
Total82,738 (47.0)93,375 (53.0)176,113 (100.0)
Medical administration area
Hiroshima56,696 (32.2)60,524 (34.4)117,220 (66.6)
Hiroshima-Nishi2962 (1.7)2628 (1.5)5590 (3.2)
Kure3079 (1.7)3849 (2.2)6928 (3.9)
Hiroshima-Chuo3149 (1.8)3584 (2.0)6733 (3.8)
Bisan4721 (2.7)5972 (3.4)10,693 (6.1)
Fukuyama-Fuchu10,129 (5.8)14,504 (8.2)24,633 (14.0)
Bihoku1193 (0.7)1687 (1.0)2880 (1.6)
Other809 (0.5)627 (0.4)1436 (0.8)
Age groups
0 year437 (0.2)387 (0.2)824 (0.5)
1–3 years9230 (5.2)8506 (4.8)17,736 (10.1)
4–6 years19,012 (10.8)18,116 (10.3)37,128 (21.1)
7–9 years 12,631 (7.2)12,605 (7.2)25,236 (14.3)
10–12 years ††12,814 (7.3)13,485 (7.7)26,299 (14.9)
13–15 years †††9,174 (5.2)10,092 (5.7)19,266 (10.9)
16–19 years12,741 (7.2)11,812 (6.7)24,553 (13.9)
20–29 years932 (0.5)4094 (2.3)5026 (2.9)
30–39 years1246 (0.7)4082 (2.3)5328 (3.0)
40–49 years1302 (0.7)3634 (2.1)4936 (2.8)
50–59 years1464 (0.8)3847 (2.2)5311 (3.0)
60–69 years937 (0.5)1552 (0.9)2489 (1.4)
70–79 years579 (0.3)811 (0.5)1390 (0.8)
≥80 years239 (0.1)352 (0.2)591 (0.3)
Low grade of elementary school students; †† High grade of elementary school students; ††† Junior high school students.
Table 2. Vaccination rates.
TotalNumber of VaccinatedVaccination Rate (%)
Overall157,08457,32036.5
By age group (p < 0.0001)
0 year8128510.5
1–3 years17,220927753.9
4–6 years34,72817,13449.3
7–9 years22,166775935.0
10–12 years22,309534524.0
13–15 years15,381307620.0
16–19 years20,647688533.3
20–29 years4706127027.0
30–39 years5047162132.1
40–49 years4682130827.9
50–59 years5082138527.3
60–69 years238798941.4
70–79 years134479359.0
≥80 years57339368.6
By medical administration area (p < 0.0001)
Hiroshima-Nishi5210201538.7
Hiroshima102,51834,07433.2
Kure6539278442.6
Hiroshima-Chuo6277255740.7
Bisan10,152445443.9
Fukuyama-Fuchu23,63010,10842.8
Bihoku2758132848.2
By gender (p < 0.0001)
Men72,74827,05237.2
Women84,33630,26835.9
Table 3. Overall cumulative incidence of influenza, OR of cumulative incidence and VE based on vaccination status (from November 2009 to May 2010).
Number of Participants n (%)Cumulative Incidence n/N (%)Odds Ratio (OR)Vaccine Effectiveness (VE; %)
Vaccinated GroupNon-Vaccinated GroupOR95% Confidence Intervalp ValueVE (%)95% Confidence Intervalp Value
Overall153,308 (100.0)10,855/57,320 (18.9)32,379/95,988 (33.7)2.182.132.23 <0.000143.942.8 44.9<0.0001
By Age Group (p < 0.0001)
0 year755 (0.5)10/85 (11.8)31/690 (4.5)0.350.170.71 0.0038−161.9−414.9−33.20.0038
1–3 years16,865 (11.0)958/9277 (10.3)2188/7588 (28.8)3.523.253.81 <0.000164.261.666.6<0.0001
4–6 years34,016 (22.2)3602/17,134 (21.0)8025/16,882 (47.5)3.403.253.56 <0.000155.854.357.2<0.0001
7–9 years21,728 (14.2)2188/7759 (28.2)6840/13,969 (49.0)2.442.302.59 <0.000142.440.144.6<0.0001
10–12 years21,814 (14.2)1526/5345 (28.6)6931/16,469 (42.1)1.821.701.94 <0.000132.229.035.2<0.0001
13–15 years14,990 (9.8)753/3076 (24.5)4049/11,914 (34.0)1.591.451.74 <0.000128.023.032.6<0.0001
16–19 years19,962 (13.0)1544/6885 (22.4)2984/13,077 (22.8)1.020.951.10 0.5214 1.7−3.76.90.5214
20–29 years4643 (3.0)102/1270 (8.0)565/3373 (16.8)2.301.862.86 <0.000152.141.460.8<0.0001
30–39 years4969 (3.2)63/1621 (3.9)327/3348 (9.8)2.682.053.49 <0.000160.248.269.4<0.0001
40–49 years4601 (3.0)45/1308 (3.4)244/3293 (7.4)2.251.643.08 <0.000153.636.666.0<0.0001
50–59 years4950 (3.2)32/1385 (2.3)176/3565 (4.9)2.201.523.17 <0.000153.232.167.7<0.0001
60–69 years2237 (1.5)19/989 (1.9)13/1248 (1.0)0.540.271.06 0.0724 −84.4−271.68.50.0723
70–79 years1239 (0.8)9/793 (1.1)5/446 (1.1)0.990.342.84 0.9816 −1.2−200.265.90.9816
≥80 years519 (0.3)4/393 (1.0)1/126 (0.8)0.780.106.29 0.8140 −28.2−1036.985.50.8138
By Medical Administration Area (p = 0.0371)
Hiroshima-Nishi5118(3.3)269/2015 (13.3)762/3103 (24.6)2.111.822.45<0.000145.638.352.1<0.0001
Hiroshima100,116 (65.3)7232/34,074 (21.2)23,995/66,042 (36.3)2.122.062.18<0.000141.640.242.9<0.0001
Kure6359(4.1)432/2784 (15.5)950/3575 (26.6)1.971.742.23<0.000141.635.347.3<0.0001
Hiroshima-Chuo6158(4.0)501/2557 (19.6)1141/3601 (31.7)1.901.692.14<0.000138.232.243.6<0.0001
Bisan9935(6.5)716/4454 (16.1)1676/5481 (30.6)2.302.092.53<0.000147.443.251.4<0.0001
Fukuyama-Fuchu22,926(15.0)1554/10,108 (15.4)3499/12,818 (27.3)2.071.942.21<0.000143.740.646.6<0.0001
Bihoku2696(1.8)151/1328 (11.4)356/1368 (26.0)2.742.243.35<0.000156.348.063.3<0.0001
By Gender (p = 0.8469)
Men70,849(46.2)5603/27,052 (20.7)15,913/43,797 (36.3)2.182.112.26<0.000143.041.544.5<0.0001
Women82,459(53.8)5252/30,268 (17.4)16,466/52,191 (17.4)2.202.122.27<0.000145.043.546.5 <0.0001
p values were assessed by Breslow-Day test.
Table 4. Correlation between cumulative incidence of influenza and vaccination coverage rate.
Correlation Coefficientp Value
0 year−0.246840.5936
1–3 years−0.249760.5891
4–6 years−0.811750.0266
7–9 years−0.461130.2977
10–12 years−0.828730.0212
13–15 years−0.447460.3141
16–19 years−0.30340.5083
20–29 years−0.063940.8917
30–39 years−0.365380.4203
40–49 years−0.330150.4696
50–59 years−0.449070.3121
≥60 years−0.514020.2379
Table 5. Factors associated with influenza infection .
Item0–15 Years (n = 125,477)≥16 Years (n = 49,231)All Participants (n = 174,708)
AOR95% CIp ValueAOR95% CIp ValueAOR95% CIp Value
Gender
Male1.161.14–1.19<0.001 ***1.030.98–1.080.30701.131.11–1.16<0.001 ***
Female1.00 1.00 1.00
Medical administration area
Hiroshima1.00 1.00 1.00
Hiroshima-Nishi1.000.92–1.080.90850.790.70–0.88<0.001 ***0.920.86–0.980.0148 *
Kure0.750.70–0.81<0.001 ***0.800.72–0.88<0.001 ***0.770.73–0.82<0.001 ***
Hiroshima-Chuo1.070.99–1.140.07300.900.82–1.000.05151.020.96–1.080.5631
Bisan1.020.96–1.080.51270.670.61–0.74<0.001 ***0.930.88–0.970.0021 **
Fukuyama-Fuchu0.990.95–1.020.45830.650.60–0.70<0.001 ***0.900.87–0.94<0.001 ***
Bihoku0.880.78–0.980.0192 *0.760.61–0.930.01 *0.860.78–0.950.0032 **
Other0.950.73–1.240.70790.600.49–0.72<0.001 ***0.730.62–0.84<0.001 ***
Age group
0 year0.100.07–0.13<0.001 *** 0.100.07–0.13<0.001 ***
1–3 years0.460.44–0.48<0.001 *** 0.460.44–0.48<0.001 ***
4–6 years1.00 1.00
7–9 years1.351.30–1.40<0.001 *** 1.341.30–1.39<0.001 ***
10–12 years1.251.21–1.29<0.001 *** 1.261.22–1.30<0.001 ***
13–15 years1.121.08–1.17<0.001 *** 1.141.10–1.19<0.001 ***
16–19 years 5.044.55–5.60<0.001 ***0.800.77–0.83<0.001 ***
20–29 years 2.011.78–2.27<0.001 ***0.300.28–0.33<0.001 ***
30–39 years 1.00 0.150.14–0.17<0.001 ***
40–49 years 0.740.64–0.85<0.001 ***0.110.10–0.13<0.001 ***
50–59 years 0.520.44–0.61<0.001 ***0.080.07–0.09<0.001 ***
60–69 years 0.210.15–0.29<0.001 ***0.030.02–0.04<0.001 ***
70–79 years 0.230.15–0.34<0.001 ***0.030.02–0.05<0.001 ***
≥80 years 0.140.05–0.28<0.001 ***0.020.01–0.04<0.001 ***
Helpful information
Television0.820.79–0.85<0.001 ***0.740.68–0.81<0.001 ***0.810.78–0.83<0.001 ***
Newspapers0.870.84–0.90<0.001 ***0.800.72–0.88<0.001 ***0.860.83–0.89<0.001 ***
Pamphlets0.960.90–1.010.13991.040.88–1.220.66960.970.92–1.020.2761
Internet0.930.89–0.980.0034 **0.790.69–0.890.0002 ***0.900.87–0.95<0.001 ***
Preventative behavior
Vaccination0.550.53–0.56<0.001 ***1.101.04–1.160.0008 ***0.620.61–0.64<0.001 ***
Gargling/Hand hygiene1.191.16–1.23<0.001 ***0.910.87–0.960.0005 ***1.111.08–1.14<0.001 ***
Mask1.531.50–1.57<0.001 ***1.891.80–1.99<0.001 ***1.611.58–1.65<0.001 ***
Cough etiquette1.331.28–1.39<0.001 ***1.441.30–1.60<0.001 ***1.341.29–1.40<0.001 ***
Avoid crowds1.161.18–1.19<0.001 ***1.371.26–1.49<0.001 ***1.191.16–1.23<0.001 ***
Get plenty of rest1.000.97–1.040.93341.261.16–1.36<0.001 ***1.041.01–1.080.0081 **
0–15 years survey: R2 = 0.06, model p < 0.001. ≥16 years survey: R2 = 0.14, model p < 0.001. All participants: R2 = 0.10, model p < 0.001. AOR: adjusted odds ratio; CI: confidence interval. * p < 0.05; ** p < 0.01; *** p < 0.001; Baseline groups: gender “female”, medical administration area “Hiroshima”, age group “4–6 years” (for all participants and those aged 0–15 years) or “30–39 years” (for participants ≥16 years), “no information was helpful”, and “did not pay attention to anything”.

