1. Introduction
Thanks to technological progress and economic development, products are being upgraded at an accelerated pace. Therefore, the issue of disposing large quantities of end-of-life (EOL) products has become a great concern to our society. Product remanufacturing enables a full utilization of the residual value of EOL products, reduces the demand for energy and resources, and produces favorable economic and environmental benefits [
1]. To encourage and support product remanufacturing, governments are willing to subsidize the remanufacturing activities of enterprises. Today, the value of remanufactured products is realized mainly through resales, but some anecdotal data demonstrate that the value can also be realized through product donations. For example, with the approval of the National Development and Reform Commission (NDRC), the Beijing-Xizang Trip event was held in September 2013. During the event, several enterprises (including China National Heavy Duty Truck Group Co., Ltd., Jinan, China and China Shandong Forever Co., Ltd., Zoucheng, China) donated their remanufactured products to the Xizang Autonomous Region. The event was intended to publicize the achievements of the remanufacturing industry and to increase its social acceptance (
http://hzs.ndrc.gov.cn/newjsjyxsh/201310/t20131010_561716.html). Due to the effect of “loss aversion”, consumers have a low degree of acceptance towards remanufactured products that are resold in the market, but remanufactured products are particularly suitable for social donations thanks to their characteristics of being of low cost and high quality. Product donations are an important channel through which enterprises can fulfill their social responsibilities [
2]. Social donations serve to boost corporate reputation, relieve government pressure and improve social welfare [
3,
4]. Therefore, governments across the world are supportive of social donations by enterprises. In accordance with the
Tax Law of China, enterprises can enjoy a tax deduction from their product donations, which represents a sort of indirect government subsidy. This paper presents an incentive policy of subsidizing donations of remanufactured products directly by governments, and also compares it with the prevailing incentive policy of subsidizing the resale of remanufactured products by governments. Furthermore, this paper provides suggestions for government decision-making from the economic, environmental, and social perspectives. This paper mainly addresses the following questions. First, under the two incentive policies, where is the effectiveness boundary for the implementation of original equipment manufacturer (OEM)-based remanufacturing? Second, how do the two subsidy policies influence OEM’s output and pricing decisions? Third, under the two subsidy policies, what are the economic and environmental benefits of OEM-based remanufacturing and which subsidy policy is preferable? Finally, under the two incentive policies, what is the optimal government subsidy level and which incentive policy will bring about higher social welfare?
In order to solve the above questions, this paper constructs a Stackelberg game model with the government being a leader and the manufacturer being a follower, and proposes two kinds of remanufacturing incentive policies including subsidy sales of remanufactured products and subsidy donation of remanufactured products. Under these two kinds of incentive policies, manufacturers establish a mixed production line producing both new and remanufactured products. By solving the equilibrium solution for manufacturers under two incentive policies, the effectiveness boundary of government subsidy is found. From the economic and environmental point of view, we compare the effects of the two subsidy policies on manufacturers, and determine the scope of government subsidies which achieves a “win-win” situation for manufacturer economy and environmental benefits. From the perspective of social welfare, we also give the optimal subsidy level for governments under the two policies, compare the effects of different subsidy policies on the social welfare and attain some meaningful management insights.
Past studies associated with the four questions listed above mainly focus on operation management of remanufacturing, social responsibilities of enterprises and government subsidies. Much of the existing literature studied OEM-based remanufacturing analyzed from the perspective of operation management. These studies cover the issues such as product pricing [
5], product quality [
6], power construct [
7] and channel selection [
8]. Subramanian [
9] argues that corporate profitability may be adversely affected if remanufacturing is neglected by an OEM’s decisions on common components. Accordingly, Subramanian analyzes how remanufacturing affects the OEM’s decisions on common components, and how the OEM’s profitability is significantly improved if remanufacturing is considered. Yenipazarli [
10] proposes a production decision-making model for manufacturer with production and remanufacturing capabilities. He finds that remanufactured products encroach on the markets of new products, while remanufacturing under rational government regulations serves to attain a triple-win situation amongst economic, environmental, and social benefits. According to existing research on double-product-line competitions, the value of remanufactured products is realized only through resales. This paper argues that the value of remanufactured products can be realized through both donations and resales. Many enterprises are also carrying out an increasing level of social responsibility initiatives while generating profits from their production and operation activities. Charitable donations are an important channel through which enterprises can fulfill their social responsibilities. Bekkers [
11] describes the driving factors of charitable donations, and Jia [
12] finds that charitable donations bestows enterprise with increased government trust and competitive advantage. The above findings are all based on empirical studies. Using a mathematical optimization model, Arya [
13] studies the donations and resales of new products by enterprises. Considering the characteristics of remanufactured products, this paper considers remanufactured products in the context of product donations. Governments play an important role in promoting the development of product remanufacturing, and numerous studies have examined government subsidies for resales of remanufactured products. Shu [
14] studies the optimal pricing and production decisions of manufacturers under the subsidy or tax rebate policy for product remanufacturing. Specifically, both subsidies and tax rebate are considered favorable by manufacturers, and serve to promote further development of the remanufacturing industry. Xiao [
15] studies three subsidy schemes, including subsidy for remanufacturers, subsidy for consumers, and shared subsidy for remanufacturers and consumers. Xiao argues that although subsidies for remanufacturers or consumers can always stimulate remanufacturing activities, subsidies for remanufacturers are the best option. For donations of remanufactured products, governments usually provide matching subsidies (direct subsidies) or rebate subsidies (indirect subsidies) [
16]. Eckel [
17] finds that matching subsidies or rebate subsidies serve the same function, while rebate subsidies contribute more significantly than matching subsidies. Arya [
13] studies government subsidies for donations of new products, demonstrating that direct subsidy can generate the same policy effect as tax reduction. To date, there has been no research concerning government subsidies for donations of remanufactured products. This paper takes government subsidies as a reference point, with the exception that government subsidies are provided to remanufactured products rather than to new products.
In summary, there has been intensive research conducted in literature in the above fields, which lays a good basis for this study. This paper makes the following major contributions to the field, which distinguish it from previous studies: (1) this paper explores new ways for value realization of remanufactured products, that is, the value of remanufactured products can be realized through both donations and resales; (2) this paper designs a new incentive policy for remanufacturing which combines government subsidy with the donations of remanufactured products; (3) this paper compares two distinct incentive policies for remanufacturing from the perspective of production decision, profit, environment and social welfare.
In short, the innovation of this paper is that we consider the “high quality, low cost” characteristics of remanufactured products, extend the way the value of remanufactured products can be realized, propose a new remanufacturing incentive policy which governments subsidize the donations for remanufactured products. Using government subsidies sales of remanufactured products as a benchmark, a more comprehensive comparative analysis of the two kinds of incentive policies is carried out from the perspective of production decision, economic benefits, environmental benefits and social benefits, whereby providing some suggestions to formulate and implement remanufacturing subsidy policy.
The rest of this article is organized as follows: the second section discusses the research questions, research hypotheses and model symbols. The third section builds and solves mathematical models under two policies. The fourth section compares the impact of two different policies from the production decision-making, economic and environmental benefits. The fifth section studies the impact of two subsidy policies from the perspective of social welfare. The sixth section gives some more intuitive numerical examples. At last, we summarize the research results and highlight the management implications from this study.
4. Analysis
This section comparatively analyzes the two subsidy schemes in terms of three aspects: the OEM’s output and pricing decisions, economic benefits, and environmental benefits. We discuss the common subsidy level shared by the two subsidies schemes, and compare the lower limit of government subsidies under the two subsidy schemes. The lower limit () of government subsidies depends on the corporate reputation from donations of remanufactured products. Then, we obtain and . We also compare the upper limit of government subsidies between the two subsidy schemes. The upper limit of government subsidies is . When the costs of new products meet the condition , we have ; otherwise, we have . When the production costs of new products are high, the opportunity costs of donations of remanufactured products increase. Therefore, higher subsidies are required for remanufactured products to be donated. In sum, the common subsidy level shared by the two subsidy schemes is . We note that when , only Policy R, rather than Policy D, exists in the range of .
4.1. Comparison of OEM’s Equilibrium Solutions
This section compares the output and pricing decisions between Policys D and R. Let , indicating the difference of parameter between Policys D and R. Here, indicates the output and price of different products.
Proposition 3. Table 4 lists the differences of output and pricing decisions with respect to new and remanufactured products in Policys D and R. “+” indicates ,
“−” indicates ,
and “0” indicates . According to Proposition 3, government subsidies for donations of remanufactured products increase the output of both new and remanufactured products, but decrease the sale quantity of remanufactured products. This is due to two reasons: (1) donations of remanufactured products encroach on the resale markets of remanufactured products, thus decreasing the sale quantity of remanufactured products; and (2) donations of remanufactured products weaken the encroachment on the output of new products by the resales of remanufactured products, thus increasing the sale quantity of new products. What is noteworthy noting is that the prices of new products remain unchanged despite the increase in the sale quantity of new products. The donation of remanufactured products bring about a premium effect to the resale pricing of remanufactured products, thus reducing consumer benefits to a certain degree.
4.2. Comparison of OEM’s Profits and Environment Impacts
To better understand the effect of the two subsidy schemes on OEM’s profits and environmental impacts, and assist in selecting a better subsidy scheme, we use and , respectively to denote the differences in profits and environmental benefits between the two subsidy schemes.
(1) Comparison of Profits
We obtain the result of , and calculate the first and second derivatives of regarding . This yields Proposition 4 as follows.
Proposition 4. is a convex function in , and is monotonically decreasing in the range , but monotonically increasing in the range . is its minimum value. Regarding , there exists a unique root , namely, . Specifically, , and .
Proof. The first derivative is , and thus we obtain the extreme point (). We calculate the second derivative ; the extreme point is also the max-min point. Let , and thus calculate (). ☐
According to Proposition 4, is monotonically decreasing in the range . Therefore, compared to Policy D, a low subsidy level has a more significant influence on profit under Policy R, where profit under Policy R is higher than under Policy D. is monotonically increasing in the range . Therefore, when the subsidy level reaches , the influence of government subsidies on profit under Policy D is increasing. The difference in profits between Policys D and R diminishes as the subsidy level rises. When , profit under Policy D is higher than under Policy R.
(2) Comparison of Environmental Impacts
We obtain the result of , and calculate the first and second derivatives of regarding . This yields Proposition 5.
Proposition 5. is monotonically decreasing in the range . There exists a unique root , which ensures . Thereby, in and in . Here, .
Proof. The first derivative of is . According to , we can calculate the root . ☐
According to Proposition 5, monotonically decreases as government subsidies increase, indicating that environmental impact continues to improve. With an increase in government subsidies, the quantity of remanufactured products increases while the quantity of non-recycled products decreases. At a low subsidy range (), the environmental impact under Policy R is superior to that under Policy D. At a high subsidy range (), the environmental impact under Policy D is superior to that under Policy R. This is due to the fact that donations of remanufactured products increase not only the total output of remanufactured products, but also the output of new products. At a low subsidy range, Policy D is inferior to Policy R in terms of environmental impact if the increment in remanufactured products arising from the donations of remanufactured products is smaller than the increment in new products. At a high subsidy range, Policy D is superior to Policy R in terms of environmental impact if the increment in remanufactured products arising from the donations of remanufactured products is larger than the increment in new products.
Proposition 6. When the subsidy level is in the range , Policy D is superior to Policy R in terms of both environmental and economic benefits, and thus there exists a win-win scenario. When the subsidy range is in the range , Policy R is superior to Policy D in terms of both environmental and economic benefits, and thus there exists a win-win scenario. When the subsidy level is in the range , Policy R is superior to Policy D in terms of economic benefits, while Policy D is superior to Policy R in terms of environmental benefits.
Proof. Because , can be converted into . According to the calculation, , thus proving that . ☐
Proposition 6 provides the basis for selecting one of the two subsidy policies. When remanufactured products are subsidized by the government, the subsidy level should not fall within the range . In such a range, neither of the two subsidy policies generate a win-win scenario in terms of economic and environmental benefits. When there is insufficient budget for government subsidies, namely, , it is recommended that government subsidies be provided to the resale of remanufactured products. The intent is to attain a win-win scenario in terms of economic and environmental benefits to the low satisfaction result of OEMs and governments. When there is sufficient budget for government subsidies, namely, , it is recommended that government subsidies be provided to the donations of remanufactured products. The intent is to attain a win-win scenario in terms of economic and environmental benefits to the high satisfaction result of OEMs and governments.
5. Social Welfare
To attain a better balance among economic, environmental, and social benefits, governments as the regulator determine the optimal subsidy level for the purpose of maximizing social welfare. Using the social welfare model (He et al. [
20,
21]) as a reference, this section analyzes the impact of government subsidies on government interests, OEM profits, consumer surplus and environmental benefits, as well as the social impact of product donations.
5.1. Social Welfare of Policy R
indicates the social welfare maximization function under Policy
R. In this equation,
indicates the government subsidies for resale of remanufactured products,
indicates the OEM profits,
indicates the consumer surplus, and
indicates the total environmental cost of non-recycled products.
indicates the unit environmental cost of non-recycled products. The following result is obtained:
Proposition 7. Under Policy R, there exists a unique optimal subsidy level where, .
Proof. It can be shown that since is a strictly concave function, and there exists a unique optimal value in the range . ☐
According to Proposition 7, social welfare under Policy R is a strictly concave function with respect to government subsidies, and there exists a unique optimal subsidy level. The government subsidy level increases as the costs of new products, costs of remanufacturing, and external impact of products all increase.
Corollary. 1. Regardless of the degree of external environmental impact of products, governments must subsidize the remanufactured products under Policy R.
Proof. Under the conditions and , it can be shown that . ☐
Corollary 1 shows that government subsidies for resales of remanufactured products are less affected by the externality of product environments. Regardless of the degree of environmental impact of products, governments should subsidize the remanufacturing behaviors of the OEM to encourage remanufacturing and enhance environmental benefits.
5.2. Social Welfare of Policy D
indicates the social welfare maximization function regarding government subsidies for donations of remanufactured products. In the function, indicates the government subsidy level for donations of remanufactured products, indicates the OEM’s profits, indicates the consumer surplus, indicates the environmental impact of non-recycled products, indicates the social impact from the donations of remanufactured products, and indicates the social impact coefficient of the donations of remanufactured products.
Proposition 8. When , there exists a unique optimal subsidy level under Policy D. When , there exists no optimal subsidy level under Policy D. Specifically, and .
Proof. When , we have . When this holds, is a strictly concave function, and there exists a unique maximum value . When , we have . When this holds, is a strictly convex function, and the known effective subsidy level is in an open interval of . Therefore, the optimal value is not available at the endpoints. ☐
According to Proposition 8, the social impact coefficient () of donations of remanufactured products determines whether there exists an optimal subsidy level under Policy D. When the value of is small, there exists a unique optimal subsidy level. It is worth noting that the optimal subsidy level decreases as the costs of new products increase, but increases as the external impact of products increases. It is uncertain and is affected by the costs of remanufacturing.
Corollary 2. When , government subsidies are necessary only when the environmental externality of products meets the condition under Policy D.
Proof. Under the conditions and , it can be shown that . ☐
Compared with Corollary 1, government subsidies for donations of remanufactured products are less affected by the external environment impact of non-recycled products. In other words, government subsidies are necessary only when the external environmental impact of non-recycled products reaches a certain level. Otherwise, it is not necessary for governments to intervene in the production and remanufacturing actions of the OEM.
Proposition 9. When , we have and . When , we have and . When , we have .
Proof. Let . Then, we obtain the result . When , we have ; otherwise, . Let , and solve . Thus, we obtain the result . It can be shown that when , , and otherwise. When , ; given , . When , ; when , ; when , ; where, . ☐
According to Proposition 9, government subsidies for donations of remanufactured products will improve social welfare if the external environmental impact of non-recycled products is significant. Therefore, the more significant the external environmental impact of non-recycled products, the more feasible the government subsidies will be for donations of remanufactured products. If the external environmental impact of non-recycled products is minimal, the social impact from donations of remanufactured products determines which subsidy policy will improve social welfare more. From the perspective of social welfare, government subsidies for donations of remanufactured products are preferable if the social benefits from donations of remanufactured products are significant enough. Otherwise, government subsidies for resales of remanufactured products are preferable.
6. Numerical Example
This section analyzes the economic and environmental benefits of product remanufacturing under the two different subsidy policies using numerical examples. The analysis not only corroborates propositions and conclusions set forth above, but also offers management insights to us. The parameter values in the production decision-making model used in the analysis are as follows: , , , and . Considering that the government subsidy level differs between the two subsidy schemes, we conduct a numerical analysis under two circumstances: high and low production costs of new products. When , the common subsidy range shared by the two subsidy schemes is . To facilitate graphical presentation, we select the subsidy range . When , the common subsidy range shared by the two subsidy schemes is . To facilitate graphical presentation, we select the subsidy range of .
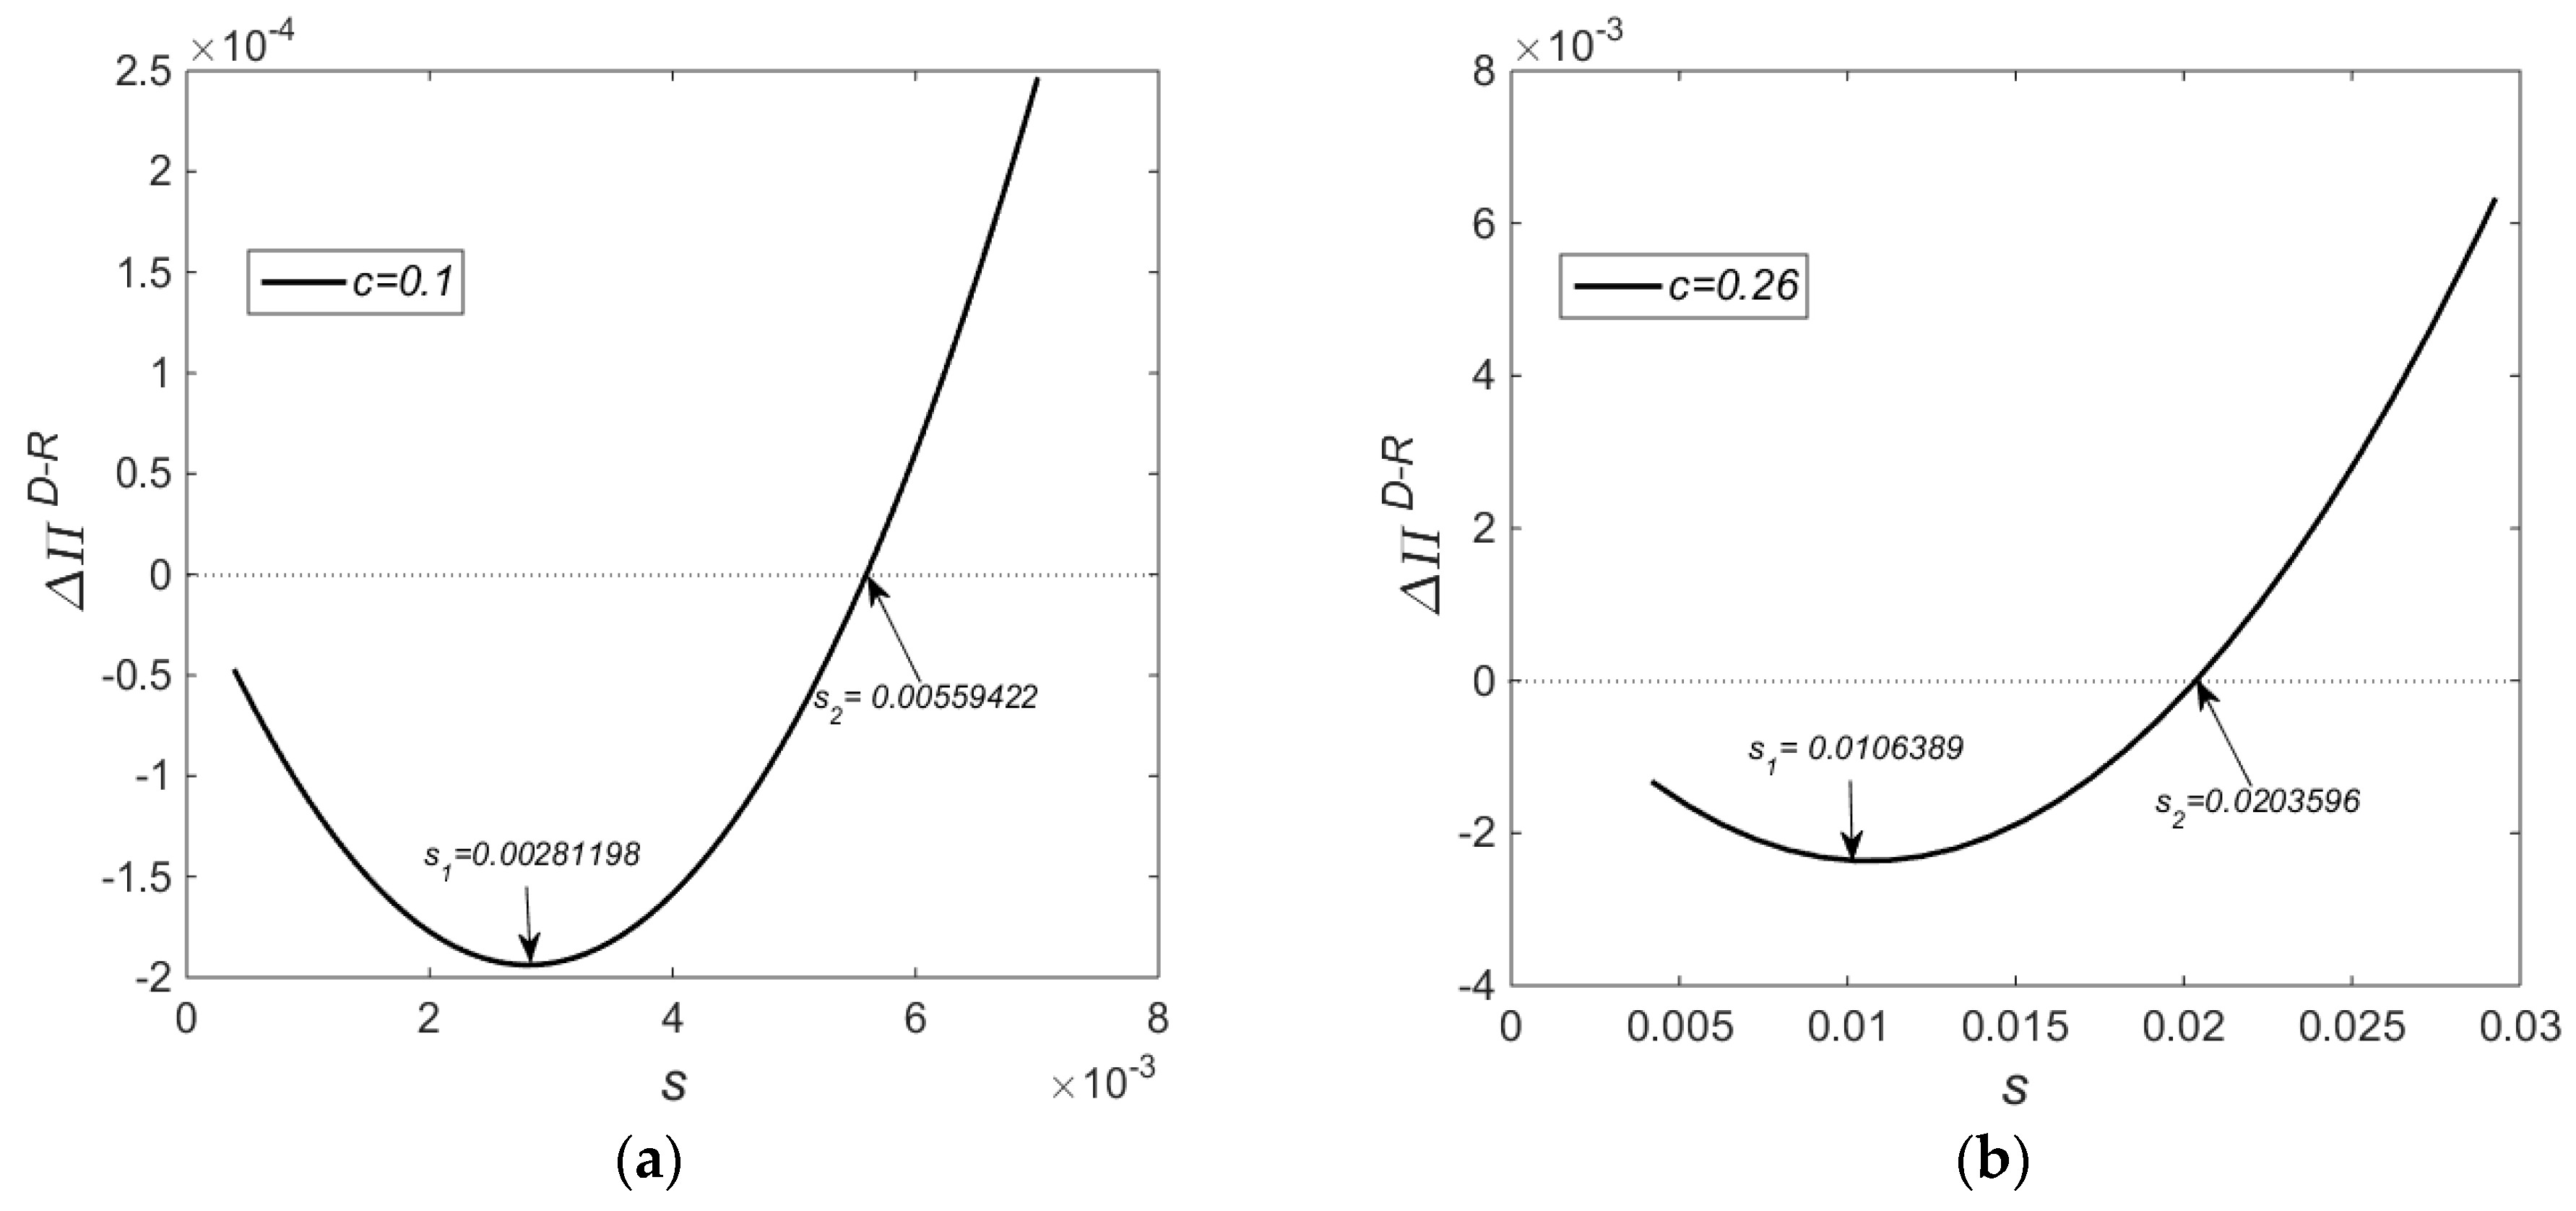
Figure 1 shows the impact on the difference in profit from the two subsidy schemes for different subsidy ranges. The profit difference function is a convex function with respect to government subsidies which decreases initially and then increases as government subsidies increase. When
, there exists a minimum value (
) in terms of the subsidy range, and when
, there exists a minimum value (
) in terms of the subsidy range. With the rise in production costs of new products, the subsidy range also increases accordingly.
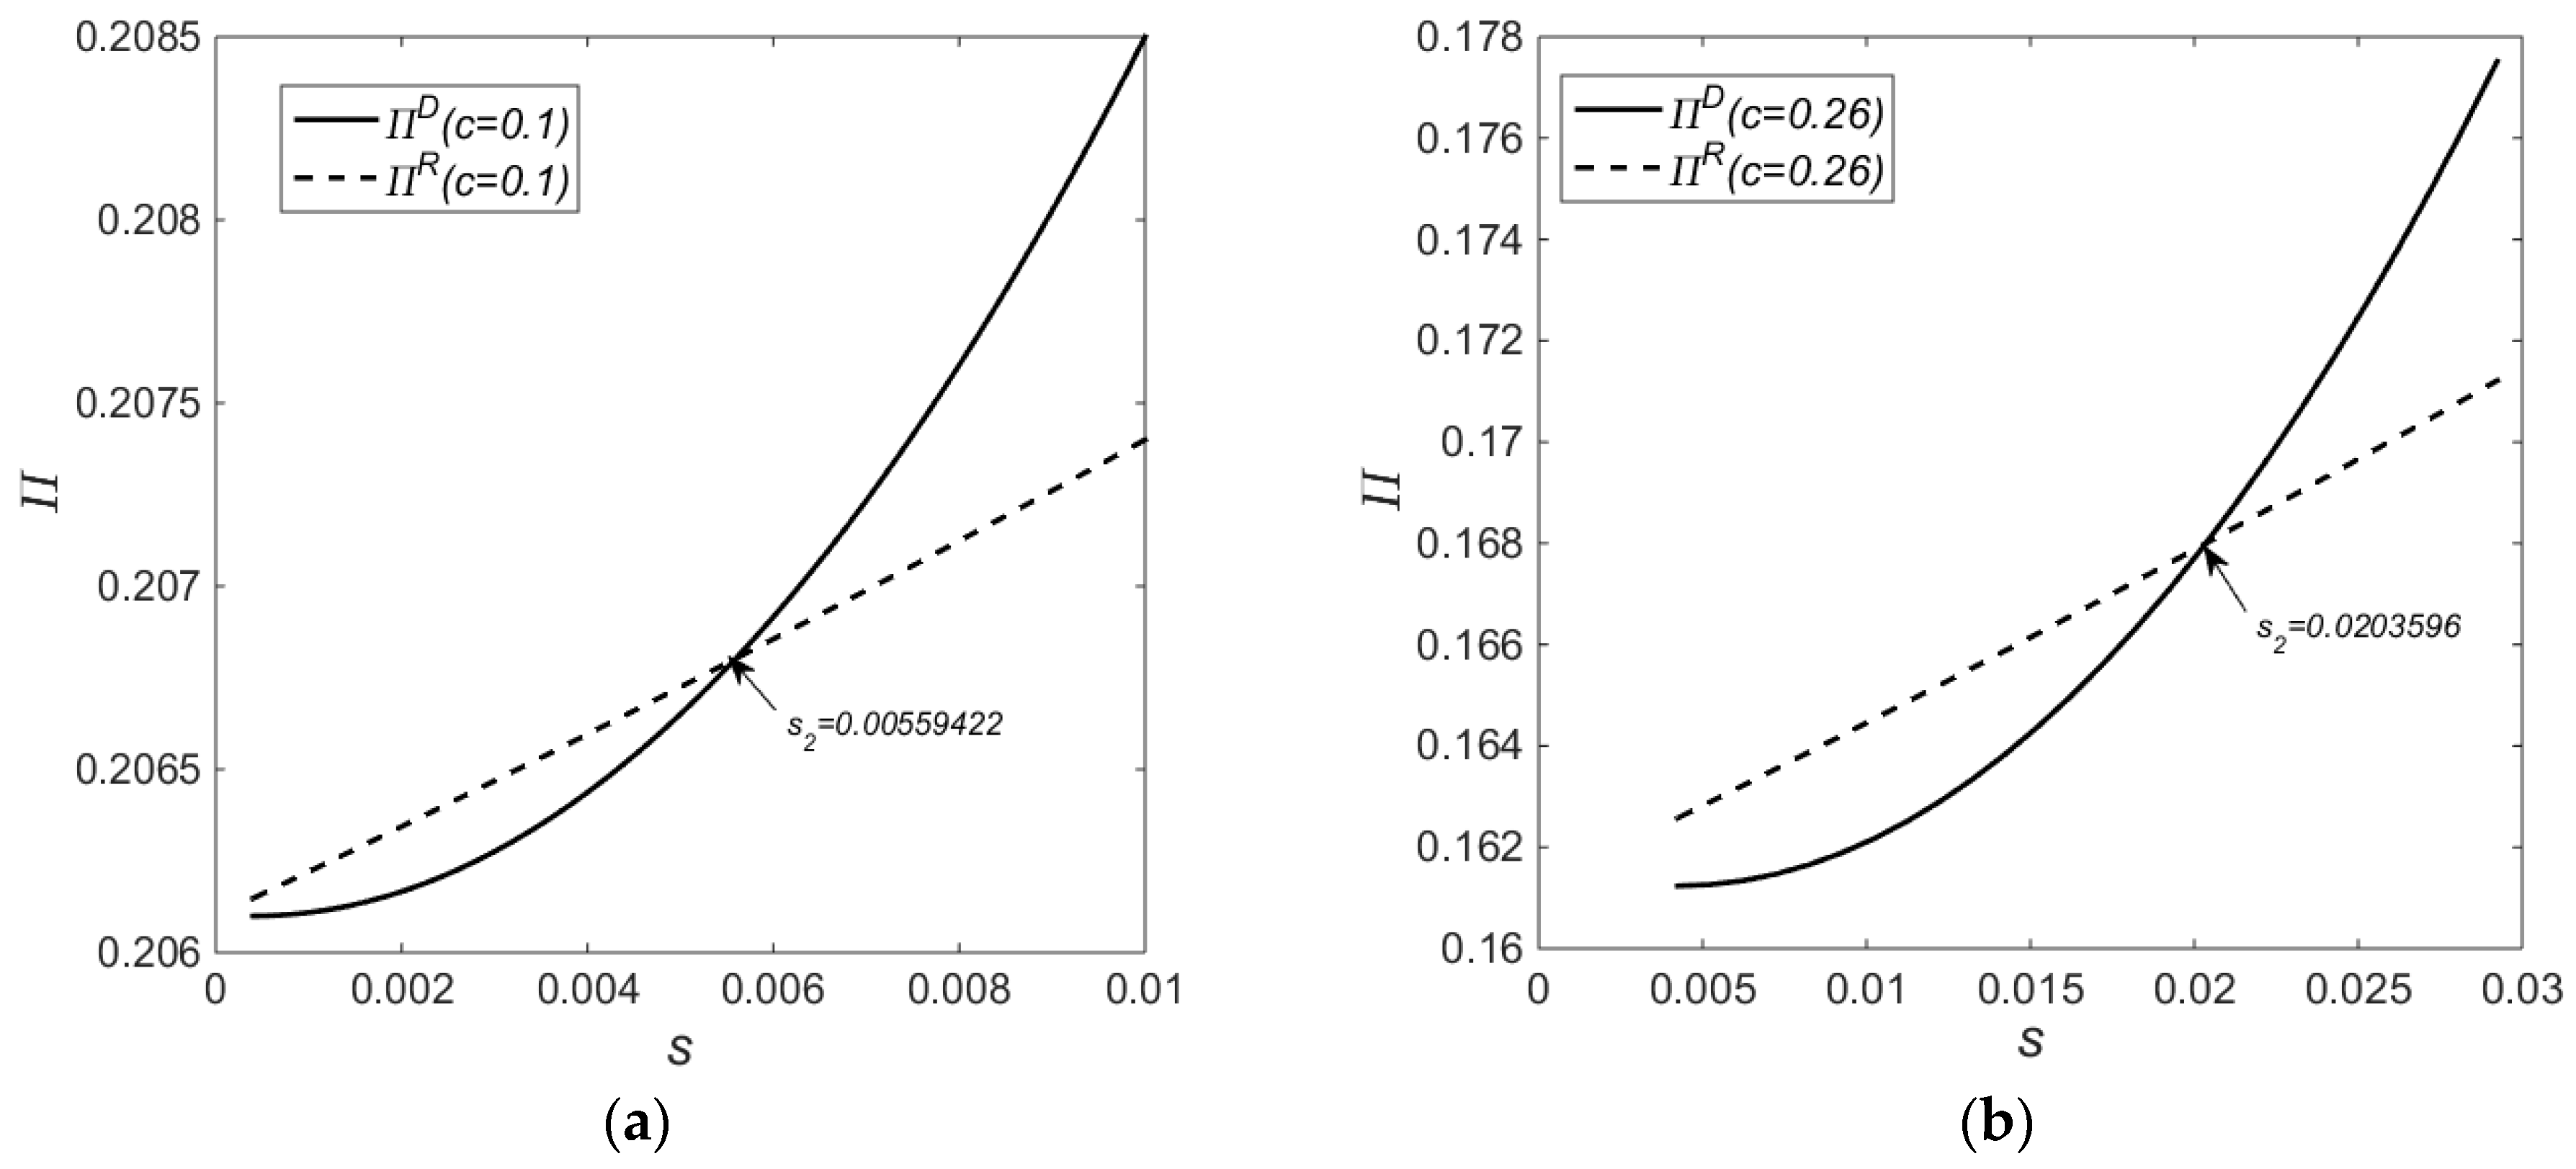
Figure 2 shows the impact of different subsidy levels on economic benefits. According to
Figure 2 as well as
Figure 1, when the subsidy level is sufficiently low, the subsidy level affects Policy
R more significantly than Policy
D, and the profits under Policy
R grow more rapidly than those under Policy
D. In this situation, Policy
R is superior to Policy
D in terms of economic benefits. When the subsidy level reaches
, the subsidy level affects Policy
D more significantly than Policy
R while the profits under Policy
R are still higher than those under Policy
D. Therefore, the profit difference between the two subsidy schemes is a convex function with respect to government subsidies. When the subsidy level reaches
, the profits under Policy
D grow more rapidly than those under Policy R, and Policy
D begins to exceed Policy
R in terms of economic benefits.
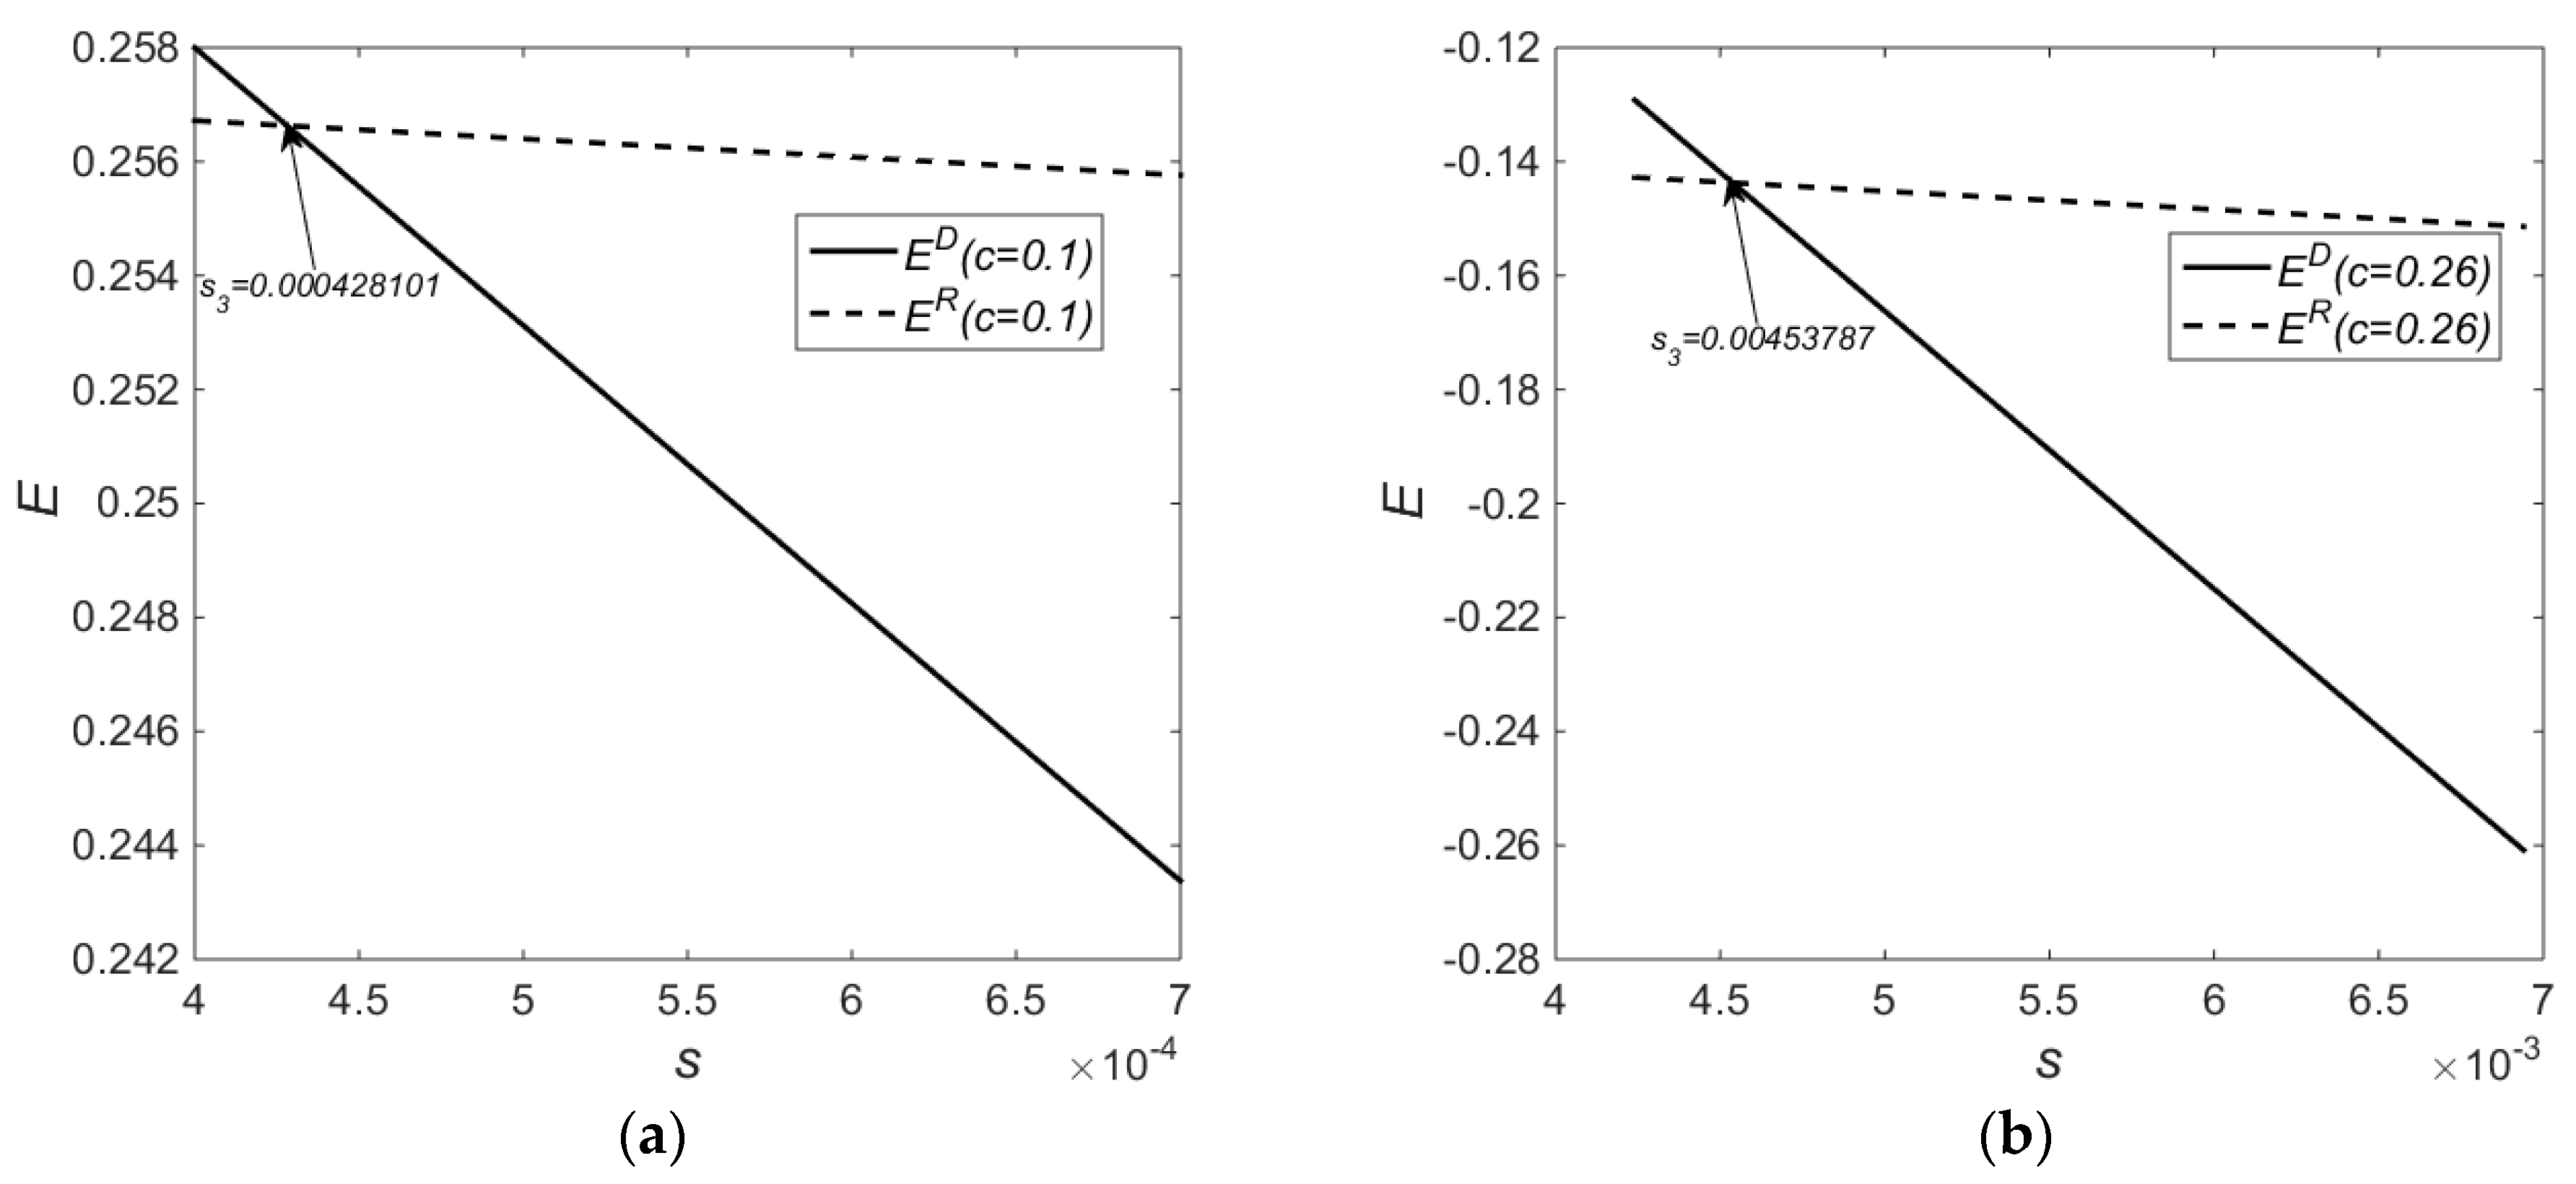
Figure 3 shows the impact on environmental benefits by different subsidy levels. When the subsidy level is sufficiently low, the environmental benefits under Policy
D are inferior to those under Policy
R. When the subsidy level reaches
, the environmental benefits under Policy
D are superior to those under Policy
R. It is worth noting that when the costs of new products are very high (
) and the costs of remanufacturing is very low (
), the quantity of new products decreases, the quantity of remanufactured products increases, and remanufacturing gains benefits more significantly. This paper assumes that the quantity of EOL products is sufficient in the market, so the quantity of remanufactured products may exceed the quantity of new products in the numerical analysis of the example. As a result, both subsidy schemes generate enhanced environmental benefits after remanufacturing is introduced.
Concluding from
Figure 1,
Figure 2 and
Figure 3 collectively, at a low-cost level and in the subsidy range
, there exists a win-win scenario of economic and environmental benefits under Policy
R as compared to Policy
D. At a high cost level and in the subsidy range
, there exists a win-win scenario of economic and environmental benefits under Policy
R as compared to Policy
D. At a low-cost level and in the subsidy range
, there exists a win-win scenario of economic and environmental benefits under Policy
D as compared to Policy
R. Finally, at a high cost level and in the subsidy range
, there exists a win-win scenario of economic and environmental benefits under Policy
D as compared to Policy
R.
7. Conclusions
In previous studies, the value of remanufactured products was realized only through resales. Real life practice shows that the value of remanufactured products can also be realized through social donations. To encourage and support the remanufacturing of EOL products, this paper considers two incentive policies (government subsidies for resales of remanufactured products and for donations of remanufactured products). We build a two-stage game model involving both government and OEM which is specific to the two incentive policies, and calculate the equilibrium solutions to analyze the impact of the two subsidy schemes on the OEM’s production decisions, and environmental and economic benefits. From the perspectives of economic, environmental and social benefits, we examine how to choose incentive policies and determine the optimal subsidy range.
The research findings of this study are summarized as follows. First, under the two incentive policies, the effectiveness boundary of government subsidies is different from each other, while there exists a common subsidy range . Second, when the government subsidizes the resales of remanufactured products, the subsidies reduce the sale quantity of new products, and increases the sale quantity of remanufactured products, thus aggravating the market encroachment of remanufactured products on new products. When the government subsidizes the donations of remanufactured products, the subsidies increase the sale quantity of both new products and the donation quantity of remanufactured products, but reduces the sale quantity of remanufactured products, thus alleviating the market encroachment of remanufactured products on new products. Third, government subsidies for donations of remanufactured products reduce the sale quantity of remanufactured products, but increases the total quantity of new products and remanufactured products. Fourth, at a low level, government subsidies for resales of remanufactured products generate a win-win scenario of economic and environmental benefits within a certain subsidy range. At a high level, government subsidies for donations of remanufactured products generate a win-win scenario of economic and environmental benefits within a certain subsidy range. Fifth, for government subsidies for resales of remanufactured products, there exists a unique optimal subsidy range; governments will always provide subsidies regardless of the degree of external environmental impact of products. When the benefits from the donations of remanufactured products meet the condition , there exists a unique optimal subsidy level regarding the subsidies for donations of remanufactured products. In addition, government subsidies are not necessary unless the external environmental impact of the non-recycled products is significant enough. Sixth, when the external environmental impact of products is significant enough, government subsidies for donations of remanufactured products improve social welfare more than government subsidies for resales of remanufactured products. When the external environmental impact of products is not significant enough, the social benefits () from the donations of remanufactured products determine which incentive policy will improve social welfare.
A two-stage Stackelberg model is built and solved based on complete information. Problem analysis will become more complex if incompleteness of information is assumed in the model. Meanwhile, this paper only considers the OEM’s single-period decisions. New findings will be obtained if the Stackelberg model considers two-period and multi-period decisions as well as the constraints of remanufacturing. This will be further investigated in our subsequent research.


