Mechanisms of Phosphorus Removal by Recycled Crushed Concrete


School of Architecture, Building and Civil Engineering, Loughborough University, Loughborough, LE113 TU, UK
*
Author to whom correspondence should be addressed.
Int. J. Environ. Res. Public Health 2018, 15(2), 357; https://0-doi-org.brum.beds.ac.uk/10.3390/ijerph15020357
Submission received: 9 January 2018
/
Revised: 26 January 2018
/
Accepted: 8 February 2018
/
Published: 17 February 2018
(This article belongs to the Special Issue Municipal Wastewater Treatment)
Abstract
:Due to urbanisation, there are large amounts of waste concrete, particularly in rapidly industrialising countries. Currently, demolished concrete is mainly recycled as aggregate for reconstruction. This study has shown that larger sizes (2–5 mm) of recycled concrete aggregate (RCA) removed more than 90% of P from effluent when at pH 5. Analysis of the data, using equilibrium models, indicated a best fit with the Langmuir which predicated an adsorption capacity of 6.88 mg/g. Kinetic analysis indicated the equilibrium adsorption time was 12 h, with pseudo second-order as the best fit. The thermal dynamic tests showed that the adsorption was spontaneous and, together with the evidence from the sequential extraction and desorption experiments, indicated the initial mechanism was physical attraction to the surface followed by chemical reactions which prevented re-release. These results suggested that RCA could be used for both wastewater treatment and P recovery.
1. Introduction
Concrete is a major construction material which includes significant embedded resources, these include 50% of all the raw materials used and 40% of the energy. After manufacture, the other 50% of the total waste was generated by the concrete industry [1]. Recently, large volumes of demolition concrete waste have been produced due to limited reuse of older concrete buildings. For example in 2014, China produced 1.5 billion tonnes of construction waste; concrete was 34% of this total and only about 5% was reused [2]. This compares with above 50% in developed countries. New and alternative uses for recycled concrete are a priority in China where, traditionally, construction waste has been disposed of in landfills or deposited on river banks. This disposal used large areas of land as well as causing environmental nuisance and complaints.
There has been previous work on using recycled concrete aggregate (RCA) for water treatment and one of the most researched applications has been as a filter media due to its surface roughness and desirable chemical content (e.g., Mg, Ca, Fe, Al). Li et al. (2007) [3], for example, used fly ash aerated crushed concrete at laboratory scale to achieve 95.6% total nitrogen removal from sewage and landfill leachate. Guo et al. (2009) [4] also used RCA as a wastewater filter and showed it could remove 37% of COD and 55% of total P. The mechanism has been reported to be based on the calcium, aluminium, and iron content which can bind with phosphate [5]. Phosphorus (P) is needed for optimum crop production and mineral phosphorus reserves are thought to be limited with no substitutes. Research in both the U.S. and Europe has shown mineral P resources may be depleted in a few hundred years and recovery of P is urgent to maintain agricultural productivity [6]. Furthermore, removal of P from wastewater to meet environmental quality standards is now a significant cost in chemicals and power, complementing the benefits of recovery, particularly in China [7]. RCA is a lime enriched material, widely available and potentially a sustainable method for P recovery. Other work on P adsorption from wastewater has been reported by Xiang et al. (2013) [5] who suggested RCA could be suitable and sustainable for adsorbing low phosphate concentrations from wastewater. They also reported that the RCA did not re-release P or metals during sludge treatment. RCA has also been used for pH correction of acid wastewaters because of its weakly alkaline properties [8,9]. Instead of using concrete particles, others have used reconstituted concrete blocks. Chen (2001) [10] designed a wastewater treatment system based on concrete blocks. He operated the media as a submerged aerated filter and reported removals of 50% of COD and BOD, 70% of TP, and 20% of TN. Yuan et al. (2006) [11] published results from wastewater using reconstituted concrete blocks, known as eco-blocks which removed 76% of COD and 94.9% of BOD5. Japanese researchers have proposed that concrete blocks have greater porosity and provide a larger internal and external surface area for microorganisms [12].
Upon review of the previous literature, there are few well-controlled experiments on the detailed removal mechanisms or reproducibility of P adsorption by either RCA or blocks. Similarly there is little theoretical information on how to design P adsorption systems based on the common adsorption isotherms or reaction kinetics. The aim of this study was to determine the process of P adsorption by RCA. This was achieved by several batch tests with a mechanistic isotherm model. Also, the kinetics and thermodynamics studies were involved to further explain the adsorption mechanism. A novel study of P speciation was carried by sequential extraction. It is first time reported the type of P contained in RCA. This study could contribute to new usage of RCA.
2. Materials and Methods
2.1. Sorption Studies
Batch experiments were used to evaluate optimum operational conditions for phosphorus adsorption by RCA and data was analysed using adsorption isotherms, kinetics, and thermodynamics. The studies carried out are summarised in Table 1.
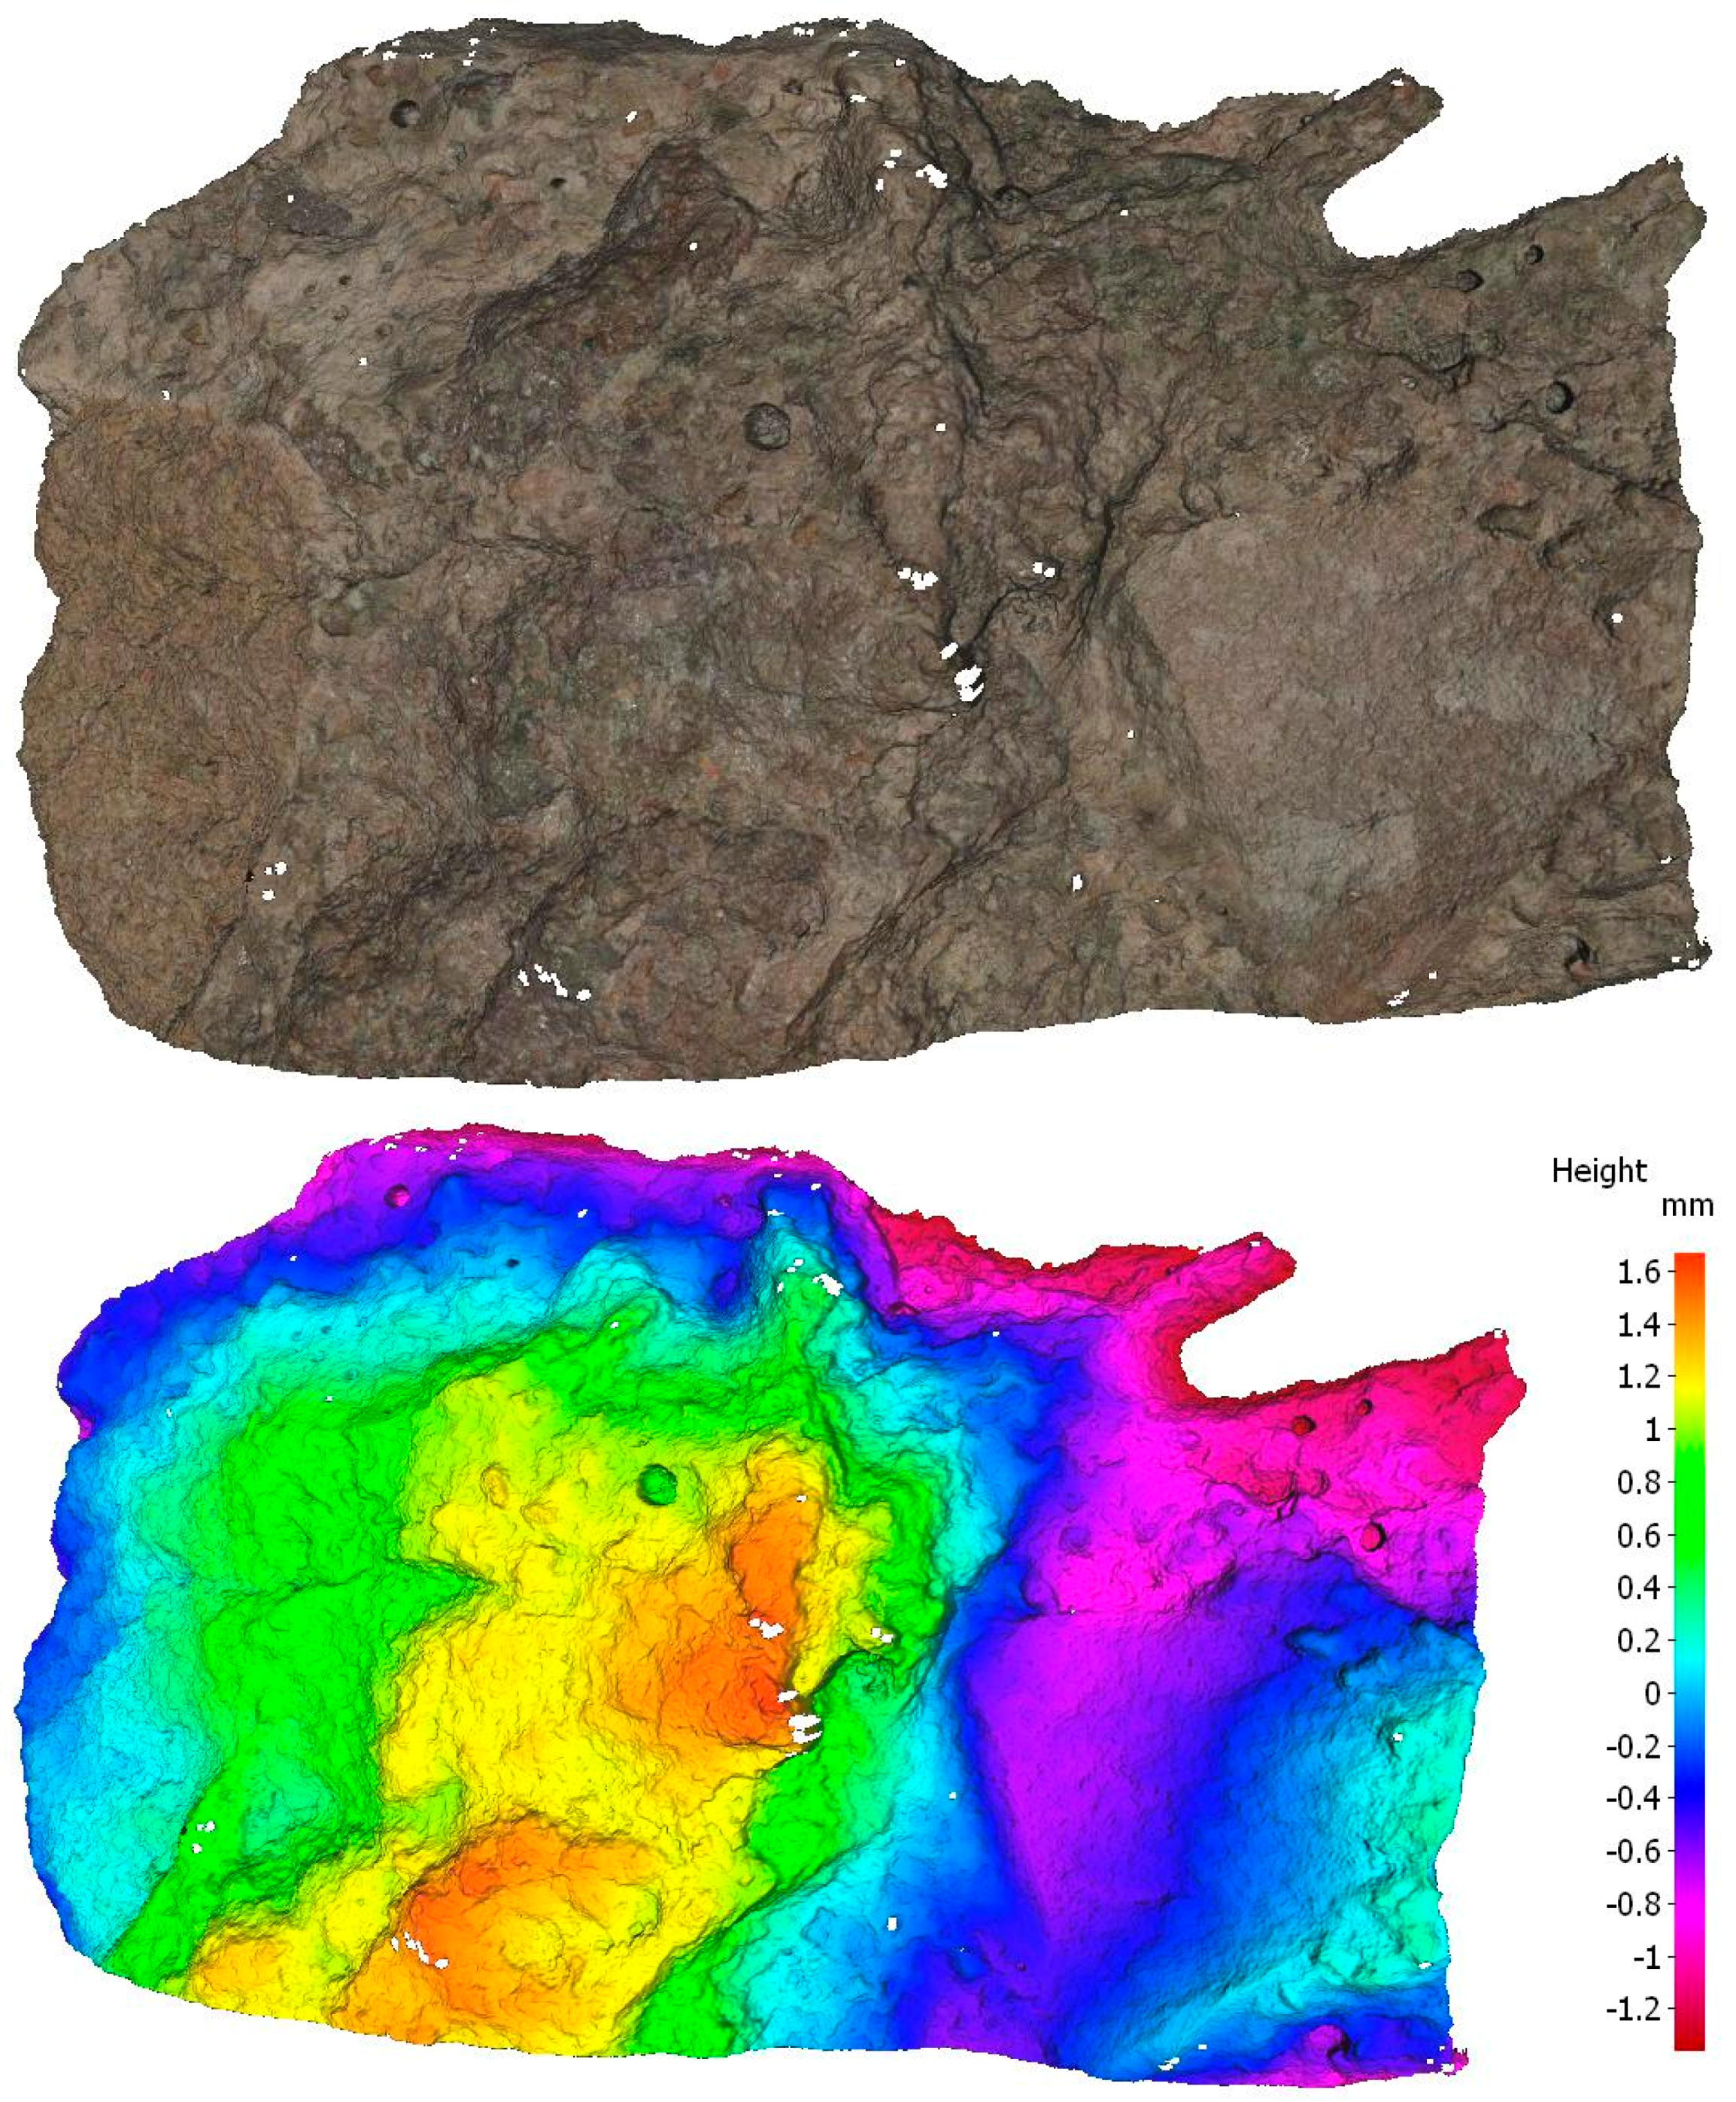
Before the experiments, all the glassware and plastic devices were soaked in 10% nitric acid solution for 1 day and then rinsed before each test with 250 mL deionised water. Sieved (2–5 mm) and manually hammered RCA was used for the experiments. RCA was also scanned by an infinite focus microscope (Alicona) (see Figure 1). An infinite focus microscope can quantitatively measure surface texture or deviations in a surface character. Figure 1 shows RCA has a crude surface, which indicates more adsorption sites. The specific surface area of RCA was also identified as 35 m2/m3. The RCA was examined by EDS (ED3000) and composed of 56% oxygen, 18% Si, 10% Carbon, 10% Ca, 2% Al, 2% K, and 1% Mg. Erhlmeyer flasks, with measured amounts of dried RCA media were used with 100 mL of a known P concentration as a solution of Potassium orthophosphate. The flasks were run in a thermostatically controlled orbital shaker for the defined periods (Table 1). By operating the shaker at various temperatures (Table 1), the data could be used to determine thermodynamic parameters. The pH of the solution was altered using a pH meter (HANNA HI9812-5) with either 0.1 M HCl or NaOH. The final solutions were filtered by a 0.45 µm membrane filter and dissolved concentrations of P were determined by Inductively Coupled Plasma analysis (Shimadzu ICP-9000) according to the international standard method [13]. All tests were conducted in triplicate. The amount adsorbed was calculated using the formula below:
where is the adsorption capacity (mg/g), is the initial concentration of solution (mg/L), is the concentration after adsorption (mL/L), W is the weight of adsorbent (g) and V is the volume of solution (L).
2.2. Desorption of P
The P-treated RCAs from the previous experiments, with 2 g of RCA, were elutriated with 100 mL deionised water in Erhlmeyer flasks. Tests were conducted in triplicate for 24 h mixing and residual P concentration analysed as before.
2.3. Fractionation of Inorganic Phosphorus
Sequential extraction to analyse the various P-forms was used to identify the chemical reaction that occurred between the surface of the media and the P solution. Analysis of the P species was first reported by Dean (1938) [14] in soil complexes. Dean defined two types of P according to whether they were extracted by acid or alkali. Chang and Jackson (1957) [15] refined this by using four extraction solutions: loosely bound phosphate (LBP), aluminium phosphate (Al-P), iron phosphate (Fe-P), calcium phosphate (Ca-P), and occluded phosphate (O-P). Most procedures for P characterisation are based on the Chang and Jackson (1957) method with modification or improvements. Normally, Ca and Mg-P are extracted together by HCl [16,17,18]. The Ca-P amount was determined separately and the Mg-P by subtraction. The modification of the Chang and Jackson (1957) [15] and Hartikainen (1979) [19] method was used (see Table 2). After the standard adsorption test, 2 g RCA was used and the analysis was carried out in triplicate.
3. Results and Discussion
3.1. Sorption Studies
3.1.1. Effect of pH of Solution on Sorption
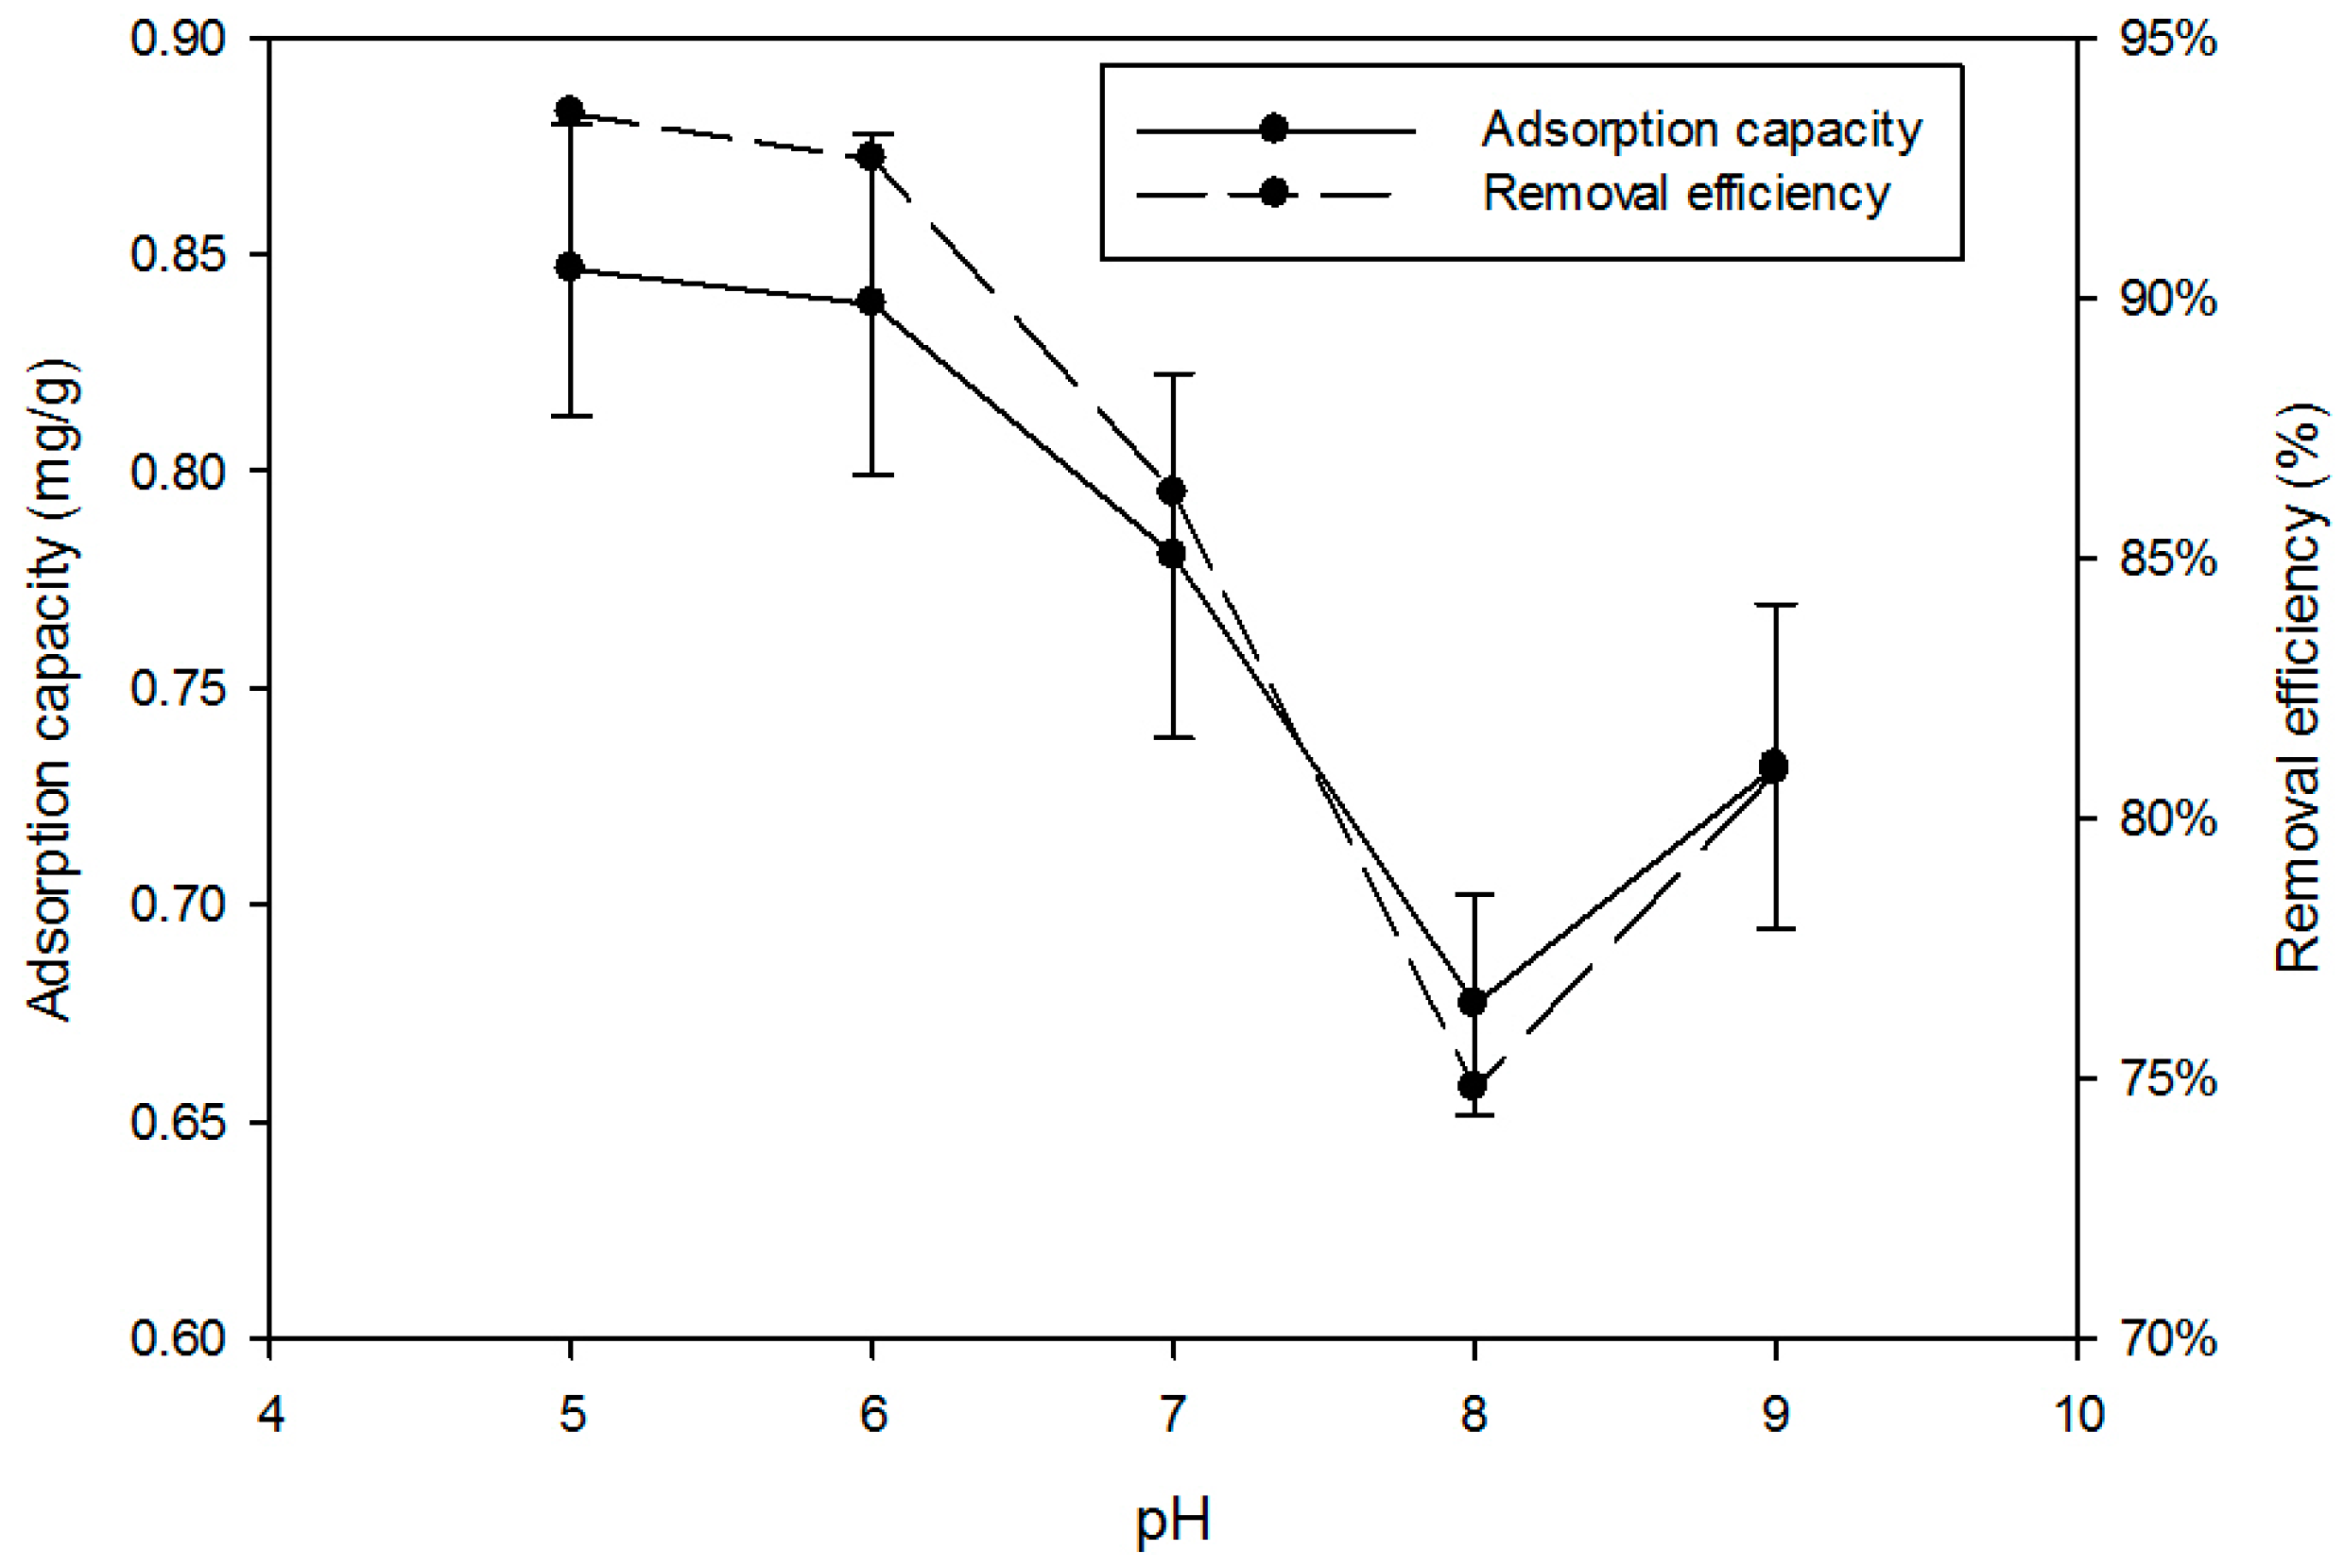
The best adsorption was observed at pH 5.0, when the adsorption capacity of P was 0.85 mg/g and removal reached 93.5% (Figure 2). The trend shows a decline in P adsorption with increasing pH to the lowest capacity at pH 8.0. Agyeia et al. [21] also pointed out acidic pH was best for P removal. There are two possible mechanisms, one has been attributed to the double layer effect whereby acidic H+ was attracted to the concrete surface by Ca, Al, and Mg hydroxide content creating a secondary positive layer to bind the negative orthophosphate. The second possibility was that the phosphate ions could be converted to their acidic forms (e.g., and ) binding to the positive surface. The amount of these phosphate ions generated would be proportional to the acidity of the solution. The acidic pH could also help the cement release more Ca2+ ions into the solution to react with the hydrogen phosphate causing deprotonation and precipitation of Ca3(PO4)2. The increase in P removal above pH 9 could be due to a similar mechanism but from the formation of OH enriched complexes precipitating calcium phosphate.
3.1.2. Effect of Dose of Sorbent on Phosphorus Sorption
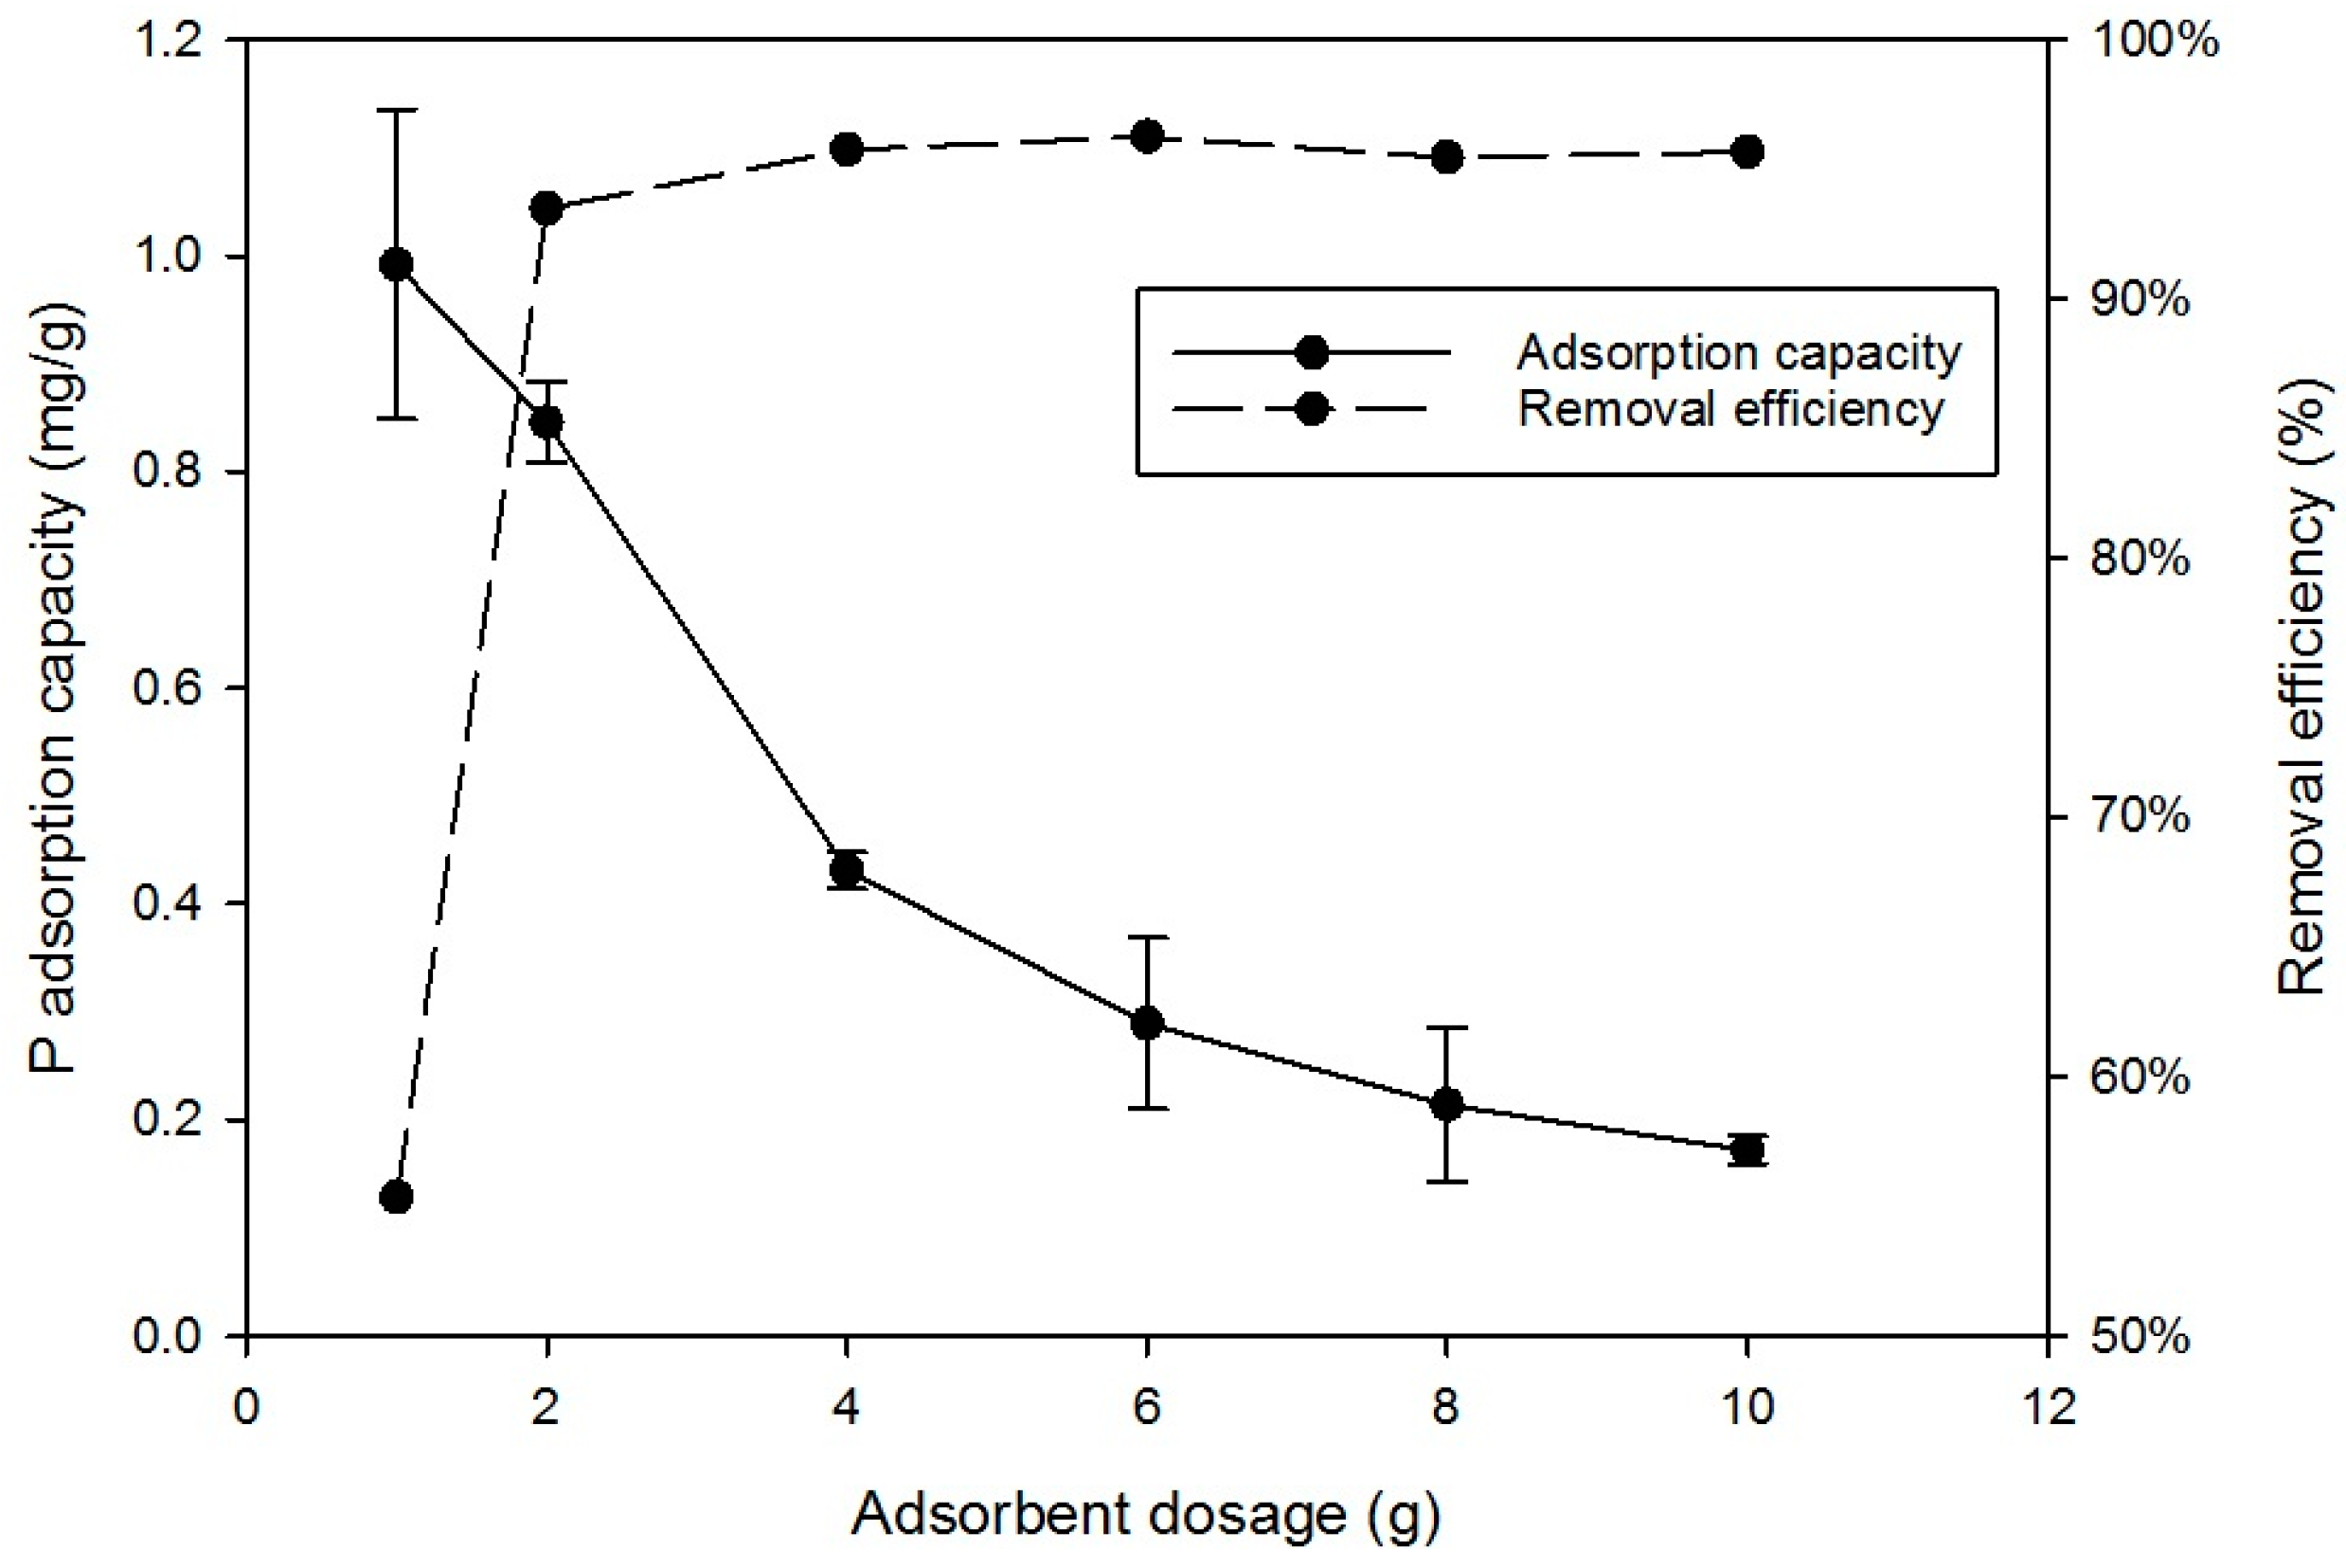
In this experiment, the optimum pH 5 was used and the results in Figure 3 show the amount of P adsorbed was proportional to the amount of RCA added. At the lowest dose (1 g), P removal was 55.5% but 2 g removed 95% of P, similar to the maximum achieved. The normalised adsorption capacity reduced with increasing RCA from 0.99 to 0.17 mg/g, as added RCA was increased from 2 to 10 g. Similar trends have been also reported by other authors [22,23]. Increasing the dose of sorbent increased the total removal of P by increasing the availability of sorption sites. Specific adsorption capacity is a measure of the amount of P bonded by a unit weight of sorbent. The competition by ions for the sites caused a decrease in the specific uptake once all the sites were filled and adsorption capacity decreased with increments in sorbent dose. The simpler models assume a fixed number of adsorption sites according to the molecular structure and the number of positive ions responsible for the binding.
3.1.3. Effect of Initial Phosphorus Concentration
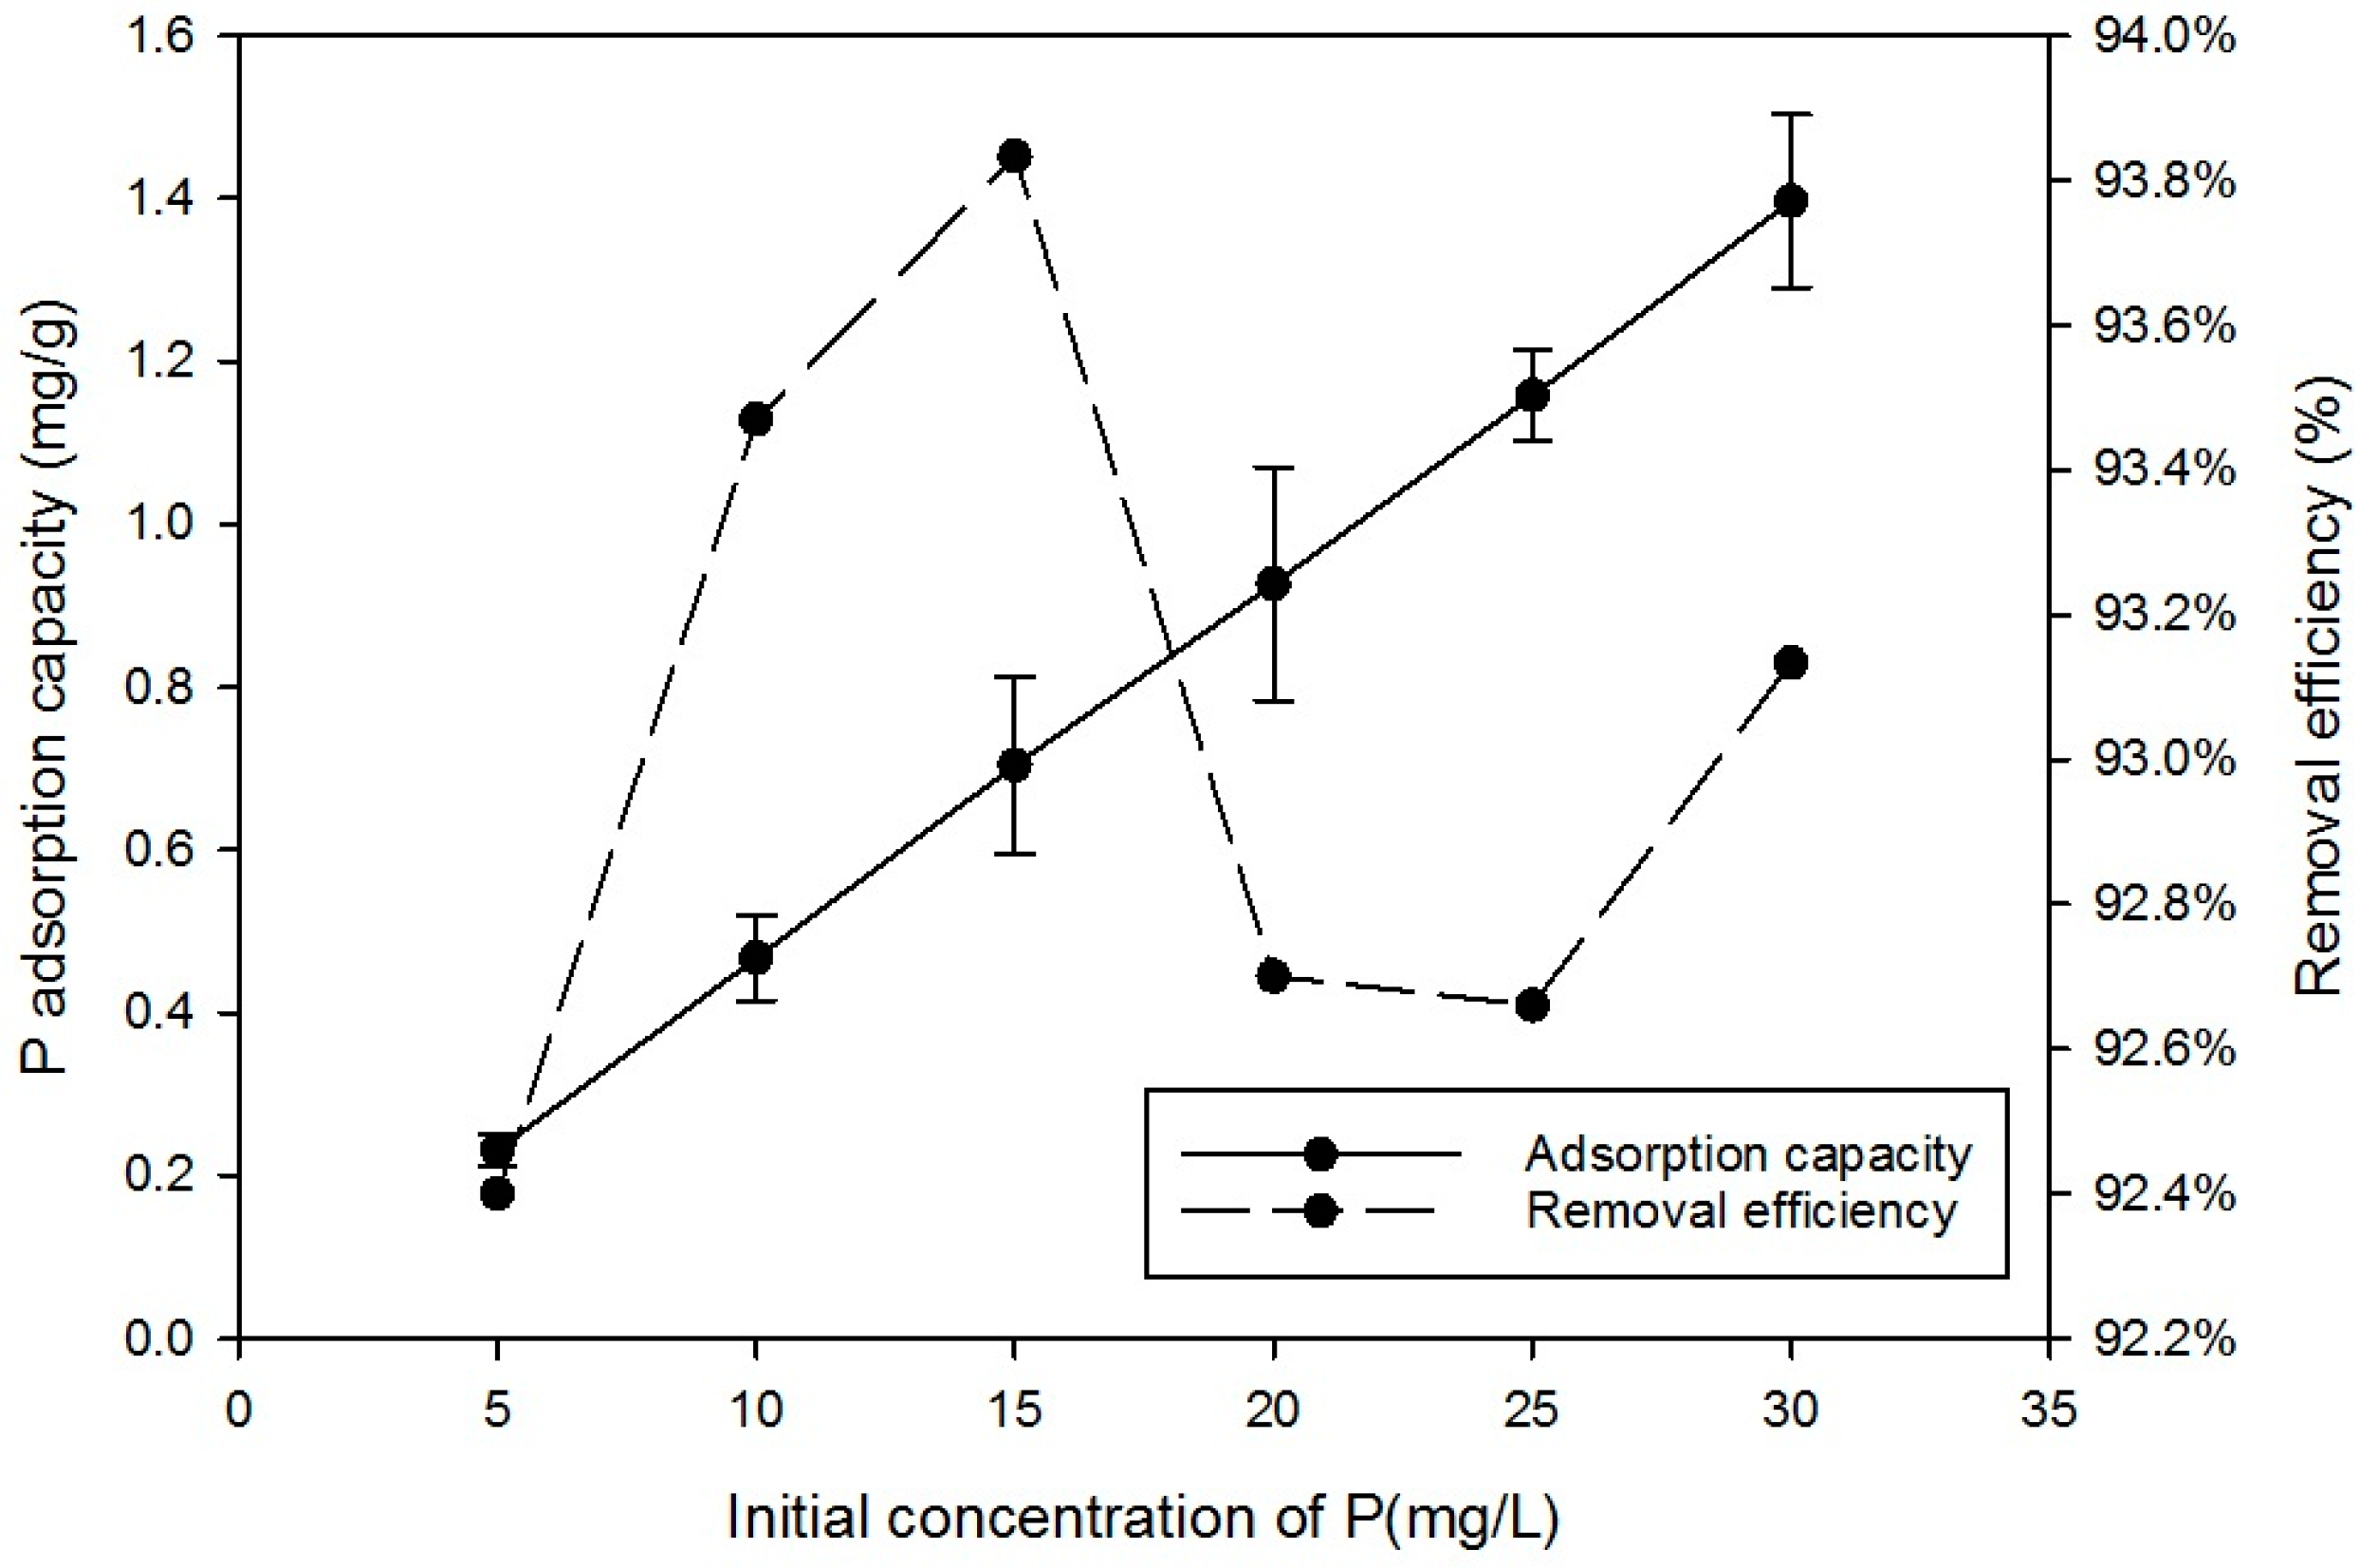
Figure 4 shows that the initial concentration of P in the solution influenced the equilibrium uptake of P achieved. The adsorption capacity increased linearly with the initial P concentration from 5 to 30 mg/L, but the proportion of P removed reached maximum at an initial concentration of 15 mg/L. This suggests the simple, single layer, fixed number of adsorption sites model may not be suitable at higher P concentrations. This is in line with previous equilibrium adsorption capacity experiments, which suggest that higher solute concentrations could encourage other mechanisms such as greater boundary concentrations which in turn lead to double layer adsorption and complex formation [23,24].
3.1.4. Equilibrium Studies
The equilibrium equations are shown in Table 3, and were used to determine the mechanisms of adsorption. The Langmuir and Freundlich isotherms gave the best fit (presented in Table 4), the Langmuir showing a maximum adsorption capacity of 6.88 mg/g. The Langmuir is the simplest isotherm, based on monolayer sorption onto a surface with a finite number of identical sites, homogeneously distributed over the sorbent surface. Others have also reported that the Langmuir isotherm was the more robust when modelling complex aqueous mediums. The Frumkin and BET equations were introduced as extensions to the Langmuir isotherm, the Frumkin to take account of solute–solute interaction at a non-ideal surface [25]. The BET was introduced to model multi-layer adsorption but, except for the first layer, it also assumes equal energies of adsorption for each layer and no interactions between layers [26]. The linear correlation of both the Frumkin and BET are weaker than the Langmuir (Table 4). The Freundlich equation included empirical constants as an acceptance that the adsorption sites were heterogeneous. The Temkin and the Dubinin-Radushkevich (D-R) adsorption equations are based on the thermodynamics of adsorption. The Tempkin is based on the principle that adsorption reduces the energy or heat in the adsorbed layer and the D–R on a Gaussian energy distribution as expected from a heterogeneous surface. The D–R model was reported to be suited to high and medium concentration solutions such as these P adsorption experiments [27]. The adsorption energy (E) derived from the D–R model can be used to predict adsorption mechanisms. Typical results are between 1–16 kJ/mol with E values lower than 8 kJ/mol indicating physical sorption [28]. In this study, E was calculated to be 2.24 kJ/mol, which would therefore be considered as physical adsorption.
Previous filtration studies using cement or concrete have been summarised in Table 5. The majority of these studies used finer particles (>1 mm) to adsorb P because of the greater surface area and consequent adsorption capacity available from smaller sized particles. The aerated concrete had the greatest surface area and gave the largest adsorption capacity. It was reported as too fragile for water treatment however, and small media would also be vulnerable to clogging and wash out, giving high operating costs. The results of this study suggest larger sizes could be used as a compromise for wastewater treatment. The cement studies—by Zheng et al. [32] and Renman and Renman [33]—used a similar size as used here (Table 5) but both materials were unstable. Most of these studies have operated under acidic pH (<3) to achieve maximum P adsorption capacity but these acidic conditions would be unrealistic for most wastewaters. This study has demonstrated that concrete demonstrated reliable P removal at a higher pH (pH 5) which could be achieved in the microenvironment of a wastewater filter.
3.1.5. Kinetic Analysis
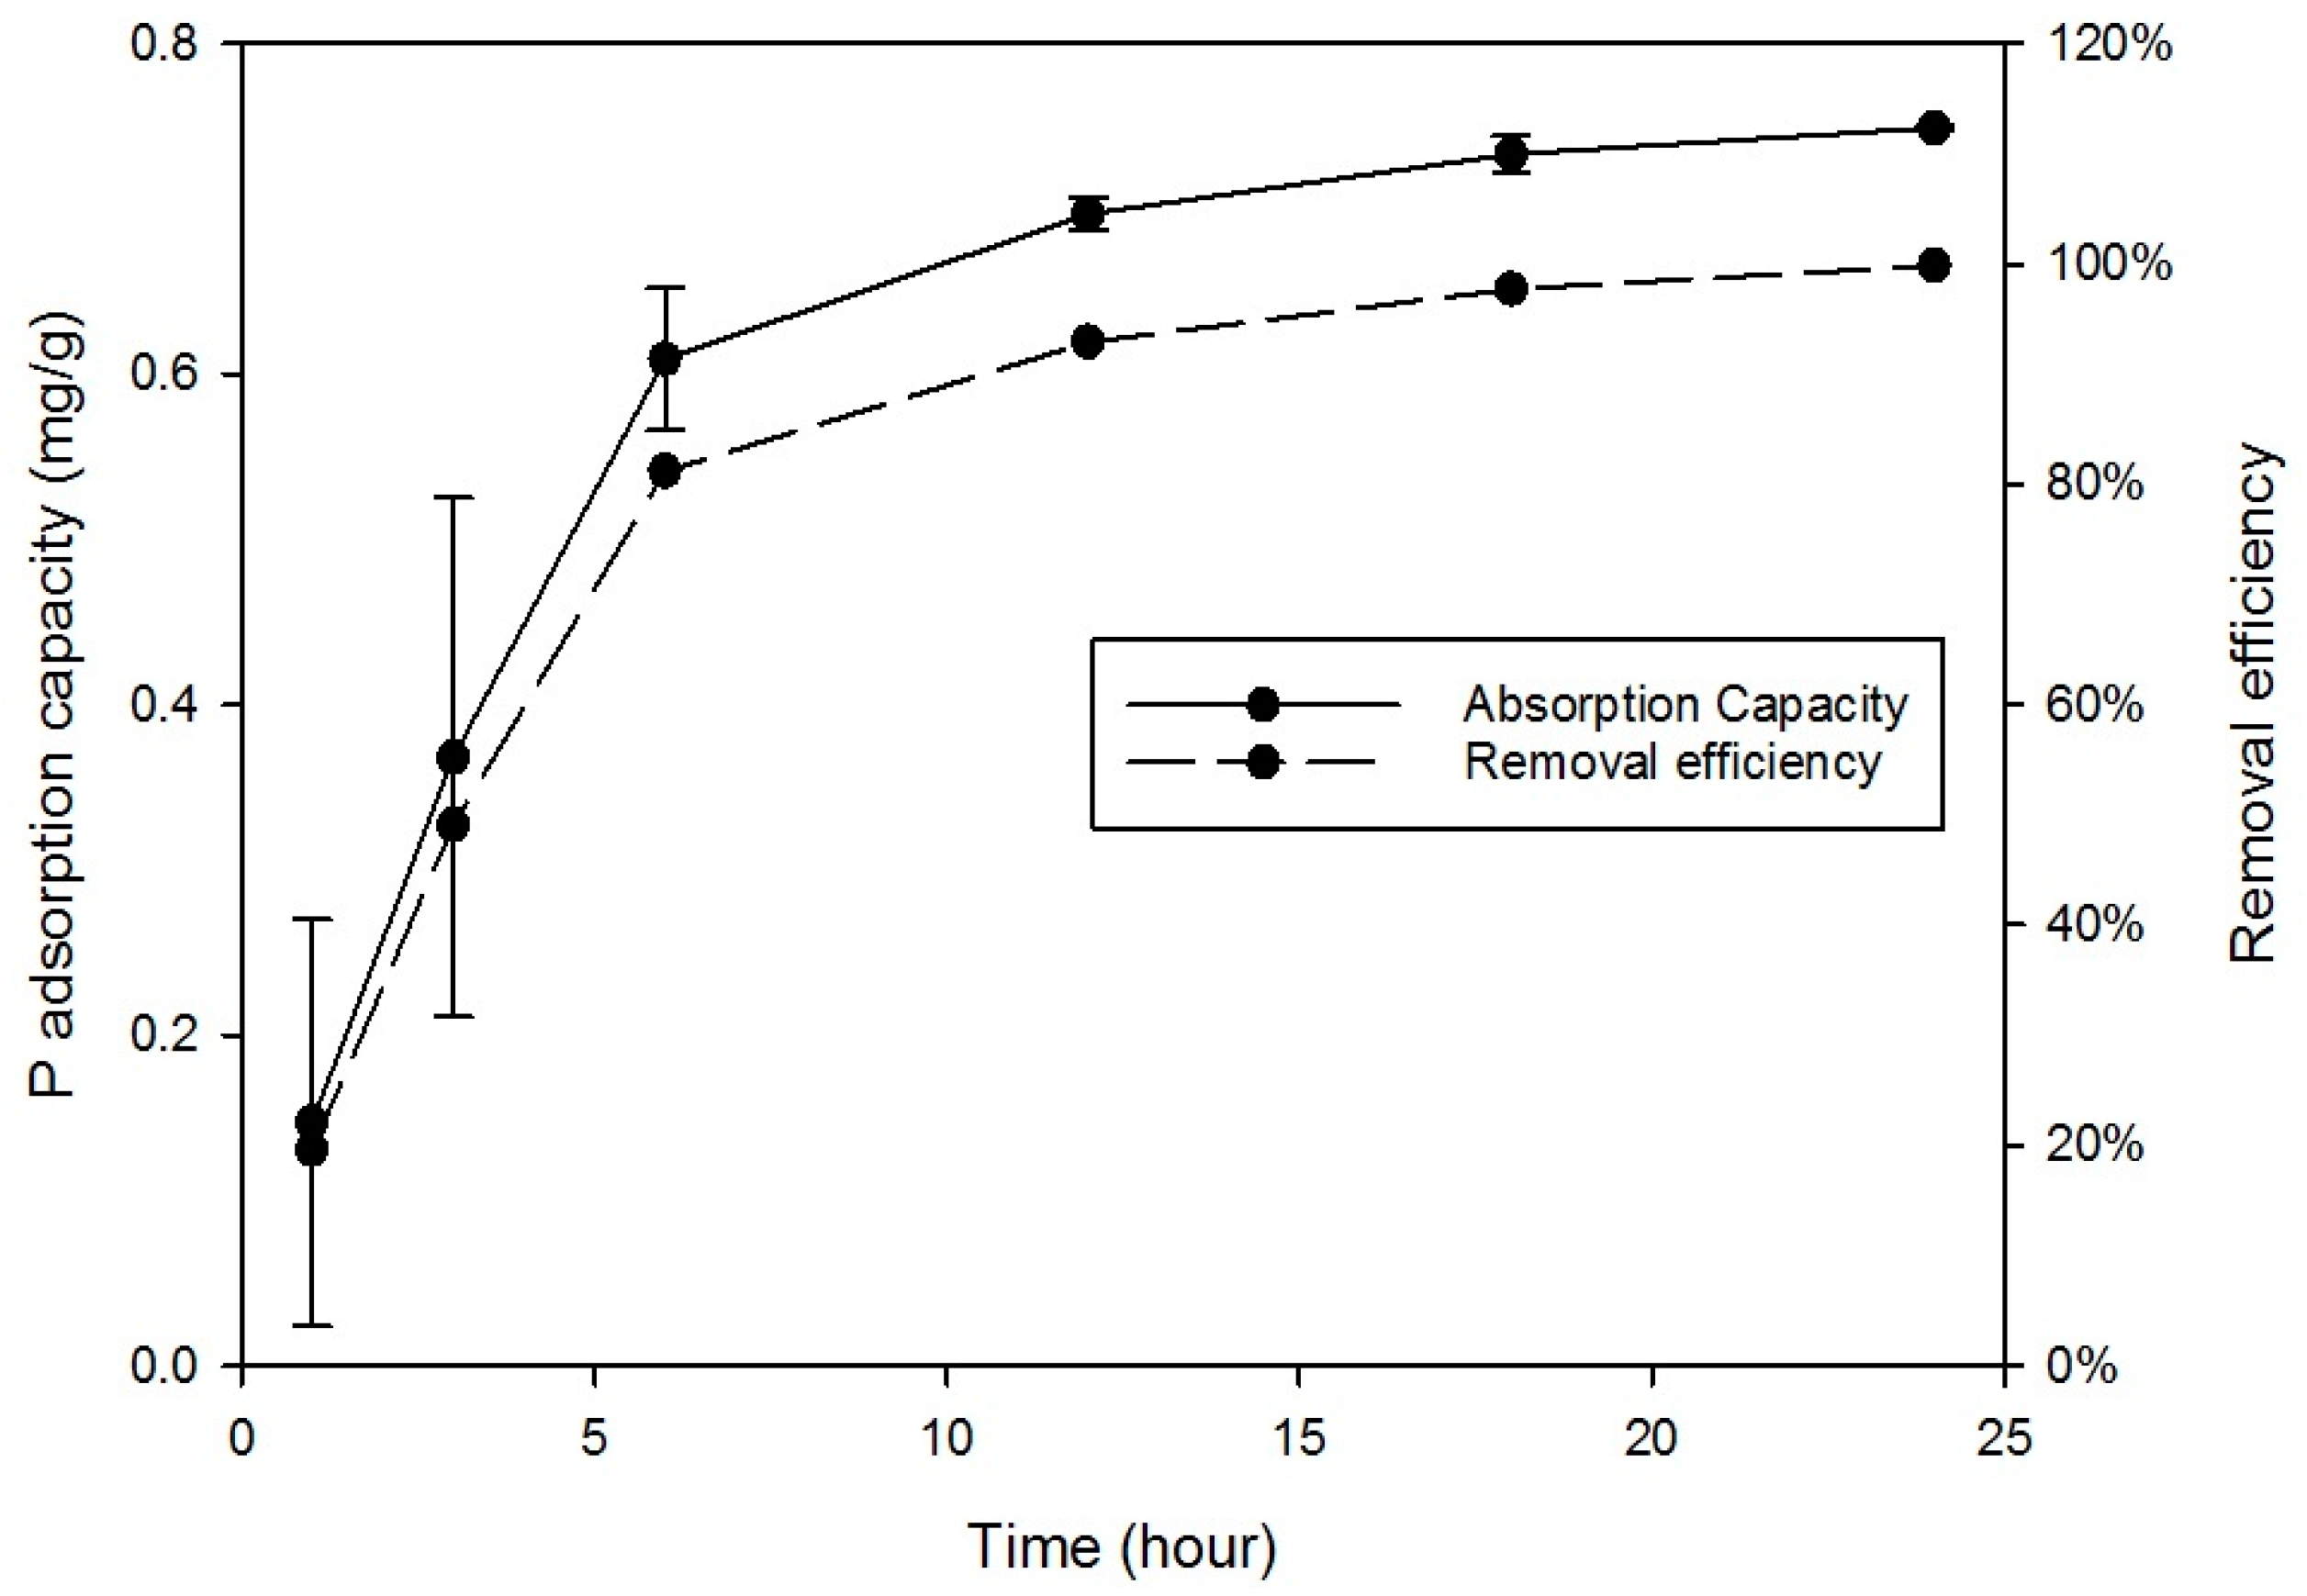
Four kinetic models were also used to analyse the data (Table 6). These were the standard first and second-order equations plus the Fractional power equation which is a modified form of Freundlich. Finally the Elovich equation was used since it had previously been used to study removal by Chien and Clayton (1980) [38]. The results and correlation coefficients (R2) are summarised in Table 7. The best fit was pseudo second-order followed by the first order equation. The experimentally measured adsorption capacity (0.749 mg/g) was between those calculated from the pseudo first- and second-order equations. The experimental results indicated that RCA adsorbed most when at high P concentrations; the calculated maximum capacity suggested adsorption could reach 0.9 mg/g.
Figure 5 shows the adsorption rate and removal efficiency increased until equilibrium was reached at 93% P adsorbed after 12 h and 99% at 24 h. The results were carried out at typical domestic wastewater P concentrations (around 10–15 mg/L) and demonstrated a rate of adsorption likely to be achievable in a wastewater treatment plant without excessive costs.
3.1.6. Effect of Temperature on Sorption
The influence of temperature on the thermodynamics of adsorption (Gibbs free energy , Enthalpy change , and Entropy change () was calculated according to the procedure described by Tosun (2012) [28] as shown in Equations (1)–(3):
where R = gas constant (8.314 J/mol K); T = absolute temperature; b = the distribution coefficient, which was calculated by:
where Ca = equilibrium concentration of P on adsorbent (mg/L). The relation between , and was given by:
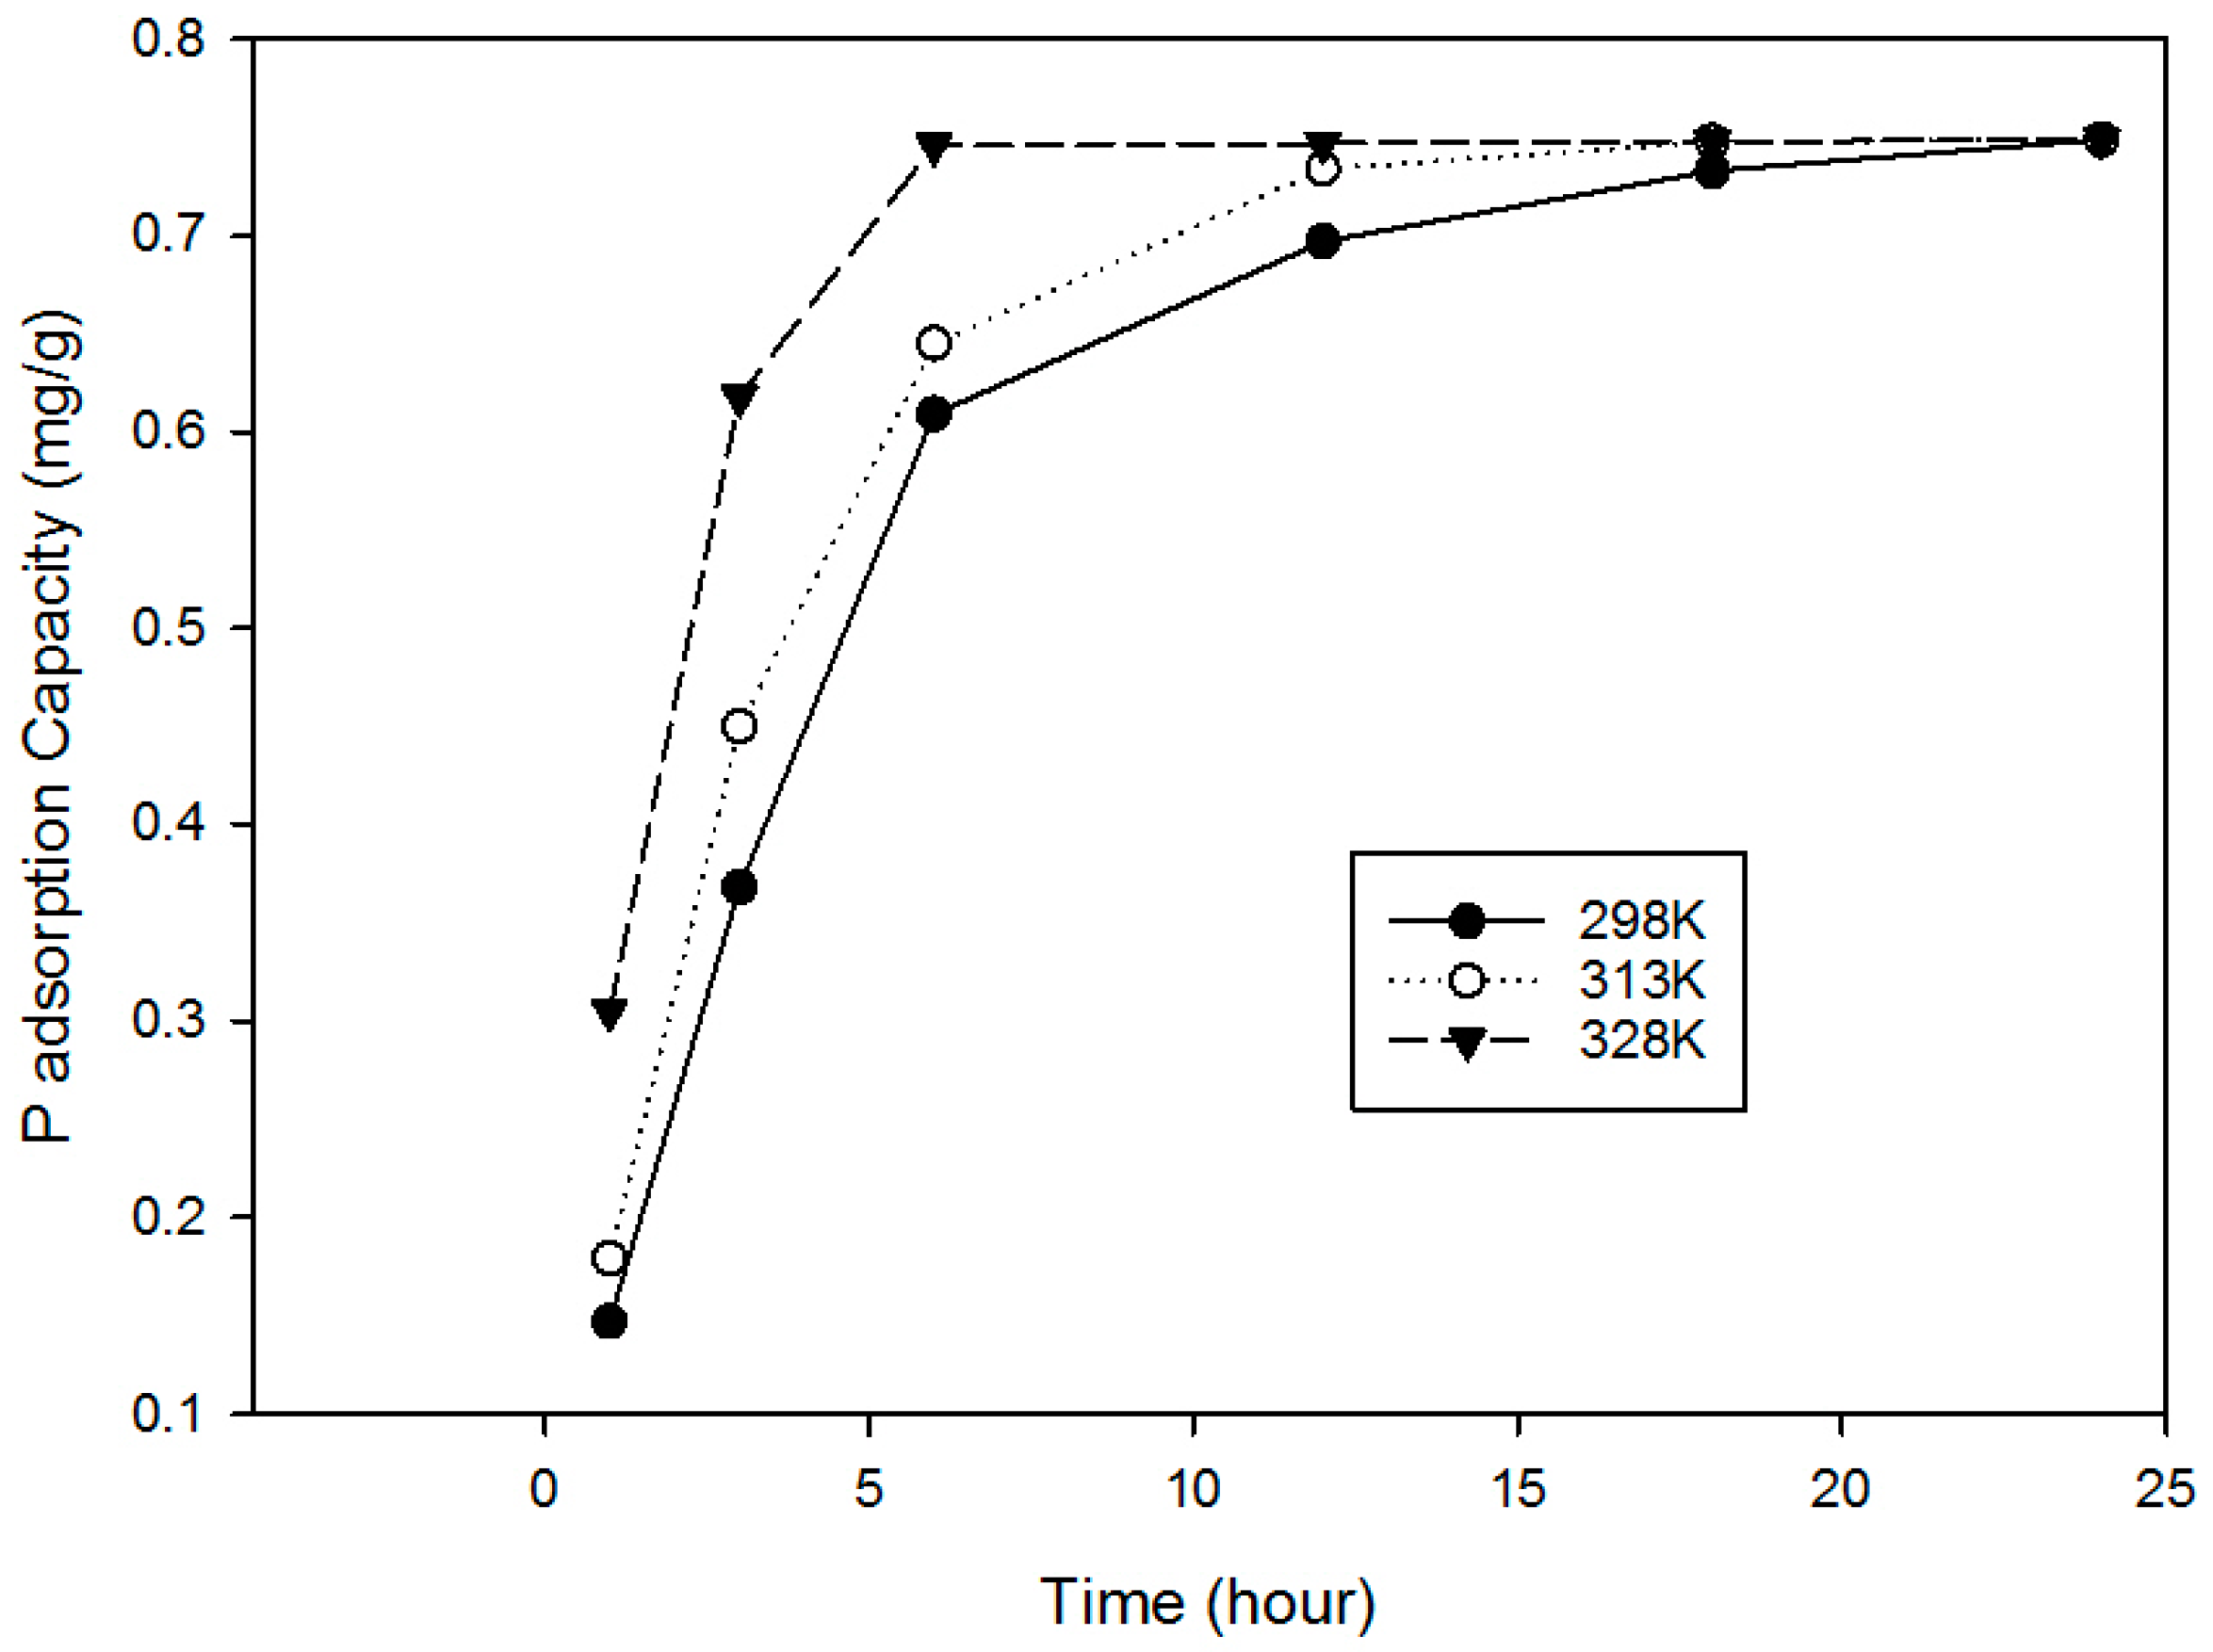
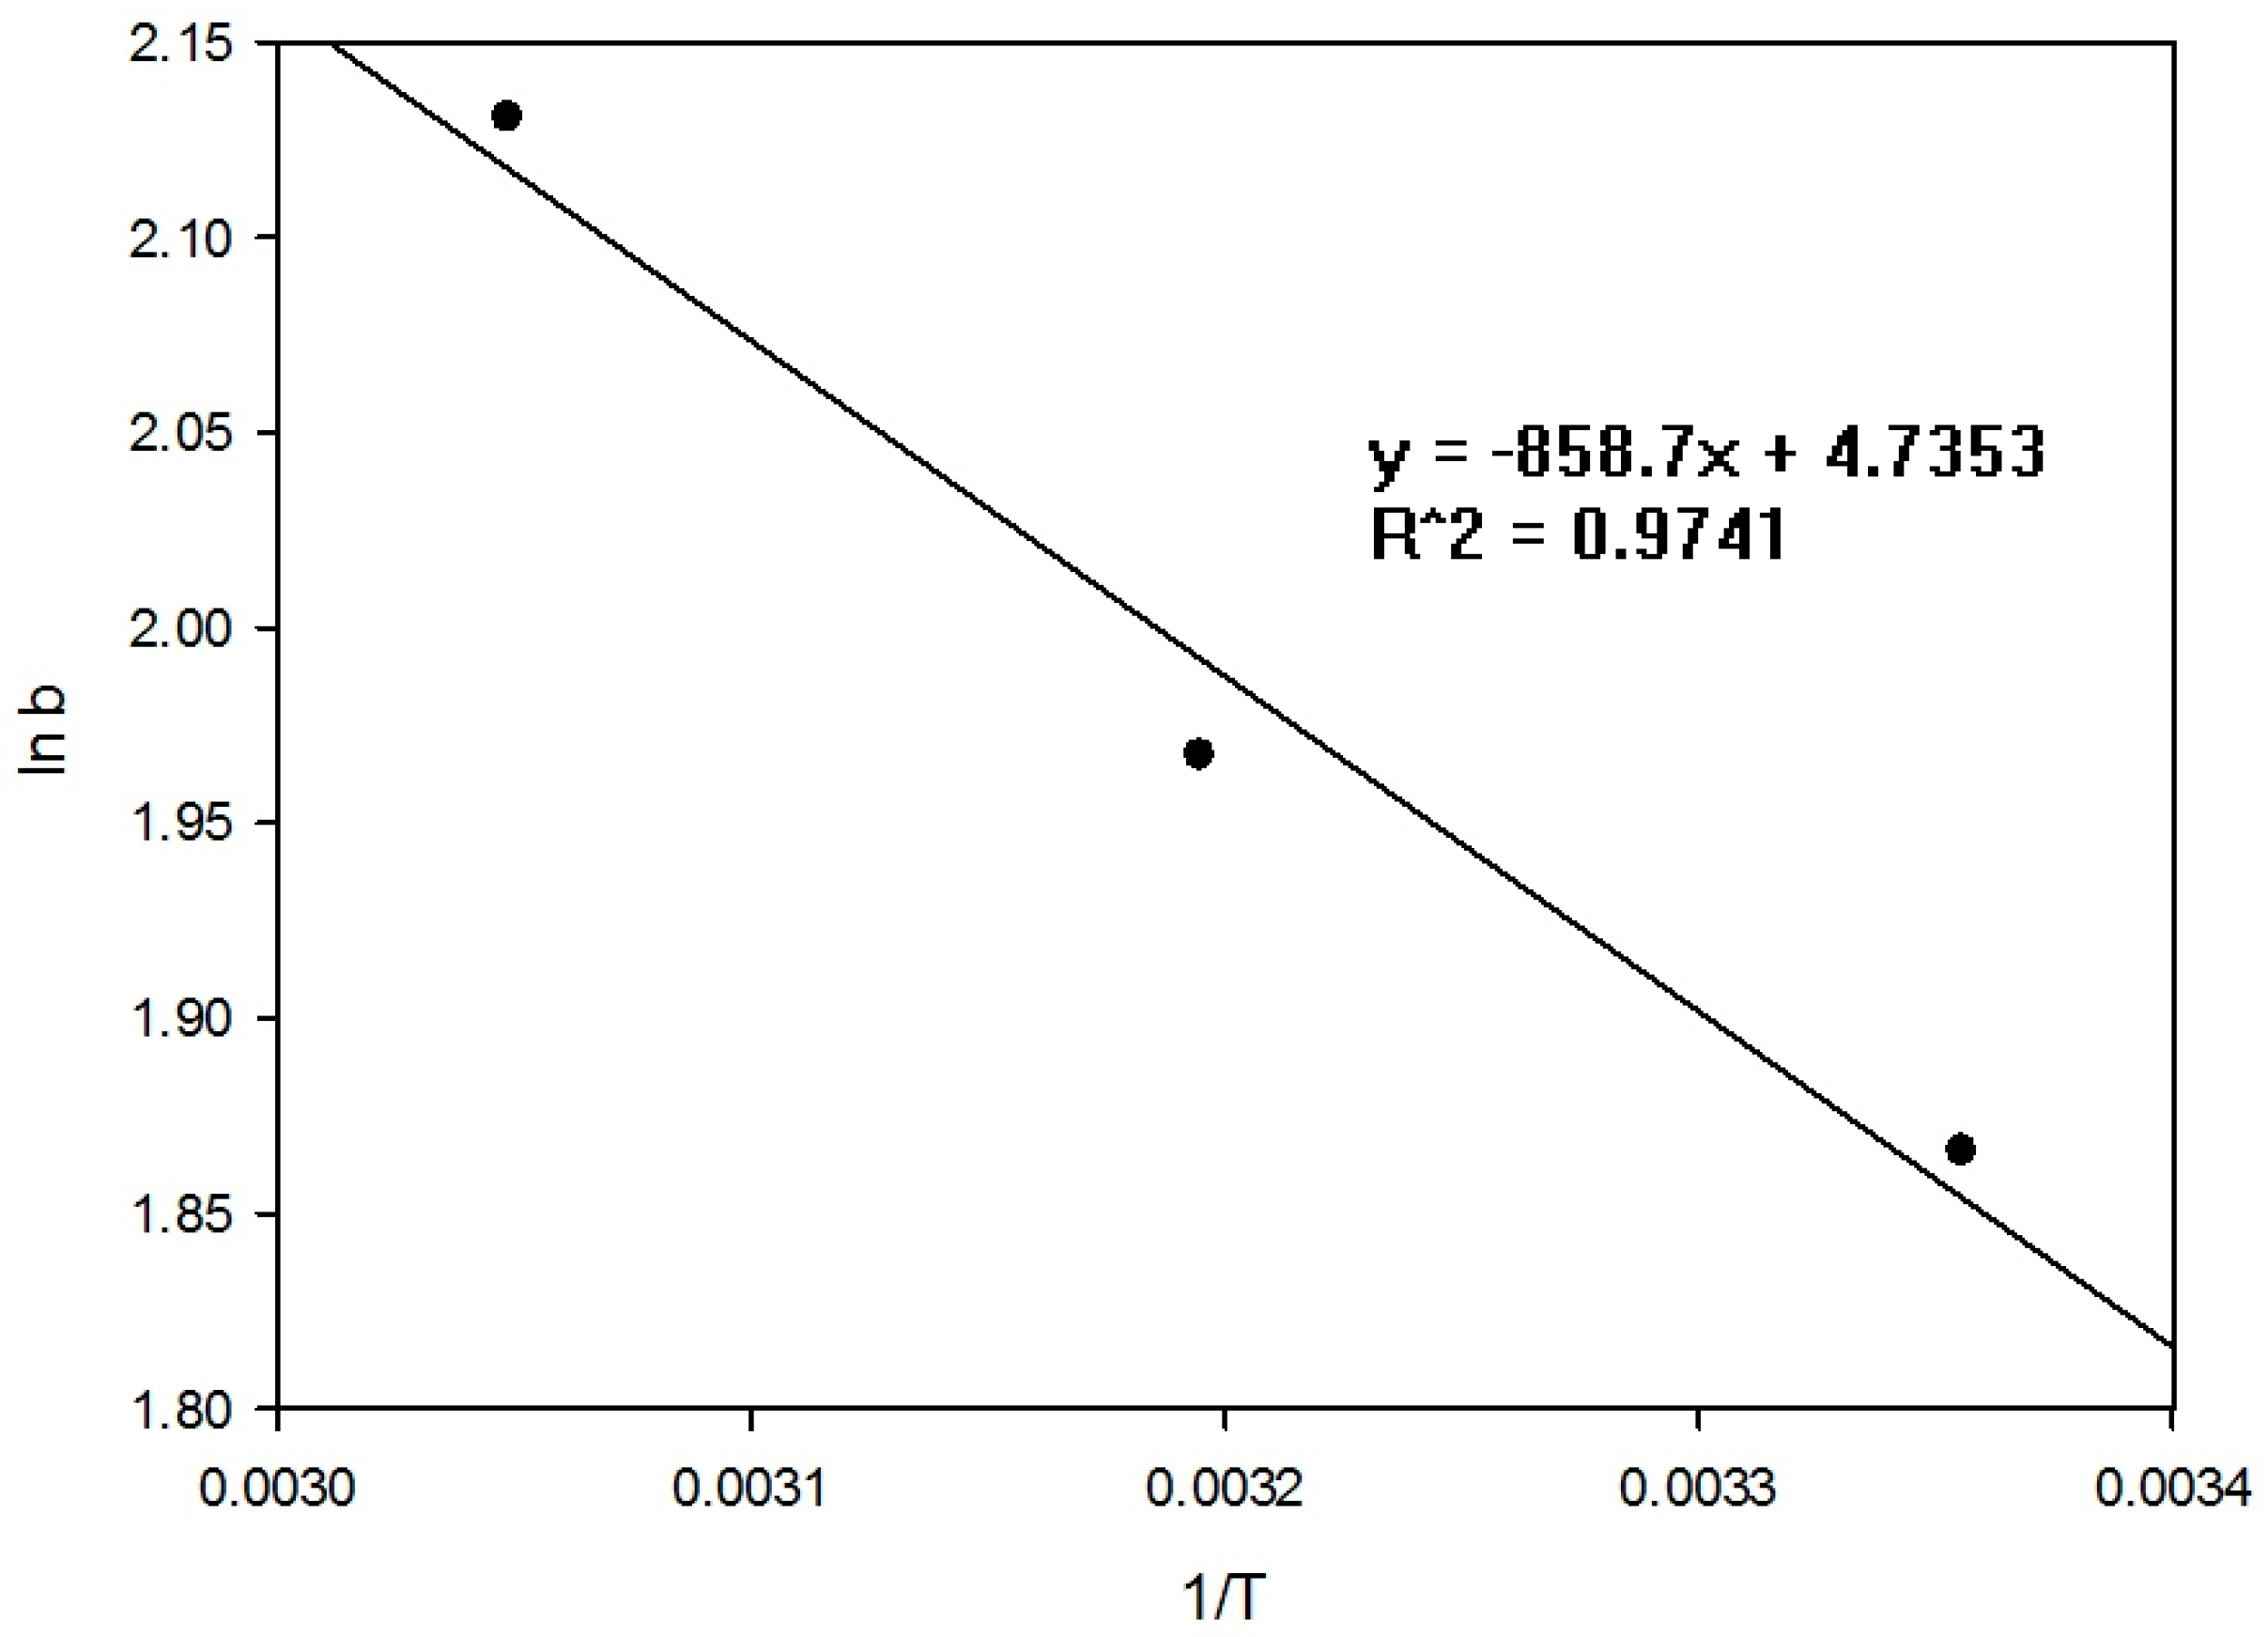
Figure 6 shows that the adsorption of P increased with rises in temperature and that the adsorption process was endothermic. It is suggested that the higher temperature resulted in swelling of the RCA, creating more space for adsorption as well as accelerating molecular diffusion and the chemical reaction. The b value was obtained from vs. and by extrapolating Qe to zero to obtain the intercept value. Results for , and were calculated from the slope and intercept of a plot of ln K vs. (1/T) (see Figure 7).
The thermodynamic parameters are summarised in Table 8. The negative values of indicate spontaneous adsorption of P on the RCA and the decreasing values of confirm the experimental data showing acceleration at higher temperatures. The is positive and less than 20 kJ/mol, while the value of is less than 20 kJ/mol, indicating the adsorption process is physical [41]. It has been suggested that the positive value of is due to the release of the water from phosphate as it is adsorbed onto the surface to increase the degrees of freedom and entropy of the system [42,43]. Other thermodynamic sorption studies for P are summarised in Table 9. The free energy range of RCA was similar to dolomite and activated carbon. Adsorption to these natural materials were also spontaneous, endothermic, and with increased entropy. The similarity to activated carbon also suggests non-specific adsorption sites corroborating the results from the isotherm and kinetic studies.
3.2. Desorption of Phosphorus
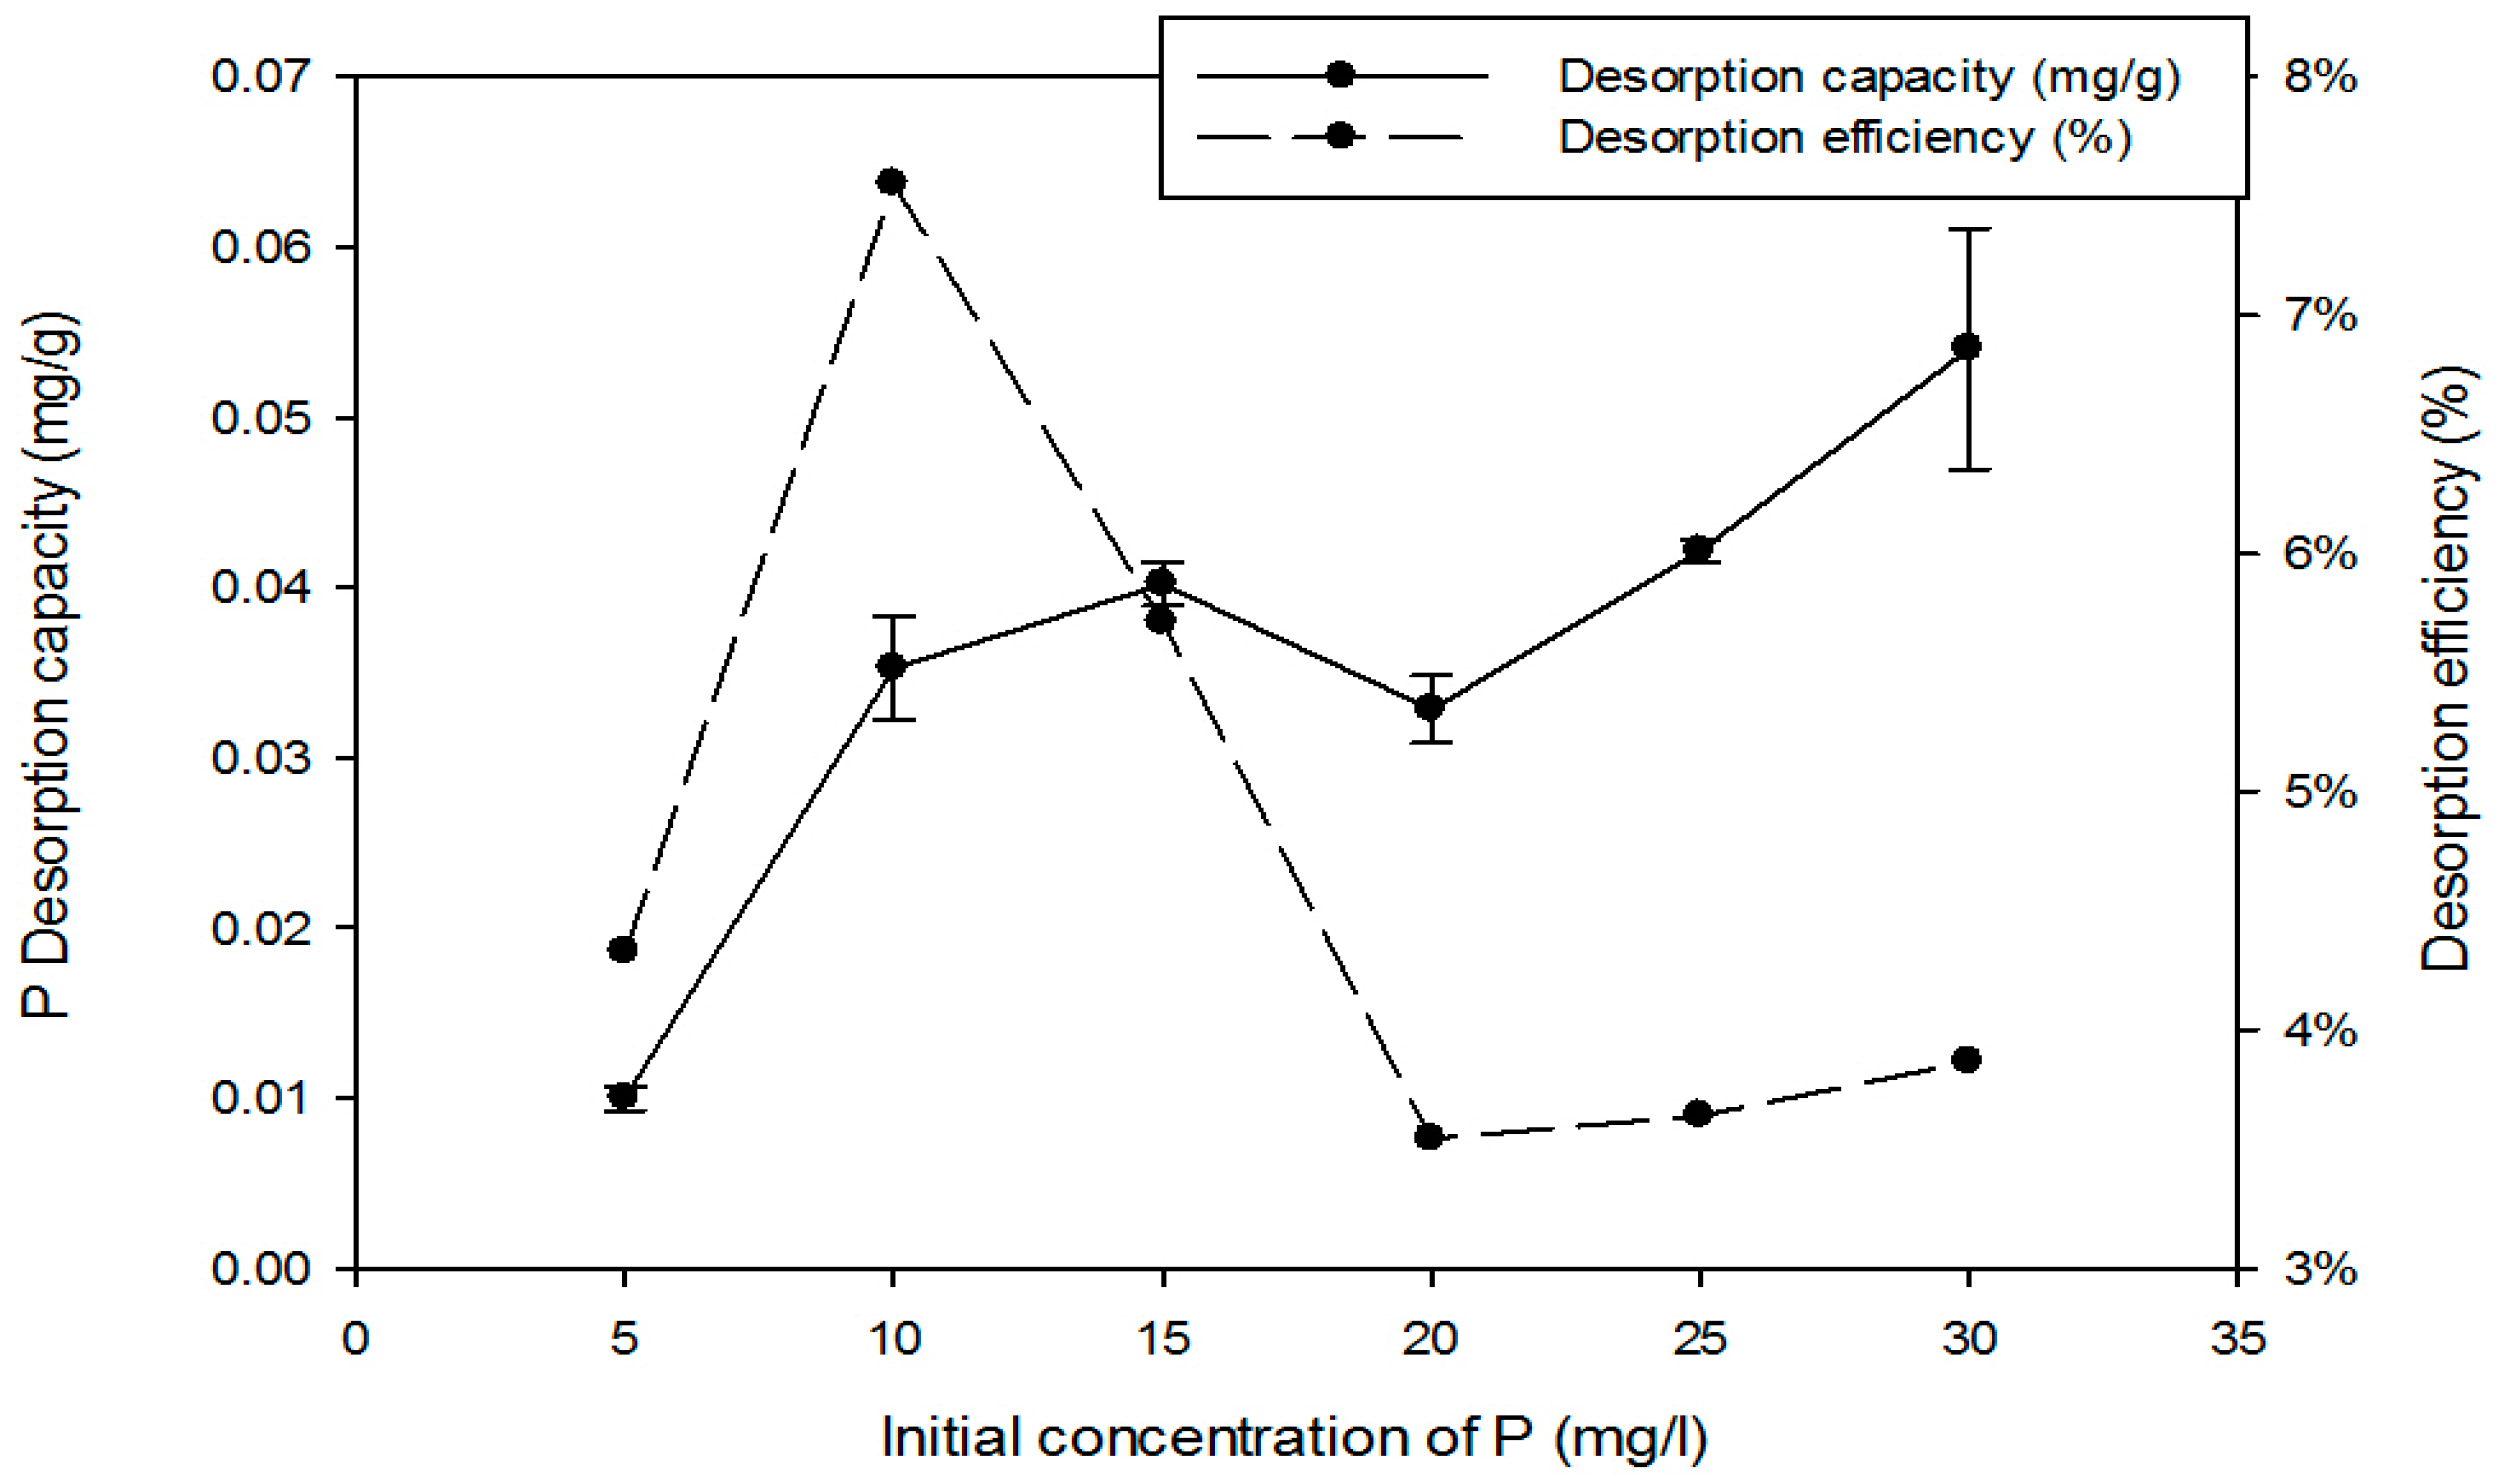
Figure 8 shows the proportion of P re-released. The desorption was in the range of 4–7% and lowest at the higher initial P concentrations with maximum desorption at the initial P = 10 mg/L. The adsorption and desorption capacities were not equal, corroborating a previous hypothesis that different mechanisms were involved at different P concentrations and that some were irreversible. It is suggested that at the lower concentrations adsorption was due to just physical adsorption, which then enabled easier P release. Higher concentrations of P, on the other hand, could be sufficient to cause reactions with the metals such as complexation and precipitation; desorption would therefore be reduced [47]. A lower desorption rate at smaller P concentrations, was also reported by Yu et al. (2009) [35]. They tested desorption from mortar (cement mixed with sand) and found the release was 9% but they deduced that the adsorption was mainly due to chemical reaction.
3.3. Fractionation of Inorganic Phosphorus
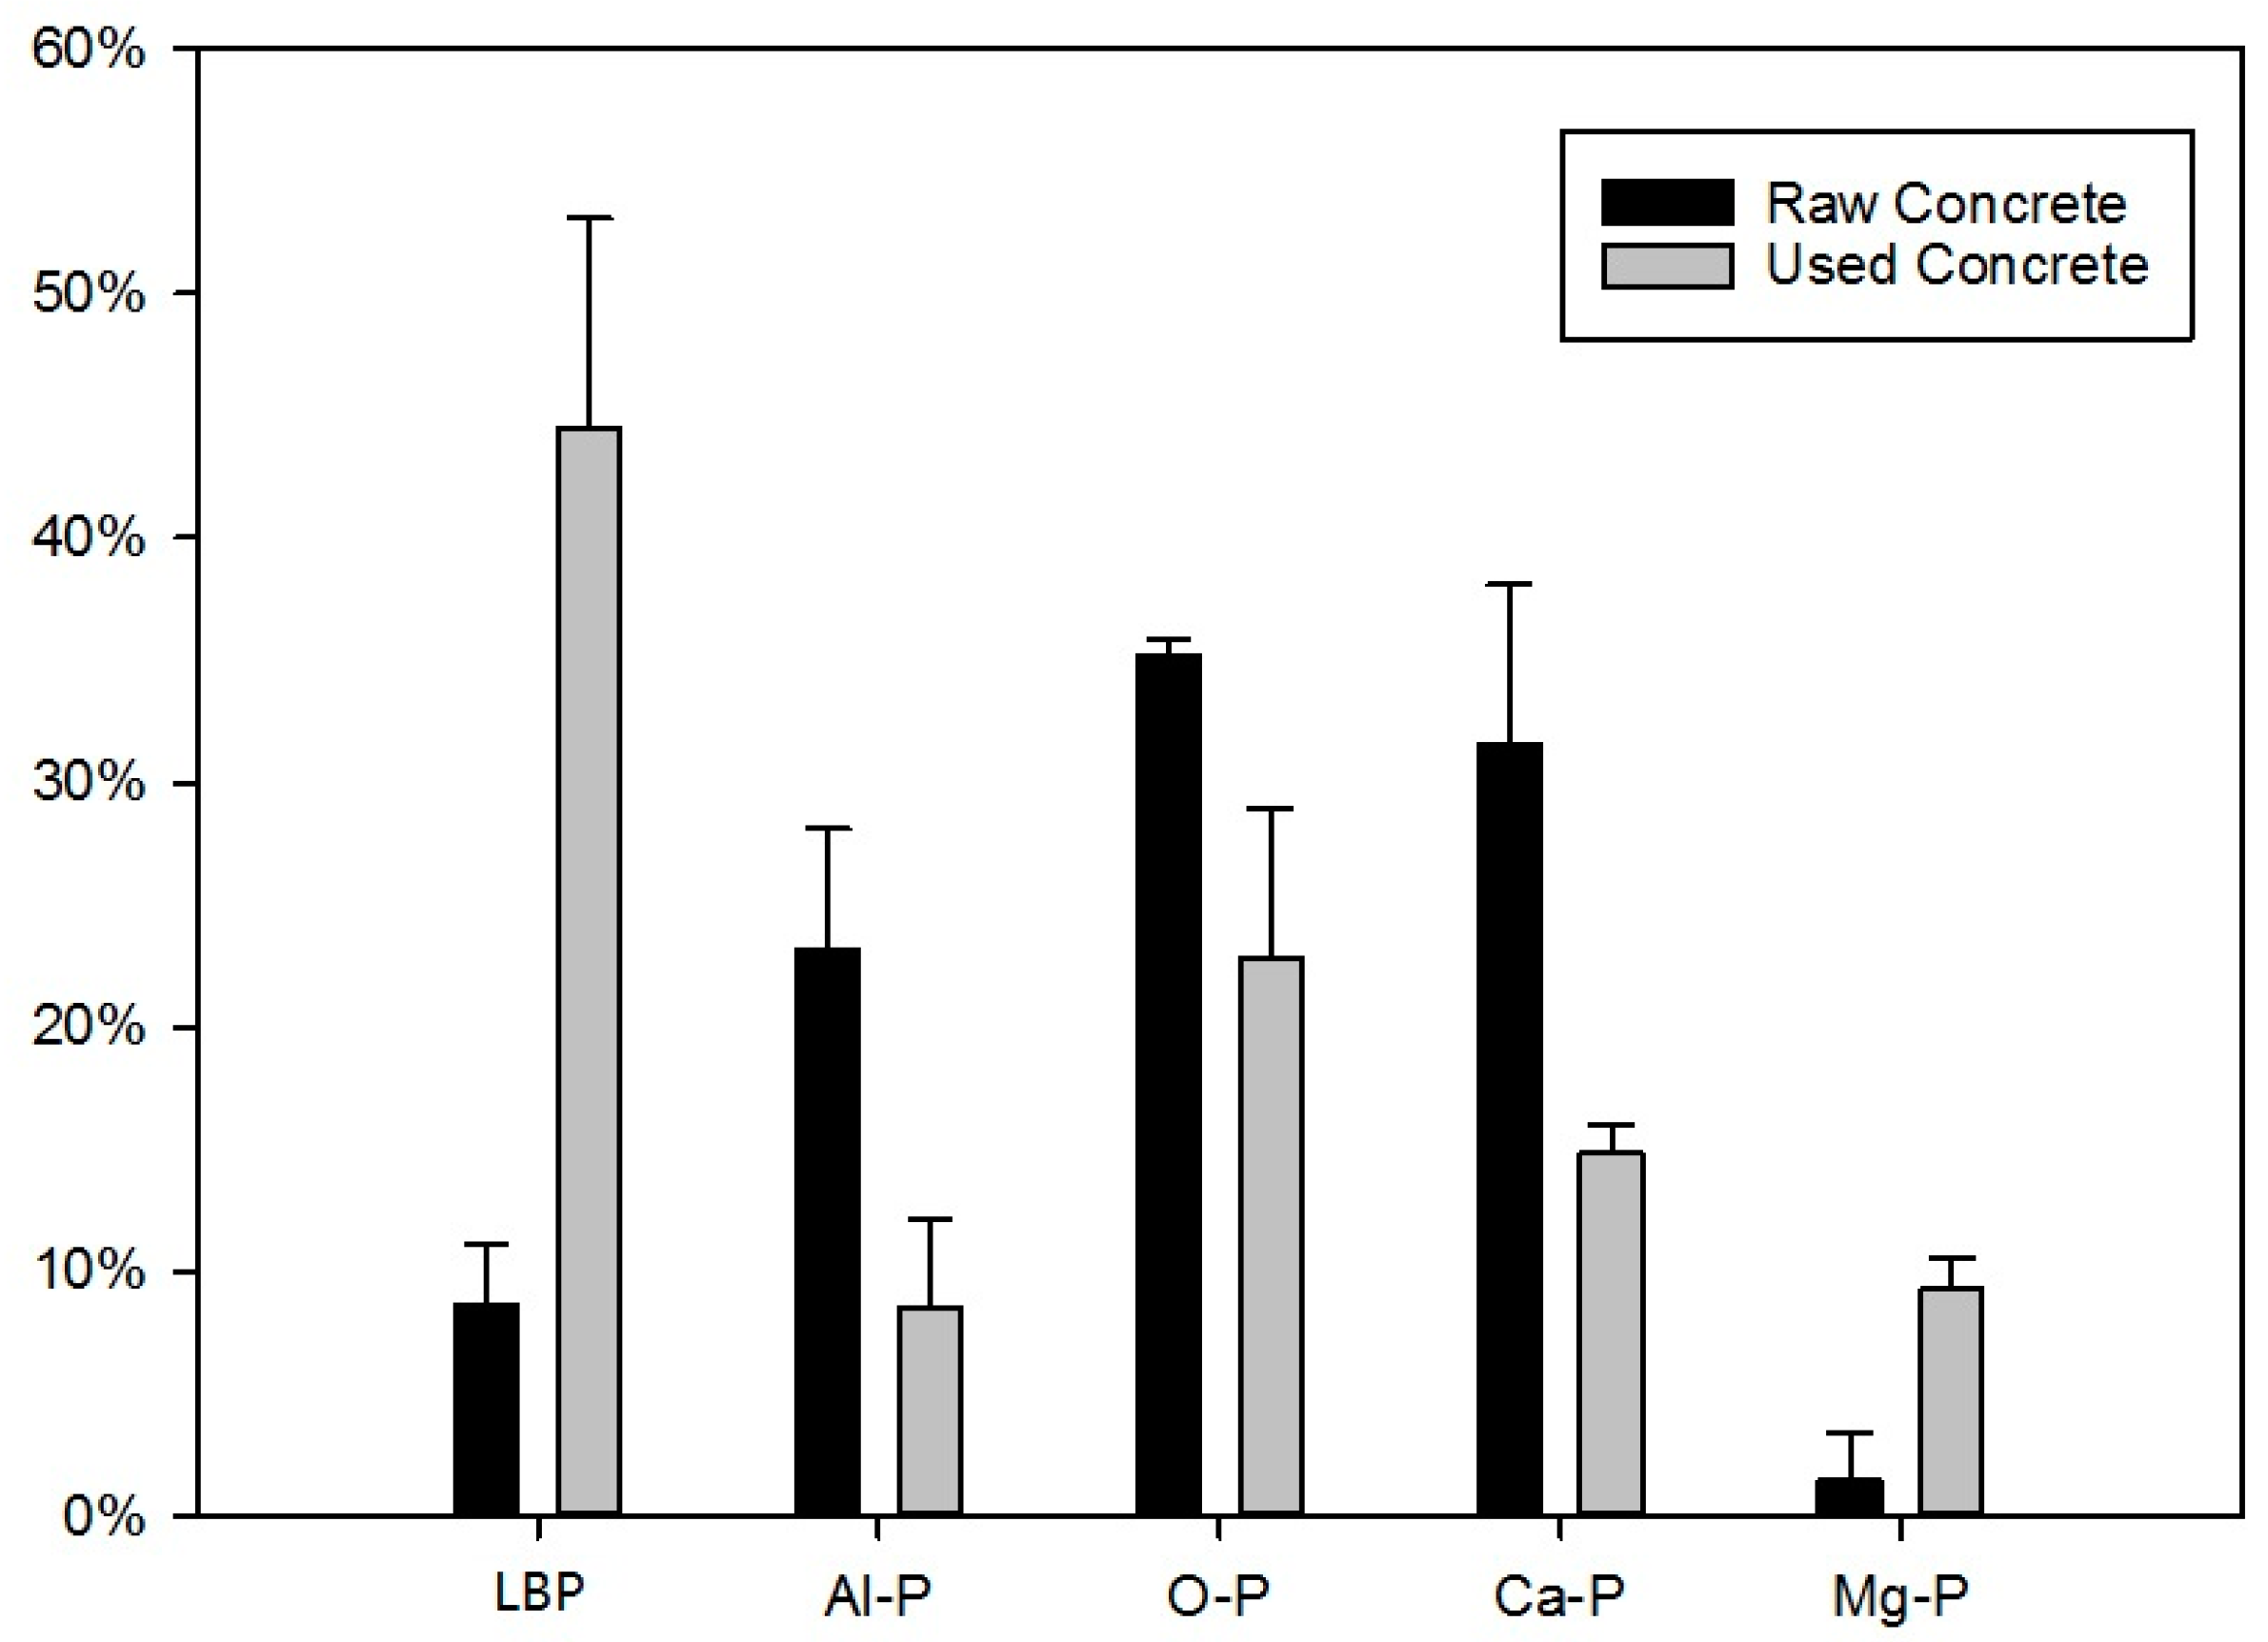
Concrete is composed of Ca, Mg, Si, and Al hydroxides [33,37,48]. The proportions of each metal bound P types were measured. The Si was assumed to be inactive and not analysed. The data is shown in Figure 9: in the raw concrete O-P was the predominant form of P (37%), the remainder was mostly Ca-P (29%) combined with the Al-P, Mg-P and labile P were less than 10%. There was no Fe-P observed in this study. In the used RCA, on the other hand, labile P (43.3%) was the highest proportion, O-P remained high (25%), Al-P and Ca-P were reduced but Mg-P increased, possibly reflecting variations in the mineral composition. Previous work indicates P reacts with calcium and magnesium, from the cement, to form insoluble precipitate (detail see Table 10).
In this study, Mg-P was low in the raw concrete and there are few studies of Mg-P due to its high water solubility. This solubility and reactivity of the Mg-ion compared to Ca, Fe, and Al means Mg-P forms rapidly, but is less crystalline and vulnerable to remobilisation by a wide range of conditions (including pH). Ca-P is more stable due to slower crystallisation [49]. Previous work has also indicated the form of P does vary according to the chemical composition of the filter media (Table 11). Oyster shell, for example, was more than 50% CaO which then formed the majority of the adsorbed P as Ca-P [50]. Zeolite was reported to be 70% SiO2, 10% Al2O3, 2.5% CaO, and 1.5% Fe2O3 [51,52,53]. The inactivity of Si would explain its poor performance for P removal. In other materials—such as drinking water treatment residues, fly ash, and Bauxite residues—the total P amount was higher than RCA, but the soluble P and sizes available were much smaller, and were not convenient as wastewater filter media.
The used RCA contained 43% soluble P which is the second highest when compared to previous work and blast furnace slag contained most soluble P (see Table 11). Hylander (1999) [58] carried out loading scale pot experiments and stated that slag sorbed P was highly plant available. Therefore, RCA could be used as fertiliser. This is due to the fact that soluble P could be recovered through equilibrium soluble P-concentration, pH change, or redox potential [59,60]. It was confirmed in previous tests that soluble P could be re-released as it was physical attraction, corroborating the predictions of the isotherm, kinetic, and desorption tests. The reaction time was important because previous work has shown that the surface-attracted P might gradually become more permanently bound through complexation and precipitation reactions [54,61]. This was demonstrated in Table 11 which showed adsorption was followed by the formation of apatite complexes. O-P was the second highest indicating that between a third and a quarter of the P became fixed immediately, and would resist re-release, but it still could be re-converted into available P by soil microorganisms (e.g., Phosphate solubilising bacteria) [62].
4. Conclusions
This study tested recycled concrete for P removal from wastewater, using a larger sized (2–5 mm) and therefore more suitable media than previous studies in practice. More than 90% P removal was achievable using concentrations typical of sewage effluents (p < 15 mg/L) with an equilibrium time of 24 h. Model analysis predicted that capacity could reach 6.88 mg/g. The experiments using an analysis of the kinetics (pseudo second-order R = 0.9916) and thermodynamics indicated the adsorption process was spontaneous and, together with the differential extraction and desorption tests results, indicated the mechanism was surface physical electrostatic attraction followed by chemical precipitation. The results suggested that half the P adsorbed to the surface was labile and available for recovery, or, after further crushing, could be used directly as a fertilizer supplement. Further studies on the uptake and impact on plant growth from P enriched RCA would be useful.
The results offer a new usage for high cement RCA which is undesirable for aggregate, due to a lower density, high water adsorption, and reduced structural performance [63,64]. Further work is also suggested to measure how concrete adsorbs heavy metals and persistent organics and how these might interact with C, P, and N in effluents.
Author Contributions
Yihuan Deng and Andrew Wheatley conceived and designed the experiments; Yihuan Deng performed the experiments; Yihuan Deng analyzed the data; Andrew Wheatley contributed reagents/materials/analysis tools; Yihuan Deng and Andrew Wheatley wrote the paper.
Conflicts of Interest
The authors declare no conflict of interest.
References
- Oikonomou, N.D. Recycled concrete aggregates. Cem. Concr. Compos. 2005, 27, 315–318. [Google Scholar] [CrossRef]
- National Development and Reform Commission. The Annual Report on Comprehensive Utilization of Resources of China; National Development and Reform Commission: Beijing, China, 2014. (In Chinese)
- Li, W.; Wu, Y.; Li, S. The Research of the Biologic Padding of Fly Ash Applied in the Sewage Transaction. Modem Sci. Instrum. 2007, 4, 63–66. (In Chinese) [Google Scholar]
- Guo, Y.; Li, Y.; Wang, Y.; Gao, K.; Yang, L.; Qin, X.; Du, J.; Wang, S. Study on pollutants removal performance of some biological carrier in wastewater land treatment system. Environ. Sci. Technol. 2009, 22, 33–35. (In Chinese) [Google Scholar]
- Xiang, H.; Han, Y.; Liu, Y. Substrate screening for phosphorus removal in low concentration phosphorus-containing water body. Acta Sci. Circumst. 2013, 33, 3227–3233. (In Chinese) [Google Scholar]
- Reijnders, L. Phosphorus resources, their depletion and conservation, a review. Resour. Conserv. Recycl. 2014, 93, 32–49. [Google Scholar] [CrossRef]
- Deng, Y.; Wheatley, A. Wastewater treatment in Chinese rural areas. Asian J. Water Environ. Pollut. 2016, 13, 1–11. [Google Scholar] [CrossRef]
- Sasaki, A.; Yoshikawa, E.; Mizuguchi, H.; Endo, M. The Improvement of water quality in an acidic river environment using waste concrete aggregates. J. Water Environ. Technol. 2013, 11, 235–247. [Google Scholar] [CrossRef]
- Zhou, L.; Huang, Z.; Li, T. The Application of Wasted Architecture Walling Materials Used as a constructed wetland media. In Water Infrastructure for Sustainable Communities China and the World, 1st ed.; Hao, X., Novotny, V., Nelson, V., Eds.; International Water Association: London, UK, 2010; pp. 481–489. [Google Scholar]
- Chen, Z. Technology of Using Eco-concrete for Sewage Treatment. J. Build. Mater. 2001, 4, 60–64. (In Chinese) [Google Scholar]
- Yuan, J.; Jin, L.; Zou, C.; Wan, Y.; Liu, H.; Lan, Y. Microorganisms and effectiveness of a low cost concrete biofilm reactor for sewage treatment. Environ. Pollut. Control 2006, 28, 568–571. (In Chinese) [Google Scholar]
- Tamai, M.; Okinaka, T. Present and future views of environmentally-friendly concrete. In Concrete Technology for a Sustainable Development in the 21st Century, 1st ed.; Gjorv, O.E., Sakai, K., Eds.; E&FN: New York, NY, USA, 2000; pp. 264–273. [Google Scholar]
- American Public Health Association. Standard Methods for the Examination of Water and Wastewater, 21st ed.; American Public Health Association: Washington, DC, USA, 2005. [Google Scholar]
- Dean, L.A. An attempted fractionation of the soil phosphorus. J. Agric. Sci. 1938, 28, 234–246. [Google Scholar] [CrossRef]
- Chang, S.C.; Jackson, M.L. Frationation of soil phosphorus. Soil Sci. 1957, 84, 133–144. [Google Scholar] [CrossRef]
- Leader, J.W.; Dunn, E.J.; Reddy, K.R. Phosphorus Sorbing Materials: Sorption Dynamics and Physicochemical Characteristics. J. Environ. Qual. 2008, 37, 174–181. [Google Scholar] [CrossRef] [PubMed]
- Reddy, K.R.; Wang, Y.; DeBusk, W.F.; Fisher, M.M.; Newman, S. Forms of Soil Phosphorus in Selected Hydrologic Units of the Florida Everglades. Soil Sci. Soc. Am. J. 1998, 62, 1134–1147. [Google Scholar] [CrossRef]
- White, S.A.; Taylor, M.D.; Albano, J.P.; Whitwell, T.; Klaine, S.J. Phosphorus retention in lab and field-scale subsurface-flow wetlands treating plant nursery runoff. Ecol. Eng. 2011, 37, 1968–1976. [Google Scholar] [CrossRef]
- Hartikainen, H. Phosphorus and its reactions in terrestrial soils and lake sediments. J. Sci. Agric. Soc. Finl. 1979, 51, 537–624. [Google Scholar]
- Wang, Z.; Liu, C.; Dong, J.; Liu, L.; Li, P.; Zheng, J. Screening of phosphate-removing filter media for use in constructed wetlands and their phosphorus removal capacities. China Environ. Sci. 2013, 33, 227–233. (In Chinese) [Google Scholar]
- Agyeia, N.M.; Strydomb, C.A.; Potgieter, J.H. The removal of phosphate ions from aqueous solution by fly ash, slag, ordinary Portland cement and related blends. Cem. Concr. Res. 2002, 32, 1889–1897. [Google Scholar] [CrossRef]
- Burianek, P.; Skalicky, M.; Grunwald, A. Phosphates adsorption from water by recycled concrete. GeoSci. Eng. 2014, LX, 1–8. [Google Scholar] [CrossRef]
- Molle, P.; Lienard, A.; Grasmick, A.; Lwema, A. Phosphorus retention in subsurface constructed wetlands: Investigations focused on calcareous materials and their chemical reactions. Water Sci. Technol. 2003, 48, 75–83. [Google Scholar] [PubMed]
- Cucarella, V.; Renman, G. Phosphorus sorption capacity of filter materials used for on-site wastewater treatment determined in batch experiments–a comparative study. J. Environ. Qual. 2009, 3, 381–392. [Google Scholar] [CrossRef] [PubMed]
- Agrawal, S.G.; King, K.W.; Fischer, E.N.; Woner, D.N. PO4 3- removal by and permeability of industrial byproducts and minerals: Granulated blast furnace slag, cement kiln dust, coconut shell activated carbon, silica sand, and zeolite. Water Air Soil Pollut. 2011, 219, 91–101. [Google Scholar] [CrossRef]
- Dawodu, F.A.; Akpomie, K.G. Kinetic, Equilibrium, and Thermodynamic Studies on the Adsorption of Cadmium (II) Ions using “Aloji Kaolinite” Mineral. Pac. J. Sci. Technol. 2014, 15, 268–276. [Google Scholar]
- Dada, A.O.; Olalekan, A.P.; Olatunya, A.M.; DADA, O. Langmuir, Freundlich, Temkin and Dubinin-Radushkevich Isotherms Studies of Equilibrium Sorption of Zn2+ Unto Phosphoric Acid Modified Rice Husk. J. Appl. Chem. 2012, 3, 38–45. [Google Scholar]
- Tosun, İ. Ammonium Removal from Aqueous Solutions by Clinoptilolite Determination of Isotherm and Thermodynamic Parameters and Comparison of Kinetics by the Double Exponential Model and Conventional Kinetic Models. Int. J. Environ. Res. Public Health 2012, 9, 970–984. [Google Scholar] [CrossRef] [PubMed]
- Cheng, Y.; Yang, C.; He, H.; Zeng, G.; Zhao, K.; Yan, Z. Biosorption of Pb(II) Ions from Aqueous Solutions by Waste Biomass from Biotrickling Filters: Kinetics, Isotherms, and Thermodynamics. J. Environ. Eng. 2015, 142, C4015001. [Google Scholar] [CrossRef]
- Gu, D.; Zhu, X.; Vongsay, T.; Huang, M.; Song, L.; He, Y. phosphorus and Nitrogen removal using novel porous bricks incorporated with wastes and minerals. Pol. J. Environ. Stud. 2013, 22, 1349–1356. [Google Scholar]
- Tewaria, N.; Vasudevana, P.; Guhab, B.K. Study on biosorption of Cr(VI) by Mucor hiemalis. Biochem. Eng. J. 2005, 23, 185–192. [Google Scholar] [CrossRef]
- Zheng, J.; Yin, X.; Liu, B.; Meng, G. Preparation of Porous Hardened Cement Paste Synthetic Filter Material and Phosphorus Removal from Wastewater by Adsorption. J. Civ. Archit. Environ. Eng. 2013, 35, 115–120. (In Chinese) [Google Scholar]
- Renman, G.; Renman, A. Sustainable use of crushed autoclaved aerated concrete (CAAC) as a filter medium in wastewater purification. In WASCON; Arm, M., Ed.; ISCOWA and SGI: Gothenburg, Sweden, 2012. [Google Scholar]
- Egemose, S.; Sønderup, M.J.; Beinthin, M.V.; Reitzel, K.; Hoffmann, C.C.; Flindt, M.R. Crushed concrete as a phosphate binding material: A potential new management tool. J. Environ. Qual. 2012, 41, 647–653. [Google Scholar] [CrossRef] [PubMed]
- Yu, Z.; Ding, Z.; Zha, X.; Cheng, T.; Ding, Z.; Zha, X.; Cheng, T. Phosphorus Adsorption Characteristics of Different Substrates in Constructed Wetland. China Water Wastewater 2009, 25, 80–82. (In Chinese) [Google Scholar]
- Hu, C.; Liu, P. Study on the effect of red mud in improving the phosphorus removal ability of eco-concrete. Concrete 2014, 293, 151–153. (In Chinese) [Google Scholar]
- Oguz, E.; Gurses, A.; Yalcin, M. Removal of phosphate from waste waters by adsorption. Water Air Soil Pollut. 2003, 148, 279–287. [Google Scholar] [CrossRef]
- Chien, S.H.; Clayton, W.R. Application of Elovich Equation to the Kinetics of Phosphate Release and Sorption in Soils. Soil Sci. Soc. Am. J. 1980, 44, 265–268. [Google Scholar] [CrossRef]
- Gerente, C.; Lee, V.K.C.; Cloirec, P.L.; McKay, G. Application of chitosan for the removal of metals from wastewaters by adsorption—mechanisms and models review. Crit. Rev. Environ. Sci. Technol. 2007, 37, 41–127. [Google Scholar] [CrossRef]
- Ho, Y.S.; McKay, G. Application of kinetic models to the sorption of copper (II) on to peat. Adsorp. Sci. Technol. 2002, 20, 797–815. [Google Scholar] [CrossRef]
- Kumar, P.; Sudha, S.; Chand, S.; Srivastava, V.C. Phosphate Removal from Aqueous Solution Using Coir-Pith Activated Carbon. Sep. Sci. Technol. 2010, 45, 1463–1470. [Google Scholar] [CrossRef]
- Kim, D.S. Adsorption characteristics of Fe(III) and Fe(III)–NTA complex on granular activated carbon. J. Hazard. Mater. 2004, 106, 67–84. [Google Scholar] [CrossRef]
- Wang, Z.; Nie, E.; Li, J.; Yang, M.; Zhao, Y.; Luo, X.; Zheng, Z. Equilibrium and kinetics of adsorption of phosphate onto iron-doped activated carbon. Environ. Sci. Pollut. Res. 2012, 19, 2908–2917. [Google Scholar] [CrossRef] [PubMed]
- Chmielewská, E.; Hodossyová, R.; Bujdoš, M. Kinetic and Thermodynamic Studies for Phosphate Removal Using Natural Adsorption Materials. Pol. J. Environ. Stud. 2013, 22, 1307–1316. [Google Scholar]
- Yuan, X.; Xia, W.; An, J.; Yin, J.; Zhou, X.; Yang, W. Kinetic and Thermodynamic Studies on the Phosphate Adsorption Removal by Dolomite Mineral. J. Chem. 2015, 2015, 1–8. [Google Scholar] [CrossRef]
- Mezenner, N.Y.; Bensmaili, A. Kinetics and thermodynamic study of phosphate adsorption on iron hydroxide-eggshell waste. Chem. Eng. J. 2009, 147, 87–96. [Google Scholar] [CrossRef]
- Zhang, Y.; Zou, Y.; Huang, Y.; Wang, C.; Li, F. Phosphate adsorption and desorption characteristic of several fly ashes. Chin. J. Appl. Ecol. 2005, 16, 1756–1760. (In Chinese) [Google Scholar]
- Berg, U.; Donnert, D.; Ehbrecht, A.; Bumiller, W.; Kusche, I.; Weidler, P.G.; Nüesch, R. “Active filtration” for the elimination and recovery of phosphorus from waste water. Colloids Surf. A Physicochem. Eng. Asp. 2005, 265, 141–148. [Google Scholar] [CrossRef]
- Josan, M.S.; Nair, V.D.; Harris, W.G.; Herrera, D. Associated release of magnesium and phosphorus from active and abandoned dairy soils. J. Environ. Qual. 2005, 34, 184–191. [Google Scholar] [CrossRef] [PubMed]
- Zhong, B.; Zhou, Q.; Chan, Y.; Yu, F. Structure and Property Characterization of Oyster Shell Cementing Material. Chin. J. Struct. Chem. 2012, 31, 85–92. [Google Scholar]
- Erdem, E.; Karapinar, N.; Donat, R. The removal of heavy metal cations by natural zeolites. J. Colloid Interface Sci. 2004, 280, 309–314. [Google Scholar] [CrossRef] [PubMed]
- Jiang, J.; Chen, Y.; Deng, Z.; Wang, W.; Zhao, Q. A research on ammonia treated by zeolite from landfill leachate. Water Wastewater Eng. 2003, 29, 6–9. (In Chinese) [Google Scholar]
- Petrus, R.; Warchol, J.K. Heavy metal removal by clinoptilolite. An equilibrium study in multi-component systems. Multi-Compon. Syst. 2005, 39, 819–830. [Google Scholar] [CrossRef] [PubMed]
- Korkusuz, E.A.; Beklioglub, M.; Demirer, G.N. Use of blast furnace granulated slag as a substrate in vertical flow reed beds Field application. Bioresour. Technol. 2007, 98, 2089–2101. [Google Scholar] [CrossRef] [PubMed]
- Jenssen, P.D.; Krogstad, T.; Paruch, A.M.; Mæhlum, T.; Adam, K.; Arias, C.A.; Heistad, A.; Jonsson, L.; Hellström, D.; Brix, H.; et al. Filter bed systems treating domestic wastewater in the Nordic countries—Performance and reuse of filter media. Ecol. Eng. 2010, 36, 1651–1659. [Google Scholar] [CrossRef]
- Penn, C.J.; Bryant, R.B.; Callahan, M.P.; McGrath, J.M. Use of Industrial By-products to Sorb and Retain Phosphorus. Commun. Soil Sci. Plant Anal. 2011, 42, 633–644. [Google Scholar] [CrossRef]
- Drizo, A.; Cummings, J.; Weber, D.; Twohig, E.; Druschel, G.; Bourke, B. New Evidence for Rejuvenation of Phosphorus Retention Capacity in EAF Steel Slag. Eviron. Sci. Technol. 2008, 42, 6191–6197. [Google Scholar] [CrossRef]
- Hylander, L.D.; Johansson, L.; Renman, G.; Ridderstolpe, P.; Siman, G. Phosphorus recycling from waste water by filter media used as fertilisers. Nordisk Jordbrugsforsking 1999, 81, 102–105. [Google Scholar]
- Grobbelaar, J.U.; House, W.A. Phosphorus as a limiting resource in inland waters; interactions with nitrogen. In Phosphorus in the Global Environment-Transfers, Cycles and Management; Tiessen, H., Ed.; Wiley: Hoboken, NJ, USA, 1995; pp. 55–274. [Google Scholar]
- Hillbricht-Ilkowska, A.; Ryszkowski, L.; Sharpley, A.N. Phosphorus Transfers and Landscape Structure: Riparian Sites and Diversified Land Use Patterns. In Phosphorus in the Global Environment-Transfers, Cycles and Management; Tiessen, H., Ed.; Wiley: Hoboken, NJ, USA, 1995; pp. 201–228. [Google Scholar]
- Frossard, E.; Brossard, M.; Hedley, M.J.; Metherell, A. Reactions Controlling the Cycling of P in Soils. In Phosphorus in the Global Environment-Transfers Cycles and Management; Tiessen, H., Ed.; Wiley: Hoboken, NJ, USA, 1995; pp. 107–138. [Google Scholar]
- Chen, Y.P.; Rekha, P.D.; Arun, A.B.; Shen, F.T.; Lai, W.-A.; Young, C.C. Phosphate solubilizing bacteria from subtropical soil and their tricalcium phosphate solubilizing abilities. Appl. Soil Ecol. 2006, 34, 33–41. [Google Scholar] [CrossRef]
- Juan, M.S.D.; Gutiérrez, P.A. Study on the influence of attached mortar content on the properties of recycled concrete aggregate. Construct. Build. Mater. 2009, 23, 872–878. [Google Scholar] [CrossRef]
- Sagoe-Crentsil, K.K.; Taylor, T.B. Performance of concrete made with commercially produced coarse recycled concrete aggregate. Cem. Concr. Res. 2001, 31, 707–712. [Google Scholar] [CrossRef]
Figure 1.
RCA scanning by infinite focused microscope.

Figure 2.
Effect of pH of solution on sorption of P. Dose of media 2 g; initial P concentration 2 mg/L; contact time 24 h; agitator 180-rpm.
Figure 2.
Effect of pH of solution on sorption of P. Dose of media 2 g; initial P concentration 2 mg/L; contact time 24 h; agitator 180-rpm.

Figure 3.
Effect of dose of media on sorption of P. Initial P concentration 20 mg/L; contact time 24 h; agitator 180-rpm; pH-5.
Figure 3.
Effect of dose of media on sorption of P. Initial P concentration 20 mg/L; contact time 24 h; agitator 180-rpm; pH-5.

Figure 4.
Effect of initial concentration of media on removal of P. Dose of media 2 g contact time 24 h; agitator 180-rpm; pH-5.
Figure 4.
Effect of initial concentration of media on removal of P. Dose of media 2 g contact time 24 h; agitator 180-rpm; pH-5.

Figure 5.
Kinetic studies of P adsorption; Initial P concentration 15 mg/L; agitator 180-rpm; pH-5; temperature = 27 °C.
Figure 5.
Kinetic studies of P adsorption; Initial P concentration 15 mg/L; agitator 180-rpm; pH-5; temperature = 27 °C.

Figure 6.
P sorption by concrete studies at various temperatures; Dose of media 2 g; initial P concentration 15 mg/L; contact time 24 h; agitator 180-rpm; pH 5.
Figure 6.
P sorption by concrete studies at various temperatures; Dose of media 2 g; initial P concentration 15 mg/L; contact time 24 h; agitator 180-rpm; pH 5.

Figure 7.
Plot of vs. 1/T for estimation of thermodynamic parameters .

Figure 8.
P desorption of concrete on different initial P concentration. Contact time 24 h; agitator 180-rpm; pH-5.
Figure 8.
P desorption of concrete on different initial P concentration. Contact time 24 h; agitator 180-rpm; pH-5.

Figure 9.
The comparison of different type of P before and after test.


Table 1.
Experimental schedule for the adsorption of P.
| No. | Study | Parameters |
|---|---|---|
| 1 | Effect of pH of solution on sorption | The pH of the solution was varied between 6.0 and 8.0. Dose of media 2 g; initial P concentration 20 mg/L; contact time 24 h; agitator 180-rpm |
| 2 | Effect of dose of sorbent on phosphorus sorption | RCA was varied in the range 1–10 g, 20 mg/L P solution; contact time 24 h; agitator 180-rpm; pH-5 |
| 3 | Effect of initial phosphorus concentration | Phosphate concentrations in the range 5–30 mg/L. Dose of media 2 g contact time 24 h; agitator 180-rpm; pH-5; |
| 4 | Equilibrium studies | Evaluation of maximum adsorption by isotherm models |
| 5 | Kinetic analysis | Initial P concentration 15 mg/L with 2 g of RCA, contact time 24 h at 298 K, agitator 180-rpm, pH 5 |
| 6 | Effect of temperature on sorption | Initial P concentration 15 mg/L with 2 g of RCA and contact time 24 h at 298, 318 and 328 °C, pH 5 |
RCA: recycled concrete aggregate.
| Step | Inorganic P | Extraction Reagents | Concentration | Condition |
|---|---|---|---|---|
| I | LBP | NH4Cl | 1 mol/L | 50 mL, shaking 0.5 h |
| II | Al-P | NH4F (pH 8) | 0.5 mol/L | 50 mL, shaking 1 h |
| III | Fe-P | NaOH | 0.1 mol/L | 50 mL, shaking 2 h |
| IV | O-P | CDB (pH 7.6) | - | 45 mL, shaking 0.5 h |
| V | Ca-P | H2SO4 | 0.5 mol/L | 50 mL, shaking 1 h |
| VI | Mg-Ca-P | HCl | 0.5 mol/L | 50 mL, shaking 1 h |
Note: CDB (Sodium citrate-sodium dithionite-sodium bicarbonate); Na3C3H6O7 (0.3 M); NaHCO3 (1 M); Na2S2O4 (1 g).
| Isotherm Models | Linear Expression | Associated Equations | Parameters |
|---|---|---|---|
| Freundlich | K and n are empirical constants | Kf (L/mg) = Langmuir equilibrium constant; n = dimensionless correction factor; qe = adsorption capacity (mg/g) | |
| Langmuir | KL = Isotherm constant (L/mg); CO = initial concentration; qm=mainxmum adsorption capacity (mg/g) | ||
| Tempkin | - | = Tempkin isotherm equilibrium binding constant (L/g); B = constant related to heat of sorption (J/mol) | |
| D-R | qs = theoretical isotherm saturation capacity (mg/g), Kad = Dubinin–Radushkevich isotherm constant (mol2/kJ2) and ε = Dubinin–Radushkevich isotherm constant | ||
| Frumkin | - | = fractional surface coverage; = lateral interaction coefficient; Kfr (L/g) = Frumkin equilibrium constant, | |
| BET | - | Ce = equilibrium concentration (mg/L); Cs = adsorbate monolayer saturation concentration (mg/L); CBET = BET adsorption isotherm relating to the energy of surface interaction (L/mg) |
Table 4.
Adsorption Isotherm constants for P adsorption by concrete.
| Langmuir Adsorption Isotherm | Freundlich Adsorption Isotherm | ||||||||
| qm (mg/g) | KL (L/mg) | RL | R2 | n | Kf | R2 | |||
| 6.88 | 0.089 | 0.281 | 0.984 | 0.996 | 0.669 | 0.983 | |||
| Tempkin Adsorption Isotherm | Dubinin-Radushkevich Isotherm | ||||||||
| AT (L/mg) | At | B | R2 | qs (mg/g) | Kad (mol2/kJ2) | ε (kJ/mol) | R2 | ||
| 0.195 | 134.9 | 0.649 | 0.958 | 1.4 | 2 × 10⁻⁷ | 2.24 | 0.968 | ||
| Frumkin Adsorption Isotherm | BET Adsorption Isotherm | ||||||||
| α | Kfr | R2 | CBET | qs | R2 | ||||
| 2.959 | 0.00342 | 0.669 | −0.798 | 0.553 | 0.898 | ||||
Table 5.
Adsorptive capacity of various studies by concrete.
| Types | Media | Size (mm) | Time | Qmax (mg/g) | Reference |
|---|---|---|---|---|---|
| Empirical | Ordinary Portland cement | 0.045–0.300 | 16 h | 19.90 | [21] |
| Empirical | Recycled Crushed Concrete | 0.125–0.250 | 1 h | 0.134 | [22] |
| Empirical | Crushed concrete | 0.125 | 40 days | 19.6 | [34] |
| Theoretical | Cement | 0.425–0.85 | 24 h | 1.185 | [35] |
| Empirical | Cement | 0.85 | 28 days | 16.16 | [36] |
| Empirical | Gas concrete | 0.063–2 | 1 h | 11.5 | [37] |
| Theoretical | Recycled crushed concrete | 0.3–2.3 | 24 h | 6.1 | [23] |
| Empirical | Crushed autoclaved aerated concrete | 2–4 | 24 h | 70.9 | [33] |
| Theoretical | Recycled concrete | 2–5 | 24 h | 6.88 | Present study |
| Theoretical | Cement | 3–5 | 32 h | 4.98 | [32] |
| Kinetic Study | Linear Expression | Parameters |
|---|---|---|
| The pseudo-first-order | Q = the amount of adsorption time (min) (mg/g); k1 = the rate, constant of pseudo first-order sorption (L/min); Qe = adsorption capacities at equilibrium, Qt = adsorption capacities at time t(min) | |
| The pseudo second-order | k2 = the rate constant of the second-order equation | |
| Elovich model equation | are constants | |
| Fractional power model | qt = the amount of adsorbate sorbed by adsorbent at a time t; and b = constants with b < 1 |
Table 7.
Kinetic parameters for P adsorption on concrete.
| The Pseudo-First-Order | The Pseudo Second-Order | ||||
| k1 | Qe | R2 | k2 | Qe | R2 |
| 0.211 | 0.657 | 0.9876 | 0.279 | 0.893 | 0.9916 |
| Elovich Model Equation | Fractional Power Model | ||||
| R2 | a | b | R2 | ||
| 0.476 | 5.061 | 0.9599 | 0.184 | 0.5 | 0.8986 |
Table 8.
Thermodynamic parameters for adsorption of P on concrete particles.
| Thermodynamic Parameters | Temperature (K) | ||
|---|---|---|---|
| 298 | 313 | 328 | |
| b | 6.460 | 7.150 | 8.418 |
| ΔG° (kJ/mol) | −4.623 | −5.119 | −5.808 |
| ΔH° (kJ/mol) | 7.139 | - | - |
| ΔS° (J/mol) | 39.336 | - | - |
Table 9.
Thermodynamic studies for P sorption by other materials.
| Adsorbent | ΔH° (kJ/mol) | ΔS° (J/mol) | Reference |
|---|---|---|---|
| Clinoptilolite rich tuff | 20.8 | 100 | [44] |
| Coir-pith activated carbon | 3.88 | 21.88 | [41] |
| Dolomite | −5.85 | −10.17 | [45] |
| Granulated ferric hydroxide | 15.1 | 80 | [44] |
| Iron hydroxide-eggshell waste | 81.84 | - | [46] |
| Bentonite | −5.3 | 10 | [44] |
| RCA | 7.139 | 39.336 | Present study |
| Slovakite | 104.9 | 300 | [44] |
Table 10.
Formation of P precipitate.
| Sequence | Chemical Formula |
|---|---|
| 1 | |
| 2 | |
| 3 | |
| 4 |
Table 11.
P specification of various saturated material.
| Media | Total (mg/g) | Soluble P (mg/g) | Al-P (mg/g) | Fe-P (mg/g) | O-P (mg/g) | Ca-P (mg/g) | Reference |
|---|---|---|---|---|---|---|---|
| Blast furnace granulated slag | 0.086 | 0.042 | - | 0.007 | - | 0.037 | [54] |
| 49% | - | 8% | - | 43% | |||
| Zeolite | 0.448 | 0.024 | 0.352 | 0.041 | 0.016 | 0.0131 | [20] |
| 5.4% | 78.6% | 9.2% | 3.6% | 2.9% | |||
| Volcanic rock | 0.516 | 0.066 | 0.311 | 0.027 | 0.054 | 0.058 | [20] |
| 12.8% | 60.3% | 5.2% | 10.5% | 11.2% | |||
| Crushed Bricks | 0.956 | 0.068 | 0.498 | 0.277 | 0.024 | 0.089 | [20] |
| 7.1% | 52.1% | 29.0% | 2.5% | 9.3% | |||
| RCA | 1.298 | 0.577 | 0.110 | 0 | 0.297 | 0.193 | Present study |
| 44.42% | 8.50% | 0% | 22.86% | 14.86% | |||
| Oyster shell | 3.596 | 0.363 | 0.08 | 0.014 | 0.589 | 2.55 | [20] |
| 10.1% | 2.2% | 0.4% | 16.4% | 70.9% | |||
| Light-weight expanded clay | 6.527 | 0.053 | 1.641 | 0.022 | - | 4.811 | [55] |
| 1% | 25% | <1% | - | 74% | |||
| Gas desulfurization products | 8.607 | 2.544 | 1.452 | 0.008 | 0.9 | 3.703 | [56] |
| 30% | 17% | 0% | 10% | 43% | |||
| Bauxite residual | 19.487 | 0.568 | 14.31 | 2.203 | 1.21 | 1.196 | [56] |
| 3% | 73% | 11% | 6% | 6% | |||
| Fly ash | 28.074 | 9.131 | 16.631 | 0.147 | 1.316 | 0.849 | [56] |
| 33% | 59% | 1% | 5% | 3% | |||
| Drinking Water treatment residual | 30.031 | 0.367 | 20.726 | 4.66 | 1.755 | 2.523 | [56] |
| 1% | 69% | 16% | 6% | 8% | |||
| Electric arc fumace steel slag | - | - | - | - | - | - | [57] |
| 0.63% | 3.05% | 13.67% | - | 82.65% | |||
| Iron melter slag | - | - | - | - | - | - | [57] |
| 2.41% | 22.88% | 12.69% | - | 62% |
© 2018 by the authors. Licensee MDPI, Basel, Switzerland. This article is an open access article distributed under the terms and conditions of the Creative Commons Attribution (CC BY) license (http://creativecommons.org/licenses/by/4.0/).
Share and Cite
MDPI and ACS Style
Deng, Y.; Wheatley, A. Mechanisms of Phosphorus Removal by Recycled Crushed Concrete. Int. J. Environ. Res. Public Health 2018, 15, 357. https://0-doi-org.brum.beds.ac.uk/10.3390/ijerph15020357
AMA Style
Deng Y, Wheatley A. Mechanisms of Phosphorus Removal by Recycled Crushed Concrete. International Journal of Environmental Research and Public Health. 2018; 15(2):357. https://0-doi-org.brum.beds.ac.uk/10.3390/ijerph15020357
Chicago/Turabian StyleDeng, Yihuan, and Andrew Wheatley. 2018. "Mechanisms of Phosphorus Removal by Recycled Crushed Concrete" International Journal of Environmental Research and Public Health 15, no. 2: 357. https://0-doi-org.brum.beds.ac.uk/10.3390/ijerph15020357
Note that from the first issue of 2016, this journal uses article numbers instead of page numbers. See further details here.