Association between Precipitation and Diarrheal Disease in Mozambique

 ,
,
Abstract
:1. Introduction
2. Materials and Methods
2.1. Health Data
2.2. Weather Data
2.3. Statistical Analysis
2.4. Sensitivity Analysis
3. Results
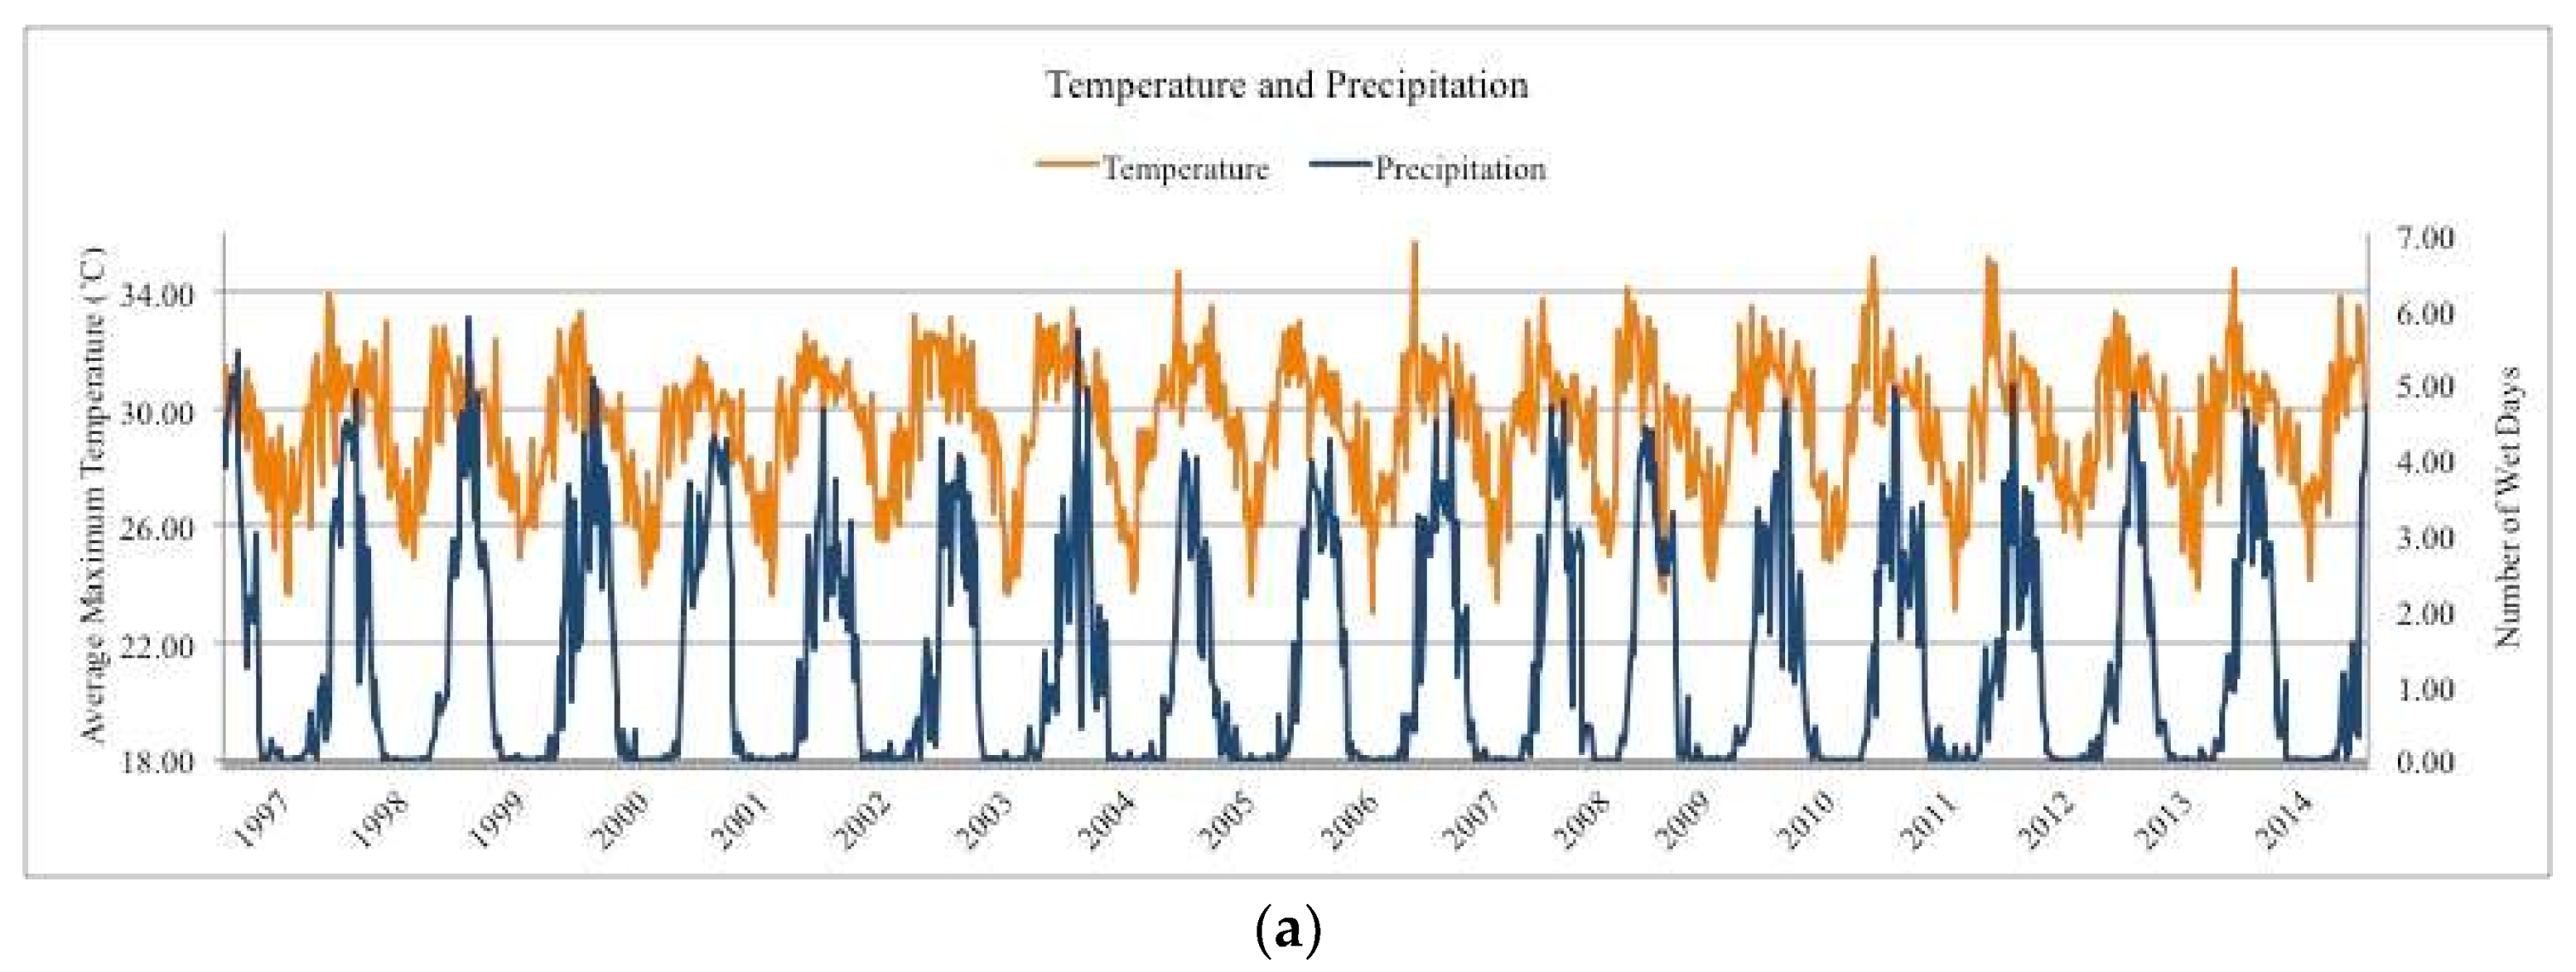
3.1. Precipitation
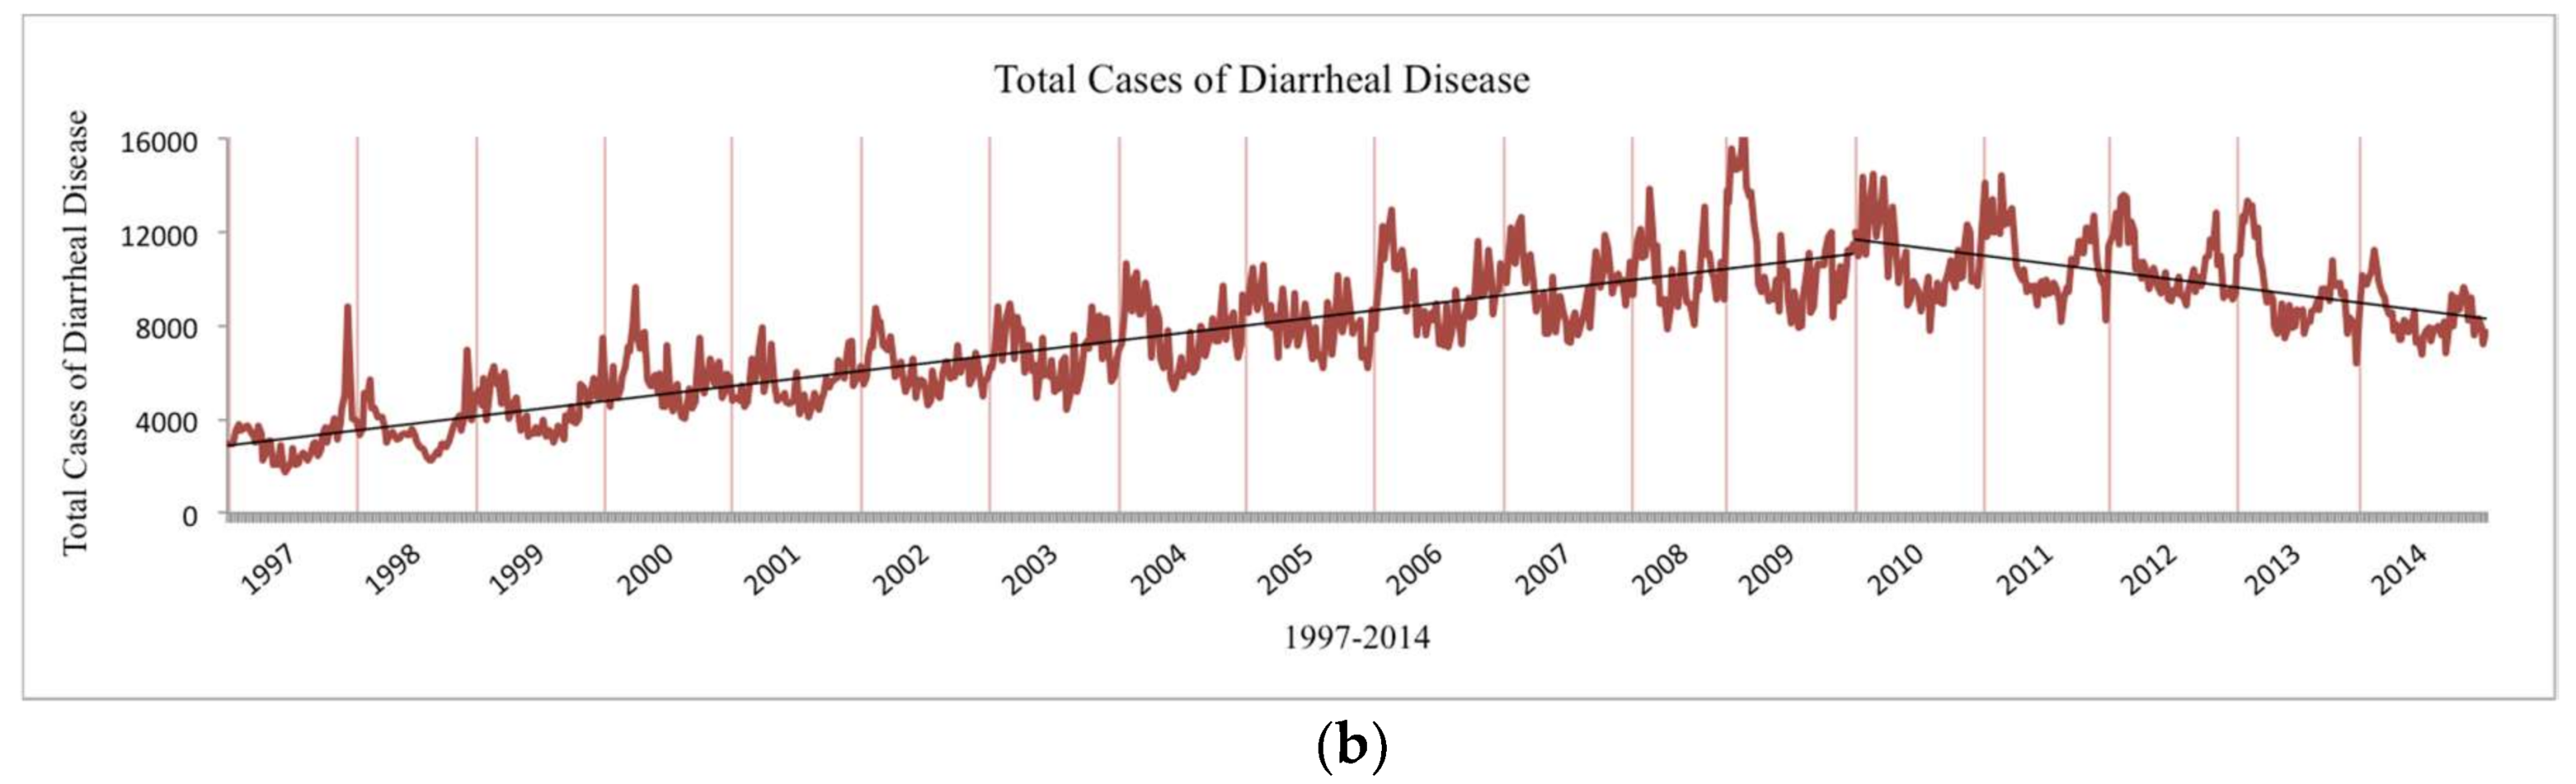
3.2. Diarrheal Disease
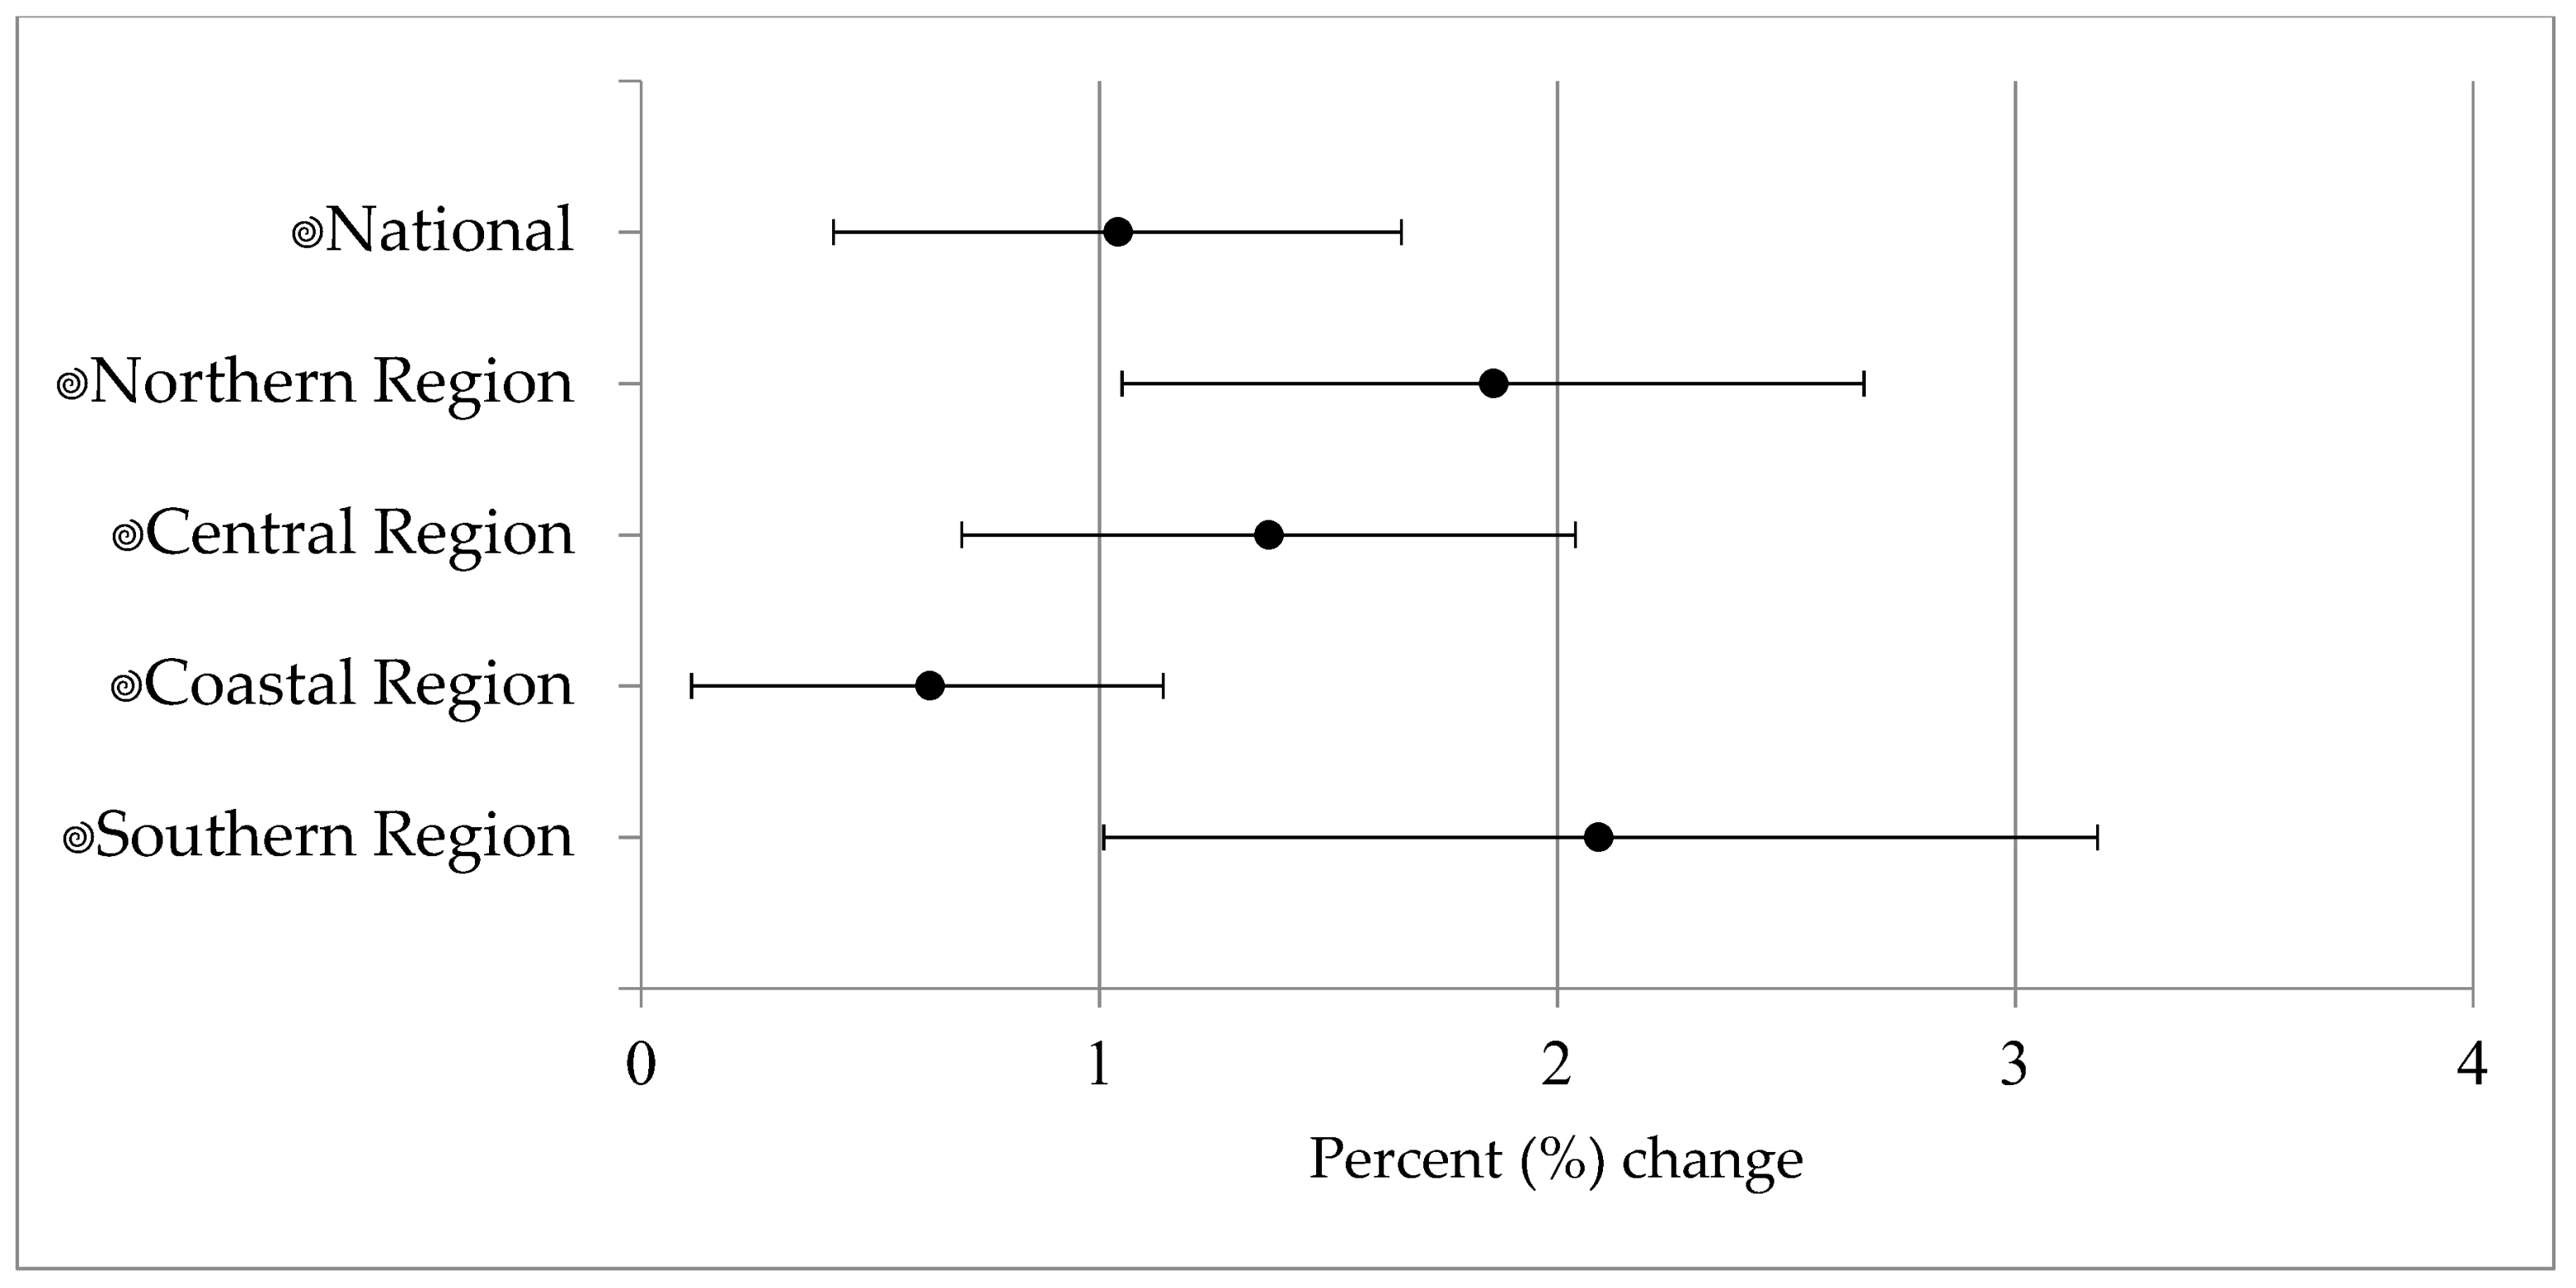
3.3. Risk Estimates—Precipitation
3.4. Risk Estimates—Temperature
3.5. Sensitivity Analysis
4. Discussion
5. Conclusions
Supplementary Materials
Acknowledgments
Author Contributions
Conflicts of Interest
References
- Alexander, K.A.; Carzolio, M.; Goodin, D.; Vance, E. Climate Change is Likely to Worsen the Public Health Threat of Diarrheal Disease in Botswana. Int. J. Environ. Res. Public Health 2013, 10, 1202–1230. [Google Scholar] [CrossRef] [PubMed]
- World Health Organization. Climate Change and Human Health—Risks and Responses; World Health Organization: Geneva, Switzerland, 2003; Available online: http://www.who.int/globalchange/publications/cchhbook/en/ (accessed on 1 December 2016).
- Field, C.B.; Barros, V.; Stocker, T.F.; Qin, D.; Dokken, D.J.; Ebi, K.L.; Mastrandrea, M.D.; Mach, K.J.; Plattner, G.-K.; Allen, S.K.; Tignor, M.; et al. Summary for Policymakers. In Managing the Risks of Extreme Events and Disasters to Advance Climate Change Adaptation; A Special Report of Working Groups I and II of the Intergovernmental Panel on Climate Change; Cambridge University Press: Cambridge, UK; New York, NY, USA, 2012; pp. 1–19. [Google Scholar]
- Carlton, E.J.; Woster, A.P.; DeWitt, P.; Goldstein, R.S.; Levy, K. A Systematic Review and Meta-Analysis of Ambient Temperature and Diarrhoeal Diseases. Int. J. Epidemiol. 2016, 45, 117–130. [Google Scholar] [CrossRef] [PubMed]
- Kolstad, E.W.; Johansson, K.A. Uncertainties Associated with Quantifying Climate Change Impacts on Human Health: A Case Study for Diarrhea. Environ. Health Perspect. 2011, 119, 299–305. [Google Scholar] [CrossRef] [PubMed]
- Field, C.B.; Barros, V.R. Human health: Impacts, adaptation, and co-benefits. In Climate Change 2014: Impacts, Adaptation, and Vulnerability. Part A: Global and Sectoral Aspects. Contribution of Working Group II to the Fifth Assessment Report of the Intergovernmental Panel on Climate Change; Cambridge University Press: Cambridge, UK; New York, NY, USA, 2014; pp. 709–754. Available online: http://www.ipcc.ch/pdf/assessment-report/ar5/wg2/WGIIAR5-Chap11_FINAL.pdf (accessed on 1 December 2016).
- Alexander, K.A.; Blackburn, J.K. Overcoming Barriers in Evaluating Outbreaks of Diarrheal Disease in Resource Poor Settings: Assessment of Recurrent Outbreaks in Chobe District, Botswana. BMC Public Health 2013, 13, 775. [Google Scholar] [CrossRef] [PubMed]
- Hashizume, M.; Armstrong, B.; Hajat, S.; Wagatsuma, Y.; Faruque, A.S.G.; Hayashi, T.; Sack, D.A. Association between Climate Variability and Hospital Visits for Non-Cholera Diarrhoea in Bangladesh: Effects and Vulnerable Groups. Int. J. Epidemiol. 2007, 36, 1030–1037. [Google Scholar] [CrossRef] [PubMed]
- Singh, R.B.; Hales, S.; de Wet, N.; Raj, R.; Hearnden, M.; Weinstein, P. The Influence of Climate Variation and Change on Diarrheal Disease in the Pacific Islands. Environ. Health Perspect. 2001, 109, 155–159. [Google Scholar] [CrossRef] [PubMed]
- Tornevi, A.; Barregard, L.; Forsberg, B. Precipitation and Primary Health Care Visits for Gastrointestinal Illness in Gothenburg, Sweden. PLoS ONE 2015, 10, e0128487. [Google Scholar] [CrossRef] [PubMed]
- Bandyopadhyay, S.; Kanji, S.; Wang, L. The Impact of Rainfall and Temperature Variation on Diarrheal Prevalence in Sub-Saharan Africa. Appl. Geogr. 2012, 33, 63–72. [Google Scholar] [CrossRef]
- Bonkoungou, I.J.O.; Haukka, K.; Österblad, M.; Hakanen, A.; Traoré, A.; Barro, N.; Siitonen, A. Bacterial and Viral Etiology of Childhood Diarrhea in Ouagadougou, Burkina Faso. BMC Pediatr. 2013, 13, 36. [Google Scholar] [CrossRef] [PubMed]
- Oloukoi, G.; Bob, U.; Jaggernath, J. Perception and Trends of Associated Health Risks with Seasonal Climate Variation in Oke-Ogun Region, Nigeria. Health Place 2014, 25, 47–55. [Google Scholar] [CrossRef] [PubMed]
- Tornheim, J.A.; Manya, A.S.; Oyando, N.; Kabaka, S.; O’reilly, C.E.; Breiman, R.F.; Feikin, D.R. The Epidemiology of Hospitalization with Diarrhea in Rural Kenya: The Utility of Existing Health Facility Data in Developing Countries. Int. J. Infect. Dis. 2010, 14, e499–e505. [Google Scholar] [CrossRef] [PubMed]
- Rabassa, M.; Skoufias, E.; Jacoby, H. Weather and Child Health in Rural Nigeria. J. Afr. Econ. 2014, 23, 464–492. [Google Scholar] [CrossRef]
- D’Souza, R.M.; Becker, N.G.; Hall, G.; Moodie, K.B.A. Does Ambient Temperature Affect Foodborne Disease? Epidemiology 2004, 15, 86–92. [Google Scholar] [CrossRef] [PubMed]
- Amegah, A.K.; Rezza, G.; Jaakkola, J.J.K. Temperature-Related Morbidity and Mortality in Sub-Saharan Africa: A Systematic Review of the Empirical Evidence. Environ. Int. 2016, 91, 133–149. [Google Scholar] [CrossRef] [PubMed]
- Azage, M.; Kumie, A.; Worku, A.; Bagtzoglou, A.C. Childhood Diarrhea Exhibits Spatiotemporal Variation in Northwest Ethiopia: A SaTScan Spatial Statistical Analysis. PLoS ONE 2015, 10, e0144690. [Google Scholar] [CrossRef] [PubMed]
- Institute for Health Metrics and Evaluation. Mozambique. 2016. Available online: http://www.healthdata.org/mozambique (accessed on 20 November 2017).
- Climate System Analysis Group. Climate Change and Health Systems in Mozambique Historical Climate Assessment; Climate System Analysis Group: Cape Town, South Africa, 2016. [Google Scholar]
- The World Bank. The World Bank in Mozambique. 2017. Available online: http://www.worldbank.org/en/country/mozambique/overview (accessed on 17 July 2017).
- Funk, C.; Peterson, P.; Landsfeld, M.; Pedreros, D.; Verdin, J.; Shukla, S.; Husak, G.; Rowland, J.; Harrison, L.; Hoell, A.; et al. The Climate Hazards Infrared Precipitation with stations—A New Environmental Record for Monitoring Extremes. Sci. Data 2015, 2, 150066. [Google Scholar] [CrossRef] [PubMed]
- Harris, I.; Jones, P.D.; Osborn, T.J.; Lister, D.H. Updated High-Resolution Grids of Monthly Climatic Observations—The CRU TS3.10 Dataset. Int. J. Climatol. 2014, 34, 623–642. [Google Scholar] [CrossRef] [Green Version]
- University of East Anglia. High-Resolution Gridded Datasets (and Derived Products). 2017. Available online: https://crudata.uea.ac.uk/cru/data/hrg/ (accessed on 17 July 2017).
- Gasparrini, A.; Armstrong, B. Time Series Analysis on the Health Effects of Temperature: Advancements and Limitations. Environ. Res. 2010, 110, 633–638. [Google Scholar] [CrossRef] [PubMed]
- Zhou, J.; Ito, K.; Lall, R.; Lippmann, M.; Thurston, G. Time-Series Analysis of Mortality Effects of Fine Participate Matter Components in Detroit and Seattle. Environ. Health Perspect. 2011, 119, 461–466. [Google Scholar] [CrossRef] [PubMed]
- Bhaskaran, K.; Gasparrini, A.; Hajat, S.; Smeeth, L.; Armstrong, B. Time Series Regression Studies in Environmental Epidemiology. Int. J. Epidemiol. 2013, 42, 1187–1195. [Google Scholar] [CrossRef] [PubMed]
- Naumova, E.N.; Jagai, J.S.; Matyas, B.; DeMaria, A.; MacNeill, I.B.; Griffiths, J.K. Seasonality in Six Enterically Transmitted Diseases and Ambient Temperature. Epidemiol. Infect. 2007, 135, 281–292. [Google Scholar] [CrossRef] [PubMed]
- World Health Organization. Quantitative Risk Assessment of the Effects of Climate Change on Selected Causes of Death, 2030s and 2050s; World Health Organization: Geneva, Switzerland, 2014. [Google Scholar]
- World Health Organization. Progress on Sanitation and Drinking Water 2015 Update and MDG Assessment; World Health Organization: Geneva, Switzerland, 2015; Available online: https://www.unicef.org/publications/index_82419.html (accessed on 20 October 2017).


| Area | Observations (n) | Districts (n) | Total Diarrhea Cases | Mean (sd) Diarrhea Cases Per Week | Mean (sd) Wet Days Per Week | Mean (sd) Maximum Temp (°C) | Mean (sd) Minimum Temp (°C) |
|---|---|---|---|---|---|---|---|
| National | 126,056 | 141 | 7,315,738 | 58.08 (80.86) | 1.23 (1.91) | 29.45 (2.94) | 18.94 (3.46) |
| Region | |||||||
| Northern | 34,555 | 38 | 1,681,018 | 48.65 (66.69) | 1.62 (2.29) | 29.19 (2.59) | 18.83 (2.99) |
| Central | 32,113 | 37 | 1,956,881 | 60.94 (63.08) | 1.29 (1.98) | 29.35 (3.18) | 18.09 (3.47) |
| Coastal | 45,821 | 51 | 3,130,416 | 68.32 (104.74) | 1.01 (1.62) | 29.57 (2.97) | 20.06 (3.28) |
| Southern | 13,567 | 15 | 547,423 | 40.35 (43.69) | 0.82 (1.26) | 29.95 (2.97) | 17.44 (3.91) |
| Area | % Change (95% CI) |
|---|---|
| National a | 3.64 (3.35, 3.93) |
| Northern Region b | 1.45 (0.77, 2.13) |
| Central Region b | 1.87 (1.44, 2.30) |
| Coastal Region b | 5.74 (5.18, 6.29) |
| Southern Region b | 2.15 (1.51, 2.80) |
© 2018 by the authors. Licensee MDPI, Basel, Switzerland. This article is an open access article distributed under the terms and conditions of the Creative Commons Attribution (CC BY) license (http://creativecommons.org/licenses/by/4.0/).
Share and Cite
Horn, L.M.; Hajat, A.; Sheppard, L.; Quinn, C.; Colborn, J.; Zermoglio, M.F.; Gudo, E.S.; Marrufo, T.; Ebi, K.L. Association between Precipitation and Diarrheal Disease in Mozambique. Int. J. Environ. Res. Public Health 2018, 15, 709. https://0-doi-org.brum.beds.ac.uk/10.3390/ijerph15040709
Horn LM, Hajat A, Sheppard L, Quinn C, Colborn J, Zermoglio MF, Gudo ES, Marrufo T, Ebi KL. Association between Precipitation and Diarrheal Disease in Mozambique. International Journal of Environmental Research and Public Health. 2018; 15(4):709. https://0-doi-org.brum.beds.ac.uk/10.3390/ijerph15040709
Chicago/Turabian StyleHorn, Lindsay M., Anjum Hajat, Lianne Sheppard, Colin Quinn, James Colborn, Maria Fernanda Zermoglio, Eduardo S. Gudo, Tatiana Marrufo, and Kristie L. Ebi. 2018. "Association between Precipitation and Diarrheal Disease in Mozambique" International Journal of Environmental Research and Public Health 15, no. 4: 709. https://0-doi-org.brum.beds.ac.uk/10.3390/ijerph15040709