Diagnosis on Transport Risk Based on a Combined Assessment of Road Accidents and Watershed Vulnerability to Spills of Hazardous Substances

 , ,
, ,  and
and 
Abstract
:1. Introduction
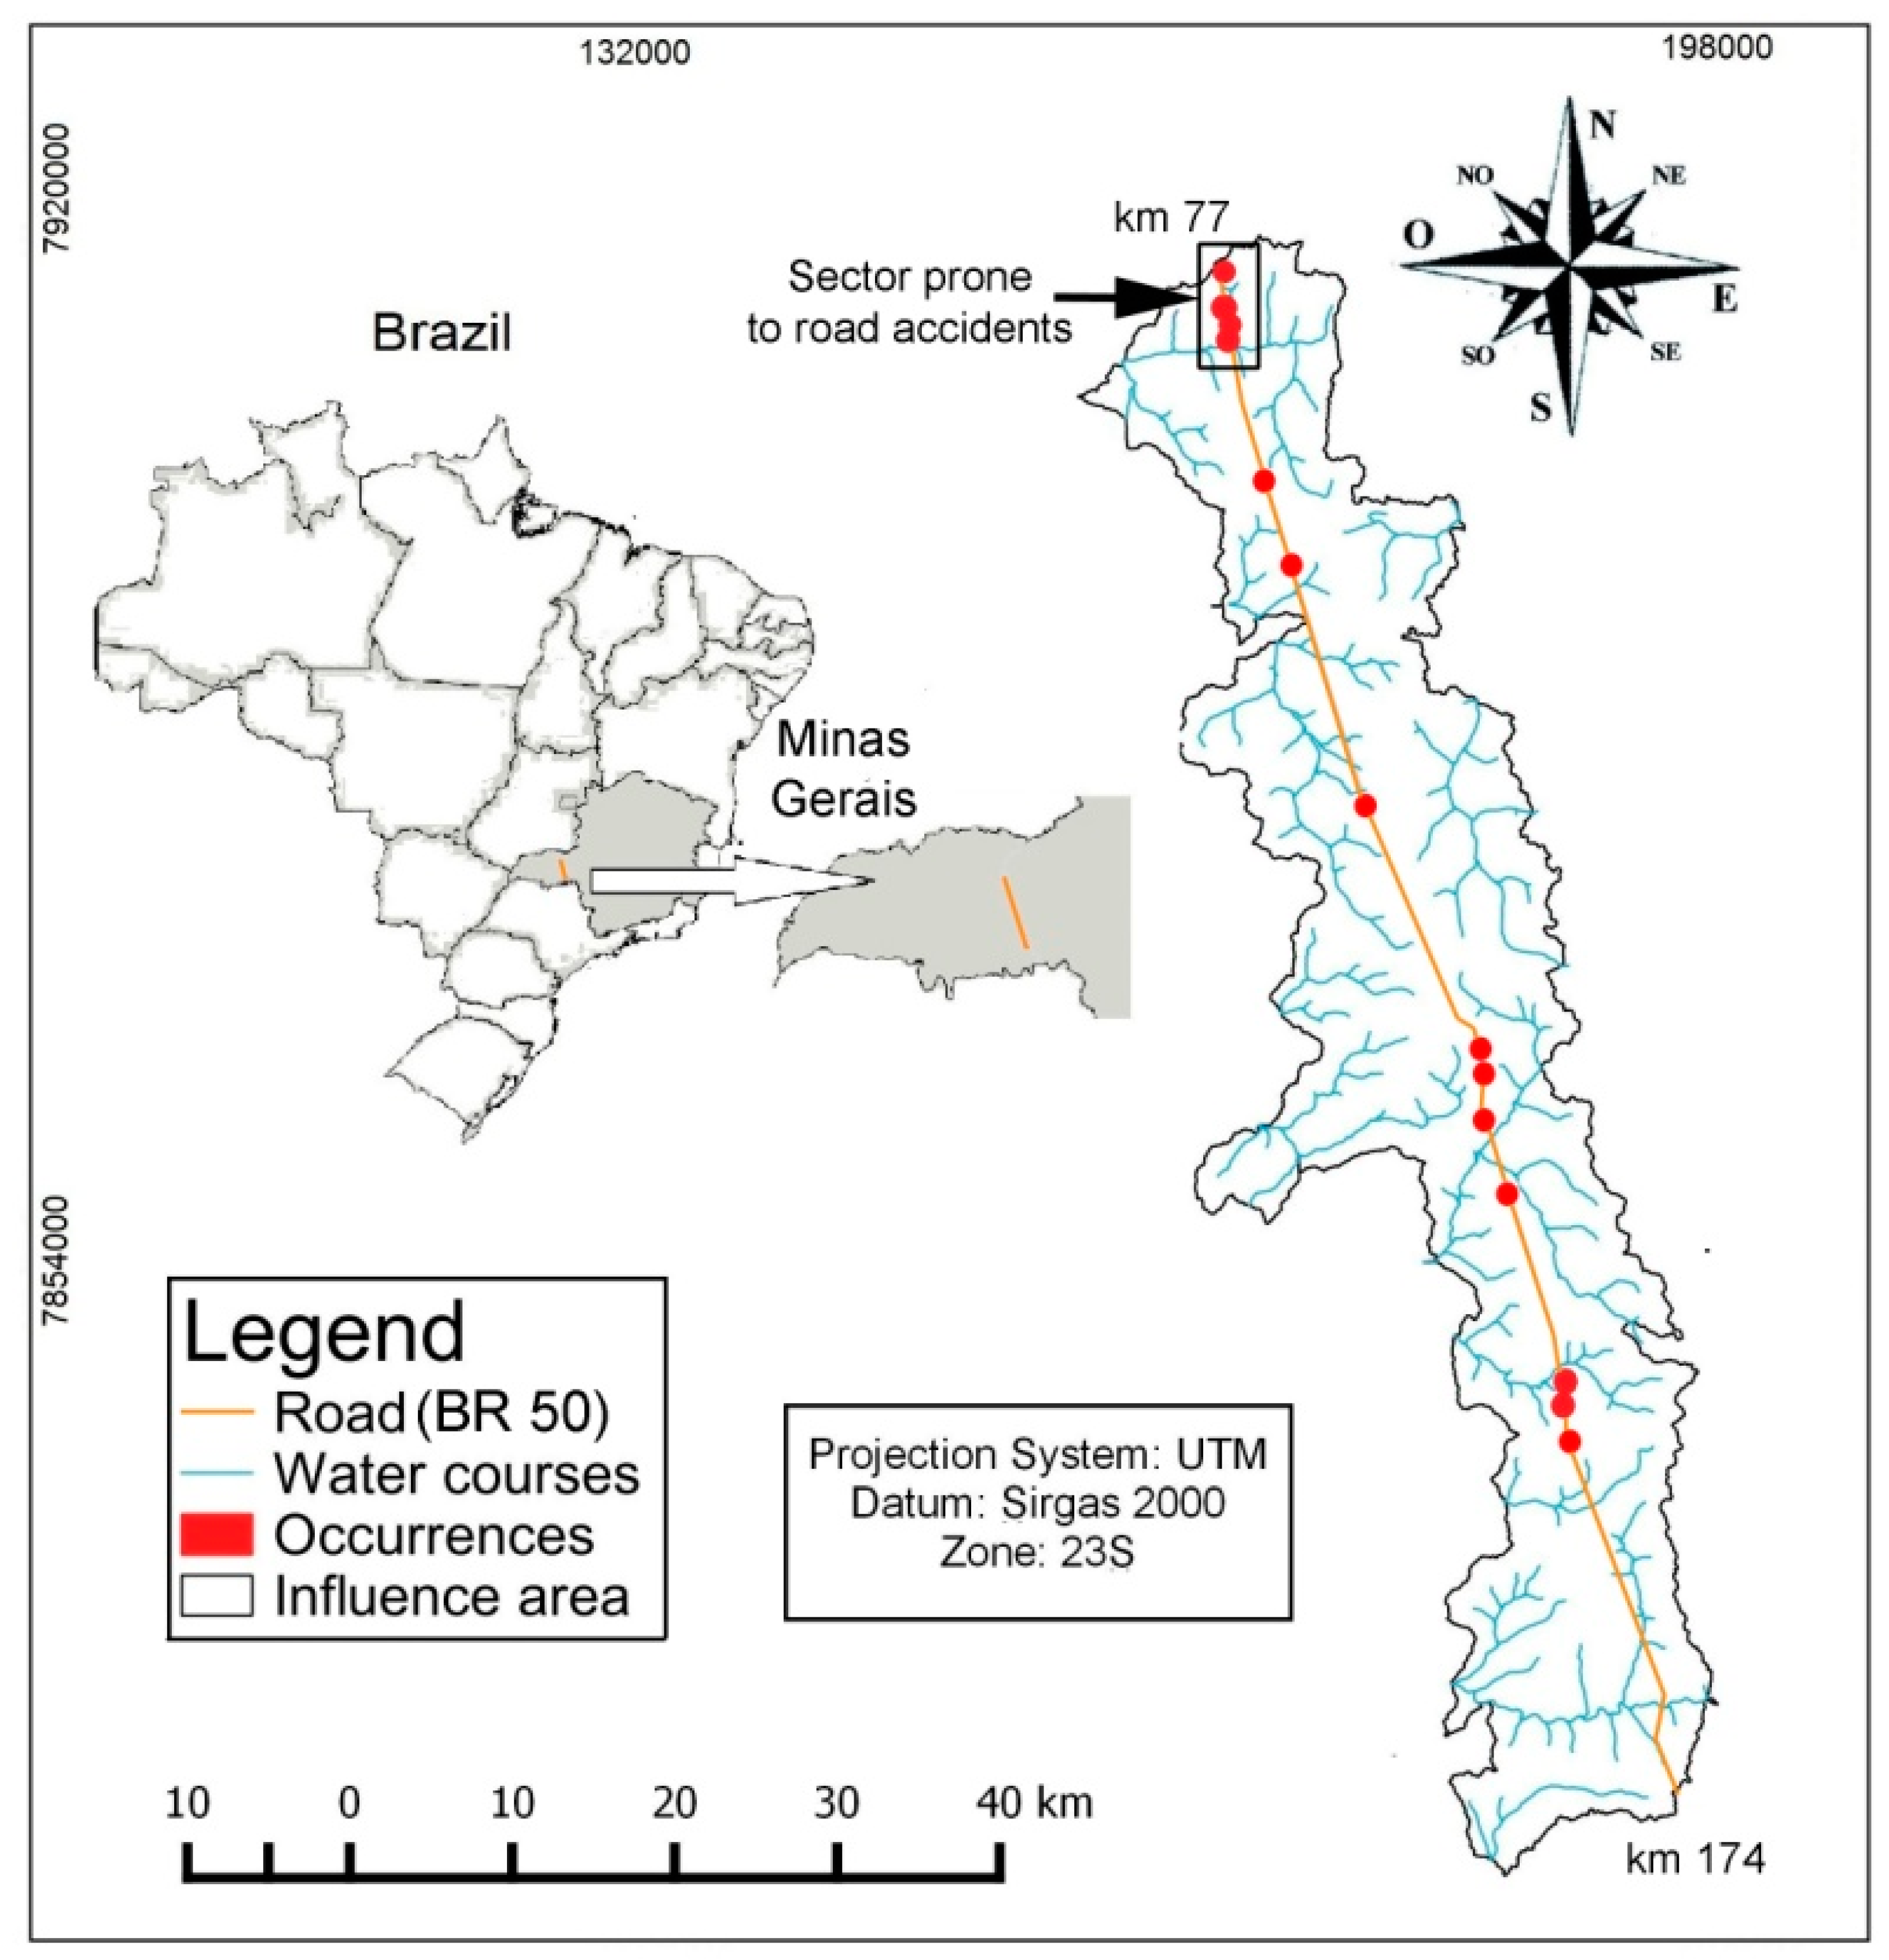
2. Area of Study
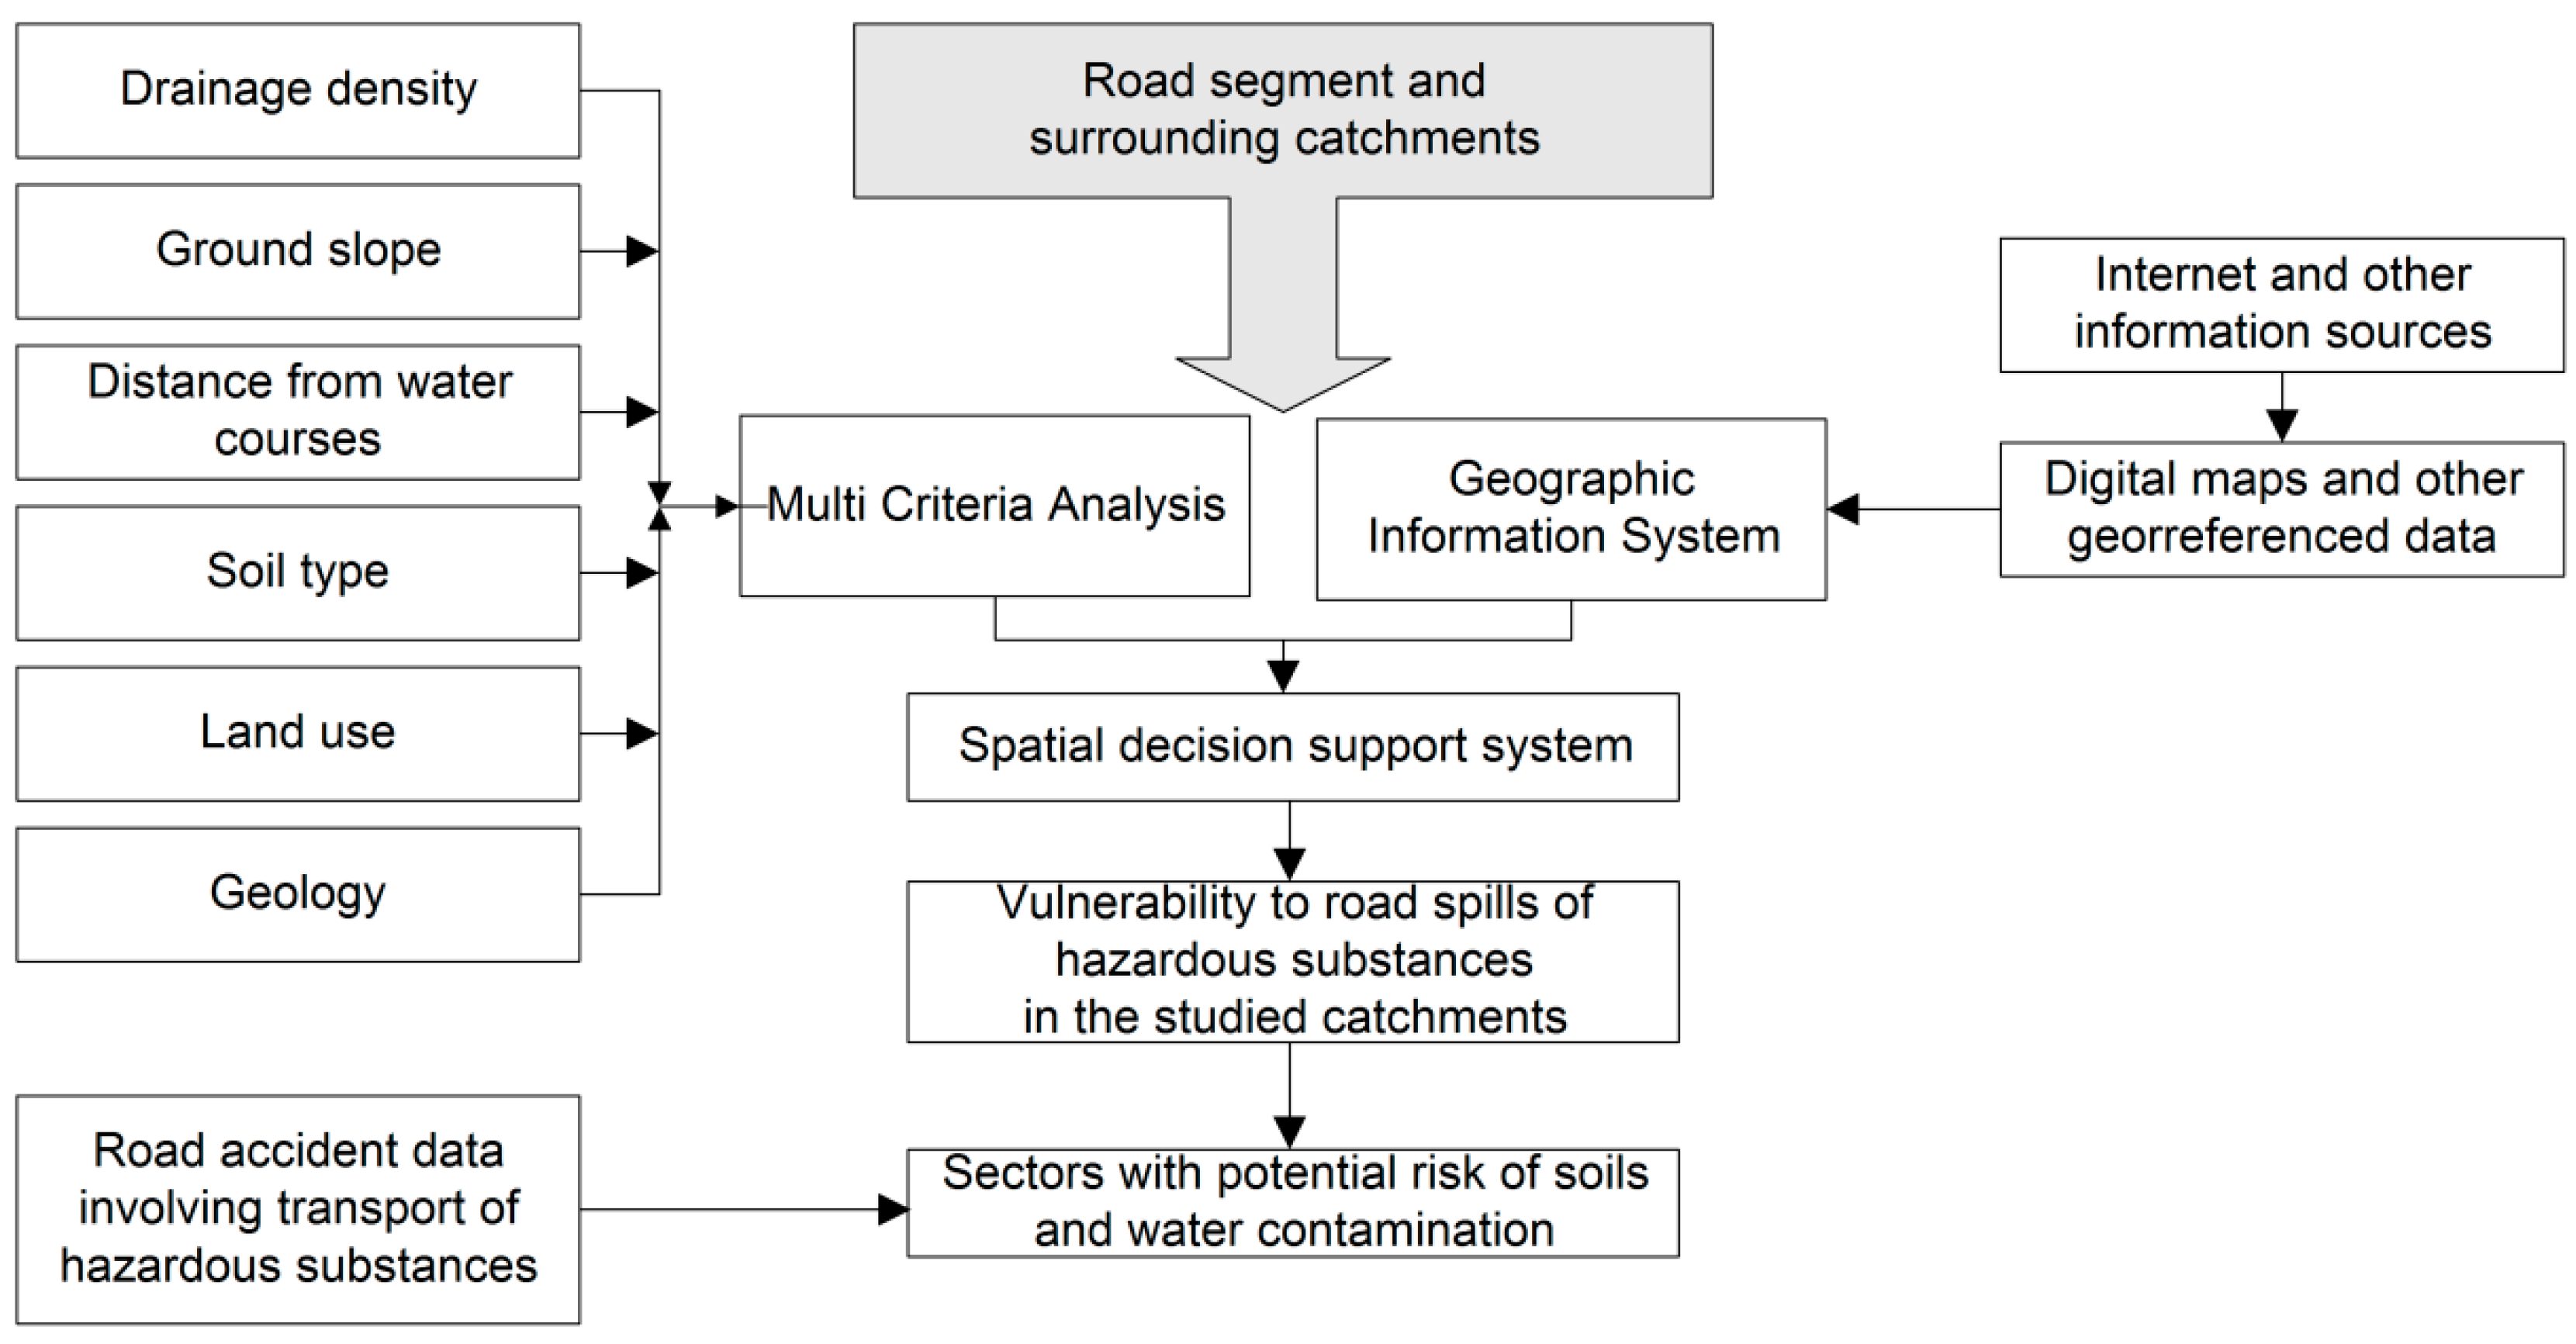
3. Materials and Methods
3.1. Determination of Vulnerability
3.2. Occurrence Data Involving Hazardous and Potentially Harmful Products to the Environment
3.3. Environmental Vulnerability at Occurrence Sites (Risk)
4. Results and Discussion
4.1. Accident Count over the Monitored Period
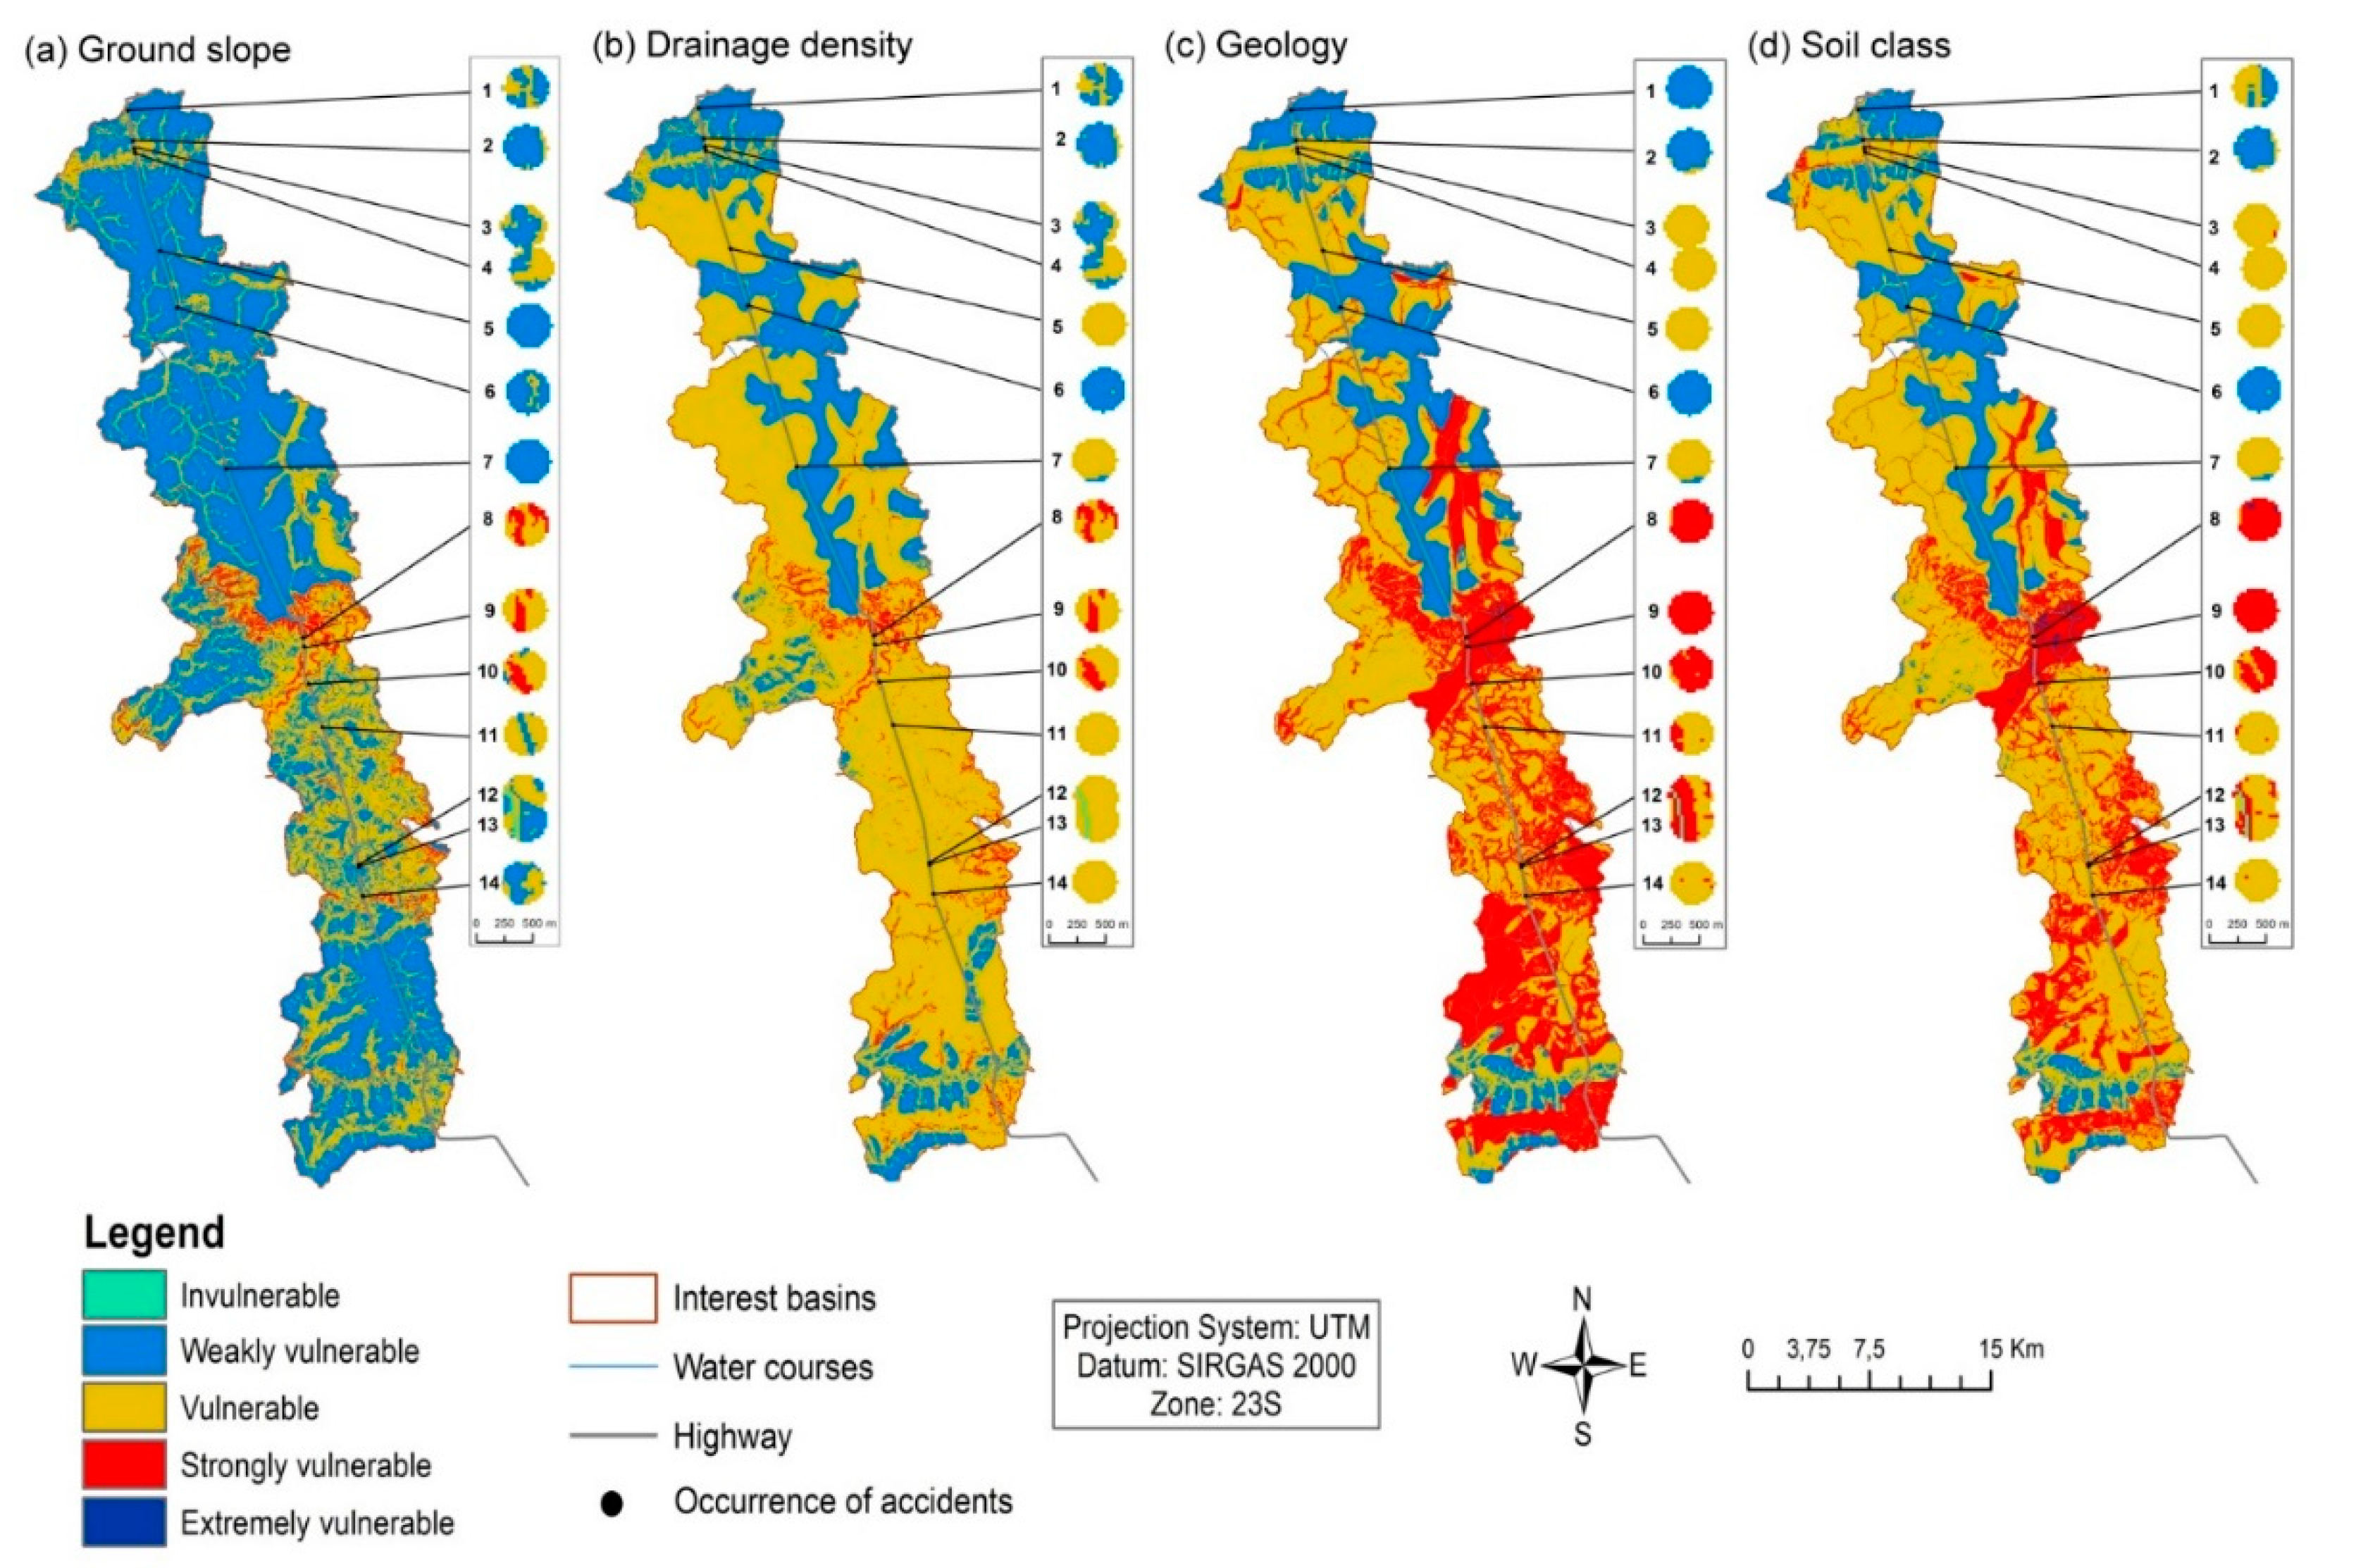
4.2. Vulnerability, Hazard and Risk
5. Conclusions
Author Contributions
Funding
Acknowledgments
Conflicts of Interest
References
- CNT. Pesquisa CNT de Rodovias 2015: Relatório Gerencial; CNT: Brasília DF, Brasíl, 2015; p. 420. [Google Scholar]
- Torretta, V.; Rada, E.C.; Schiavon, M.; Viotti, P. Decision support systems for assessing risks involved in transporting hazardous materials: A review. Saf. Sci. 2017, 92, 1–9. [Google Scholar] [CrossRef]
- Tinoco, M.A.C.; Nodari, C.T.; Pereira, K.R.S. Vulnerabilidade Ambiental, Social e viáRia em Acidentes com Transporte de Produtos Perigosos: Estudo de caso na BR-101 entre Osório e Torres, Rio Grande do Sul, Brasil; Caderno de Saúde Pública: Rio de Janeiro, Brazil, 2016; Volume 32, p. 9. [Google Scholar]
- Siqueira, H.E. Vulnerabilidade Ambiental dos Recursos Hídricos Interceptados por Rodovias na Bacia do rio Uberaba. Master’s Thesis, Faculdade de Ciências Agrárias e Veterinárias, Universidade Estadual Paulista, São Paulo, Brazil, 2016. [Google Scholar]
- Siqueira, H.E.; Pissarra, T.C.T.; Valle Junior, R.F.; Fernandes, L.F.S.; Pacheco, F.A.L.A. Multi criteria analog model for assessing the vulnerability of rural catchments to road spills of hazardous substances. Environ. Impact Assess. Rev. 2017, 64, 26–36. [Google Scholar] [CrossRef]
- Cordeiro, F.G.; Bezerra, B.S.; Peixoto, A.S.P.; Ramos, R.A.R. Methodological aspects for modeling the environmental risk of transporting hazardous materials by road. Transp. Res. D 2016, 44, 105–121. [Google Scholar] [CrossRef]
- Bellu, A.; Sanches Fernandes, L.F.; Cortes, R.M.V.; Pacheco, F.A.L. A framework model for the dimensioning and allocation of a detention basin system: The case of a flood-prone mountainous watershed. J. Hydrol. 2016, 533, 567–580. [Google Scholar] [CrossRef]
- Pacheco, F.A.L.; Sanches Fernandes, L.F. The multivariate statistical structure of DRASTIC model. J. Hydrol. 2013, 476, 442–459. [Google Scholar] [CrossRef]
- Pacheco, F.A.L.; Pires, L.M.G.R.; Santos, R.M.B.; Sanches Fernandes, L.F. Factor weighting in DRASTIC modeling. Sci. Total Environ. 2015, 505, 474–486. [Google Scholar] [CrossRef] [PubMed]
- Terêncio, D.P.S.; Sanches Fernandes, L.F.; Cortes, R.M.V.; Pacheco, F.A.L. Improved framework model to allocate optimal rainwater harvesting sites in small watersheds for agro-forestry uses. J. Hydrol. 2017, 550, 318–330. [Google Scholar] [CrossRef]
- Terêncio, D.P.S.; Sanches Fernandes, L.F.; Cortes, R.M.V.; Moura, J.P.; Pacheco, F.A.L. Rainwater harvesting in catchments for agro-forestry uses: A study focused on the balance between sustainability values and storage capacity. Sci. Total Environ. 2018, 613–614, 1079–1092. [Google Scholar] [CrossRef] [PubMed]
- Valle Junior, R.F.; Varandas, S.G.P.; Sanches Fernandes, L.F.; Pacheco, F.A.L. Multi Criteria Analysis for the monitoring of aquifer vulnerability: A scientific tool in environmental policy. Environ. Sci. Policy 2015, 48, 250–264. [Google Scholar] [CrossRef] [Green Version]
- Van Raemdonck, K.; Macharis, C.; Mairesse, O. Risk analysis system for the transport of hazardous materials. J. Saf. Res. 2013, 45, 55–63. [Google Scholar] [CrossRef] [PubMed]
- Bubbico, R.; Maschio, G.; Mazzarottaa, B.; Milazzo, M.F.; Parisia, E. Risk management of road and rail transport of hazardous materials in Sicily. J. Loss Prev. Process Ind. 2006, 19, 32–38. [Google Scholar] [CrossRef]
- Machado, E.R.; Valle Júnior, R.F.; Sanches Fernandes, L.F.; Pacheco, F.A.L. The vulnerability of the environment to spills of dangerous substances on highways: A diagnosis based on Multi Criteria Modeling. Transp. Res. Part D 2018, 62, 748–759. [Google Scholar] [CrossRef]
- Instituto Brasileiro de Geografia e Estatística (IBGE). Available online: https://cidades.ibge.gov.br/brasil/mg/uberlandia/panorama (accessed on 8 September 2018).
- Instituto Brasileiro de Geografia e Estatística (IBGE). Available online: https://cidades.ibge.gov.br/brasil/mg/uberaba/panorama (accessed on 8 September 2018).
- INMET. Normais Climatológicas Do Brasil 1961–1990: Precipitação Anual (mm). Available online: http://www.inmet.gov.br/portal/index.php?r=clima/normaisclimatologicas (accessed on 9 March 2018).
- Costa, F.S.; Silva, J.J.D.; Souza, C.M.D.; Mendes, J. Dinâmica populacional de Aedes aegypti (L) em área urbana de alta incidência de dengue. Rev. Soc. Bras. Med. Trop. 2008, 41, 309–312. [Google Scholar] [CrossRef] [PubMed] [Green Version]
- RADAMBRASIL. Levantamento de Recursos Naturais; Folha SE: Rio de Janeiro, Brazil, 1983; Volume 31, p. 22. [Google Scholar]
- CODEMIG; CPRM. Mapa Geológico do Estado de Minas Gerais. Escala 1:1.000.000. Edição Atualizada. 2014. Available online: http://www.portalgeologia.com.br/index.php/mapa/ (accessed on 5 June 2017).
- Pacheco, F.A.L. Regional groundwater flow in hard rocks. Sci. Total Environ. 2015, 506–507, 182–195. [Google Scholar] [CrossRef] [PubMed]
- Pacheco, F.A.L.; Landim, P.M.B. Two-way regionalized classification of multivariate data sets and its application to the assessment of hydrodynamic dispersion. Math. Geol. 2005, 37, 393–417. [Google Scholar] [CrossRef]
- Pacheco, F.A.L.; Van der Weijden, C.H. Weathering of plagioclase across variable flow and solute transport regimes. J. Hydrol. 2012, 420–421, 46–58. [Google Scholar] [CrossRef]
- Pacheco, F.A.L.; Van der Weijden, C.H. Integrating Topography, Hydrology and Rock Structure in Weathering Rate Models of Spring Watersheds. J. Hydrol. 2012, 428–429, 32–50. [Google Scholar] [CrossRef]
- Pacheco, F.A.L.; Van der Weijden, C.H. Role of hydraulic diffusivity in the decrease of weathering rates over time. J. Hydrol. 2014, 512, 87–106. [Google Scholar] [CrossRef]
- Pacheco, F.A.L.; Van der Weijden, C.H. Modeling rock weathering in small watersheds. J. Hydrol. 2014, 513, 13–27. [Google Scholar] [CrossRef]
- Pacheco, F.A.L.; Landim, P.M.B.; Szocs, T. Anthropogenic impacts on mineral weathering: A statistical perspective. Appl. Geochem. 2013, 36, 34–48. [Google Scholar] [CrossRef]
- Pacheco, F.A.L.; Sousa Oliveira, A.; Van der Weijden, A.J.; Van der Weijden, C.H. Weathering, biomass production and groundwater chemistry in an area of dominant anthropogenic influence, the Chaves-Vila Pouca de Aguiar region, north of Portugal. Water Air Soil Pollut. 1999, 115, 481–512. [Google Scholar] [CrossRef]
- Pacheco, F.A.L.; Santos, R.M.B.; Sanches Fernandes, L.F.; Pereira, M.G.; Cortes, R.M.V. Controls and forecasts of nitrate fluxes in forested watersheds: A view over mainland Portugal. Sci. Total Environ. 2015, 537, 421–440. [Google Scholar] [CrossRef] [PubMed]
- Sanches Fernandes, L.F.; Santos, C.; Pereira, A.; Moura, J. Model of management and decision support systems in the distribution of water for consumption: Case study in North Portugal. Eur. J. Environ. Civ. Eng. 2011, 15, 411–426. [Google Scholar] [CrossRef]
- Sanches Fernandes, L.F.; Seixas, F.; Oliveira, P.; Leitao, S.; Moura, J. Climate change impacts on nitrogen in a hydrographical basin in the northeast of Portugal. Fresenius Environ. Bull. 2012, 21, 3643–3650. [Google Scholar]
- Sanches Fernandes, L.F.; Marques, M.J.; Oliveira, P.C.; Moura, J.P. Decision support systems in water resources in the demarcated region of Douro—Case study in Pinhão River Basin, Portugal. Water Environ. J. 2014, 28, 350–357. [Google Scholar]
- Sanches Fernandes, L.F.; Terêncio, D.P.S.; Pacheco, F.A.L. Rainwater harvesting systems for low demanding applications. Sci. Total Environ. 2015, 529, 91–100. [Google Scholar] [CrossRef] [PubMed]
- Eastman, J.R. IDRISI Selva Manual; Clark Labs, Clark University: Worcester, MA, USA, 2012; 322p, Provided as a PDF with the IDRISI Selva Software Package; Available online: http://clarklabs.org/products/spanish-manual.cfm (accessed on 11 September 2018).
- Malczewski, J. GIS and Multicriteria Decision Analysis; John Wiley and Sons: New York, NY, USA, 1999; p. 392. [Google Scholar]
- Saaty, T.L. The Analytic Hierarchy Process. Planning, Priority Setting, Resource Allocation; McGraw-Hill: New York, NY, USA, 1980. [Google Scholar]
- Ambituuni, A.; Amezaga, J.M.; Werner, D. Risk assessment of petroleum product transportation by road: A framework for regulatory improvement. Saf. Sci. 2015, 79, 324–335. [Google Scholar] [CrossRef]
- Ferreira, C.E.C. Acidentes com motoristas no transporte rodoviário de produtos perigosos. São Paulo Perspect. 2003, 17, 68–80. [Google Scholar] [CrossRef]


| (a) | ||
| Environmental Factors | Accident Scenario Implications | |
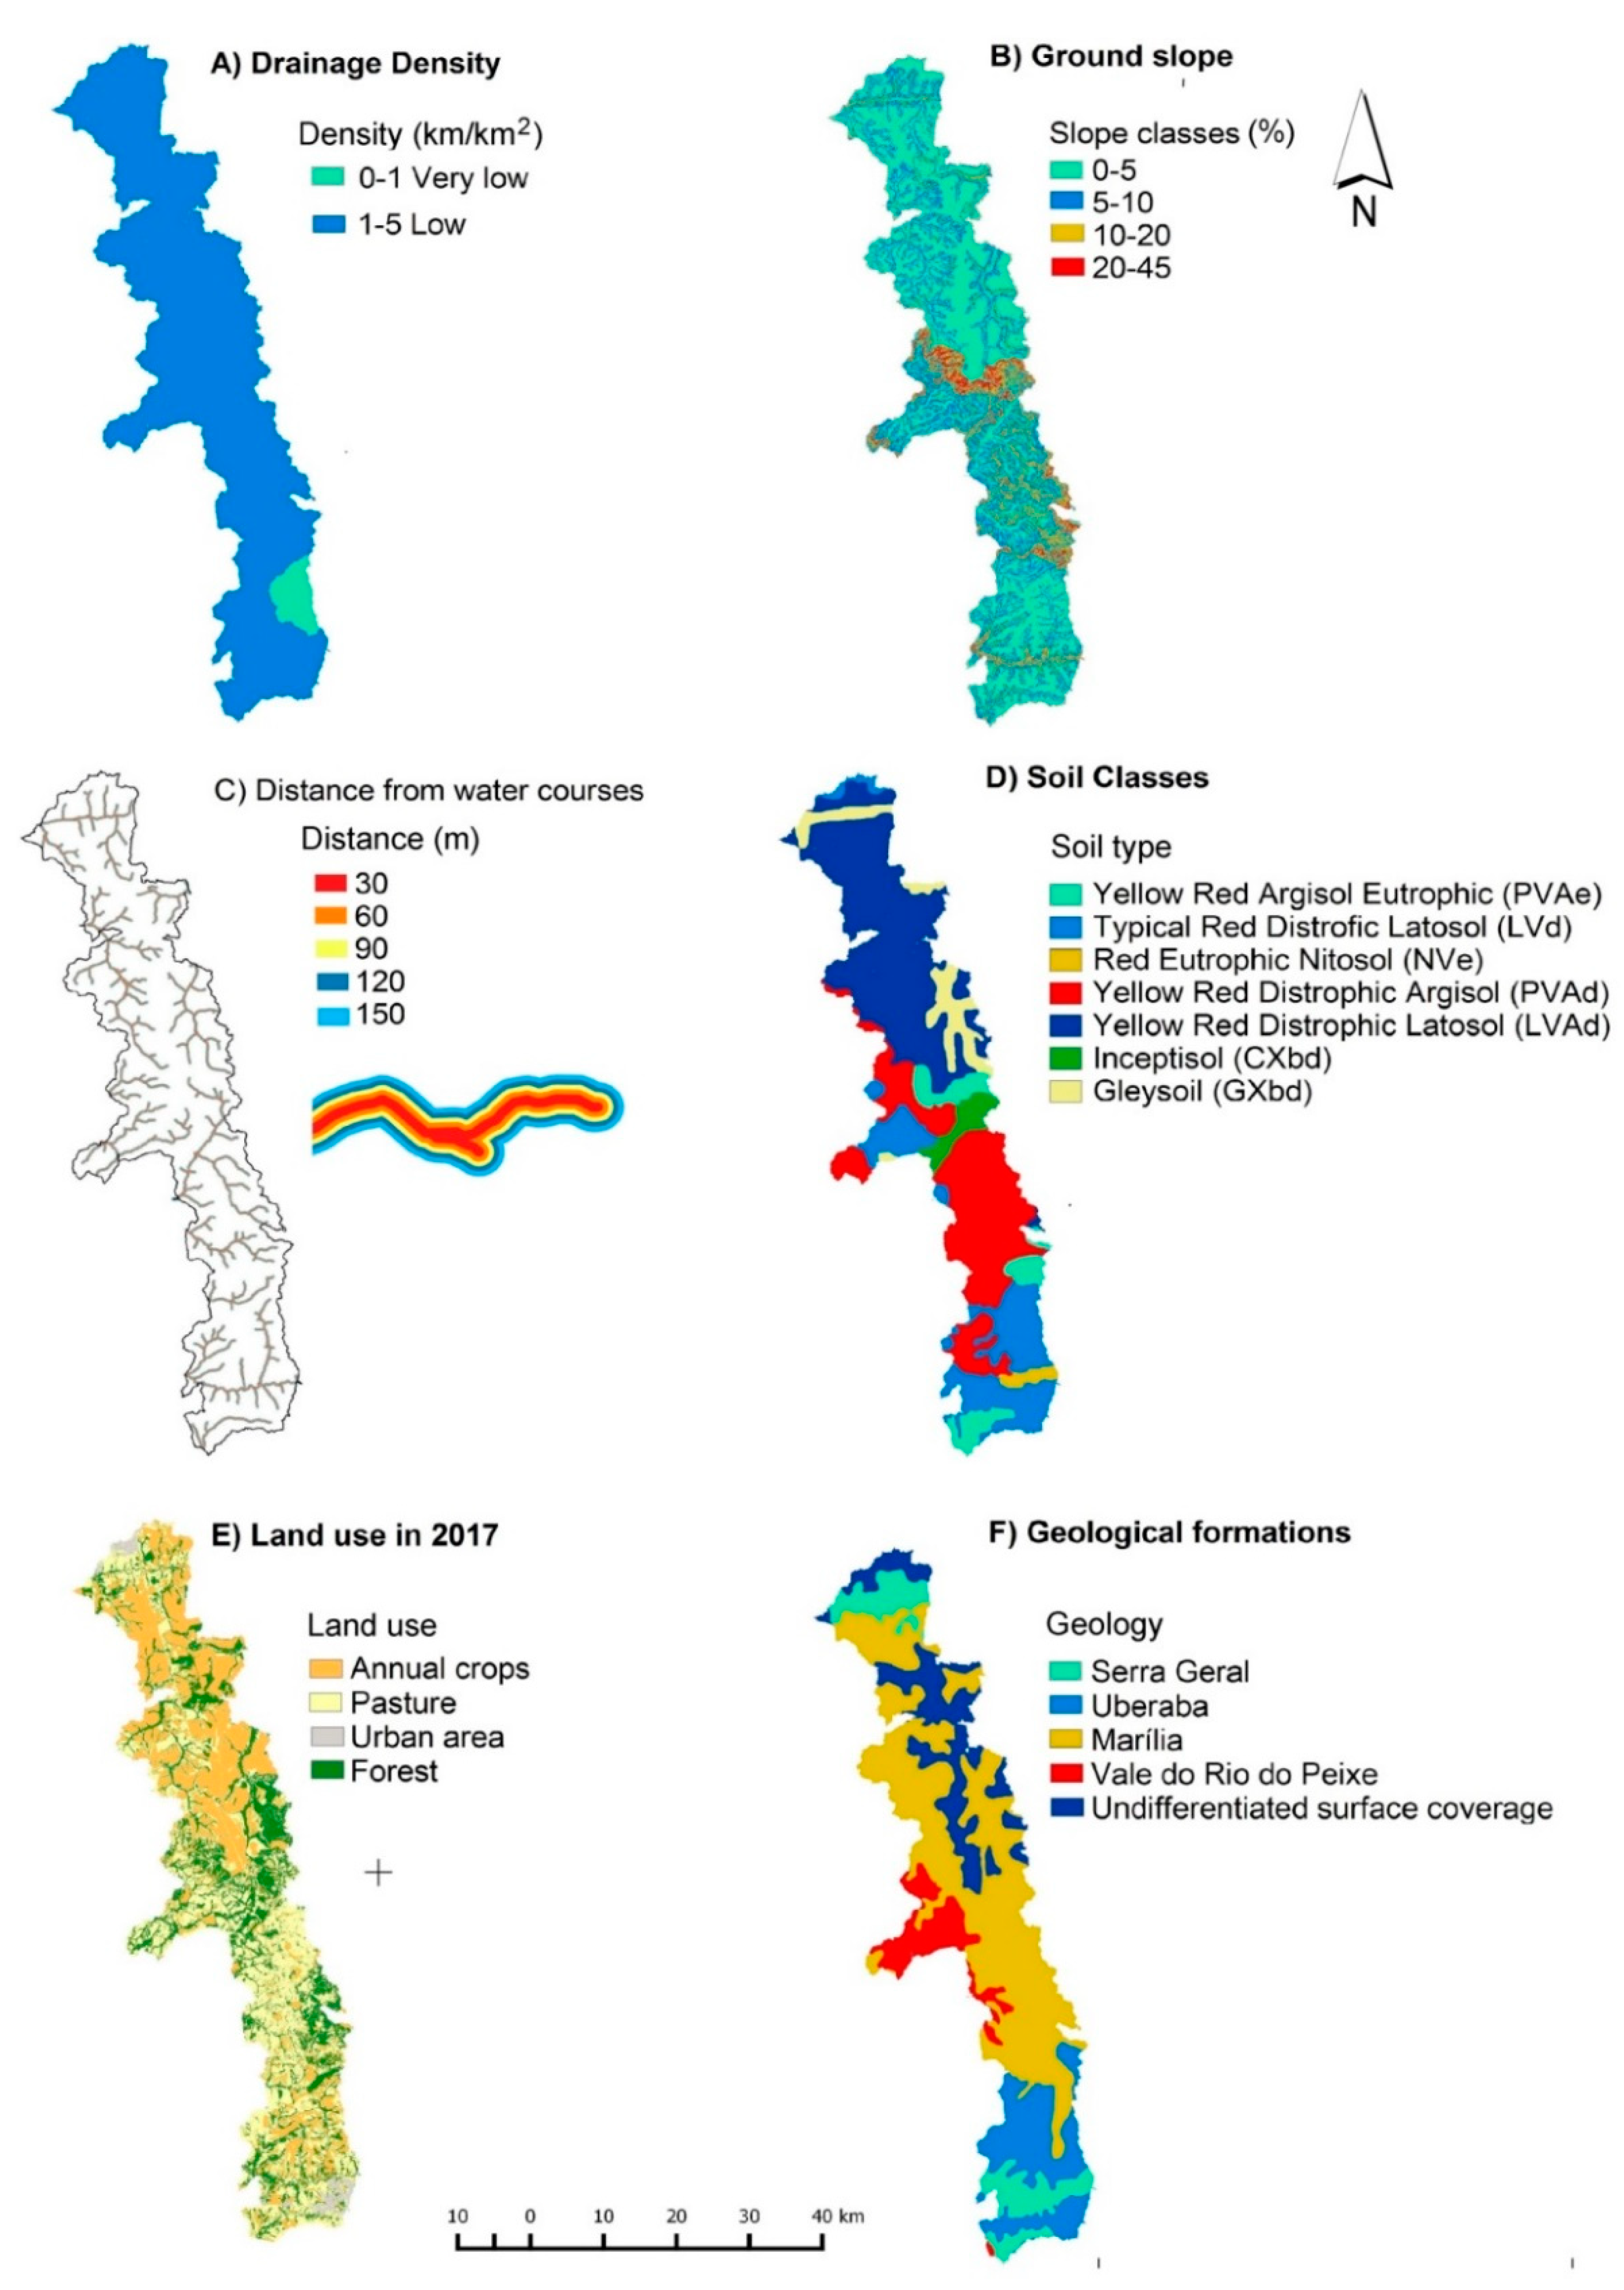
| Ground slope | Factor that describes important aspects related to the control of erosion, transport of sediments and contaminants. | |
| Drainage density/distance from water courses | It describes factors related to the likelihood of water resources and biotic environment contamination. | |
| Geology | Factors related to likelihood of contamination, socioeconomic impact and the extent of damage in accident scenarios. | |
| Soil Classes/land use or occupation | It exposes factors related to the likelihood of soil and groundwater contamination and contaminant movement in accident scenarios. | |
| (b) | ||
| Factors | Values | Normalized Values |
| Drainage density (km·km−²) | Very low | 0–1 |
| Low | 1–5 | |
| Medium | 5–13 | |
| High | 13–15 | |
| Very high | >15 | |
| Distance of water course (m) | 30 | 255 |
| 60 | 175 | |
| 90 | 115 | |
| 120 | 75 | |
| 150 | 50 | |
| Ground slope (%) | 0 a 5% | 25 |
| 5 a10% | 75 | |
| 10 a 20% | 125 | |
| 20 a 45% | 255 | |
| Soil classes | Latosol | 100 |
| Acrisol | 150 | |
| Nitisol | 180 | |
| Gleysol | 200 | |
| Cambisol | 250 | |
| Land use and occupation | Annual crops | 75 |
| Pasture | 125 | |
| Forest | 200 | |
| Urban Area | 255 | |
| Undifferentiated surface coverage | 50 | |
| Serra Geral | 100 | |
| Vale do Rio do Peixe | 150 | |
| Marília | 200 | |
| Uberaba | 255 | |
| Date | Product | UN Code | Time | Kilometer | UTM—Zone 23 S | |
|---|---|---|---|---|---|---|
| X | Y | |||||
| 09/29/14 | Diesel oil | 1202 | 13:04:00 | 082 + 180 | 161,681 | 7,898,073 |
| 10/09/14 | Ethanol | 1170 | 15:07:00 | 149 + 500 | 181,617 | 7,834,447 |
| 10/30/14 | Diesel oil | 1202 | 21:32:00 | 096 + 500 | 165,445 | 7,884,280 |
| 01/23/15 | Toluene | 1294 | 02:21:00 | 111 + 500 | 169,793 | 7,869,927 |
| 08/31/15 | Ethanol | 1170 | 15:52:00 | 152 + 120 | 181,988 | 7,831,857 |
| 09/12/15 | GLP | 1075 | 05:35:00 | 078 + 340 | 161,054 | 7,901,861 |
| 10/29/15 | Oil S10 | 1202 | 11:30:00 | 081 + 800 | 161,619 | 7,898,448 |
| 10/14/16 | Hydrated alcohol | 1170 | 06:04:00 | 091 + 200 | 163,904 | 7,889,351 |
| 02/10/17 | Diesel oil | 1202 | 12:37:00 | 129 + 100 | 176,754 | 7,854,079 |
| 07/17/17 | Hydrochloric acid | 1789 | 06:31:00 | 149 + 300 | 181,607 | 7,834,653 |
| 10/24/17 | Vegetable oil | not applicable | 10:40:00 | 136 + 600 | 178,378 | 7,846,904 |
| 10/25/17 | Limestone | not applicable | 08:45:00 | 132 + 540 | 177,162 | 7,850,754 |
| 11/13/17 | Cement | not applicable | 18:09:00 | 081 + 100 | 161,494 | 7,899,147 |
| 11/22/17 | Kerozene | 1223 | 23:01:00 | 128 + 300 | 176,647 | 7,854,871 |
| Intercepted Basins [15] | Buffers Around Road Accident Sites | ||||
|---|---|---|---|---|---|
| Scenario 1—Maximize ground slope factor | |||||
| Category | Vulnerability | Hazard | Risk—R | ||
| Area—V (hectare) | % | Area—H (hectare) | % | ||
| Invulnerable | 1425.79 | 1.12 | 1.33 | 0.79 | 0.71 |
| Weakly vulnerable | 79,725.12 | 62.46 | 85.90 | 51.05 | 0.82 |
| Vulnerable | 42,135.85 | 33.01 | 69.54 | 41.32 | 1.25 |
| Strongly vulnerable | 4337.79 | 3.40 | 11.50 | 6.83 | 2.01 |
| Extremely vulnerable | 17.07 | 0.01 | 0.00 | 0.00 | 0.00 |
| Total | 127,641.62 | 100.00 | 168.27 | 100 | |
| Scenario 2—Maximize drainage density factor | |||||
| Category | Vulnerability | Hazard | Risk—R | ||
| Area—V (hectare) | % | Area—H (hectare) | % | ||
| Invulnerable | 1416.06 | 1.11 | 1.33 | 0.79 | 0.7 |
| Weakly vulnerable | 31,358.31 | 24.57 | 44.59 | 26.50 | 1.1 |
| Vulnerable | 89,678.65 | 70.26 | 110.85 | 65.88 | 0.9 |
| Strongly vulnerable | 5188.61 | 4.06 | 11.50 | 6.83 | 1.7 |
| Extremely vulnerable | 0.00 | 0.00 | 0.00 | 0.00 | nd |
| Total | 127,641.62 | 100 | 168.27 | 100.00 | |
| Scenario 3—Maximize geology factor | |||||
| Category | Vulnerability | Hazard | Risk—R | ||
| Area—V (hectare) | % | Area—H (hectare) | % | ||
| Invulnerable | 1421.19 | 1.11 | 1.33 | 0.79 | 0.71 |
| Weakly vulnerable | 25,391.51 | 19.89 | 36.89 | 21.92 | 1.10 |
| Vulnerable | 60,624.47 | 47.50 | 81.22 | 48.26 | 1.02 |
| Strongly vulnerable | 40,073.87 | 31.40 | 48.75 | 28.97 | 0.92 |
| Extremely vulnerable | 130.58 | 0.10 | 0.09 | 0.05 | 0.50 |
| Total | 127,641.62 | 100 | 168.27 | 100 | |
| Scenario 4—Maximize soil class factor | |||||
| Category | Vulnerability | Hazard | Risk—R | ||
| Area—V (hectare) | % | Area—H (hectare) | % | ||
| Invulnerable | 1416.06 | 1.11 | 1.33 | 0.79 | 0.71 |
| Weakly vulnerable | 22,612.48 | 17.72 | 28.58 | 16.98 | 0.96 |
| Vulnerable | 77,085.70 | 60.39 | 100.15 | 59.52 | 0.99 |
| Strongly vulnerable | 26,190.75 | 20.52 | 37.95 | 22.56 | 1.10 |
| Extremely vulnerable | 336.63 | 0.26 | 0.27 | 0.16 | 0.62 |
| Total | 127,641.62 | 100 | 168.27 | 100 | |
© 2018 by the authors. Licensee MDPI, Basel, Switzerland. This article is an open access article distributed under the terms and conditions of the Creative Commons Attribution (CC BY) license (http://creativecommons.org/licenses/by/4.0/).
Share and Cite
Machado, E.R.; Valle Junior, R.F.d.; Pissarra, T.C.T.; Siqueira, H.E.; Sanches Fernandes, L.F.; Pacheco, F.A.L. Diagnosis on Transport Risk Based on a Combined Assessment of Road Accidents and Watershed Vulnerability to Spills of Hazardous Substances. Int. J. Environ. Res. Public Health 2018, 15, 2011. https://0-doi-org.brum.beds.ac.uk/10.3390/ijerph15092011
Machado ER, Valle Junior RFd, Pissarra TCT, Siqueira HE, Sanches Fernandes LF, Pacheco FAL. Diagnosis on Transport Risk Based on a Combined Assessment of Road Accidents and Watershed Vulnerability to Spills of Hazardous Substances. International Journal of Environmental Research and Public Health. 2018; 15(9):2011. https://0-doi-org.brum.beds.ac.uk/10.3390/ijerph15092011
Chicago/Turabian StyleMachado, Emerson Ribeiro, Renato Farias do Valle Junior, Teresa Cristina Tarlé Pissarra, Hygor Evangelista Siqueira, Luís Filipe Sanches Fernandes, and Fernando António Leal Pacheco. 2018. "Diagnosis on Transport Risk Based on a Combined Assessment of Road Accidents and Watershed Vulnerability to Spills of Hazardous Substances" International Journal of Environmental Research and Public Health 15, no. 9: 2011. https://0-doi-org.brum.beds.ac.uk/10.3390/ijerph15092011