Environmental and Motivational Determinants of Physical Activity among Canadian Inuit in the Arctic


Abstract
:1. Introduction
1.1. Environment and Walking Behaviour
1.2. Motivational Regulation
2. Materials and Methods
2.1. The Canadian Inuit in the Arctic
2.2. Community Profile
2.3. Psychometric Measures
Neighborhood Environmental Walkability Scale
2.4. Motivational Regulation of Exercise
2.5. Behavior
2.6. Pilot Study
2.7. Data Collection—Main Study
2.8. Data Analysis
3. Results
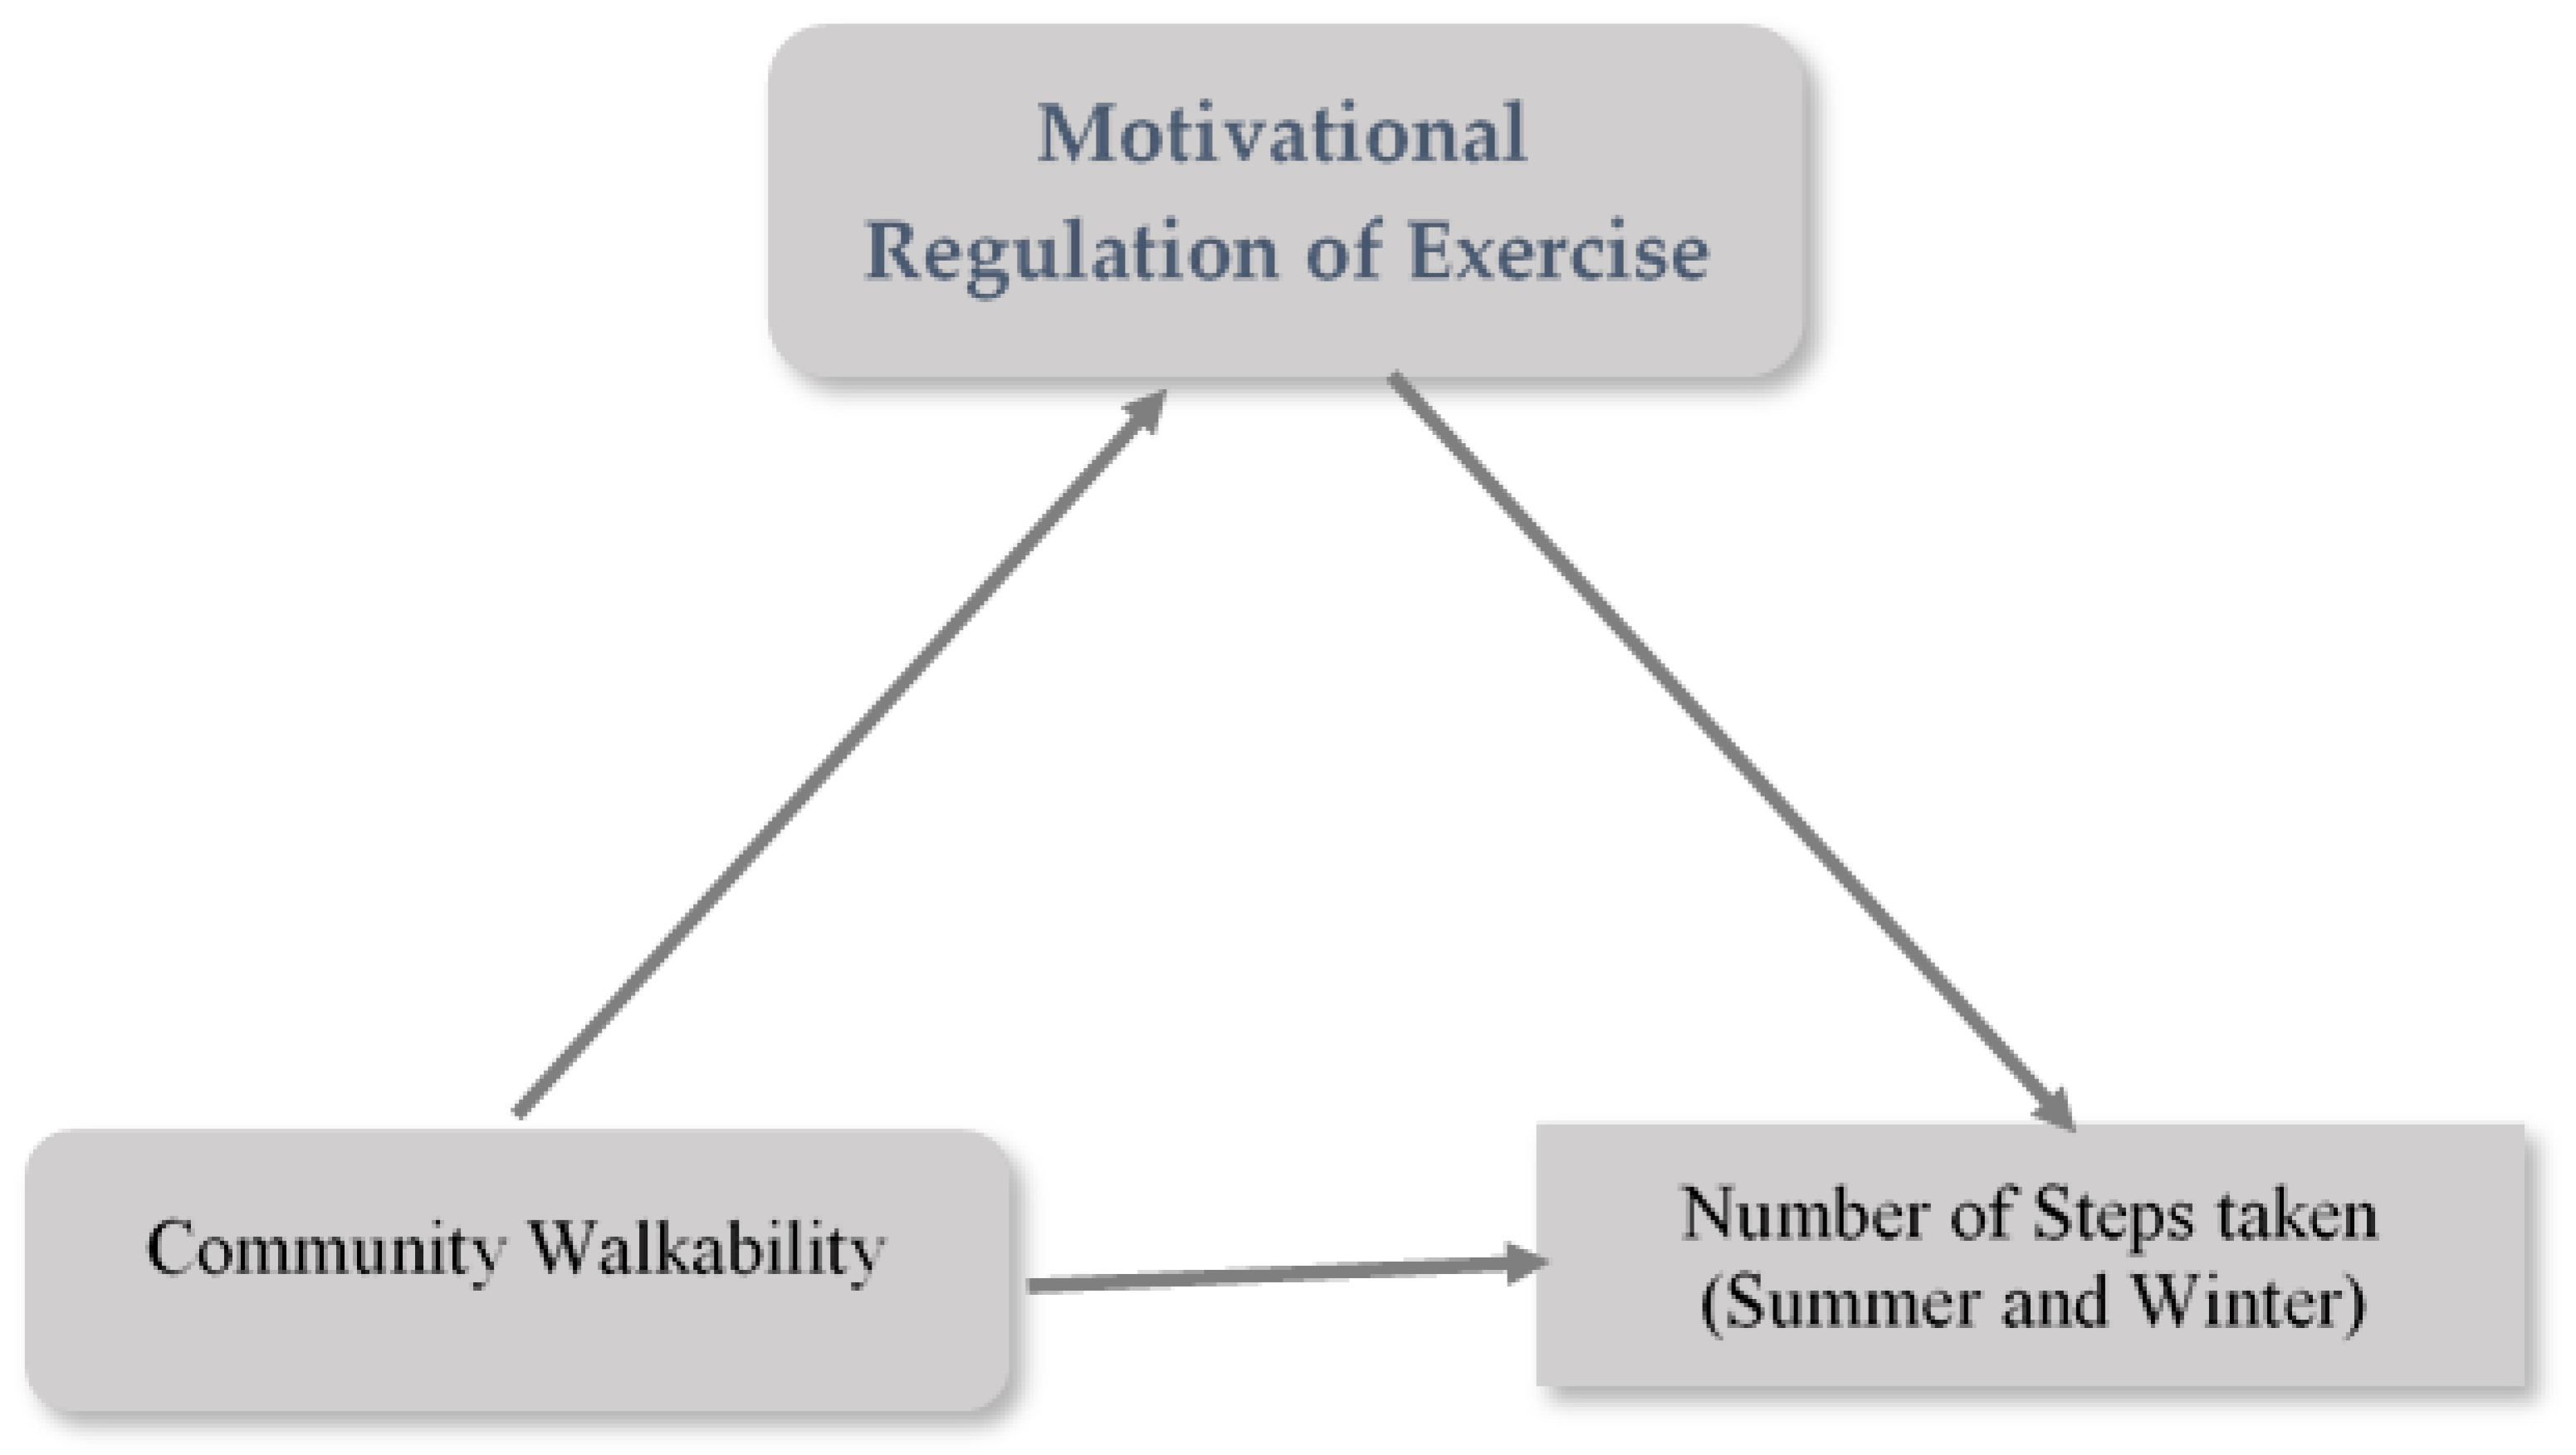
Mediation Analysis
4. Discussion
Study Limitations
5. Conclusions
Author Contributions
Funding
Acknowledgments
Conflicts of Interest
References
- Takano, T. Connections with the land Land-skills courses in Igloolik, Nunavut. Ethnography 2005, 64, 463–486. [Google Scholar] [CrossRef]
- Bjerregaard, P.; Young, T.K.; Dewailly, E.; Ebbesson, S.O. Indigenous health in the Arctic: An overview of the circumpolar Inuit population. Scand. J. Public Health 2004, 32, 390–395. [Google Scholar]
- Curtis, T.; Kvernmo, S.; Bjerregaard, P. Changing living conditions, life style and health. Int. J. Circumpolar Health 2005, 64, 442–450. [Google Scholar] [CrossRef] [PubMed]
- Akande, V.; Hendriks, A.M.; Ruiter, R.A.C.; Kremers, S.P.J. Determinants of dietary behavior and physical activity among Canadian Inuit: A systematic review. Int. J. Behav. Nutr. Phys. Act. 2015, 12, 84. [Google Scholar] [CrossRef] [PubMed]
- Rode, A.; Shephard, R.J. Physiological consequences of acculturation: A 20 year study of fitness in an Inuit community. Eur. J. Appl. Physiol. Occup. Physiol. 1994, 69, 516–524. [Google Scholar] [CrossRef] [PubMed]
- Kremers, S.P.J.; Eves, E.E.; Andersen, R.E. Environmental changes to promote physical activity and healthy dietary behavior. J. Environ. Public Health 2012, 2012, 470858. [Google Scholar] [CrossRef] [PubMed]
- de Bruijn, G.J.; Kremers, S.P.; Lensvelt-Mulders, G.; de Vries, H.; van Mechelen, W.; Brug, J. Modeling individual and physical environmental factors with adolescent physical activity. Am. J. Prev. Med. 2006, 30, 507–512. [Google Scholar] [CrossRef]
- Cerin, E.; Conway, T.L.; Saelens, B.E.; Frank, L.D.; Sallis, J.F. Cross-validation of the factorial structure of the Neighborhood Environment Walkability Scale (NEWS) and its abbreviated form (NEWS-A). Int. J. Behav. Nutr. Phys. Act. 2009, 6, 32. [Google Scholar] [CrossRef] [PubMed]
- Saelens, B.E.; Sallis, E.F.; Black, B.; Chen, D. Neighborhood-based differences in physical activity: An environmental scale evaluation. Am. J. Public Health 2003, 93, 1552–1558. [Google Scholar] [CrossRef]
- Cerin, E.; Saelens, B.E.; Sallis, J.F.; Frank, L.D. Neighborhood Environment Walkability Scale: Validity and development of a short form. Med. Sci. Sports Exerc. 2006, 38, 1682–1691. [Google Scholar] [CrossRef]
- Brownson, R.C.; Hoehner, C.M.; Day, K.; Forsyth, A.; Sallis, J.F. Measuring the built environment for physical activity: State of the science. Am. J. Prev. Med. 2009, 36, S99–S123. [Google Scholar] [CrossRef] [PubMed]
- Hawkins, M.S.; Storti, K.L.; Richardson, C.R.; King, W.C.; Strath, S.J.; Holleman, R.G.; Kriska, A.M. Objectively measured physical activity of USA adults by sex, age, and racial/ethnic groups: A cross-sectional study. Int. J. Behav. Nutr. Phys. Act. 2009, 6, 31. [Google Scholar] [CrossRef] [PubMed]
- Colley, R.C.; Garriguet, D.; Janssen, I.; Craig, C.L.; Clarke, J.; Tremblay, M.S. Physical Activity of Canadian Adults: Accelerometer Data from the 2007 to 2009 Canadian Health Measures Survey; Health Reports, Catalogue No. 82-003-X; Statistics Canada: Ottawa, Canada, 2011; Volume 22.
- Tudor-Locke, C.; Craig, C.L.; Beets, M.W.; Belton, S.; Cardon, G.M.; Duncan, S.; Hatano, Y.; Lubans, D.R.; Olds, T.S.; Raustorp, A. How many steps/day are enough? for children and adolescents. Int. J. Behav. Nutr. Phys. Act. 2011, 8, 78. [Google Scholar] [CrossRef] [PubMed]
- Tudor-Locke, C.; Craig, C.L.; Brown, W.J.; Clemes, S.A.; de Cocker, K. How many steps/day are enough? for adults. Int. J. Behav. Nutr. Phys. Act. 2011, 8, 79. [Google Scholar] [CrossRef]
- Tudor-Locke, C.; Bassett, D.R. How many steps/day are enough? Preliminary pedometer indices for public health. Sports Med. 2004, 34, 1–8. [Google Scholar] [CrossRef]
- Tudor-Locke, C.; Johnson, W.D.; Katzmarzyk, P.T. Accelerometer-determined steps per day in US adults. Med. Sci. Sports Exerc. 2009, 41, 1384–1391. [Google Scholar] [CrossRef]
- Krumm, E.M.; Dessieux, O.L.; Andrews, P.; Thompson, D.L. The relationship between daily steps and body composition in postmenopausal women. J. Women Health 2006, 15, 202–210. [Google Scholar] [CrossRef]
- McKercher, C.M.; Schmidt, M.D.; Sanderson, K.A.; Patton, G.C.; Dwyer, T.; Venn, A.J. Physical activity and depression in young adults. Am. J. Prev. Med. 2009, 36, 161–164. [Google Scholar] [CrossRef]
- Bohannon, R.W. Number of pedometer-assessed steps taken per day by adults: A descriptive meta-analysis. Phys. Ther. 2007, 87, 1642–1650. [Google Scholar] [CrossRef]
- Bassett, D.R.J.; Wyatt, H.R.; Thompson, H.; Peters, J.C.; Hill, J.O. Pedometer-measured physical activity and health behaviors in United States adults. Med. Sci. Sports Exerc. 2010, 42, 1819–1825. [Google Scholar] [CrossRef]
- Inoue, S.; Takamiya, T.; Yoshiike, N.; Shimomitsu, T. Physical activity among the Japanese: Results of the National Health and Nutrition Survey. In International Congress on Physical Activity and Public Health; United States Department of Health and Human Services: Atlanta, GA, USA, 2006; p. 79. [Google Scholar]
- de Cocker, K.; Cardon, G.; De Bourdeaudhuij, I. Pedometer-determined physical activity and its comparison with the International Physical Activity Questionnaire in a sample of Belgian adults. Res. Q. Exerc. Sport 2007, 78, 429–437. [Google Scholar] [CrossRef] [PubMed]
- McCormack, G.; Giles-Corti, B.; Milligan, R. Demographic and individual correlates of achieving 10,000 steps/day: Use of pedometers in a population-based study. Health Promot. J. Aust. 2006, 17, 43–47. [Google Scholar] [CrossRef]
- Sequeira, M.M.; Rickenbach, M.; Wietlisbach, V.; Tullen, B.; Schutz, Y. Physical activity assessment using a pedometer and its comparison with a questionnaire in a large population survey. Am. J. Epidemiol. 1995, 142, 989–999. [Google Scholar] [CrossRef] [PubMed]
- Deci, E.L.; Ryan, R.M. Intrinsic Motivation and Self-Determination in Human Behavior; Plenium Press: New York, NY, USA, 1985. [Google Scholar]
- Kremers, S.P.J.; de Bruijn, G.-J.; Visscher, T.L.S.; van Mechelen, W.; de Vries, N.K.; Brug, J. Environmental influences on energy balance-related behaviors: A dual-process view. Int. J. Behav. Nutr. Phys. Act. 2006, 3, 9. [Google Scholar] [CrossRef] [PubMed]
- Hagger, M.S.; Hardcastle, S.J.; Chater, A.; Mallett, C.; Pal, S.; Chatzisarantis, N.I.D. Autonomous and controlled motivational regulations for multiple health-related behaviours: Between- and within-participants analyses. Health Psychol. Behav. Med. 2014, 2, 565–601. [Google Scholar] [CrossRef] [PubMed]
- Teixeira, P.; Silva, M.; Mata, J.; Palmeira, A.; Markland, D. Motivation, self-determination, and longterm weight control. Int. J. Behav. Nutr. Phys. Act. 2012, 9, 22. [Google Scholar] [CrossRef]
- Kremers, S.P.J. Theory and practice in the study of influences on energy balance-related behaviors. Patient Educ. Couns. 2010, 79, 291–298. [Google Scholar] [CrossRef]
- Richmond, C.A.; Ross, N.A. The determinants of First Nation and Inuit health: A critical population health approach. Health Place 2009, 15, 403–411. [Google Scholar] [CrossRef] [Green Version]
- Statistics Canada. 2006 Census: Aboriginal Peoples in Canada in 2006—Inuit, Métis and First Nations, 2006 Census: Inuit. 2006. Available online: http://www12.statcan.ca/census-recensement/2006/as-sa/97-558/p6-eng.cfm (accessed on 15 February 2018).
- Cerin, E.; Saelens, B.E.; Sallis, J.F.; Frank, L.D. NEWS CFA—Confirmatory Factor Analysis Scoring for Neighborhood Environment Walkability Scale. 2011. Available online: http://sallis.ucsd.edu/Documents/Measures_documents/NEWS_CFA_scoring.pdf (accessed on 25 June 2018).
- Mullan, E.; Marklan, D.A.; Ingledew, D.K. A graded conceptualisation of self-determination in the regulation of exercise behaviour: Development of a measure using confirmatory factor analytic procedures. Personal. Individ. Differ. 1997, 23, 745–752. [Google Scholar] [CrossRef]
- Tabachnick, B.G.; Fidell, L.S. Using Multivariate Statistics, 4th ed.; Allyn & Bacon Inc.: New York, NY, USA, 2000. [Google Scholar]
- Fox, J. Regression Diagnostics; Sage: Newbury Park, CA, USA, 1991. [Google Scholar]
- MacKinnon, D.P.; Fairchild, A.J.; Fritz, M.S. Mediation analysis. Annu. Rev. Psychol. 2007, 58, 593–614. [Google Scholar] [CrossRef]
- Preacher, K.J.; Kelley, K. Effect size measures for mediation models: Quantitative strategies for communicating indirect effect. Psychol. Methods 2011, 16, 93–115. [Google Scholar] [CrossRef] [PubMed]
- Cervero, R.; Kockelman, K. Travel demand and the 3Ds: Density, diversity, and design. Transp. Res. Part D Transp. Environ. 1997, 2, 199–219. [Google Scholar] [CrossRef]
- Frank, L.D.; Pivo, G. Impacts of mixed use and density on utilization of three modes oftravel: Single-occupant vehicle, transit, and walking. Transp. Res. Rec. 1994, 1466, 44–52. [Google Scholar]
- Rhodes, R.E.; Brown, S.G.; McIntyre, C.A. Integrating the perceived neighborhood environment and the theory of planned behavior when predicting walking in a Canadian adult sample. Am. J. Health Promot. 2006, 21, 110–118. [Google Scholar] [CrossRef] [PubMed]
- Owen, N.; Cerin, E.; Leslie, E.; duToit, L.; Coffee., N.; Frank., L.D.; Sallis, J.F. Neighborhood walkability and the walking behavior of Australian adults. Am. J. Prev. Med. 2007, 33, 387–395. [Google Scholar] [CrossRef] [PubMed]
- Georgiadis, M.M.; Biddle, S.J.H.; Chatzisarantis, N.I.D. The Mediating role of self-determination in the relationship between goal orientations and physical self-worth in Greek exercisers. Eur. J. Sport Sci. 2006, 1, 1–9. [Google Scholar] [CrossRef]
- Verloigne, M.; De Bourdeaudhuij, I.; Tanghe, A.; D’Hondt, E.; Theuwis, L.; Vansteenkiste, M.; Deforche, B. Self-determined motivation towards physical activity in adolescents treated for obesity: An observational study. Int. J. Behav. Nutr. Phys. Act. 2011, 8, 97. [Google Scholar] [CrossRef] [PubMed]
- Vancampforta, D.; De Herta, M.; Vansteenkistec, M.; De Herdtb, A.; Scheewed, T.W.; Soundye, A.; Stubbsf, B. The importance of self-determined motivation towards physical activity in patients with schizophrenia. Psychiatry Res. 2013. [Google Scholar] [CrossRef]
- Rutten, G.M.; Meis, J.J.; Hendriks, M.R.; Hamers, F.J.M.; Veenhof, C.; Kremers, S.P.J. The contribution of lifestyle coaching of overweight patients in primary care to more autonomous motivation for physical activity and healthy dietary behaviour: Results of a longitudinal study. Int. J. Behav. Nutr. Phys. Act. 2014, 11, 86. [Google Scholar] [CrossRef]
- Dombrowski, S.U.; Sniehotta, F.F.; Avenell, A.; Johnston, M.; MacLennan, G.; Aranjo-Soares, A. Identifying active ingredients in complex behavioural interventions for obese adults with additional risk factors: A systematic review. Health Psychol. Rev. 2012, 6, 7–32. [Google Scholar] [CrossRef]
- Hagger, M.S.; Luszczynska, A. Implementation intention and action planning: Intervention in health contexts. State of the research and proposal for the way forward. Appl. Psychol. Health Well Being 2014, 6, 1–47. [Google Scholar] [CrossRef]
- MacKinnon, D.P.; Krull, J.L.; Lockwood, C.M. Equivalence of the Mediation, Confounding and Suppression Effect. Prev. Sci. 2000, 1, 173–181. [Google Scholar] [CrossRef] [PubMed]
- Peter, G.-J.Y.; Crutzen, R. Establishing determinant importance using CIBER: An introduction and tutorial. Eur. Health Psychol. 2018, 20, 484–494. [Google Scholar]
- Kok, G.; Gottlieb, N.H.; Peters, G.J.; Mullen, P.D.; Parcel, G.S.; Ruiter, R.A.; Fernández, M.E.; Markham, C.; Bartholomew, L.K. A taxonomy of behaviour change methods: An intervention mapping approach. Health Psychol. Rev. 2016, 10, 297–312. [Google Scholar] [CrossRef] [PubMed]


| Community | Population | % Male | % Female | % Non-Inuit | % Inuit | Average Temperatures | Average Snow | |
|---|---|---|---|---|---|---|---|---|
| Jan. (Winter) | Aug. (Summer) | Jan./Aug. | ||||||
| Baker Lake | 1997 | 54 | 46 | 9.1 | 90.9 | −33.3 | +9.8 | 32 cm/0 cm |
| Cambridge Bay | 1746 | 50.5 | 49.5 | 20.7 | 79.3 | −32.0 | +6.8 | 24 cm/0 cm |
| Iqaluit | 7590 | 51 | 49 | 44.6 | 55.4 | −26.9 | +7.1 | 22 cm/0 cm |
| Resolute Bay | 210 | 58 | 42 | 14.3 | 85.7 | −32.0 | +2.0 | 20 cm/0 cm |
| Variable | Sample Size (n) | % |
|---|---|---|
| Age | ||
| 18–29 | 117 | 43.0 |
| 30–39 | 57 | 21.0 |
| 40–49 | 59 | 21.7 |
| 50–64 | 39 | 14.3 |
| Gender | ||
| Male | 153 | 56.2 |
| Female | 119 | 43.8 |
| Ethnicity | ||
| Inuit | 203 | 74.6 |
| Non-Inuit | 69 | 25.4 |
| Community | ||
| Baker Laker | 62 | 22.8 |
| Cambridge Bay | 48 | 17.6 |
| Iqaluit | 139 | 51.1 |
| Resolute Bay | 23 | 8.5 |
| Graduated Steps Index | Summer Steps (%) | Winter Steps (%) |
|---|---|---|
| <2500 steps/day | 3.4 | 13.4 |
| 2500–4999 steps/day | 50.7 | 64.5 |
| 5000–7499 steps/day | 35.1 | 18.0 |
| 7500–9999 steps/day | 8.1 | 4.1 |
| 10,000–12,499 steps/day | 2.7 | 0 |
| Variables | Summer Steps | Winter Steps | Delta Steps | |||||||||||||||
|---|---|---|---|---|---|---|---|---|---|---|---|---|---|---|---|---|---|---|
| β | p-Value | R2 | β | p-Value | R2 Final Model | β | p-Value | R2 | β | p-Value | R2 Final Model | β | p-Value | R2 | β | p-Value | R2 Final Model | |
| Age | −0.07 | 0.23 | 0.38 | −0.07 | 0.35 | 0.44 | −0.10 | 0.20 | 0.34 | −0.07 | 0.36 | 0.40 | −0.02 | 0.83 | 0.12 | −0.02 | 0.84 | 0.12 |
| Gender | −0.15 | 0.04 | −0.14 | 0.04 | -0.15 | 0.03 | −0.15 | 0.02 | 0.00 | 0.99 | 0.00 | 0.99 | ||||||
| Ethnicity | 0.00 | 0.98 | −0.02 | 0.74 | −0.02 | 0.82 | −0.02 | 0.77 | −0.04 | 0.65 | −0.04 | 0.63 | ||||||
| Baker Lake | −0.01 | 0.87 | 0.07 | 0.36 | −0.04 | −0.06 | 0.05 | 0.53 | 0.08 | 0.36 | 0.09 | 0.31 | ||||||
| Cambridge Bay | −0.04 | 0.57 | 0.02 | 0.81 | −0.05 | 0.44 | 0.01 | 0.89 | 0.00 | 0.99 | 0.01 | 0.94 | ||||||
| Resolute Bay | −0.40 | <0.001 | −0.41 | <0.001 | −0.41 | <0.001 | −0.16 | 0.06 | −0.16 | 0.06 | −0.16 | 0.06 | ||||||
| Land−Use Mix Diversity | 0.20 | 0.01 | -- | -- | 0.19 | <0.001 | -- | -- | -- | -- | -- | -- | ||||||
| Infrastructure & Safety | 0.25 | <0.001 | 0.27 | <0.001 | 0.23 | <0.001 | 0.23 | <0.001 | 0.25 | <0.001 | 0.25 | <0.001 | ||||||
| Identified Regulation | -- | -- | 0.25 | <0.001 | -- | -- | 0.27 | <0.001 | -- | -- | -- | -- | ||||||
| Indictors of Mediation | Unstandardized Effect Size and [Bootstrap Confidence Intervals] | |||
|---|---|---|---|---|
| Summer Season | Winter Season | |||
| Infrastructure/Safety | Land Use Mix Diversity | Infrastructure/Safety | Land Use Mix Diversity | |
| Total effect | 1342 [(888.17)–(1817.22)] | 796 [(383.05)–(1209.12)] | 960 [(596.13)–(1324.19)] | 542 [(235.92)–(849.26)] |
| Direct effect of X on Y | 1541 [(1065.11)–2017.21)] | 855 [(443.03)–(1267.05)] | 1129 [(767.61)–(1489.85)] | 617 [(312.05)–(921.42)] |
| Indirect effect of X on Y | −199.5 [(−360.15)–(−67.05)] | −59 [(−0.170.25)–(6.61)] | −169 [(−293.12)–(−69.71)] | −74 [(−159.91)–(−12.06)] |
| Association between X and M | −0.463 [(−0.75260)–(−0.1733)] | −0.2023 [(−0.4464)–(0.0419)] | −0.463 [(-0.7024)–(-0.1699)] | −0.2441 [(−0.4624)–(−0.0258)] |
| Association between M and Y | 430 [(169.94)–(691.84)] | 291 [(17.96)–(565.00)] | 386.49 [(184.92)–(588.86)] | 303 [(93.54)–(513.88)] |
© 2019 by the authors. Licensee MDPI, Basel, Switzerland. This article is an open access article distributed under the terms and conditions of the Creative Commons Attribution (CC BY) license (http://creativecommons.org/licenses/by/4.0/).
Share and Cite
Akande, V.O.; Ruiter, R.A.C.; Kremers, S.P.J. Environmental and Motivational Determinants of Physical Activity among Canadian Inuit in the Arctic. Int. J. Environ. Res. Public Health 2019, 16, 2437. https://0-doi-org.brum.beds.ac.uk/10.3390/ijerph16132437
Akande VO, Ruiter RAC, Kremers SPJ. Environmental and Motivational Determinants of Physical Activity among Canadian Inuit in the Arctic. International Journal of Environmental Research and Public Health. 2019; 16(13):2437. https://0-doi-org.brum.beds.ac.uk/10.3390/ijerph16132437
Chicago/Turabian StyleAkande, Victor O., Robert A.C. Ruiter, and Stef P.J. Kremers. 2019. "Environmental and Motivational Determinants of Physical Activity among Canadian Inuit in the Arctic" International Journal of Environmental Research and Public Health 16, no. 13: 2437. https://0-doi-org.brum.beds.ac.uk/10.3390/ijerph16132437