The Role of Built Environment on Health of Older Adults in Korea: Obesity and Gender Differences

Abstract
:1. Introduction
2. Materials and Methods
2.1. Materials
2.2. Methods
3. Results
4. Discussion
5. Conclusions
Author Contributions
Funding
Conflicts of Interest
References
- Papas, M.A.; Alberg, A.J.; Ewing, R.; Helzlsouer, K.J.; Gary, T.L.; Klassen, A.C. The Built Environment and Obesity. Epidemiol Rev. 2007, 29, 129–143. [Google Scholar] [CrossRef] [PubMed] [Green Version]
- Xu, Y.; Wang, F. Built environment and obesity by urbanicity in the U.S. Health Place 2015, 34, 19–29. [Google Scholar] [CrossRef] [PubMed] [Green Version]
- Information from the World Health Organization (WHO). 2019. Available online: https://www.who.int/ (accessed on 10 January 2019).
- Wadden, T.A.; Womble, L.G. Handbook of Obesity Treatment; The Guilford Press: New York, NY, USA, 2002; pp. 105–148. [Google Scholar]
- Wendel-Vos, W.; Droomers, M.; Kremers, S.; Brug, J.; Van Lenthe, F. Potential environmental determinants of physical activity in adults: A systematic review. Obes. Rev. 2007, 8, 425–440. [Google Scholar] [CrossRef] [PubMed]
- Singh, G.K.; Siahpush, M.; Kogan, M.D. Neighborhood Socioeconomic Conditions, Built Environments, and Childhood Obesity. Health Aff. 2010, 29, 503–512. [Google Scholar] [CrossRef] [PubMed]
- Ewing, R.; Schmid, T.; Killingsworth, R.; Zlot, A.; Raudenbush, S. Relationship between urban sprawl and physical activity, obesity, and morbidity. Am. J. Health Prom. 2003, 18, 47–57. [Google Scholar] [CrossRef]
- Haines, J.; Neumark-Sztainer, D.; Wall, M.; Story, M. Personal, Behavioral, and Environmental Risk and protective factors for Adolescent Overweight. Obesity 2007, 15, 2748–2760. [Google Scholar] [CrossRef] [PubMed]
- Giles-Corti, B.; Broomhall, M.H.; Knuiman, M.; Collins, C.; Douglas, K.; NG, K.; Lange, A.; Donovan, R.J. Increasing walking: How important is distance to, attractiveness, and size of public open space? Am. J. Prev. Med. 2005, 28, 169–176. [Google Scholar] [CrossRef] [PubMed]
- Korea Centers for Disease Control and Prevention. 2019. Available online: http://www.cdc.go.kr/cdc_eng/ (accessed on 5 March 2019).
- Korea Is Now an ‘Aged’ Society. 2013. Available online: http://koreajoongangdaily.joins.com/news/article/article.aspx?aid=3052445 (accessed on 5 March 2019).
- Michael, Y.L.; Gold, R.; Perrin, N.; Hillier, T. Built environment and change in body mass index in older women. Health Place 2013, 22, 7–10. [Google Scholar] [CrossRef] [Green Version]
- Scott, D.; Happell, B. The high prevalence of poor physical health and unhealthy lifestyle behaviours in individuals with severe mental illness. Issues Ment. Health Nurs. 2011, 32, 589–597. [Google Scholar] [CrossRef]
- Hill, J.O.; Wyatt, H.R.; Reed, G.W.; Peters, J.C. Obesity and the Environment: Where Do We Go from Here? Science 2003, 299, 853–855. [Google Scholar] [CrossRef] [Green Version]
- Booth, K.M.; Pinkston, M.M.; Poston, W.S.C. Obesity and The Built Environment. J. Am. Diet Associ. 2005, 105, 110–117. [Google Scholar] [CrossRef] [PubMed]
- Guthman, J. Too much food and too little sidewalk? Problematizing the obesogenic environment thesis. Environment and Planning A. Econ. Space. 2013, 45, 142–158. [Google Scholar]
- Swinburn, B.; Egger, G.; Razza, F. Dissecting obesogenic environments: The development and application of a framework for identifying and prioritizing environmental interventions for obesity. Prev. Med. 1999, 29, 563–570. [Google Scholar] [CrossRef] [PubMed]
- Powell, P.; Spears, K.; Rebori, M. What Is Obesogenic Environment? University of Nevada Cooperative Extension, Fact Sheet-10-11. 2010. Available online: http://agris.fao.org/agris-search/search.do?recordID=US201300159968 (accessed on 30 December 2013).
- Lee, S.A.; Ju, Y.J.; Lee, J.E.; Hyun, I.S.; Nam, J.Y.; Han, K.T.; Park, E.C. The relationship between sports facility and accessibility and physical activity among Korean adults. BMC Pub. Health 2016, 16, 893. [Google Scholar] [CrossRef] [PubMed]
- Huang, T.T.; Drewnowski, A.; Kumanyika, S.K.; Glass, T.A. A systems-oriented multilevel framework for addressing obesity in the 21st century. Prev. Chronic Dis. 2009, 6, A82. Available online: https://0-www-ncbi-nlm-nih-gov.brum.beds.ac.uk/pmc/articles/PMC2722412/ (accessed on 15 June 2009). [PubMed]
- Pruchno, R.; Wilson-Genderson, M.; Gupta, A.K. Neighborhood food environment and obesity in community-dwelling older adults: Individual and neighborhood effects. Am. J. Public Health 2014, 104, 924–929. [Google Scholar] [CrossRef] [PubMed]
- Troped, P.J.; Starnes, H.A.; Puett, R.C.; Tamura, K.; Cromley, E.K.; James, P.; Ben-Joseph, E.; Melly, S.J.; Laden, F. Relationships Between the Built Environment and Walking and Weight Status Among Older Women in Three, U.S. States. J. Aging Phys. Act. 2014, 22, 114–125. [Google Scholar] [CrossRef]
- Bell, J.A.; Hamer, M.; Shankar, A. Gender-specific associations of objective and perceived neighborhood characteristics with body mass index and waist circumference among older adults in the English Longitudinal Study of Ageing. Am. J. Public Health 2014, 104, 1279–1286. [Google Scholar] [CrossRef]
- Frank, L.D.; Andresen, M.A.; Schmid, T.L. Obesity relationships with community design, physical activity, and time spent in cars. Am. J. Prev. Med. 2004, 27, 87–96. [Google Scholar] [CrossRef]
- Berke, E.M.; Koepsell, T.D.; Moudon, A.V.; Hoskins, R.E.; Larson, E.B. Association of the Built Environment with Physical Activity and Obesity in Older Person. Am. J. Pub. Health 2007, 97, 486–492. [Google Scholar] [CrossRef]
- Glass, T.A.; Rasmussen, M.D.; Schwartz, B.S. Neighborhoods and obesity in older adults. The Baltimore Memory Study. Am. J. Prev. Med. 2006, 31, 455–463. [Google Scholar] [CrossRef] [PubMed]
- Shiue, I. Associated social factors of body mass index in adults and the very old in the UK. Int. J. Cardiol. 2013, 168, 543–545. [Google Scholar] [CrossRef] [PubMed]
- Pearson, A.L.; Bentham, G.; Day, P.; Kingham, S. Associations between neighbourhood environmental characteristics and obesity and related behaviours among adult New Zealanders. BMC Public Health 2014, 14, 553. [Google Scholar] [CrossRef] [PubMed]
- Boehmer, T.K.; Hoehner, C.M.; Deshpande, A.D.; Brennan Ramirez, L.K.; Brownson, R.C. Perceived and observed neighborhood indicators of obesity among urban adults. Int. J. Obes. Lond. 2007, 31, 968–977. [Google Scholar] [CrossRef] [PubMed] [Green Version]
- Black, J.L.; Macinko, J. Neighborhoods and obesity. Nutr. Rev. 2008, 66, 2–20. [Google Scholar] [CrossRef] [PubMed]
- Kim, J.; Shon, C.; Yi, S. The Relationship between Obesity and Urban Environment in Seoul. Int. J. Environ. Res. Pub. Health 2017, 14, 898. [Google Scholar] [CrossRef] [PubMed]
- Owen, N.; Humpel, N.; Leslie, E.; Bauman, A.; Sallis, J.F. Understanding environmental influences on walking; Review and research agenda. Am. J. Prev. Med. 2004, 27, 67–76. [Google Scholar] [CrossRef] [PubMed]
- Saelens, B.E.; Sallis, J.F.; Black, J.B.; Chen, D. Neighborhood-Based Differences in Physical Activity: An Environment Scale Evaluation. Am. J. Pub. Health 2003, 93, 1552–1558. [Google Scholar] [CrossRef]
- Coombes, E.; Jones, A.P.; Hillsdon, M. The relationship of physical activity and overweight to objectively measured green space accessibility and use. Soc. Sci. Med. 2010, 70, 816–822. [Google Scholar] [CrossRef] [Green Version]
- Fisher, K.J.; Li, F.; Michael, Y.; Cleveland, M. Neighborhood-Level Influences on Physical Activity Among Older Adults: A Multilevel Analysis. J. Aging Phys. Act. 2004, 12, 45–63. [Google Scholar] [CrossRef]
- Michael, Y.; Beard, T.; Choi, D.; Farquhar, S.; Carlson, N. Measuring the Influence of Built Neighborhood Environments on Walking in Older Adults. J. Aging Phys Act. 2006, 14, 302–312. [Google Scholar] [CrossRef] [PubMed]
- Li, F.; Fisher, J.; Brownson, R.C. A multilevel analysis of change in neighborhood walking activity in older adults. J. Aging Phys. Act. 2005, 13, 145–159. [Google Scholar] [CrossRef] [PubMed]
- Nagel, C.L.; Carlson, N.E.; Bosworth, M.; Michael, Y.L. The Relation between Neighborhood Built Environment and Walking Activity among Older Adults. Am. J. Epidemiol. 2008, 168, 461–468. [Google Scholar] [CrossRef] [PubMed] [Green Version]
- Li, F.; Fisher, K.J.; Brownson, R.C.; Bosworth, M. Multilevel modelling of built environment characteristics related to neighbourhood walking activity in older adults. J Epidemiol. Com. Health 2005, 59, 558–564. [Google Scholar] [CrossRef] [PubMed] [Green Version]
- Handy, S.L.; Boarnet, M.G.; Ewing, R.; Killingsworth, R.E. How the built environment affects physical activity: Views from urban planning. Am. J. Prev. Med. 2002, 23, 64–73. [Google Scholar] [CrossRef]
- Ying, Z.; Ning, L.D.; Xin, L. Relationship Between Built environment, Physical Activity, Adiposity, and Health in Adults Aged 46-80 in Shanghai, China. J. Phys. Act. Health 2015, 12, 569–578. [Google Scholar] [CrossRef] [PubMed]
- Christman, Z.; Pruchno, R.; Cromley, E.; Wilson-Genderson, M.; Mir, I. A spatial analysis of body mass index and neighborhood factors in community-dwelling older men and women. Int. J. Aging Hum. Dev. 2016, 83, 3–25. [Google Scholar] [CrossRef] [PubMed]
- Myers, C.A.; Slack, T.; Martin, C.K.; Broyles, S.T.; Heymsfield, S.B. Regional disparities in obesity prevalence in the United States: A spatial regime analysis. Obesity 2015, 23, 481–487. [Google Scholar] [CrossRef] [PubMed]
- Robert, S.A. Socioeconomic position and health: The independent contribution of community socioeconomic context. Annu. Rev. Sociol. 1999, 25, 489–516. [Google Scholar] [CrossRef]
- Li, F.; Harmer, P.; Cardinal, B.J.; Bosworth, M.; Johnson-Shelton, D.; Moore, J.M.; Acock, A.; Vongjaturapat, N. Built Environment and 1-Year Change in Weight and Waist Circumference in Middle-Aged and Older Adults. Am. J. Epidemiol. 2009, 169, 401–408. [Google Scholar] [CrossRef] [PubMed]
- King, A.C.; Sallis, J.F.; Frank, L.D.; Saelens, B.E.; Cain, K.; Conway, T.L.; Chapman, J.E.; Ahn, D.K.; Kerr, J. Aging in Neighborhoods Differing in Walkability and Income: Associations with Physical Activity and Obesity in Older Adults. Soc. Sci. Med. 2011, 73, 1525–1533. [Google Scholar] [CrossRef] [PubMed]
- Forjuoh, S.N.; Ory, M.G.; Won, J.; Towne, S.D., Jr.; Wang, S.; Lee, C. Determinants of Walking among Middle-Aged and Older Overweight and Obese Adults: Sociodemographic, Health and Built environmental Factors. J. Obes. 2017. [Google Scholar] [CrossRef] [PubMed]
- Bengoechea, E.G.; Spence, J.C.; McGannon, K.R. Gender differences in perceived environmental correlates of physical activity. Int. J. Behav. Nutr. Phys. Act. 2005, 2, 12. [Google Scholar] [CrossRef] [PubMed]
- Lee, Y.S. Gender Differences in Physical Activity and Walking Among Older Adults. J. Women Aging. 2005, 17, 55–70. [Google Scholar] [CrossRef] [PubMed]
- Li, W.; Procter-Gray, E.; Churchill, L.; Crouter, S.E.; Kane, K.; Tian, J.; Franklin, P.D.; Ockene, J.K.; Gurwitz, J. Gender and Age Differences in Levels, Types and Locations of Physical Activity among Older Adults Living in Car-Dependent Neighborhoods. J. Frailty Aging. 2017, 6, 129–135. [Google Scholar] [PubMed]
- Brownson, R.C.; Housemann, R.A.; Brown, D.R.; Jackson-Thompson, J.; King, A.C.; Malone, B.R.; Sallis, J.F. Promoting physical activity in rural communities: Walking trail access, use, and effects. Am. J. Prev. Med. 2000, 18, 235–241. [Google Scholar] [CrossRef]
- Collia, D.V.; Sharp, J.; Giesbrecht, L. The 2001 National Household Travel Survey: A look into the travel patterns of older Americans. J. Safety Res. 2003, 34, 461–470. [Google Scholar] [CrossRef] [PubMed]
- Araújo, C.A.H.; Giehl, M.W.C.; Danielewicz, A.L.; Araujo, P.G.; d’Orsi, E.; Boing, A.F. Built environment, contextual income, and obesity in older adults: Evidence from a population-based study. Cad Saude Publica 2018, 34. [Google Scholar] [CrossRef]
- Lee, K.H.; Ahn, K.H. Effects of neighborhood environment on residents’ health: A case study of 40 areas in Seoul. J. Korea Plan. Assoc. 2008, 43, 249–261. [Google Scholar]
- Kim, E.; Kang, M.G. Effects of built environment and individual characteristics on health condition. J. Korean Reg. Sci Assoc. 2011, 27, 27–42. [Google Scholar]
- Lee, C.; Lee, S. Analysis of the Impacts of Neighborhood Environment on Physical Activity and Health Status in Seoul, Korea—Application of Multilevel Analysis with the Korea National Health and Nutrition Examination Survey (2007–2012). J. Korea Plan. Assoc. 2016, 51, 217–239. [Google Scholar] [CrossRef]
- Lee, K.H.; Ahn, K.H. The correlation between neighborhood characteristics and walking of residents–a case study of 40 areas in Seoul. J Korea Plan. Assoc. 2007, 42, 105–118. [Google Scholar]
- Kim, H.C.; Ahn, K.H.; Kwon, Y.S. The effects of residential environmental factors on personal walking probability: Focused on Seoul. J. Urban Des. Inst. Korea. 2014, 15, 5–18. [Google Scholar]
- Park, S.H.; Choi, Y.M.; Seo, H.L.; Kim, J.H. Perception of Pedestrian Environment and Satisfaction of Neighborhood Walking-An Impact Study based on Four Residential Communities in Seoul, Korea. J. Archit. Inst. Korea Plan. Des. 2009, 25, 253–261. [Google Scholar]
- Jun, H.J.; Namgung, M. Gender difference and spatial heterogeneity in local obesity. Int. J. Environ. Res. Pub. Health 2018, 15, 311. [Google Scholar] [CrossRef] [PubMed]
- Li, F.; Harmer, P.A.; Cardinal, B.J.; Bosworth, M.; Acock, A.; Johnson-Shelton, D.; Moore, J.M. Built Environment, Adiposity, and Physical Activity in Adults Aged 50–75. Am. J. Prev. Med. 2008, 35, 38–46. [Google Scholar] [CrossRef] [PubMed]
- Li, F.; Harmer, P.; Cardinal, B.J.; Bodworth, M.; Johnson-Shelton, D. Obesity and the Built Environment: Does the Density of Neighborhood Fast-Food Outlets Matter? Am. J. Health Promot. 2009, 23, 203–209. [Google Scholar] [CrossRef] [PubMed] [Green Version]
- Inagami, S.; Cohen, D.A.; Brown, A.F.; Asch, S.M. Body mass index, neighborhood fast food and restaurant concentration, and car ownership. J. Urban Health 2009, 86, 683–695. [Google Scholar] [CrossRef]
- Mehta, N.K.; Chang, V.W. Weight Status and Restaurant Availability: A Multilevel Analysis. Am. J. Prev. Med. 2008, 34, 127–133. [Google Scholar] [CrossRef] [Green Version]
- Bhat, C.R.; Guo, J.Y. A comprehensive analysis of built environment characteristics on household residential choice and auto ownership levels. Transp. Res. Part B Methodol. 2007, 41, 506–526. [Google Scholar] [CrossRef] [Green Version]
- Koohsari, M.J.; Kaczynski, A.T.; Hanibuchi, T.; Shibata, A.; Ishii, K.; Yasunaga, A.; Nakaya, T.; Oka, K. Physical Activity Environment and Japanese Aldults’ Body Mass Index. Int. J. Environ. Res. Public Health 2018, 15, 596. [Google Scholar] [CrossRef] [PubMed]
- Columbia University Mailman School of Public Health. 2019. Available online: https://www.mailman.columbia.edu/research/population-health-methods/ (accessed on 2 March 2019).
- Integrating Disaster Science and Management: Global Case Studies in Mitigation and Recovery; Samui, P.; Kim, D.; Ghosh, C. (Eds.) Elsevier: Amsterdam, Netherlands, 2018. [Google Scholar]
- Fotheringham, A.S.; Brunsdon, C.; Charlton, M. Geographically Weighted Regression: The Analysis of Spatially Varying Relationships; Wiley: New Jersey, NJ, USA, 2002. [Google Scholar]
- Snipes, M.; Taylor, D.C. Model selection and Akaike Information Criteria: An example from wine ratings and prices. Wine Econ. Policy 2014, 3, 3–9. [Google Scholar] [CrossRef] [Green Version]


| Variables | N | Mean | S.D. | Min | Max |
|---|---|---|---|---|---|
| Local obesity rate for women | 217 | 25.94 | 5.96 | 9.19 | 38.82 |
| Local obesity rate for men | 217 | 21.43 | 5.13 | 11.02 | 38.71 |
| Number of fast-food per 1000 people | 217 | 0.51 | 0.27 | 0.06 | 2.35 |
| Number of sports facilities per 1000 people | 217 | 2.09 | 6.30 | 0.71 | 94.95 |
| Level of land-use mix | 217 | 0.34 | 0.16 | 0.07 | 0.76 |
| Intersection density | 217 | 52.00 | 47.48 | 0 | 298 |
| Employment density | 217 | 1615.48 | 3744.59 | 2.72 | 36,494.80 |
| Percentage of high school graduates | 217 | 24.59 | 12.63 | 7.23 | 73.73 |
| Percentage of basic living recipients | 217 | 3.73 | 1.78 | 0.68 | 9.10 |
| Variables | Older Women | Older Men | ||||
|---|---|---|---|---|---|---|
| OLS | GWR | OLS | GWR | |||
| Coef. (S.E.) | t-stat | Mean | Coef. (S.E.) | t-stat | Mean | |
| Intercept | 23.03*** (2.02) | 11.39 | 23.914 | 17.60*** (1.62) | 10.88 | 17.663 |
| Number of fast-food restaurants per 1000 people | 1.58 (1.97) | 0.80 | 0.878 | 3.71** (1.58) | 2.35 | 3.864 |
| Number of sports facilities per 1000 people | 0.05 (0.06) | 0.77 | 0.045 | −0.11** (0.05) | −2.32 | −0.110 |
| Level of land-use mix | 3.72 (2.80) | 1.33 | 0.366 | 2.71 (2.24) | 1.21 | 2.673 |
| Intersection density | −0.01 (0.01) | −1.47 | −0.011 | 0.01 (0.01) | 1.32 | 0.009 |
| Employment density | −0.00 (0.00) | −0.71 | 0.000 | 0.00 (0.00) | −1.28 | 0.000 |
| Percentage of high school graduates | 0.14*** (0.04) | 3.54 | 0.145 | 0.13*** (0.03) | 4.10 | 0.120 |
| Percentage of basic living recipients | −0.50** (0.24) | −2.09 | −0.339 | −0.57*** (0.19) | −2.96 | –0.574 |
| Akaike Information Criterion (AIC) | 1360.60 | 1344.95 | 1264.05 | 1263.75 | ||
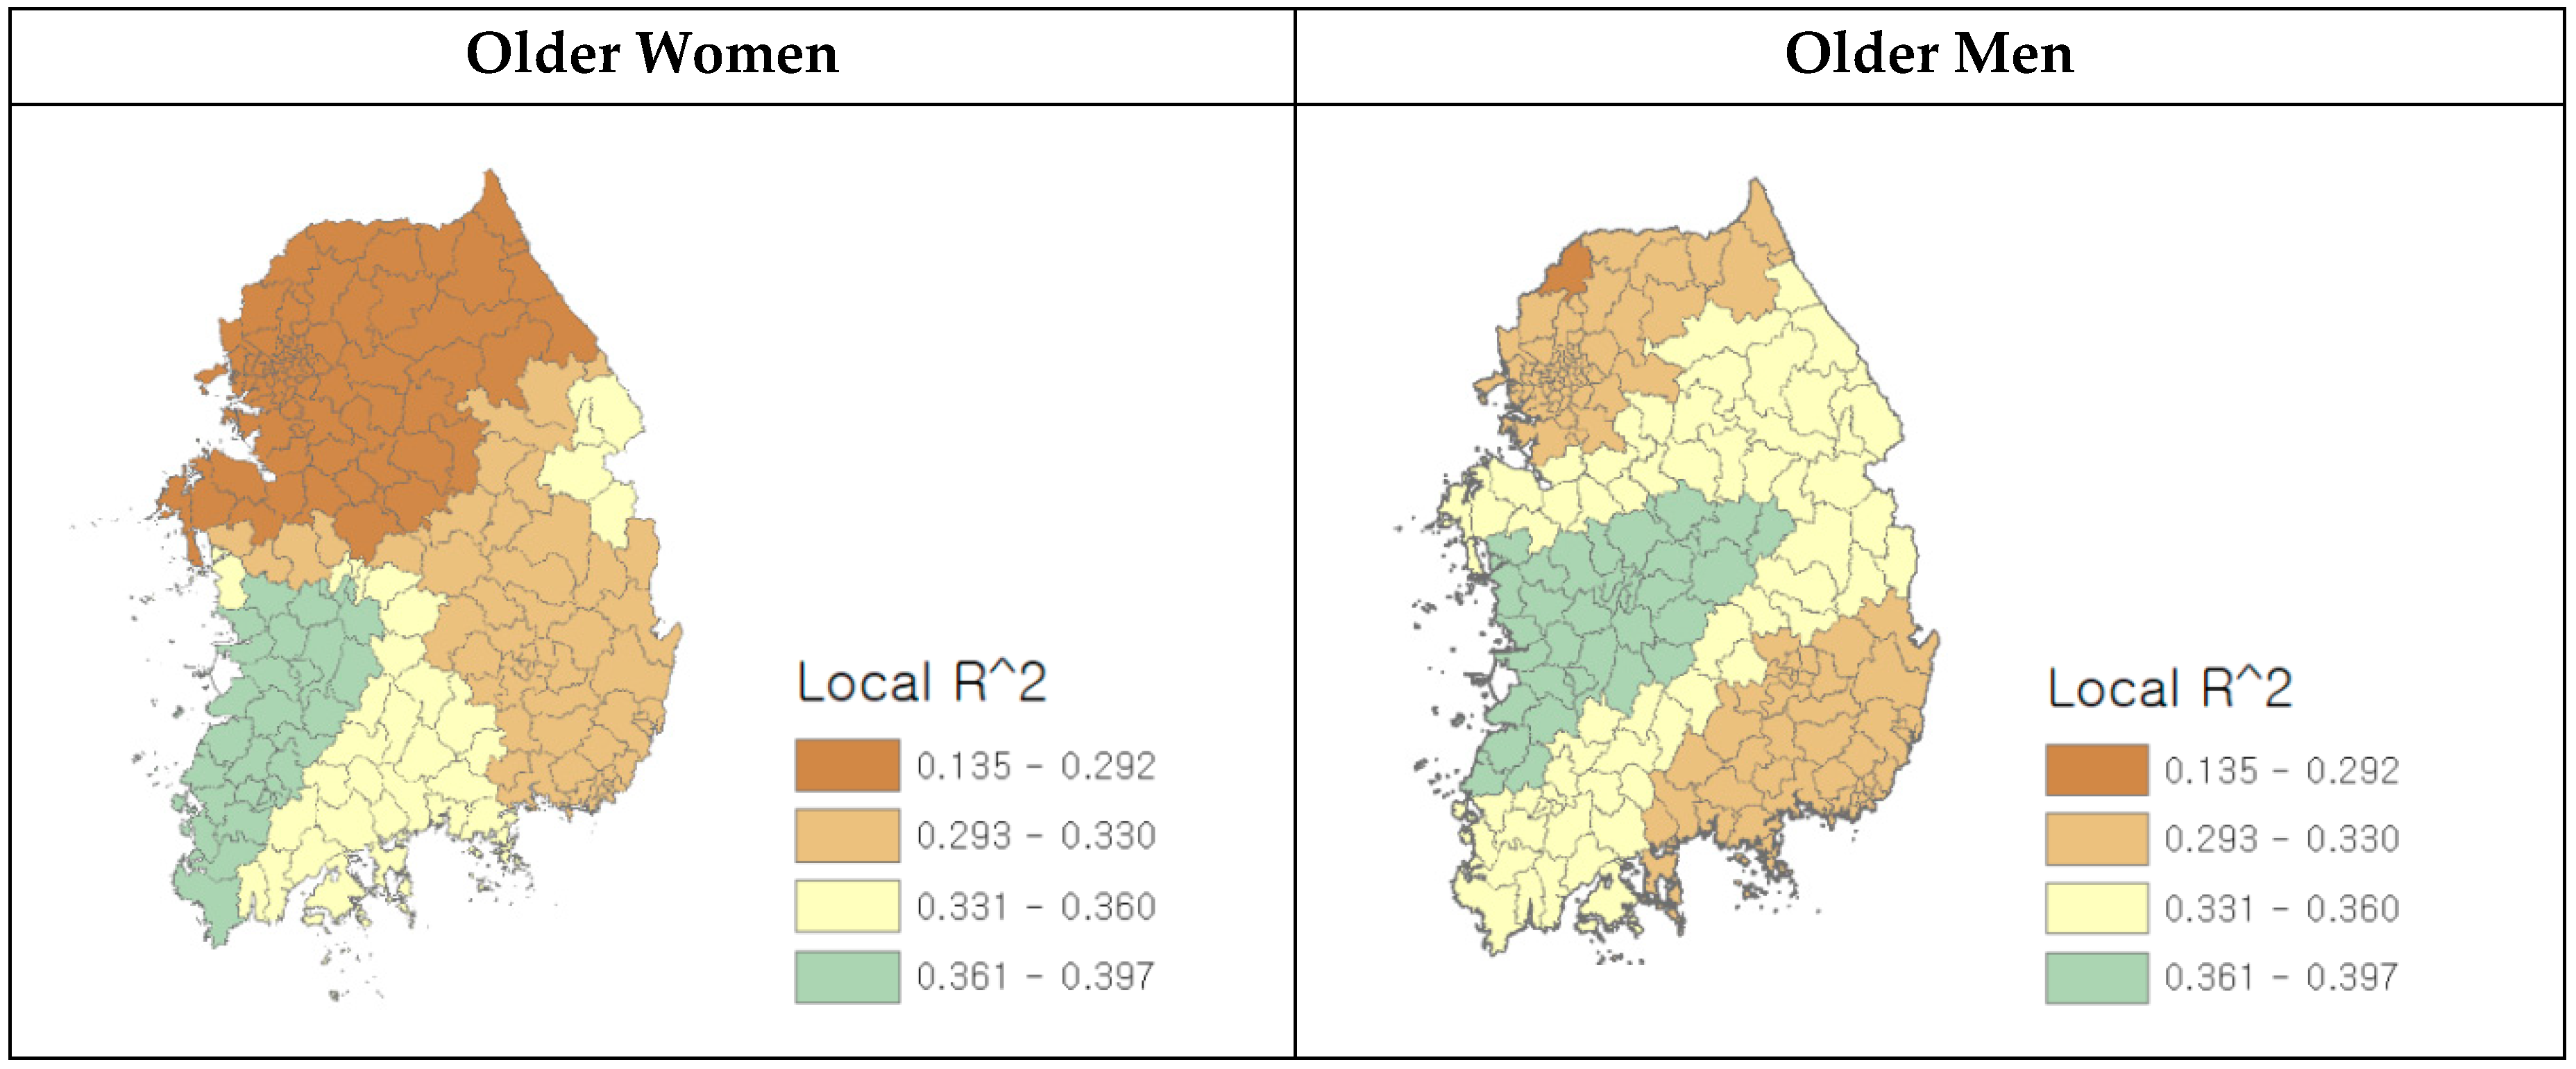
| 0.20 | 0.35 | 0.31 | 0.35 | |||
| Adjusted | 0.17 | 0.26 | 0.28 | 0.30 | ||
| N | 217 | 217 | ||||
| Older Women | Mean | S.D. | Min | Max | Range |
| Intercept | 23.914 | 6.17 | 14.70 | 31.56 | 16.86 |
| Number of fast-food restaurant per 1000 people | 0.878 | 4.60 | −5.63 | 9.10 | 14.73 |
| Number of sports facilities per 1000 people | 0.045 | 0.01 | 0.02 | 0.06 | 0.04 |
| Level of land-use mix | 0.366 | 2.99 | −6.21 | 6.12 | 12.33 |
| Intersection density | −0.011 | 0.01 | −0.04 | 0.00 | 0.04 |
| Employment density | 0.000 | 0.00 | −0.00 | 0.00 | 0.00 |
| Percentage of high school graduates | 0.145 | 0.08 | 0.04 | 0.26 | 0.24 |
| Percentage of basic living recipients | −0.339 | 0.22 | −0.88 | 0.14 | 1.02 |
| Older Men | Mean | S.D. | Min | Max | Range |
| Intercept | 17.663 | 1.07 | 16.09 | 19.18 | 3.09 |
| Number of fast-food restaurant per 1000 people | 3.864 | 0.58 | 2.52 | 4.69 | 2.17 |
| Number of sports facilities per 1000 people | −0.110 | 0.01 | −0.12 | −0.10 | 0.02 |
| Level of land-use mix | 2.673 | 3.04 | −1.72 | 6.81 | 8.53 |
| Intersection density | 0.009 | 0.01 | 0.00 | 0.01 | 0.01 |
| Employment density | −0.000 | 0.00 | −0.00 | −0.00 | 0.00 |
| Percentage of high school graduates | 0.120 | 0.01 | 0.10 | 0.13 | 0.03 |
| Percentage of basic living recipients | −0.574 | 0.04 | −0.63 | −0.50 | 0.13 |
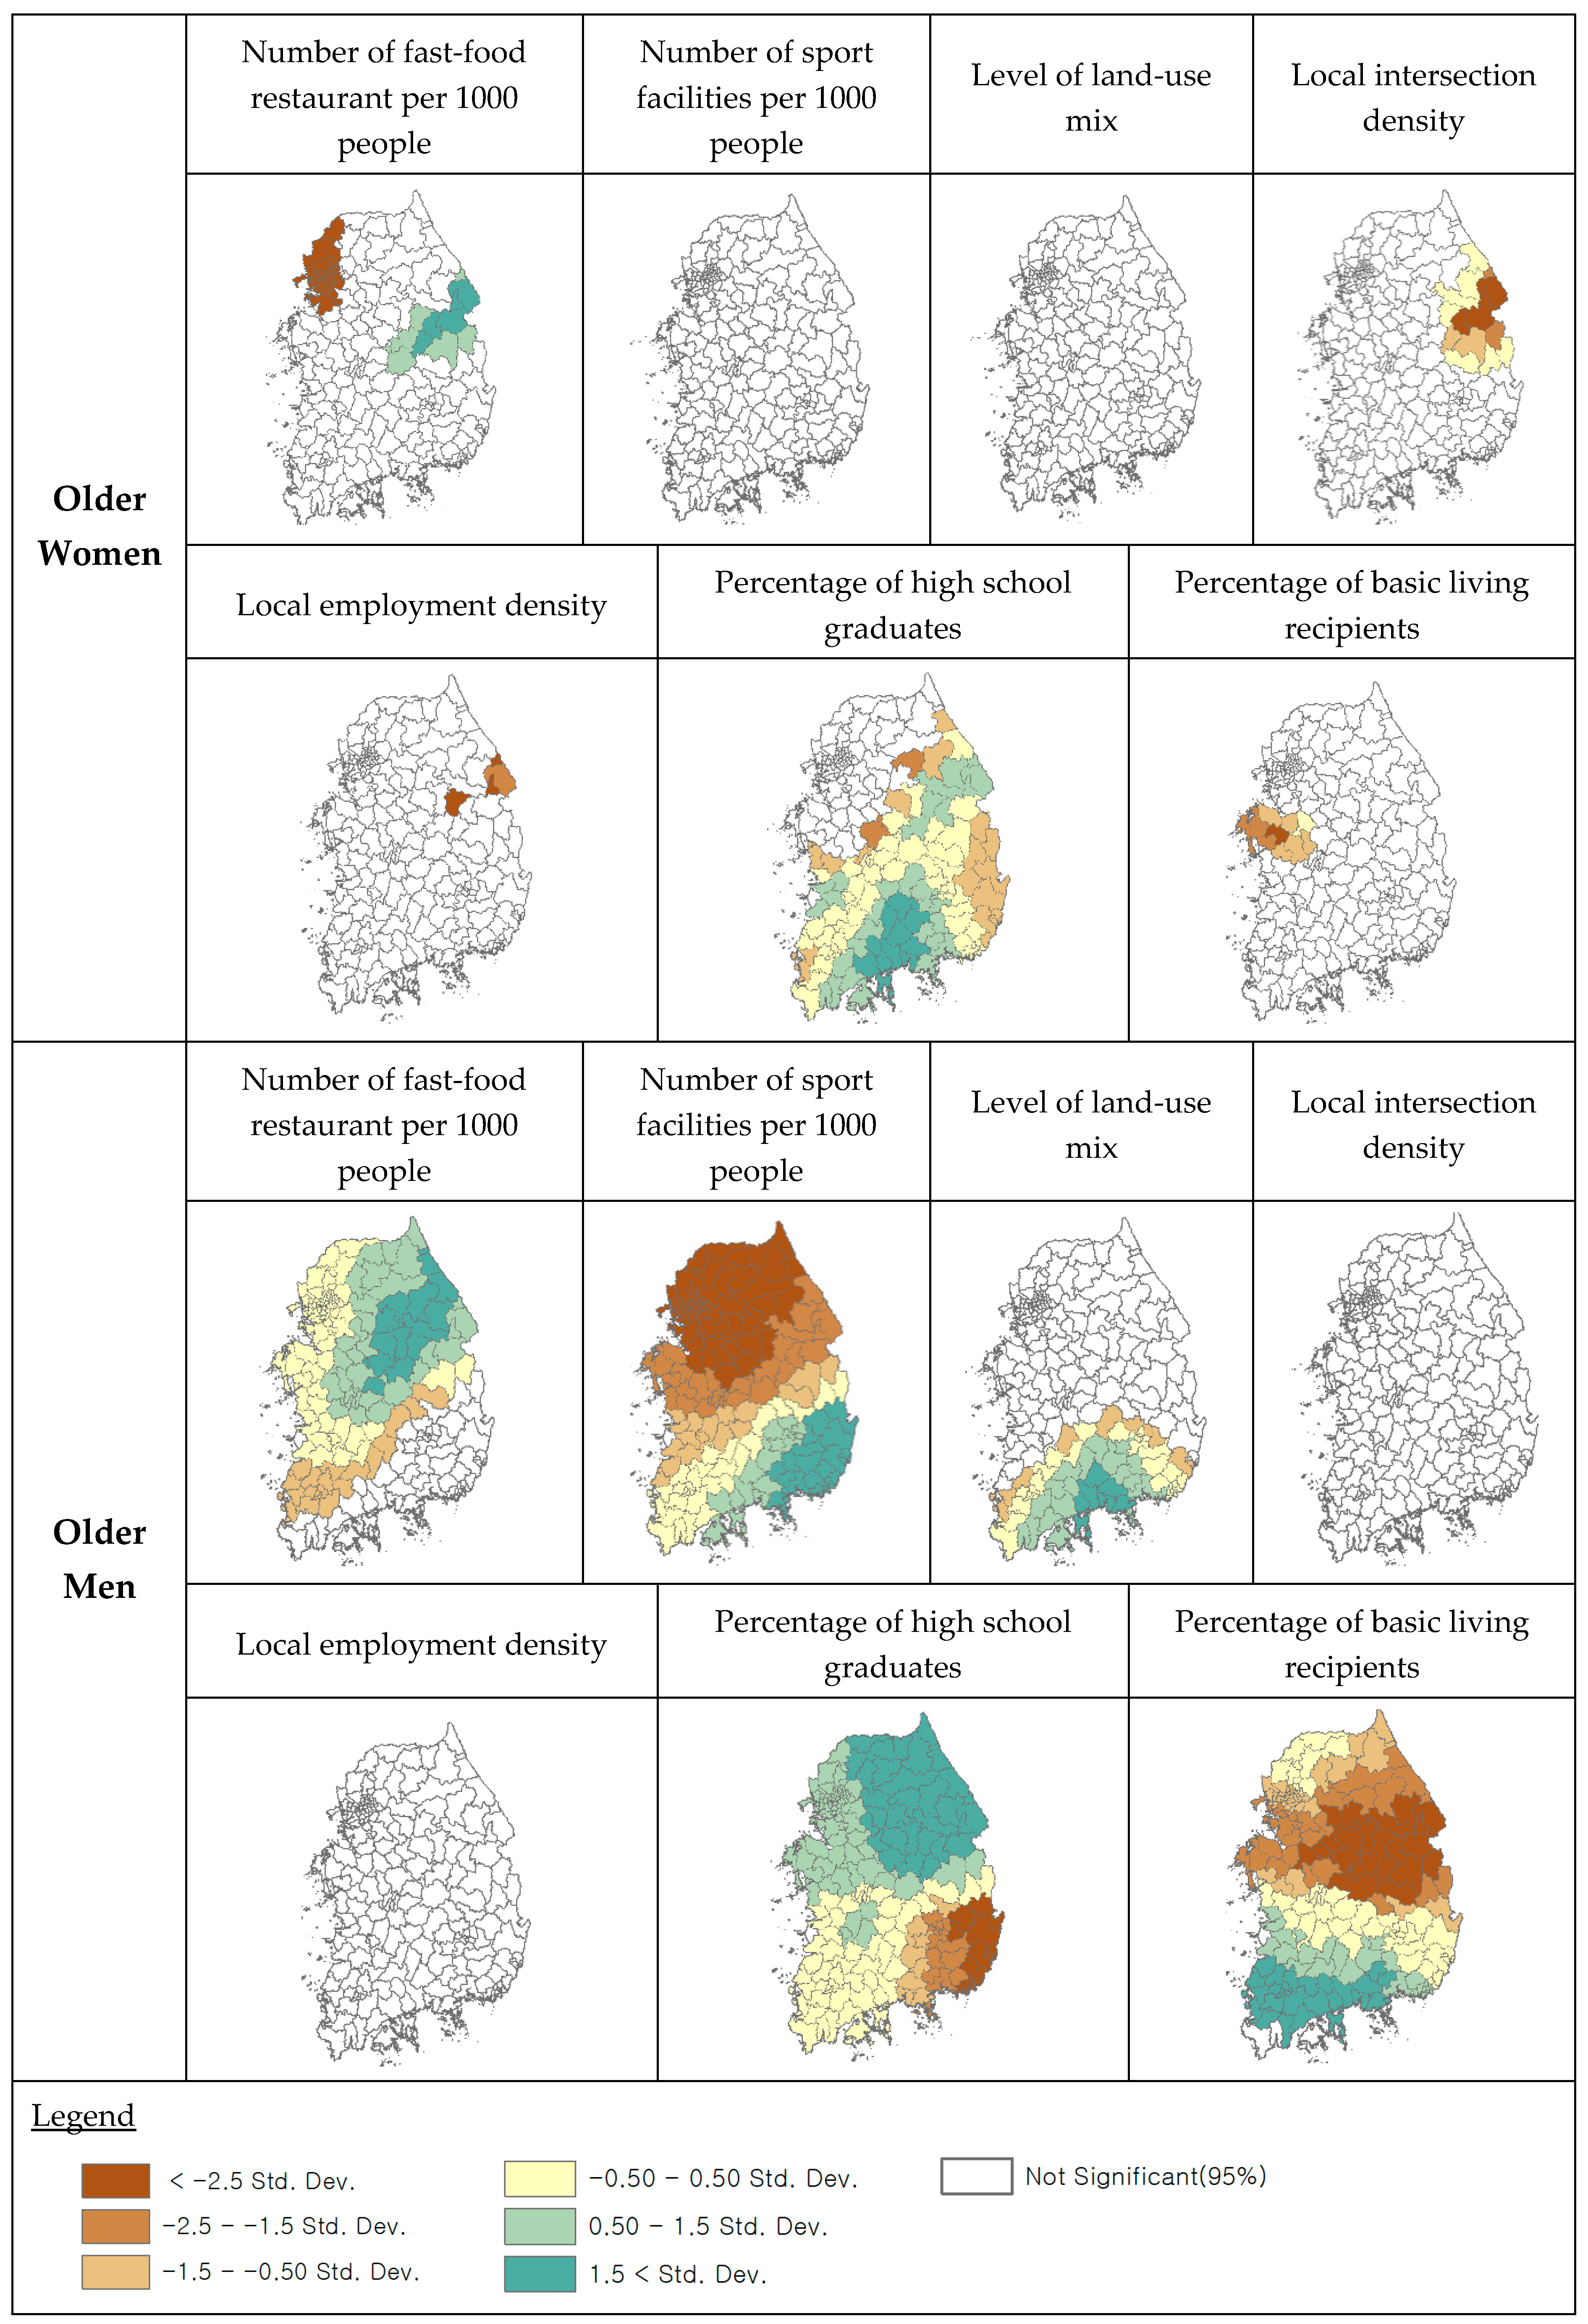
| Variables | Older Women | Older Men |
|---|---|---|
| Intercept | 217 | 217 |
| Number of fast-food restaurants per 1000 people | 61 | 154 |
| Number of sports facilities per 1000 people | 0 | 217 |
| Level of land-use mix | 0 | 76 |
| Intersection density | 15 | 0 |
| Employment density | 4 | 0 |
| Percentage of high school graduates | 132 | 217 |
| Percentage of basic living recipients | 10 | 217 |
© 2019 by the authors. Licensee MDPI, Basel, Switzerland. This article is an open access article distributed under the terms and conditions of the Creative Commons Attribution (CC BY) license (http://creativecommons.org/licenses/by/4.0/).
Share and Cite
Namgung, M.; Gonzalez, B.E.M.; Park, S. The Role of Built Environment on Health of Older Adults in Korea: Obesity and Gender Differences. Int. J. Environ. Res. Public Health 2019, 16, 3486. https://0-doi-org.brum.beds.ac.uk/10.3390/ijerph16183486
Namgung M, Gonzalez BEM, Park S. The Role of Built Environment on Health of Older Adults in Korea: Obesity and Gender Differences. International Journal of Environmental Research and Public Health. 2019; 16(18):3486. https://0-doi-org.brum.beds.ac.uk/10.3390/ijerph16183486
Chicago/Turabian StyleNamgung, Mi, B. Elizabeth Mercado Gonzalez, and Seungwoo Park. 2019. "The Role of Built Environment on Health of Older Adults in Korea: Obesity and Gender Differences" International Journal of Environmental Research and Public Health 16, no. 18: 3486. https://0-doi-org.brum.beds.ac.uk/10.3390/ijerph16183486