Article

Potentially Harmful Element Concentrations in the Vegetables Cultivated on Arable Soils, with Human Health-Risk Implications

by
Agnieszka Gruszecka-Kosowska
AGH University of Science and Technology, Faculty of Geology, Geophysics and Environmental Protection, Department of Environmental Protection, Al. Mickiewicza 30, Kraków 30-059, Poland
Int. J. Environ. Res. Public Health 2019, 16(20), 4053; https://0-doi-org.brum.beds.ac.uk/10.3390/ijerph16204053
Submission received: 18 September 2019 / Revised: 27 September 2019 / Accepted: 18 October 2019 / Published: 22 October 2019
(This article belongs to the Special Issue Heavy Metal Pollution and Health Risk Assessment)

Abstract

:
Potentially harmful elements (PHEs) were investigated in eight groups of vegetables cultivated in southern Poland and the relevant health-risk implications were assessed. The PHE contents belonged to the following ranges (mg/kg wet weight) in edible parts: As < limit of detection (LOD)-0.056, Cd < LOD–0.375, Co < LOD–0.029, Cu < LOD–7.638, Hg < LOD–0.163, Ni < LOD–0.299, Pb < LOD–0.580, Sb < LOD–0.163, Tl < LOD–0.128, and Zn 1.23–34.9. The PHE concentrations decreased in the following order: Zn > Cu > Ni > Cd > Pb > Sb > Hg > Tl > As > Co. The concentrations of essential PHEs decreased as follows: root > leaf > seed > tuber > legume > inflorescence > shoot > fruit, while the unnecessary PHEs followed this sequence: leaf > root > tuber > legume > inflorescence > seed > shoot > fruit. Soil-to-plant transfer factors revealed capacities to adsorb Cd, Hg, and Tl in roots; Cd, Hg, Tl, and Zn in leaves; Cd, Hg, and Sb in tubers; and Cu, Sb, and Zn in legumes and seeds. The daily intake rates, as a percentage of permissible maximum tolerable daily intake, amounted to the following proportions: Cd 23%, Tl 13%, Hg 5.0%, Ni 3.1%, Pb 2.6%, and As 0.4%. Non-carcinogenic risk described as hazard quotient (HQ) was exceeded in root (HQ = 12.1), leafy (HQ = 2.1), and tuber (HQ = 1.4) vegetables. The carcinogenic risk of As (CR = 8.54 × 10⁻⁵) was found unacceptable. The margins of exposure for adults (MOE = 3.1) and children (MOE = 1.6), respectively, indicated a low health risk of Pb in consumed vegetables.

1. Introduction

The trend of fresh vegetable consumption became more and more popular recently. For adults, the recommended daily intake of vegetables is 300 g per person [1]. However, the World Health Organization (WHO) recommends eating >400 g of fruit and vegetables per day to improve overall health and reduce the risk of certain non-communicable diseases (NCDs) [2]. On the other hand, contamination of the food chain, leading to potential health risks, is one of the major environmental pathways of human exposure to potentially harmful elements (PHEs) [3]. Thus, more and more studies have been conducted on the contamination of edible plants with PHEs and the related health-risk implications [3,4,5,6,7,8,9,10].
PHEs adverse health effects are reported for many years. Some elements are essential to human body (i.e., Cu and Zn), but when they are consumed in too high quantities they cause toxic effects. On the other hand, some PHEs (i.e., As, Cd, and Pb) are considered toxic to humans regardless the dose taken [11]. Furthermore, as reported in the literature, vegetables accumulate higher levels of PHEs comparing to other edible plants [12,13].
Agriculture is common in Poland, as arable lands constitute about 73% of farmlands [14]. Moreover, intense mining and processing of coal [15,16], as well as of Zn–Pb [17,18] and Cu ores [19], caused serious environmental pollution with PHEs, especially in southern Poland. Previous studies performed in the Region of Upper Silesia in the 1990s indicated a high contamination of soil with Cd, Pb, and Zn by industrial emissions [20]. Besides, the excess of such PHE contents in soils and root vegetables was established by comparing the related amounts to the quantities found in other agricultural regions and the maximum allowable concentrations [21], respectively. Recent investigations, however, revealed a lack of excess of the permissible concentration levels of heavy metals and metalloids in arable soils of southern Poland [22]. Nevertheless, it has been concurrently indicated that some of the investigated PHEs (i.e., Cd and Zn) were mobile and bioavailable [23].
Moreover, PHE contents in soil may origin not only form the bedrock itself. More and more significant are anthropogenic sources i.e., illegal waste deposits, agricultural inputs as pesticides and inorganic fertilizers, industrial effluents, and fallout of industrial and urban emissions [13,24]. All of them may have consequences for food quality.
Thus, since vegetables should be consumed in significant amounts and fresh edible plants cultivated on site are sold locally, even low concentrations of PHEs in food may cause health risk, also due to long-term consumption. Taking the above into consideration, the determination of selected PHE concentrations in different groups of vegetables, cultivated in recently investigated arable soils of southern Poland [22,23], with the health-risk implication assessment, was adopted as the goal of the present study. Detailed objectives of the study included the determination of the following: (1) As, Cd, Co, Cr, Cu, Hg, Ni, Pb, Sb, Se, Tl, and Zn contents in 36 types of vegetables, (2) soil-to-plant transfer indices, (3) contribution of PHEs to the daily intake rates via consumption of vegetables, and (4) human health-risk assessment from the PHE contents in consumed vegetables.

2. Materials and Methods

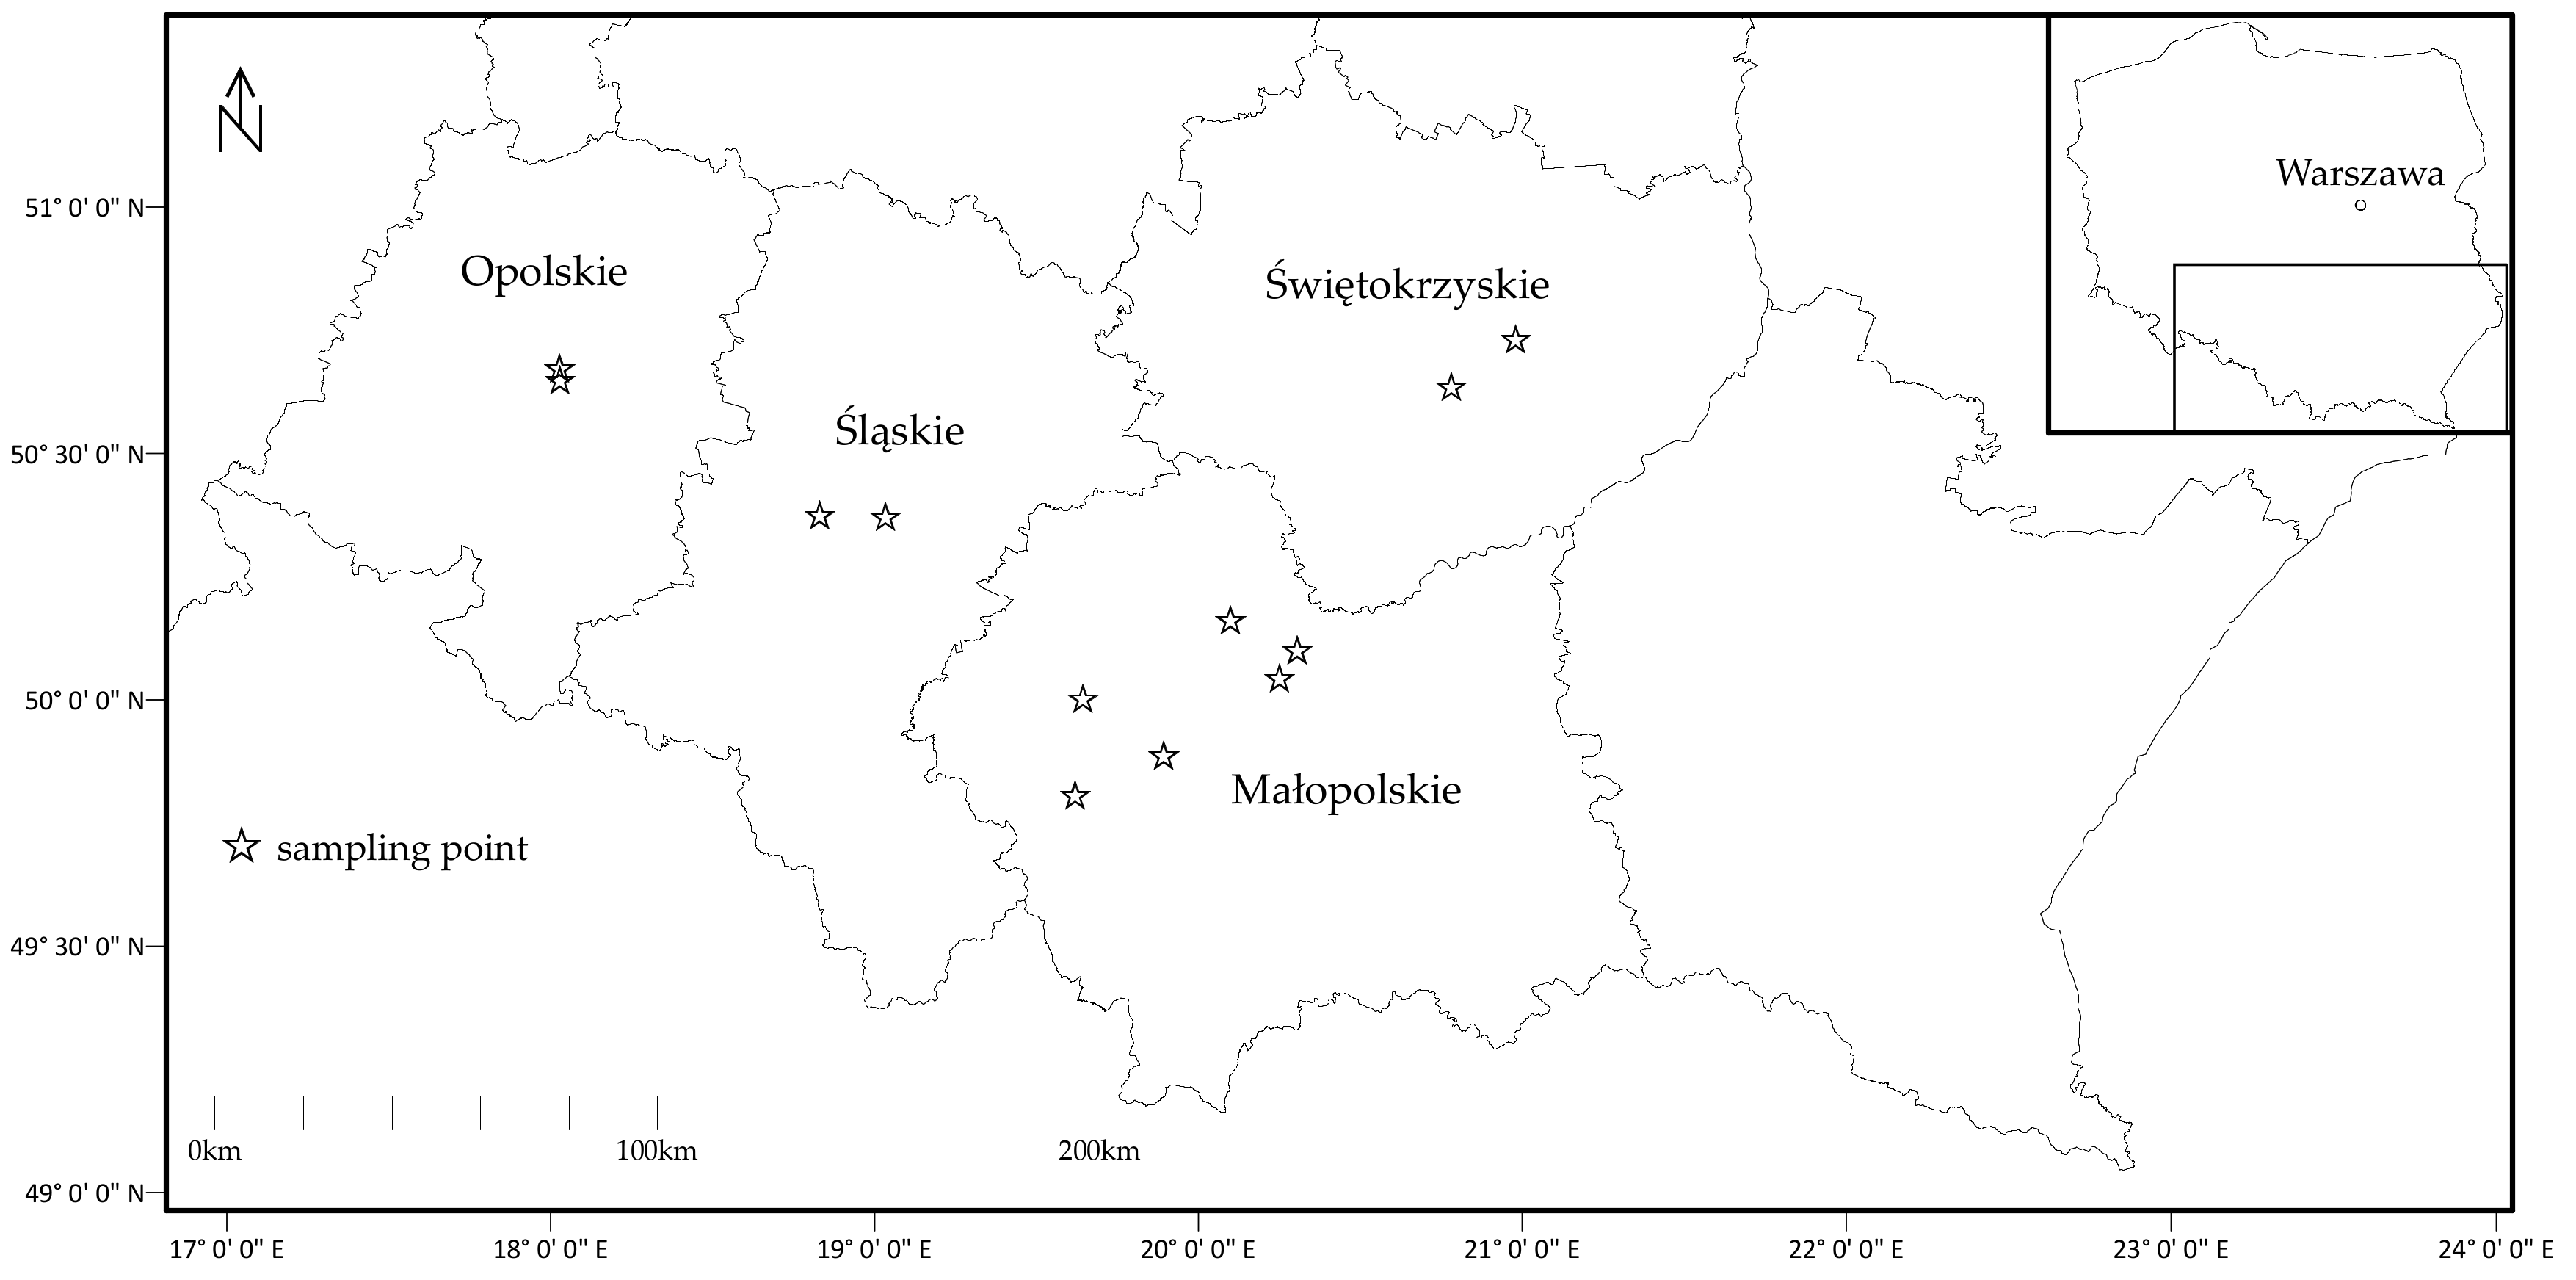
2.1. Vegetable Sampling and Preparation

Vegetable samples were collected from the produce bought on the local “fresh food markets” on the same sites where previously arable soil samples had been investigated, in the following Regions of southern Poland: Opolskie, Śląskie, Małopolskie, and Świętokrzyskie (Figure 1). During the growing seasons of 2015 and 2016, 36 types of vegetables (12 leafy, 7 root, 5 fruits, 4 tuber, 4 seed, 2 inflorescence, 1 shoot, and 1 legume) were collected (Table 1). Altogether, 206 vegetable samples were analyzed. After transportation to the laboratory, vegetable samples were prepared as is for consumption: They were washed and peeled. The vegetables were cut into small pieces, placed on open porcelain dishes and dried under radiant lamps at 70 °C. Dried vegetable samples were next ground into a coarse powder with a coffee grinder and stored in sealed bags for further analysis. The grinder was cleaned after each course of vegetable sample processing to prevent cross-contamination.

2.2. Sample Analyses

Vegetable samples (0.5 g, accurate to 0.001 g) were weighed and placed in mineralization flasks, with 15 cm3 of HNO3 and 5 cm3 of H2O2 added. The samples were left for the organic matter to decompose overnight. The next step consisted in digestion in the SCP Science DigiPREP HT High Temperature Digestion System (SCP Science, Quebec, Canada) at 130 °C for 2 h. After cooling down the extract solutions, their volume was expanded to 50 cm3 by adding ultrapure water. At the same time, blank and reference samples (white cabbage, Certified Reference Material BCR®-679) were prepared. The total concentrations of PHEs (As, Cd, Co, Cr, Cu, Hg, Ni, Pb, Sb, Se, Tl, and Zn) were determined by inductively coupled plasma-mass spectrometry (ICP-MS) (ELAN 6100; Perkin Elmer, Waltham, MA, USA), according to United States Environmental Protection Agency USEPA 6020B protocol [25] and International Agency for Standardization ISO protocol [26].
All the results of the PHE concentrations in vegetables were determined as dry mass [13,27,28]. The water content in analyzed vegetables was not investigated. However, for the purpose of estimating daily intakes in risk assessment analyses and to facilitate comparison to guidance values on European Union (EU) food standards PHE contents in vegetables were referred to wet weight (ww.), as recommended by the USEPA in accordance with Equation (1). Water contents in particular plant samples were taken from the USEPA exposure factors book [29]:
cww = cdw × (100 − w)/100
where: cww—concentration of PHE in plant sample wet weight; cdw—concentration of PHE in plant sample dry weight; w—percentage water content.

2.3. Quality Control

Vegetable samples analyses were performed, maintaining the standard certified analytical quality control procedure [30]. To achieve impartial and unequivocal ICP-MS results, the elements were also measured, using inductively coupled plasma-optical emission spectroscopy (ICP-OES) (OPTIMA 7300DV; Perkin Elmer, Waltham, MA, USA), according to USEPA 6020B protocol [25] and ISO protocol [31]. The certified reference material CRM (white cabbage, Certified Reference Material BCR®-679) was analyzed at the same time. Recovery from CRM plant was established between 83% and 124% for the majority of analyzed PHEs. In this method, reagent blanks and duplicates were used to ensure quality assurance and quality control. All the reagents used in the laboratory analysis were analytically pure. The results of sample investigations were contained within the allowable error change values. Analytical bias was statistically insignificant (p = 0.05). The accuracy of ICP-MS and ICP-OES systems was satisfactory and verified by six different solution injections. Rh was used as an internal standard. In the ICP-MS analysis, element correction equations were applied to each element to minimize the impact of interferences. The limit of detection (LOD) values of the investigated PHEs were as follows (µg/L): As < 0.001, Cd < 0.0005, Co < 0.0005, Cr < 0.0005, Cu < 0.0005, Hg < 0.001, Ni < 0.002, Pb < 0.0005, Sb < 0.0005, Se < 0.002, Tl < 0.001, and Zn < 0.001.

2.4. Statistical Analyses

Statistical analysis involved determination of mean, standard deviation, and minimum and maximum values using a Microsoft Excel 2007 spreadsheet. The software package STATISTICA 13 (TIBCO Software Inc., Palo Alto, CA, USA) was used for further statistical analysis. To check data distribution the Shapiro–Wilk’s test (p = 0.05) was used. The one-way ANOVA at the 95% confidence level was used to check for any significant differences (p ≤ 0.05) between the average PHE concentrations and bioconcentration factors among analyzed groups of vegetables and different sampling regions. On such basis the scientific hypotheses were tested as follows: H0: content of individual PHEs and bioconcentration factors values were not conditioned by the part of vegetable/sampling region; H1: content of individual PHEs and bioconcentration factors values were conditioned by the part of vegetable/sampling region. If differences were found to be significant post-hoc analysis were performed followed by the Fisher’s Least Significant Difference (LSD) test. Hierarchical cluster analysis (HCA) and principal components analysis (PCA) were performed for multivariate statistical modeling of the input data. Halves of the limit of detection (LOD) values were assigned to undetected results in all statistical analysis that were carried out, as recommended by the WHO [32].

2.5. Soil-To-Plant Transfer Indices

The transfer factor is commonly used in environmental geochemistry to determine translocation of PHEs in soil and plant system [33]. Two soil-to-plant transfer factors were calculated in the current research in order to determine environmental bioavailability of PHEs. The bioaccumulation coefficient (BA) described the transference of PHE from the soil to the plant, while the bioconcentration coefficient (BC) described the plant capacity to adsorb PHE from the soil when PHE occurred in an available form [34]. The BA and BC values were calculated for the investigated groups of vegetables, respectively, from general Equations (2) and (3) [35]:
BA = Cveg/Cst
BC = Cveg/Csa
where Cveg is the mean concentration of particular PHE (mg/kg ww.) in the group of investigated vegetables; Cst is the mean total concentration of particular PHE determined in soil samples (mg/kg dw.) from southern Poland, using aqua regia digestion [22]; and Csa is the mean available concentration of particular PHE determined in soil samples (mg/kg dw.) from southern Poland after extraction with (i) 0.11 mol/L CH3COOH (the first fraction of the BCR sequential extraction procedure F1) and (ii) 0.05 mol/L Na2EDTA [23].

2.6. Human Health Risk Assessment

The point estimate method developed by USEPA [36] was applied to assess the Human Health Risk Assessment (HHRA) arising from the consumption of PHEs in vegetables cultivated in southern Poland. The following parameters for both adults and children, using mean and 95th percentile (P95) of the PHE concentrations in vegetables, were calculated: The daily intake rate (DIR) values for particular PHEs were calculated as the sum of consumed vegetable groups, according to Equation (4) [37]:
DIR = Σ (Cveg × IRveg/BW)
where Cveg is the concentration of particular PHE in the group of vegetables (mg/kg ww.); IRveg is the vegetable ingestion rate (g ww./person-day) in the group of vegetables; BW is the body weight: 70 kg for adults and 15 kg for children [29].
The intake rates of the groups of vegetables assumed in this study were presented in Table 2. Three exposure scenarios of vegetable consumption were analyzed. The first scenario was designed for adults, based on the available Polish statistical data [38,39]. The second scenario was based on the vegetable intake rates recommended by USEPA [29], since the data on the consumption of certain vegetable groups were missing in the Polish statistical data. The third scenario was based on the intake values recommended by USEPA for children, since the Polish statistical data did not involve a subpopulation of children.
The average daily doses (ADD) for PHE ingestion via consumed vegetables (mg/kg bw-d) were calculated as the sum of the consumed vegetable groups, using Equation (5):
ADD = Σ (Cveg × IRveg × EF × ED × 10−3)/AT × BW
where Cveg is the PHE concentration in the investigated group of vegetables (mg/kg ww.); IRveg is the intake rate of vegetables (g ww./person-day); EF is the exposure frequency: 365 days/year; ED is the exposure duration: 30 years for adults and 6 years for children [40]; AT is the averaging time in days: ED × 365 for non-carcinogens and 70 years × 365 for carcinogens [40]; BW is body weight (kg), as in Equation (4); and 10−3 is the unit conversion factor.
The non-carcinogenic PHE risk values from dietary exposure were calculated with Equation (6):
HQ = ADD/RfD
where HQ is the hazard quotient and RfD is the reference dose for particular PHE.
The RfD values were set to be as follows (mg/kg bw-day): As 3.00 × 10⁻⁴, Cd 1.00 × 10⁻³, Co 3.00 × 10⁻⁴, Cu 4.00 × 10⁻², Hg 3.00 × 10⁻⁴, Ni 2.00 × 10⁻², Sb 4.00 × 10⁻⁴, Tl 1.00 × 10⁻⁵, and Zn 3.00× 10⁻¹ [41].
The total non-carcinogenic risk (HQt) value for the investigated PHEs was calculated, using Equation (7):
HQt = HQ1 + HQ2 + … + HQn
where HQs are the hazard quotient values for 1-n PHEs investigated in the study.
The carcinogenic risk values of PHEs from dietary exposure were calculated, using Equation (8):
CR = ADD × SFo
where CR is the carcinogenic risk and SFo is the oral slope factor for a particular PHE.
Only As was considered as carcinogenic PHE in this study. There were no SF values available for other investigated elements at the time. The SFo for As was set to be equal to 1.5 (mg/kg bw-day)−1 [41]. The total carcinogenic risk value, as the sum of partial CR values, was not calculated since As was the only carcinogenic PHE considered in this study.
The Pb risk of dietary exposure was calculated according to the margin of exposure (MOE) approach, as recommended by EFSA [42], using Equation (9) [43]:
MOE = BMDL/DIR
where MOE is the margin of exposure value; BMDL is the benchmark dose (lower confidence limit), estimated at 1.2 µg/kg bw-day for adults and 0.6 µg/kg bw-day [44]; and DIR is the total amount of vegetables consumed daily under the analyzed intake scenarios.

3. Results and Discussion

3.1. Abundance of PHEs in Vegetables

In the 36 types of vegetables concentrations of twelve PHEs were investigated. Determined contents of Se and Cr concentrations were <LOD in all the analyzed samples. Consequently, those two PHEs were excluded from further analysis. Among the analyzed vegetables, the detectable rates (%) of the remaining investigated PHEs were as follows: As 21.8%, Cd 85.6%, Co 35.8%, Cu 98.5%, Hg 31.8%, Ni 7.35%, Pb 46.6%, Sb 41.7%, Tl 39.4%, and Zn 100%.
A detailed record of statistical characteristics of the investigated PHE concentrations in the analyzed groups of vegetables is presented in Table 3. The concentrations of PHEs determined in the edible parts of vegetables were within the following ranges (mg/kg ww.): As < LOD–0.056, Cd < LOD–0.375, Co < LOD–0.029, Cu < LOD–7.638, Hg < LOD–0.163, Ni < LOD–0.299, Pb < LOD–0.580, Sb < LOD–0.163, Tl < LOD–0.128, and Zn 1.23–34.9. The results were consistent with the recent studies regarding Cd and Pb contents in the broccoli, cabbage, carrot, potato, parsley, celery, and beetroot investigated in the Region of Upper Silesia [27,45]. Contents of Cd, Pb, Cu, and Zn in parsley leaves and lettuce investigated in the region of South-Western Poland [46] were higher than observed in this study. It could be explained by the fact that leafy vegetables in the cited research were taken from the garden allotments located in highly industrialized cities, where permissible levels of PHEs were exceed, while vegetables investigated in the study were cultivated on arable soils fully suitable for vegetable cultivation [22].
The PHE concentrations determined in vegetables decreased in the following order: Zn > Cu > Ni > Cd > Pb > Sb > Hg > Tl > As > Co. The mean concentrations decreased in the analyzed groups of vegetables in the following sequences: As: root > leaf > tuber; Cd: leaf > root > tuber > legume > inflorescence > fruit; Co: leaf > legume > root > tuber = seed > inflorescence; Cu: seed > legume > leaf > tuber > root > inflorescence > fruit > shoot; Hg: legume > root > leaf > tuber; Ni: root > tuber; Pb: leaf > legume > tuber > root > shoot > fruit > seed; Sb: tuber > legume > seed > leaf > inflorescence > fruit > root; Tl: root > leaf > inflorescence > tuber > legume > seed; and Zn: seed > leaf > root > shoot > tuber > legume > inflorescence > fruit. If a section of a plant was not mentioned, the concentration of a particular PHE was <LOD there. Taking under consideration the essentiality of elements (i.e., Zn and Cu) or their potential essentiality for the plant (i.e., Co and Ni), the PHE concentrations in parts of vegetables decreased as follows: root > leaf > seed > tuber > legume > inflorescence > shoot > fruit. In reference to the unnecessary elements (As, Cd, Hg, Pb, Sb, and Tl), the decreasing concentration in parts of vegetables was determined as follows: leaf > root > tuber > legume > inflorescence > seed > shoot > fruit. The results of decreasing PHE contents achieved in this study, in parts of vegetables in particular, were consistent with the recent results obtained by other researchers [28,47,48,49,50,51,52,53]. Besides, metal content in plants strongly depends on soil properties [53]. However, a comparison of data between different studies should be done with caution due to time differences and methods applied. Soil remains the major source for accumulation of PHEs in plants [54]. PHEs uptake increases as their bioavailable contents increase in the soil [55]. The plant capacity to uptake PHEs differs for different PHEs and the same element might be accumulated at different ratio in various plant species [54].
Besides, metal content in plants strongly depends on soil properties [33,56]. Most of plants exclude excess bioavailable PHEs at their roots, where they are unable to interfere with physiological processes [54,57]. Nevertheless, leafy vegetables are considered as potential hyperaccumulators of PHEs [54,58]. When roots, tuber, and leaves with excessive contents of PHEs are consumed, they migrate in the food chain posing risk, which especially for humans, become an important topic of scientific research worldwide [44,59,60,61,62,63,64,65,66,67,68,69,70,71,72].
In order to determine the analyzed vegetable safety, the PHE content values were compared with the permissible levels stated in the EU regulation on maximum levels for certain contaminants in foodstuff [73] (Table 3). The maximum allowable concentrations were specified for Cd, Hg, and Pb. It was observed that mean concentrations were on the border of the maximum allowable concentrations (MAC) for Hg (MAC = 0.02 mg/kg ww.) in roots, leaves, and legumes, as well as for Cd in roots (MAC = 0.10 mg/kg ww.). In the case of the investigated groups of vegetables, mean concentrations were not close to the limit values for Pb (MAC = 0.3 mg/kg ww. in leaves and MAC = 0.1 mg/kg ww. in other plant parts).

3.2. Statistical Analyses

Principal component analysis (PCA) performed on PHEs concentrations in all 36 types of vegetables cultivated in southern Poland revealed four principal components (PCs) with eigenvalues >1, which explained 85% of the total variability observed (Table 4). The first principal component (PC1), which accounted for 32.7% of the variance, had high positive loading values (>0.5) for As, Cd, Co, Hg, Pb, and Tl. This positive correlation between parameters indicated that high concentration of these PHEs in edible plants was the consequence of the relatively high concentrations of these elements in soils. The second component (PC2) explained 19.5% of the variance and had high positive loading values for Cu and Zn, which corresponded with essentiality of these elements for plants (Figure S1). The third component (PC3) explained 16.4% of the variance and had high positive loading values for Ni and Tl that correlated with the highest observed concentrations of these elements in roots of edible plants. The fourth component (PC4) explained 16.7% of the variance and had positive loading values for Cd, Pb, and Sb, that could be correlated with the highest concentrations of these elements observed in leafy parts of edible plants.
Although, the results of the one-way ANOVA tests revealed no significant differences between the average concentrations for investigated PHEs in groups of vegetables (Table S1), hierarchical cluster analysis results explored similarities between concentrations of investigated PHEs in 36 types of edible plants. Hierarchical dendogram distinguished two similarity groups for the variables (basing on the restrictive Sneath’s criterion equal to 1/3 Dmax) (Figure S1). The first cluster could be associated with vegetables indicating much higher Zn (group Ia) and Cu (group Ib) concentrations in edible plant parts than in vegetables belonging to the second cluster. Vegetables located in the group I are known to be enriched in Zn and Cu, as they are essential elements [74,75]. The second cluster could be associated with vegetables revealing elevated concentrations of non-essential elements for plants, cumulated in different part of vegetables as a consequence of various factors i.e., bioavailable PHE concentrations in soil, soil properties, content of compounds affecting uptake by plants, mechanism of element uptake in plant itself [33,57,76].
Standardized contents of PHEs in all types of vegetables collected in four regions of southern Poland were presented for better visualization on the color scale map (Figure S2). The map revealed that the highest abundance of most of investigated PHEs comparing to other regions was observed in Śląskie region (except for Sb and Co). In the Małopolskie region the highest abundance values in edible plants were observed for Co, Sb, Pb, and Hg. In Opolskie region investigated plants were abundant in Sb, Hg, and Zn. In the Świętokrzyskie region the highest abundance was observed for As. The one-way ANOVA analysis revealed the significant differences in PHEs contents in vegetables from investigated regions as follows (Table S2). Cadmium contents in vegetables were significantly different in Śląskie than in Świętokrzyskie, Małopolskie, and Opolskie regions. Cobalt contents in vegetables were significantly different in Małopolskie than in Śląskie and Świętokrzyskie regions. Zinc contents in vegetables were significantly different in Opolskie than in other investigated regions. This regionalization might be explained by the geology of investigated regions. Śląskie and Małopolskie are the most industrialized from analyzed regions with long-term exploitation and processing of coal and Zn–Pb ores and additionally with the lowest soil pH and organic matter content from all investigated areas [22]. Location of Opolskie between regions: Śląskie on the east and Dolnośląskie on the west, which in turn is known for long-term exploitation and processing of Cu ores, might explain abundance of Opolskie region in Hg and Sb. In Świętokrzyskie region the lowest abundance in investigated PHEs was observed, as the area is known mainly for existence of sandstones and carbonate deposits. Moreover, geochemical background of PHEs in southern Poland is higher than elsewhere, especially of Zn, Pb, Cu, as well as accompanying elements i.e., As, Cd, Hg, Tl, and Ni, as a consequence of non-ferrous metals ores presence in these regions.

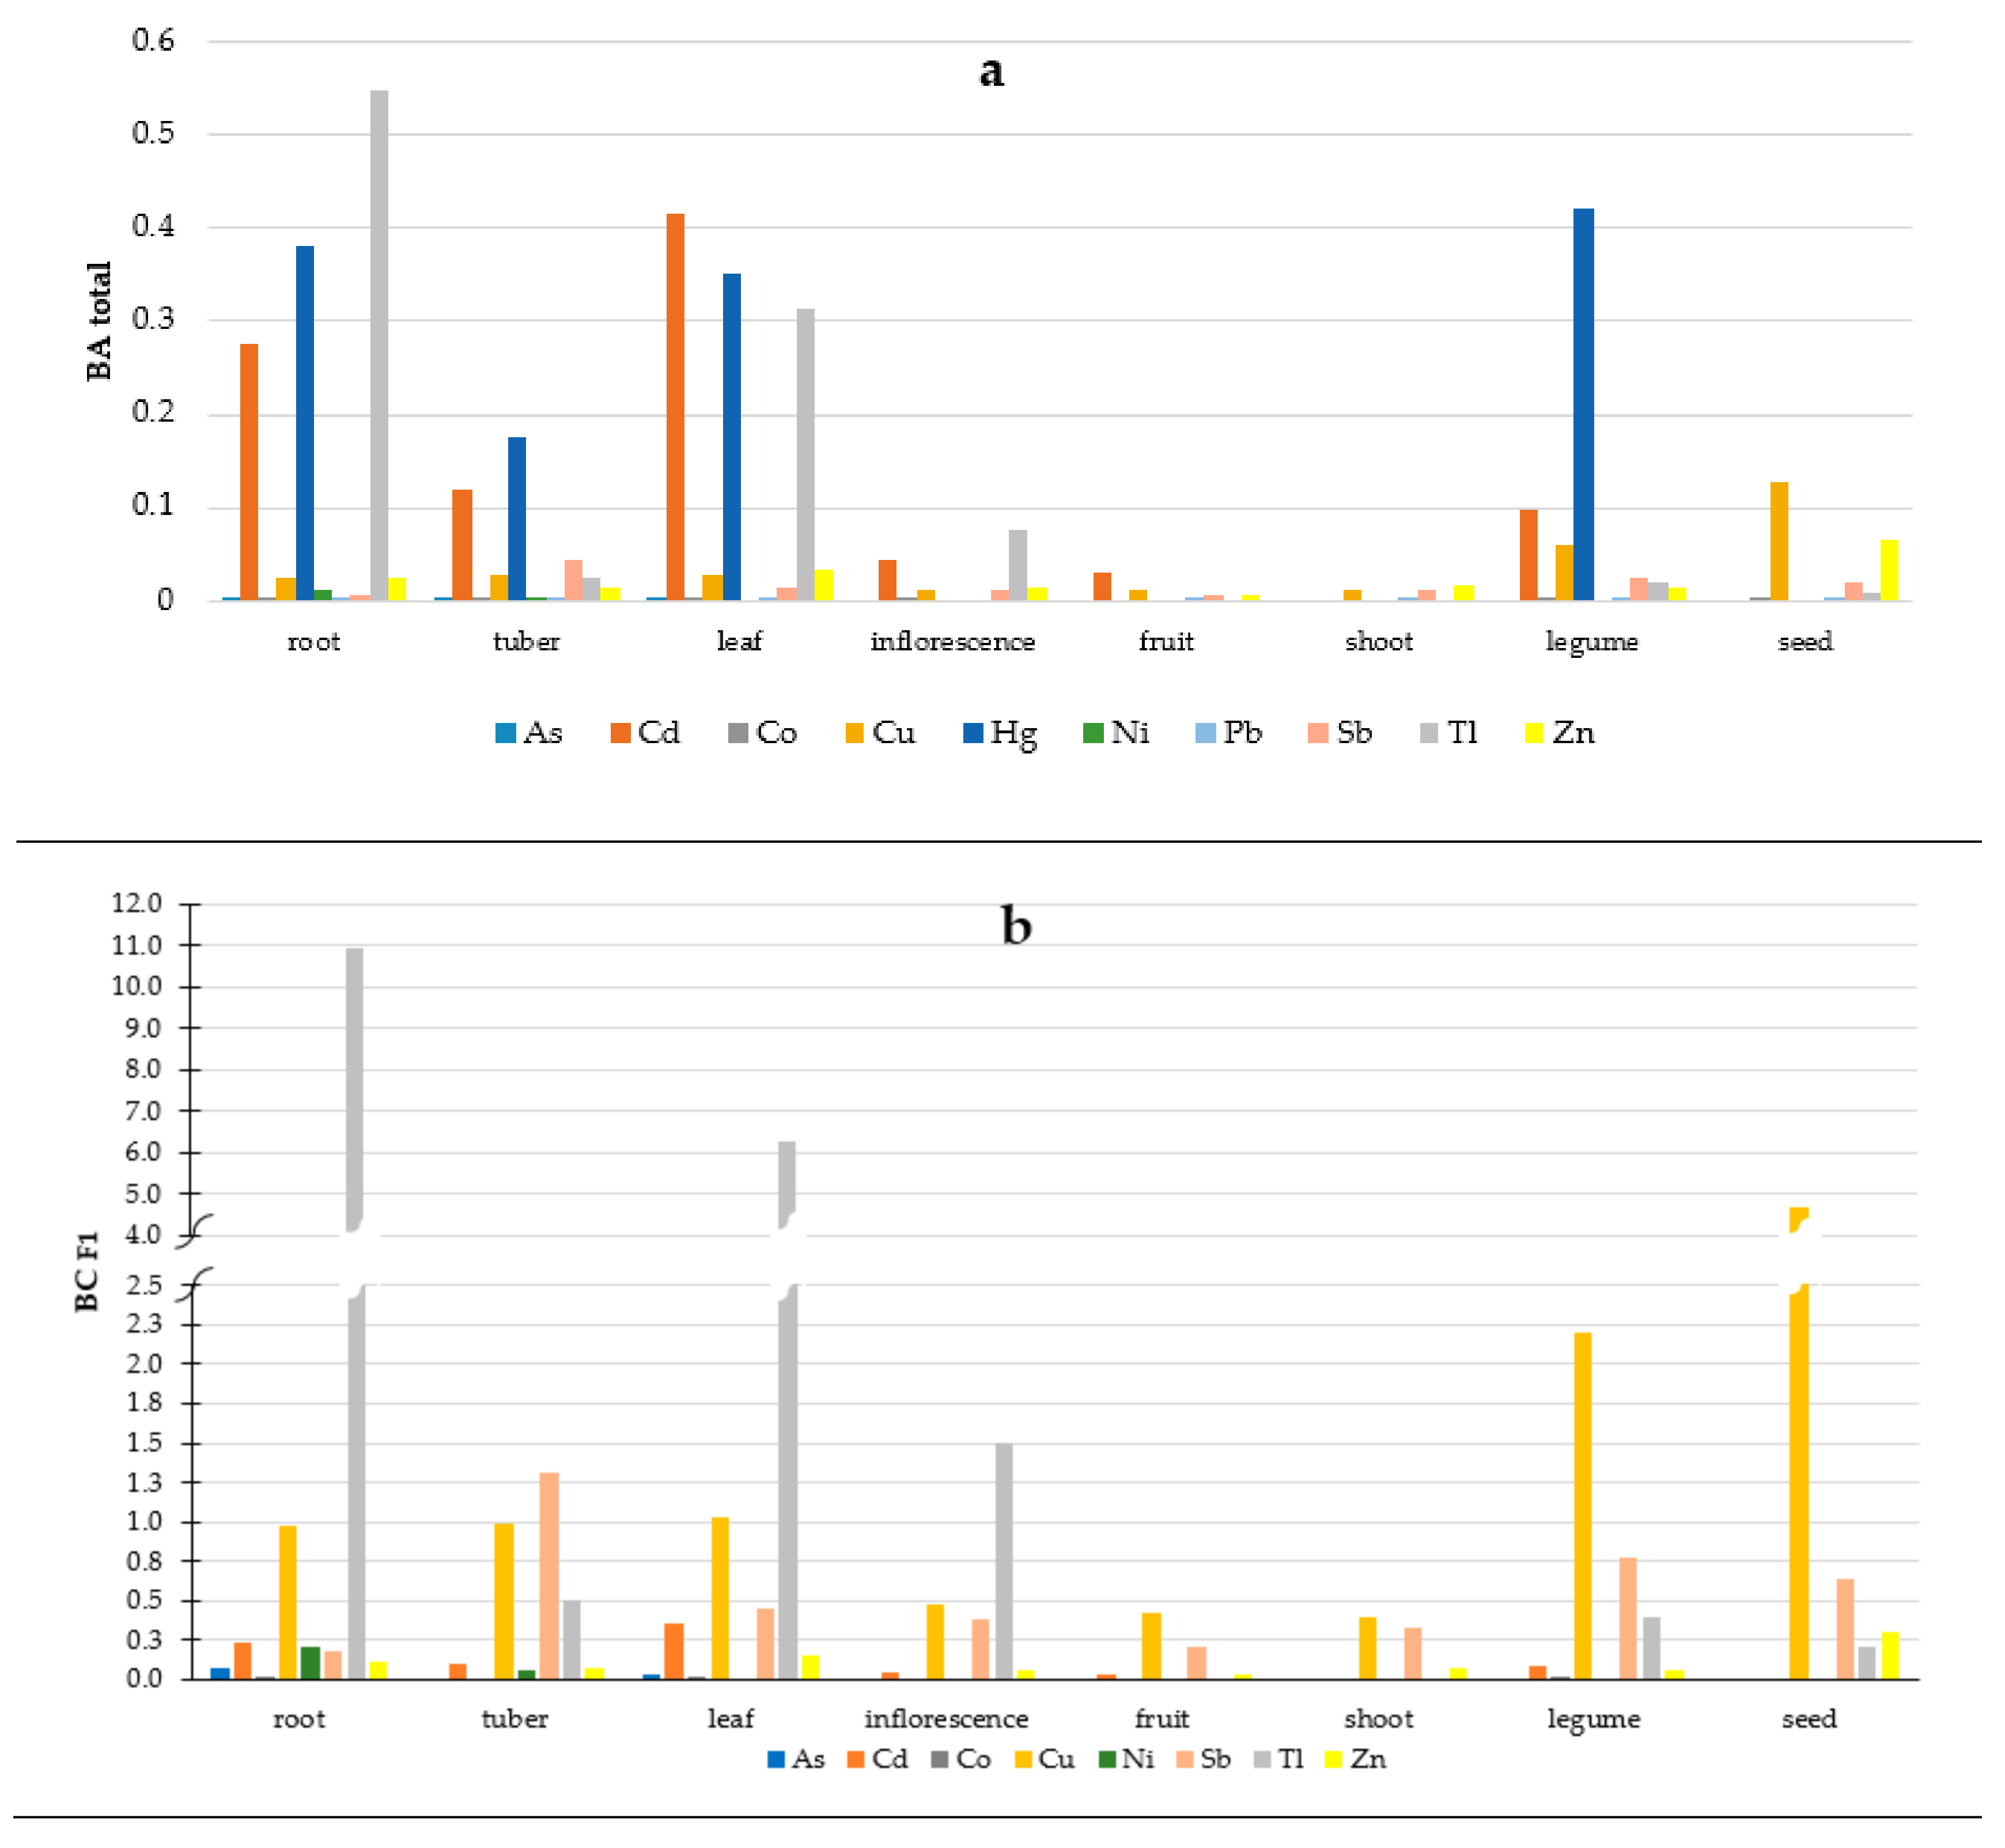
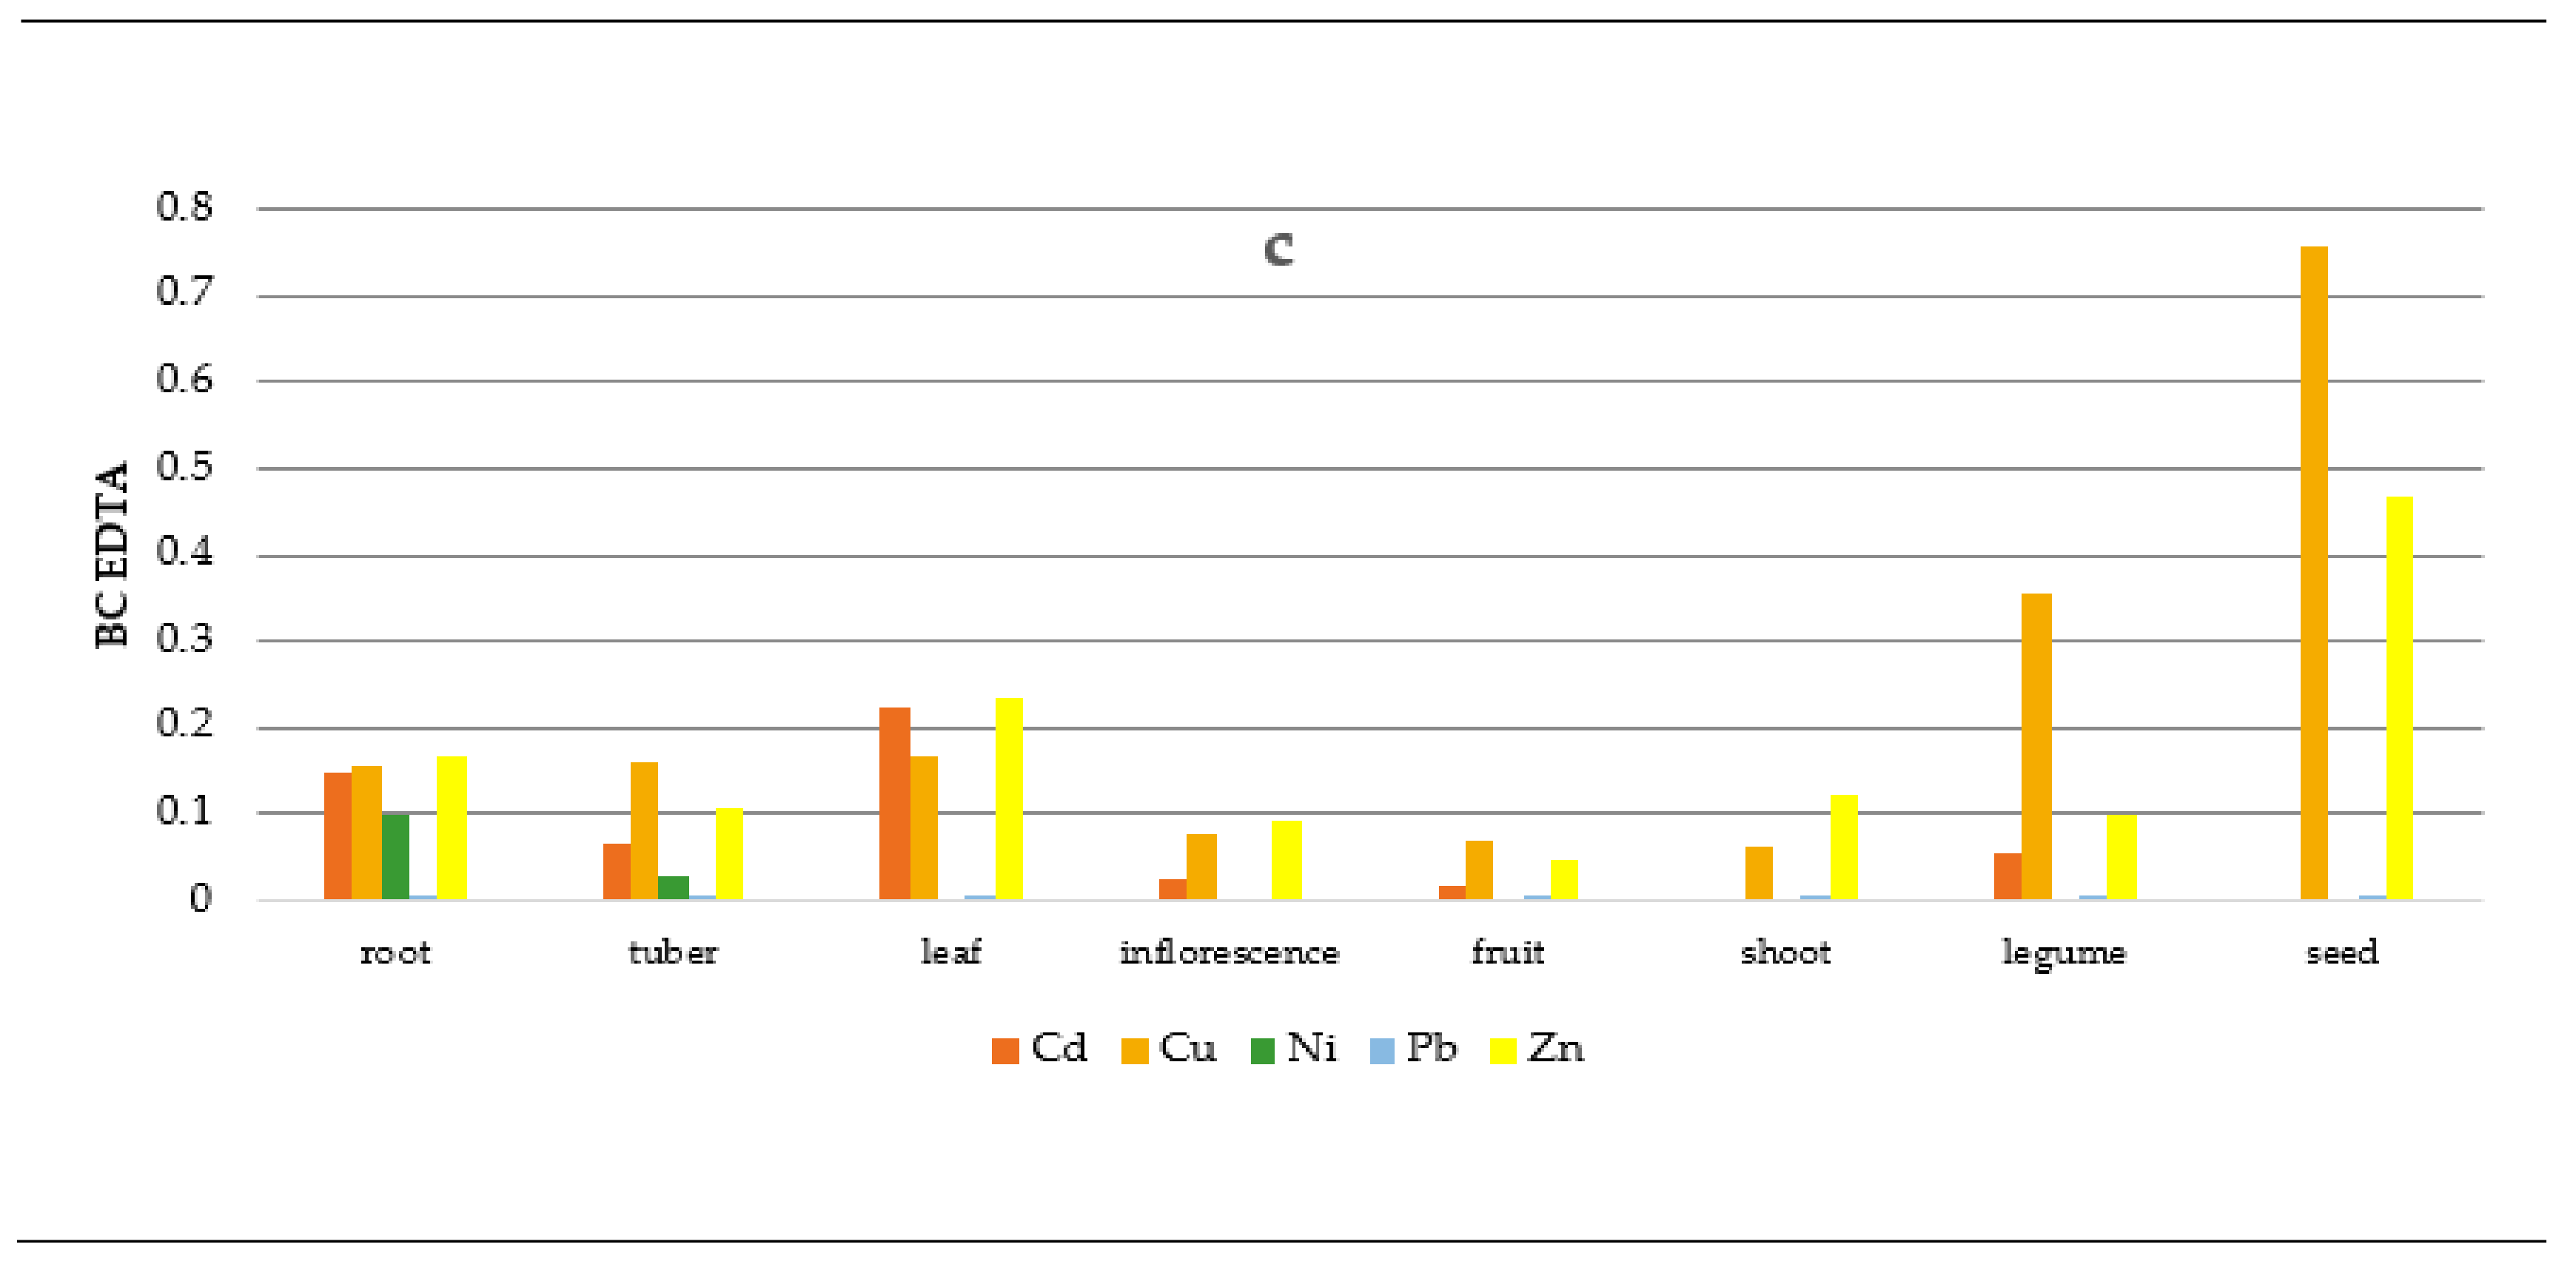
3.3. Soil-To-Plant Transfer Indices

Soil is the main source of PHEs for plants. Elements taken up from soil are distributed to different parts of plants, and some of them are especially susceptible for PHEs accumulation. To define the efficiency of PHE uptake by vegetables the soil-to-plant transfer indices were calculated. The values of bioaccumulation coefficient (BA) and bioconcentration coefficient (BC) were presented in Figure 2. The bioconcentration coefficient (BCF1) values were not calculated for Hg and Pb, since the contents of those PHEs in soil samples had been <LOD after the first step of the BCR extraction. Besides, the bioconcentration coefficient (BCEDTA) values were not calculated for As, Co, Hg, Sb, and Tl, since those PHEs had not been determined in soil after the 0.05 mol/L Na2EDTA extraction. The bioaccumulation coefficient (BAtotal) values were not calculated either for those groups of vegetables, whenever 100% of the samples had indicated the PHE concentrations <LOD (see Table 3). All the BAtotal and BCEDTA values were <1, indicating that none of the analyzed groups of vegetables had potential for PHE accumulation (Figure 2a,c). However, the BCF1 values were >1, indicating the potential of Tl accumulation in roots and leaves, Sb in tubers, and Cu in seeds (Figure 2b). The values of the calculated BAtotal coefficient indicated the obvious trend of the Cd, Hg, and Tl accumulation in roots and leaves, with Cd and Hg in tubers, and Hg in legumes. The one-way ANOVA analysis also revealed the significant differences of bioaccumulation coefficient (BA) values for investigated PHEs in different plants parts (Table S3). Calculated BA values were significantly different: for Cu in seed than in other investigated parts of vegetables; for Pb in legume than in other investigated parts of vegetables; and for Sb in tuber than in other investigated parts of vegetables. Moreover, considering investigated regions calculated BA values were significantly different (Table S4): For Cd in Śląskie than in Małopolskie, Świętokrzyskie and Opolskie regions; for Co in Małopolskie than in other regions; for Sb in Świętokrzyskie than in Opolskie and Śląskie regions; and for Zn in Opolskie than in other regions.
The bioconcentration coefficient (BCF1 and BCEDTA) values, calculated based on the available portions of PHEs in soils, indicated root capacity to adsorb Tl, tuber capacity to adsorb Sb, leaf capacity to adsorb Tl, Zn, and Cd, legume, and seed capacity to adsorb Cu, Sb, and Zn. The result of one-way ANOVA tests revealed that calculated BCF1 values were significantly different (Table S5): for Cd in leaf than in fruit and seed; for Cu in seed than in other investigated parts of vegetables; for Pb in legumes than in other investigated parts of vegetables; for Sb in tuber than in other investigated parts of vegetables; and for Zn in seed than in other investigated parts of vegetables. Considering investigated regions calculated BCF1 values were significantly different (Table S6): for Cd in Małopolskie than in Śląskie and Opolskie regions; for Co in Małopolskie than in other regions; for Pb in Małopolskie than in Śląskie region; for Sb in Małopolskie and Opolskie than in Świętokrzyskie and Śląskie regions; and for Zn in Świętokrzyskie than in Śląskie and Opolskie regions.
For calculated BCEDTA values the one-way ANOVA analysis revealed significant differences (Table S7) for Cd in leaf than in fruit and seed and for Pb in legume than in other investigated parts of vegetables. Considering investigated regions calculated BCEDTA values were significantly different (Table S8): for Cd in Świętokrzyskie and Małopolskie than in Śląskie and Opolskie regions; for Pb in Małopolskie than in Śląskie, Opolskie and Świętokrzyskie regions; and for Zn in Świętokrzyskie than in Opolskie and Śląskie regions. The results of Jolly et al. [77] revealed that the soil-to-plant transfer indices differed significantly between locations and plant species and those might be related to soil nutrient management and soil properties. The bioconcentration of Cd and Zn in vegetables could be explained by high contents of these elements in acid-soluble fraction (F1 step in the BCR extraction procedure) i.e., Cd 45%–59% and Zn 10%–60% of the total content in soil [22]. Despite acid-soluble content (F1 BCR) were relatively not high for Cu, Tl and Sb (up to 5% of the total concentration in soil) [22] BC values were the highest for these elements. Investigations of other researchers pointed that the highest values of bioaccumulation factors were stated for leafy [47,53,78] or root [79,80] vegetables, with reservations that many other factors should be considered in determining PHEs transfer from soil to plants, as reported by [54,56,57,58,77]. Moreover, heterogeneous accumulation of PHEs in different vegetable species, and different plant parts of same vegetable species could be attributed to their diverse morphological characteristics and position of edible plant parts in respect of their distance from roots and selective uptake of PHEs by each plant [47]. Thus, further investigations in this research area are being conducted. It is also worth of mentioning here, that investigated vegetables might be classified to different parts of plants by various researchers.

3.4. Human Health Risk Assessment

Edible plant cultivation on soils with elevated PHE contents causes presents of these elements in plants tissues. The prolonged consumption of PHEs in foodstuffs may lead to the disruption of numerous biological and biochemical processes in humans [47]. Vegetable consumption is the main source of PHEs introducing to humans [58]. Moreover, BCF values calculated for Tl, Sb, and Cu were >1, what indicated that these elements were cumulated in investigated plants. Thus, human health risk assessment calculations become the crucial part of the research.

3.4.1. Daily Intake Rates

Daily consumed amounts of specific groups of food are crucial in determination of the intake rate of contaminants that can be potentially present in meals eaten. The calculated daily intake rate (DIR) values of the consumed PHEs, among the eight analyzed groups of vegetables, were compared with the tolerable daily intakes of trace elements recommended by JECFA (Joint FAO/WHO Expert Committee on Food Additives), World Health Organization (WHO), and the United States Environmental Protection Agency (USEPA) guidelines. Using the provisional maximum tolerable daily intakes (PMTDI), the following values were adopted in this study (mg/kg bw-d): As 0.0021 [81], Cd 0.0008 [82], Co 0.0014 [83], Cu 0.5 [84], Hg 0.0006 [85], Ni 0.005 [82], Sb 0.006 [86], Tl 0.00014 [87], and Zn 1 [84].
The PHE intake rates of the consumed vegetables were presented as a percentage of PMTDI (%PMTDI) (Figure S3). The general trend of increasing PHE intake rates in the consumed vegetables was as follows: adults, according to the Polish statistical data (PL) < adults, according to the USEPA recommended values of consumption < children, according to the USEPA recommended values of consumption. Considering the mean PHE concentrations for adults (under the PL consumption scenario), the highest intake of all the PHEs, except for Tl, was established for tuber vegetables. That results from the fact that potato consumption is the highest among tuber vegetables (100 kg/person/year) in Poland and twice as high in comparison to that of Western European countries [88]. However, the consumption of unnecessary PHEs, as a percentage of PMTDI, was as follows: Cd 23%, Hg 5.0%, Ni 3.1%, Pb 2.6%, and As 0.4%. For Tl, the highest consumption, as a percentage of PMTDI, was determined in root (13.0%), followed by tuber (7.4%) and leafy (5%) vegetable consumption. Considering the mean PHE contents in both adults and children, according to the USEPA recommended values of consumption, the highest intake of unnecessary PHEs was established in root vegetables, followed by tuber and leafy ones (also in legume vegetables for Hg). The mean PHE contents of essential elements were determined in root, legumes, and seed vegetables. The intake values of unnecessary PHEs, as a percentage of PMTDI, by adults and children (under the USEPA consumption scenario) were equal to: As 1.0% and 2.5%, Cd 14% and 33%, Hg 1.7% and 3.9%, Ni 2.9% and 6.6%, Sb 2.4% and 5.5%, and Tl 43% and 100%, respectively.
The contribution of different groups of vegetables to the PHE daily intakes under the analyzed consumption scenarios was presented in Figure S4. The highest intake for all the analyzed PHEs was observed in root, tuber and leafy vegetables, while in case of essential elements also in seed, legume, and fruit vegetables. Considering the vegetable consumption by adult Poles, it was observed that the main intake was via tuber vegetables (as mentioned before in reference to potatoes mainly), in reference to both essential and unnecessary PHEs. The highest value was determined for Sb (94% of the daily intake rate from vegetable consumption only) and the lowest for Tl (29%). According to intake rates recommended by USEPA for both adults and children, it was observed that the rates were the highest in root vegetables. In adults, the lowest values were obtained for Cu (17% of daily intake rate from vegetable consumption), while the highest ones for As and Ni (95%). In children, those values were rather comparable: the lowest for Cu (18%) and the highest for Ni (97%), followed by As (91%).

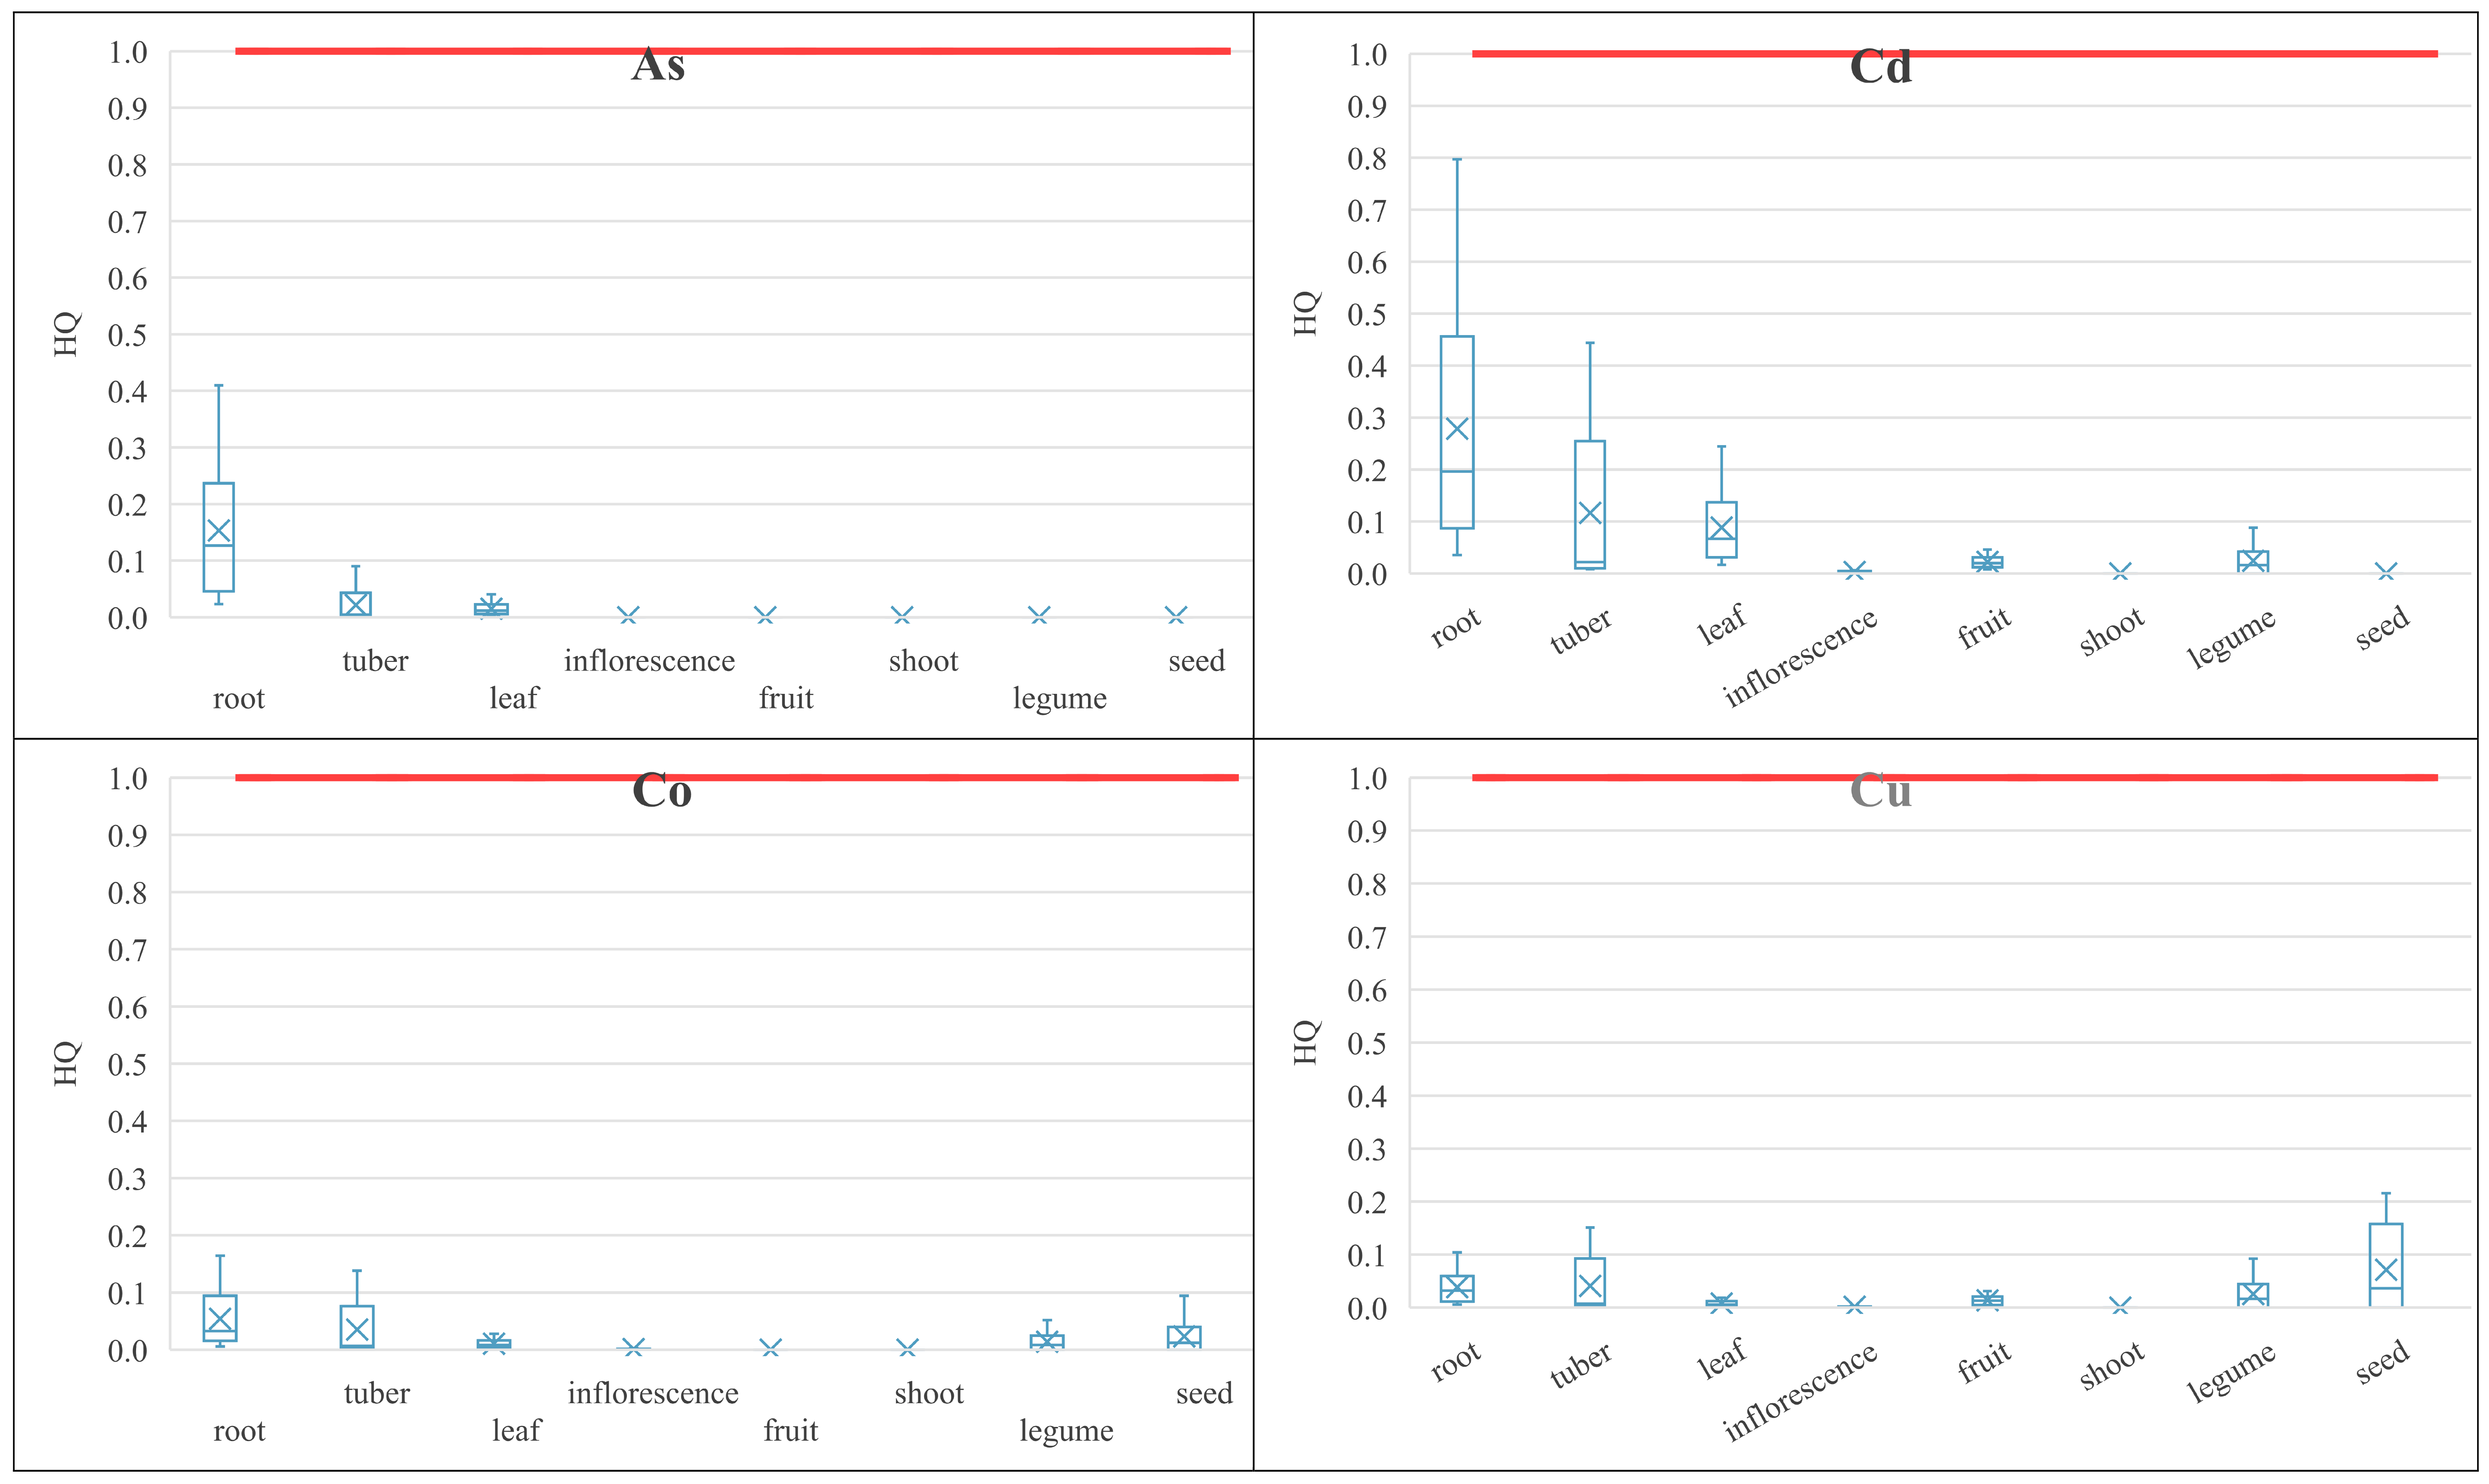
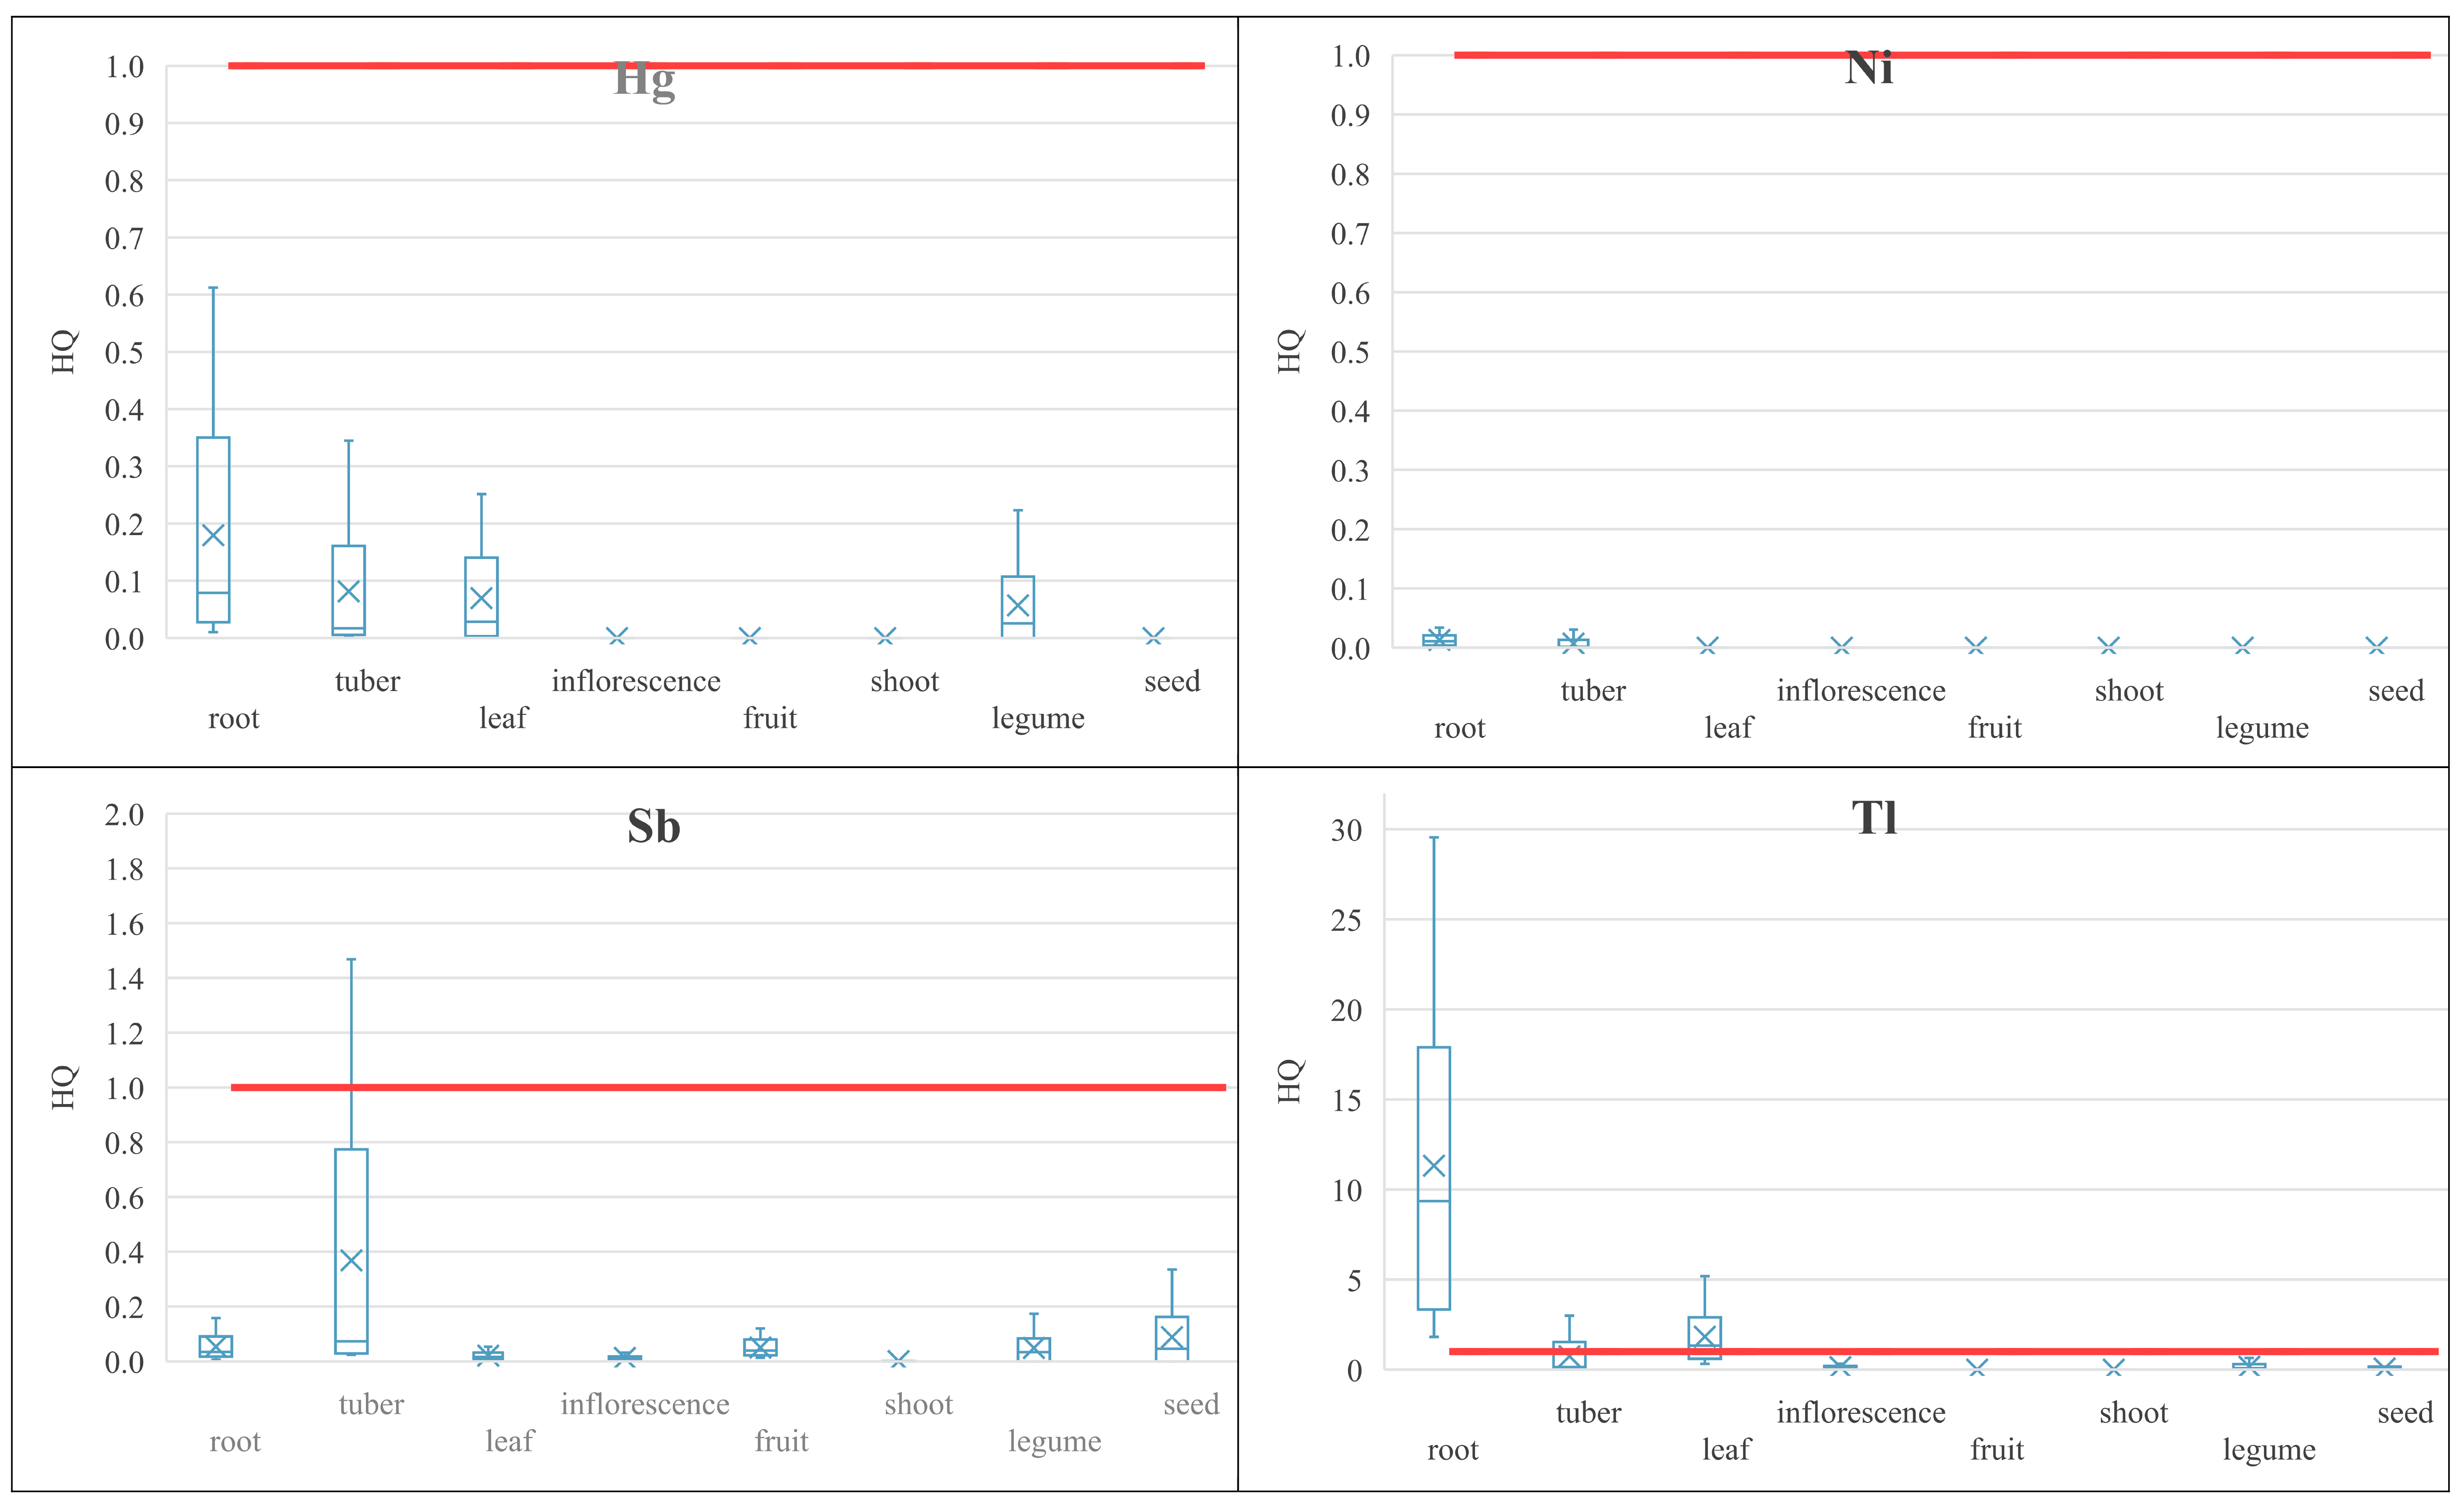
3.4.2. Non-Carcinogenic Risk of PHEs

The target non-carcinogenic risk value described as hazard quotient (HQ) was set to be equal to 1, according to USEPA [30], as well as the Polish Regulation of the Minister of the Environment on the conduct of the assessment of contamination of the surface of the earth [89]. Statistical characterization of the calculated HQ values for the respective groups of vegetables was presented in Figure 3 under the analyzed intake scenarios. The target HQ = 1 value was exceeded for particular PHEs in the case of Sb in tuber vegetables and Tl in root, leafy, and tuber vegetables. For other PHEs, the highest HQ values were observed in root, tuber, and leafy vegetables in reference to unnecessary elements, except of Hg for which elevated HQ values occurred also in legumes. The total non-carcinogenic risk in particular groups of vegetables (calculated as the sum of HQ values of single PHEs) revealed that the target non-carcinogenic risk values were significantly exceeded in root vegetables (mean HQ = 12.1) under the assessed vegetable intake scenarios, and also exceeded for leafy (mean HQ = 2.1) and tuber (mean HQ = 1.4) vegetables.

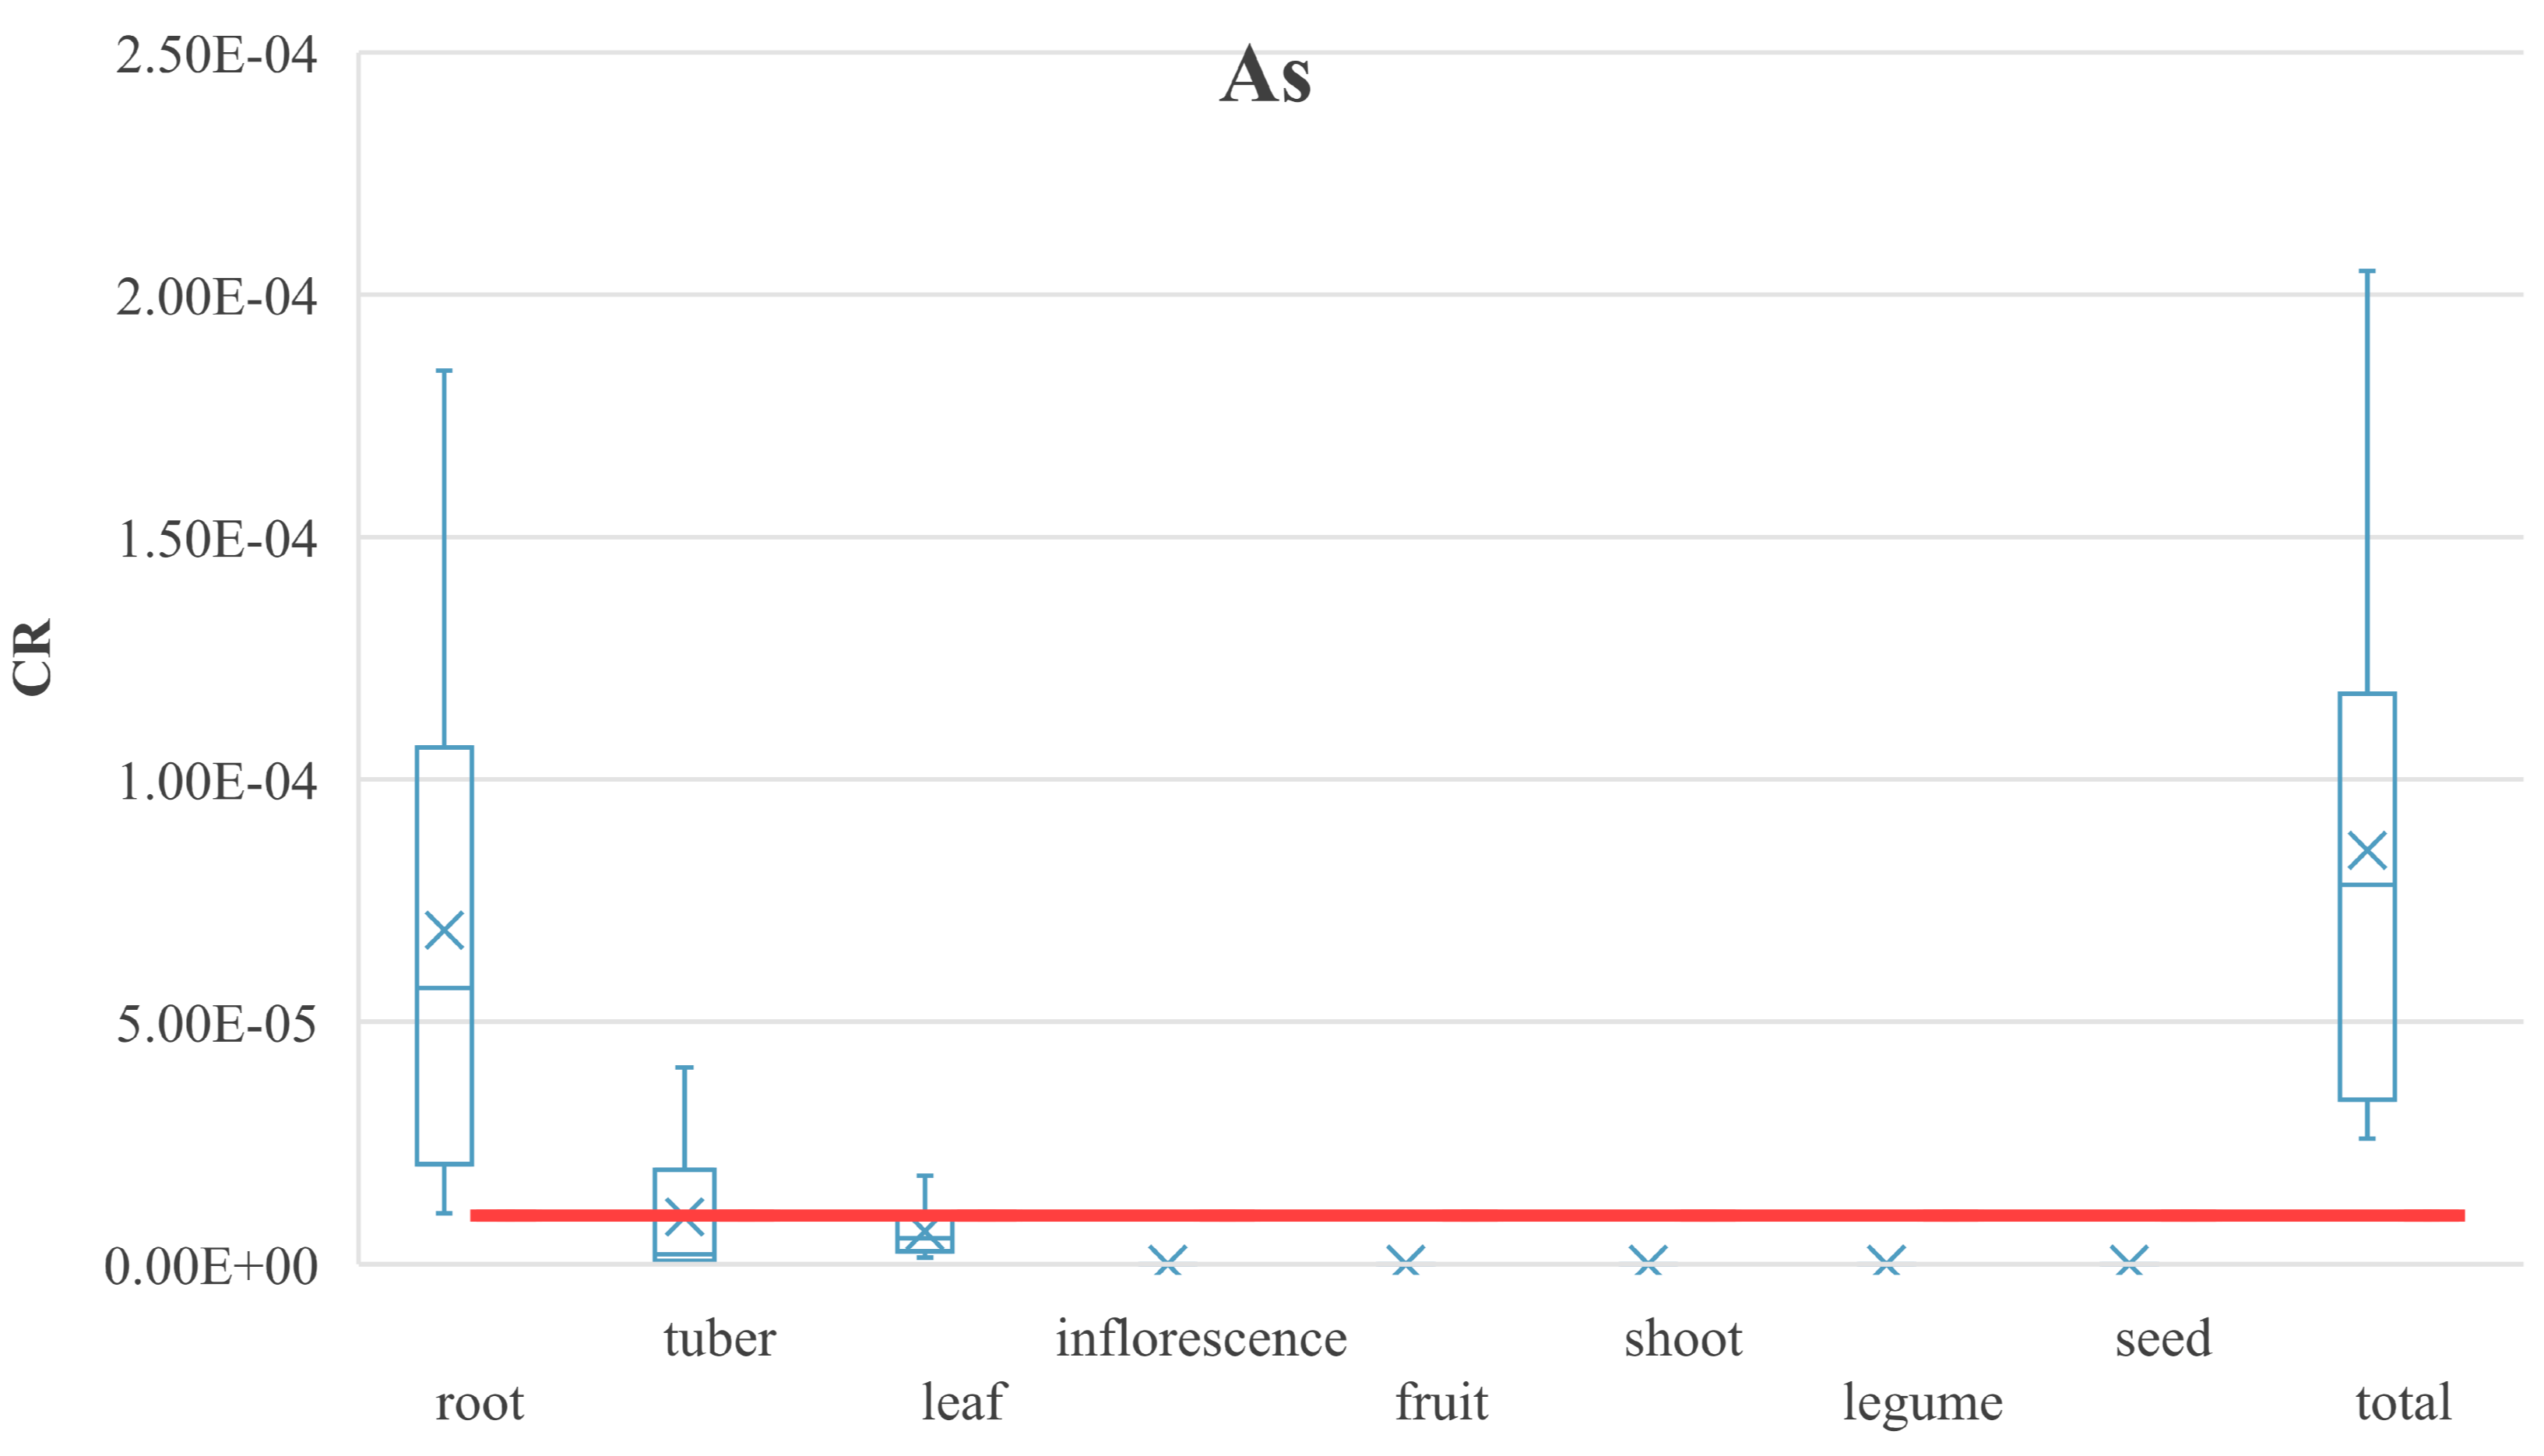
3.4.3. Carcinogenic Risk of PHEs

The acceptable carcinogenic risk level was set to be equal to 1 × 10⁻⁵, as defined in the Polish Regulation of the Minister of the Environment on the conduct of the assessment of contamination of the surface of the earth [89]. In this study, only As was investigated as carcinogenic, according to the current knowledge of the SF values for chemical substances.
The statistical characterization of the calculated CR values for the respective groups of vegetables was presented in Figure 4 under the analyzed intake scenarios. The acceptable CR level of As was exceeded in root vegetables in all the investigated groups of vegetables. Considering the mean CR value, the level was equal to 1.72 × 10⁻⁵ under the PL adult intake scenario; 5.69 × 10⁻⁵ under the USEPA adult intake scenario, and 1.33 × 10⁻⁴ under the USEPA child intake scenario. In the case of tuber vegetables, the acceptable carcinogenic risk level was exceeded, since the CR value was equal to 2.65 × 10⁻⁵ under the PL adult intake scenario. The acceptable carcinogenic risk levels were not exceeded in either adults or children under the USEPA scenario: the calculated CR values were equal to 1.15 × 10⁻⁶ and 1.47 × 10⁻⁶, respectively. In the case of leafy vegetables, the mean CR values were exceeded under the USEPA children intake scenario, since the value was equal to 1.28 × 10⁻⁵. The acceptable carcinogenic risk level was not exceeded in adults: CR was equal to 5.27 × 10⁻⁶ under the PL adult scenario and 2.40 × 10⁻⁶ under the USEPA scenario. The total carcinogenic risk of As (calculated as the sum of CR values for specific groups of vegetables) revealed the unacceptable risk: The mean total CR value was equal to 8.54 × 10⁻⁵ under the investigated scenarios.

3.4.4. Margin of Exposure to Pb

The BMDL values are used to determine health risk from the exposure to Pb, although those values are not health-based guidance values but rather the levels below which health risk is considered to be acceptable low [29]. Thus, using the MOE approach, the values <1 indicate high health risk, while the values of MOE > 1 point at acceptable low risk. Considering the exposure scenario for PL adults, via the total daily vegetable consumption, the MOE value was equal to 3.1 for Pb. The MOE value was equal to 7.7 for Pb in adults under the USEPA daily vegetable intake scenario, and to 1.6 (Table 5) in children. At the P95 exposure level, the MOE values of Pb in adult Poles and children under the USEPA scenario were equal to 0.9 and 0.4, respectively, while the MOE value was equal to 2.2 in adults under the USEPA intake scenario. Under all the three investigated exposure scenarios, at mean exposure levels, as well as at the P95 exposure scenario in USEPA adults, the calculated MOE values were >1, indicating low health risk of the Pb intake from the daily consumption of vegetables. At the P95 exposure level, the calculated MOE values in adults, under the Polish statistical data exposure scenario, and in children, under the USEPA exposure scenario, the calculated MOE values were <1, indicating high risk of the Pb intake via the daily consumption of vegetables.

3.4.5. Uncertainties in HHRA

The values of calculated risk depended strongly on the assumed intake rates. The statistical data, averaged for a large general population, were the values applied in this study. The Polish statistical data concerning intake rates were available only for adults and concerned only the most commonly consumed groups of products in Poland. The intake rate of vegetables equal to 389 g was so high due to the consumption of potatoes that was twice as high in comparison to the Western European countries. Thus, also the recommended consumed amounts of vegetables from the USEPA guidelines were used for the HHRA calculations. Unfortunately, no statistical data were available for children in Poland, thus, also in that case, the recommended values of vegetable consumption by children were used in the HHRA analysis. The amount of daily consumed vegetables, according to the values recommended by USEPA, was equal to 227 g in adults and 121 g in children. Moreover, there were differences in the assignment of particular vegetables to their groups in respect of the edible parts of plants among various studies, and that could also have some impact on the calculated intake rates and indirectly on risk values. It was evidenced that the local statistical data, obtained exactly on site, were necessary for the reliable risk value assessment. In addition, risk assessment required the values of some parameters that were normally not investigated under general statistical research projects. The contributions of various groups of consumed vegetables in the daily PHE intakes were based on the assumption that vegetable consumption constituted 100% of the PHE intake, meaning that other PHE ingestion sources were not taken into consideration (besides inhalation and dermal exposure). Thus, if fruit and cereals were included as other groups of consumed plants (again omitting other food product groups, i.e., meat, dairy, and processed food products), the risk values would be different than the calculated values.

4. Conclusions

The present studies investigated concentrations of PHEs in eight groups of vegetables cultivated on the arable soils of southern Poland, and, in reference to that, the human health-risk implications were considered as well. Although PHE concentrations in arable soils of the specific Polish regions were below permissible levels [22], the mean contents of Hg in roots, leaves, and legumes, determined in the current research, as well as the Cd concentrations in roots, were on the border of the maximum allowable concentrations. The contents of other PHEs in the investigated parts of vegetables were not close to the limit values, specified in the European Commission regulation on maximum levels for certain contaminants in foodstuff. The HHRA analysis was calculated basing on the statistical amounts of consumed edible plants. The target non-carcinogenic risk to human health from the total PHEs content in the analyzed vegetables was exceeded in root, as well as in leafy and tuber vegetables. The total carcinogenic risk of As for specific groups of vegetables was assessed as unacceptable risk. The risk from Pb intake via vegetables, according to the MOE approach, might occur at the P95 exposure level, in adults, under the Polish statistical data exposure scenario, and in children, under the USEPA exposure scenario. It was proved that the HHRA analysis was recommended, in the light of the latest scientific findings concerning toxicological properties of chemicals, even where the environmental quality standards were maintained. However, precise local statistical data were required to achieve the real risk values.

Supplementary Materials

The following are available online at https://0-www-mdpi-com.brum.beds.ac.uk/1660-4601/16/20/4053/s1, Figure S1: Dendogram of PHEs in vegetable samples according to Sneath’s criteria; Figure S2: The color-scale map representing standardized contents of PHEs in vegetables; Figure S3: Daily intake rates of PHEs via consumed vegetables, as a percentage of provisional maximum tolerable daily intake (%PMTDI); Figure S4: The contribution of various groups of vegetables to the PHE daily intake rates; Table S1: Results of one-way ANOVA of differences between average concentrations of PHEs in groups of vegetables; Table S2: Results of one-way ANOVA of differences between average concentrations of PHEs in investigated regions of southern Poland; Table S3: Results of one-way ANOVA of differences between average BAtotal values of PHEs in groups of vegetables; Table S4: Results of one-way ANOVA of differences between BAtotal values of PHEs in investigated regions of southern Poland; Table S5: Results of one-way ANOVA of differences between average BCF1 values of PHEs in groups of vegetables; Table S6: Results of one-way ANOVA of differences between BCF1 values of PHEs in investigated regions of southern Poland; Table S7: Results of one-way ANOVA of differences between average BCEDTA values of PHEs in groups of vegetables; Table S8: Results of one-way ANOVA of differences between BCEDTA values of PHEs in investigated regions of southern Poland.

Funding

This research was supported within the framework of Dean’s Grant No. 15.11.140.357 and Statutory Research Grant No. 11.11.140.199 by the AGH University of Science and Technology.

Conflicts of Interest

The author declares no conflict of interest.

References

  1. Guenther, P.M.; Dodd, K.W.; Reedy, J.; Krebs-Smith, S.M. Most Americans eat much less than recommended amounts of fruits and vegetables. J. Am. Diet. Assoc. 2006, 106, 1371–1379. [Google Scholar] [CrossRef]
  2. Fuller, R.; Rahona, E.; Fisher, S.; Caravanos, J.; Webb, D.; Kass, D.; Matte, T.; Landrigan, P.J. Pollution and non-communicable disease: Time to end the neglect. Lancet Planet Health 2018, 2, e96–e98. [Google Scholar] [CrossRef]
  3. Rehman, Z.U.; Khan, S.; Shah, M.T.; Brusseau, M.L.; Khan, S.A.; Mainhagu, J. Transfer of heavy metals from soils to vegetables and associated human health risks at selected sites in Pakistan. Pedosphere 2018, 28, 666–679. [Google Scholar] [CrossRef]
  4. Antoniadis, V.; Shaheen, S.M.; Boersch, J.; Frohne, T.; Du Laing, G.; Rinklebe, J. Bioavailability and risk assessment of potentially toxic elements in garden edible vegetables and soils around a highly contaminated former mining area in Germany. J. Environ. Manag. 2017, 186, 192–200. [Google Scholar] [CrossRef]
  5. Gabari, V.; Fernández-Caliani, J.C. Assessment of trace element pollution and human health risk associated with cultivation of mine soil: A case study in the Iberian Pyrite Belt. Hum. Ecol. Risk Assess. 2017. [Google Scholar] [CrossRef]
  6. Liu, C.; Chang, C.; Fei, Y.; Li, Y.; Wang, Q.; Zhai, G.; Lei, J. Cadmium accumulation in edible flowering cabbages in the Peral River Delta, China: Critical soil factors and enrichment models. Environ. Pollut. 2018, 233, 880–888. [Google Scholar] [CrossRef] [PubMed]
  7. Ahmed, M.; Matsumoto, M.; Ozaki, A.; van Tinh, N.; Kurosawa, K. Heavy Metal Contamination of irrigation water, soil, and vegetables and the difference between dry and wet seasons near a multi-industry zone in Bangladesh. Water 2019, 11, 583. [Google Scholar] [CrossRef]
  8. Hu, Y.; Zhou, J.; Du, B.; Liu, H.; Zhang, W.; Liang, J.; Zhang, W.; You, L.; Zhou, J. Health risks to local residents from the exposure of heavy metals around the largest copper smelter in China. Ecotoxicol. Environ. Safe 2019, 171, 329–336. [Google Scholar] [CrossRef] [PubMed]
  9. Baghaie, A.R.; Fereydoni, M. The potential risk of heavy metals on human health due to the daily consumption of vegetables. Environ. Health Eng. Manag. 2019, 6, 11–16. [Google Scholar] [CrossRef]
  10. Pipoyan, D.; Stepanyan, S.; Stepanyan, S.; Beglaryan, M.; Merendino, N. Health risk assessment of potentially toxic elements in vegetables grown under the impact of Kajaran Mining Complex. Biol. Trace Elem. Res. 2019. [Google Scholar] [CrossRef]
  11. Bini, C.; Bech, J. PHEs, Environment and Human Health. Potentially Harmful Elements in the Environment and the Impact on Human Health; Springer: Dordrecht, Germany, 2014. [Google Scholar]
  12. Mallik, A.; Dutta, J.; Sultana, P.; Mitra, A. Bioaccumulation pattern of heavy metals in vegetables collected from selected areas in and around Kolkata city (India). Int. J. High. Educ. Res. 2017, 7, 121–134. [Google Scholar]
  13. Rahman, M.; Islam, M.A. Concentrations and health risk assessment of trace elements in cereals, fruits, and vegetables of Bangladesh. Biol. Trace Elem. Res. 2019, 191, 243–253. [Google Scholar] [CrossRef] [PubMed]
  14. Use of Grounds and Surface Area in the Year 2015; Central Statistical Office: Warszawa, Poland, 2016. Available online: https://stat.gov.pl/download/gfx/portalinformacyjny/pl/defaultaktualnosci/5507/8/10/1/uzytkowanie_gruntow_i_powierzchnia_zasiewow_w_2015_r_zm.pdf (accessed on 19 May 2019).
  15. Szczepańska, J.; Twardowska, I. Distribution and environmental impact of coal-mining wastes in Upper Silesia, Poland. Environ. Geol. 1999, 38, 249–258. [Google Scholar] [CrossRef]
  16. Jończy, I.; Gawor, Ł. Coal mining and post-metallurgic dumping grounds and their connections with exploitation of raw materials in the region of Ruda Śląska. Arch. Min. Sci. 2017, 62, 301–311. [Google Scholar]
  17. Krzaklewski, W.; Barszcz, J.; Małek, S.; Kozioł, K.; Pietrzykowski, M. Contamination of forest soils in the vicinity of the sedimentation pond after zinc and lead ore flotation (in the region of Olkusz, southern Poland). Water Air Soil Pollut. 2004, 159, 151–164. [Google Scholar] [CrossRef]
  18. Postawa, A.; Motyka, J. Selected trace elements and metals in groundwater within Permian sediments near Olkusz (Zn-Pb ore mining region, S Poland). Environ. Sci. Pollut. Res. 2019, 26, 34–43. [Google Scholar] [CrossRef]
  19. Potysz, A.; Kierczak, J.; Pietranik, A.; Kądziołka, K. Mineralogical, geochemical, and leaching study of historical Cu-slags issued from processing of the Zechstein formation (Old Copper Basin, south-western Poland). Appl. Geochem. 2018, 98, 22–35. [Google Scholar] [CrossRef]
  20. Dudka, S.; Piotrowska, M.; Chlopecka, A.; Witek, T. Trace metal contamination of soils and crop plants by the mining and smelting industry in Upper Silesia, South Poland. J. Geochem. Explor. 1995, 52, 237–250. [Google Scholar] [CrossRef]
  21. Gzyl, J. Lead and cadmium contamination of soil and vegetables in the Upper Silesia region in Poland. Sci. Total Environ. 1990, 96, 199–209. [Google Scholar] [CrossRef]
  22. Gruszecka-Kosowska, A.; Baran, A.; Wdowin, M.; Mazur-Kajta, K.; Czech, T. The contents of the potentially harmful elements in the arable soils of southern Poland, with the assessment of ecological and health risks: A case study. Environ. Geochem. Health 2019. [Google Scholar] [CrossRef]
  23. Gruszecka-Kosowska, A.; Baran, A.; Wdowin, M.; Mazur-Kajta, K.; Czech, T. Geochemical fractions of the agricultural soils of southern Poland and the assessment of the Potentially Harmful Element mobility. Submitted. 2019. [Google Scholar]
  24. Guerra, F.; Trevizam, A.R.; Muraoka, T.; Marcante, N.C.; Canniti-Brazaca, S.G. Hevy metals in vegetables and potential risk for human health. Sci. Agric. 2010, 69, 54–60. [Google Scholar] [CrossRef]
  25. Method 6020B: Inductively Coupled Plasma—Mass Spectrometry. Revision 2; USEPA: Washington, DC, USA, 1998. Available online: https://www.epa.gov/sites/production/files/2015-12/documents/6020b.pdf (accessed on 15 January 2019).
  26. PN-EN ISO 17294-2. In Water Quality—Use of Inductively Induced Plasma Mass Spectrometry (ICP-MS)—Part 2: Determination of 62 Elements; Polish Committee for Standardization: Warsaw, Poland, 2006.
  27. Dziubanek, G.; Piekut, A.; Rusin, M.; Baranowska, R.; Hajok, I. Contamination of food crops grown on soils with elevated heavy metals content. Ecotoxicol. Environ. Safe 2015, 118, 183–189. [Google Scholar] [CrossRef] [PubMed]
  28. McBride, M.; Shayler, H.A.; Spliethoff, H.M.; Mitchell, R.G.; Marquez-Bravo, L.G.; Ferenz, G.S.; Russell-Anelli, J.M.; Casey, L.; Bachman, S. Concentrations of lead, cadmium and barium in urban garden-grown vegetables: The impact of soil variables. Environ. Pollut. 2014, 194, 254–261. [Google Scholar] [CrossRef] [PubMed] [Green Version]
  29. Exposure Factors Handbook: 2011 Edition; EPA/600/R-09/052F, US Environmental Protection Agency; National Center for Environmental Assessment: Washington, DC, USA, 2011. Available online: http://ofmpub.epa.gov/eims/eimscomm.getfile?p_download_id=522996 (accessed on 3 March 2019).
  30. PN-EN ISO 17294-1. In Water Quality—Induced Plasma Mass Spectrometry (ICP-MS)—Part 1: General Guidelines; Polish Committee for Standardization: Warsaw, Poland, 2007.
  31. PN-EN ISO 11885. In Water Quality—Determination of Selected Elements by Inductively Coupled Plasma Optical Emission Spectrometry (ICP-OES); Polish Committee for Standardization: Warsaw, Poland, 2009.
  32. WHO. GEMS/Food-EURO Second Workshop on Reliable Evaluation of Low-Level Contamination of Food: Report on a Workshop in the Frame of GEMS Food-EURO, Kulmbach, Germany, 26–27 May 1995; WHO: Geneva, Switzerland, 1995. [Google Scholar]
  33. Rai, P.K.; Lee, S.S.; Zhang, M.; Tsang, Y.F.; Kim, K.H. Heavy metals in food and crops: Health risks, fate, mechanisms, and management. Environ. Int. 2019, 125, 365–385. [Google Scholar] [CrossRef] [PubMed]
  34. Inacio, M.; Neves, O.; Pereira, V.; da Silva, E.F. Levels of selected potential harmful elements (PHEs) in soils and vegetables used in diet of the population living in the surroundings of the Estarreja Chemical Complex (Portugal). Appl. Geochem. 2014, 44, 38–44. [Google Scholar] [CrossRef]
  35. Wang, G.; Su, M.Y.; Chen, Y.H.; Lin, F.F.; Luo, D.; Gao, S.F. Transfer characteristic of cadmium and lead from soil to the edible parts of six vegetable species in southeastern China. Environ. Pollut. 2006, 144, 127–135. [Google Scholar] [CrossRef]
  36. Risk Assessment Guidance for Superfund, Vol. 1: Human Health Evaluation Manual, Part A; Interim final; Office of Emergency and Remedial Response. US Environmental Protection Agency: Washington, DC, USA, 1989. Available online: https://www.epa.gov/sites/production/files/2015-09/documents/rags_a.pdf (accessed on 11 April 2019).
  37. WHO. Dietary Exposure Assessment of Chemicals in Food. Report of Joint FAO/WHO Consultation; WHO Library: Annapolis, MD, USA, 2005. [Google Scholar]
  38. Seremak-Bulge, J. Fruits and Vegetables Market State and Perspectives. No 48. Institute of Agricultural and Food Economics—National Research Institute; IERiGŻ-PIB: Warsaw, Poland, 2016. [Google Scholar]
  39. Seremak-Bulge, J. Potato Market State and Perspectives. No 43. Institute of Agricultural and Food Economics—National Research Institute; IERiGŻ-PIB: Warsaw, Poland, 2016. [Google Scholar]
  40. Risk Assessment Guidance for Superfund, Vol. 3: Part A, Process for Conducting Probabilistic Risk Assessment; Office of Emergency and Remedial Response, US Environmental Protection Agency: Washington, DC, USA, 2001. Available online: https://www.epa.gov/sites/production/files/2015-09/documents/rags3adt_complete.pdf (accessed on 11 April 2019).
  41. Regional Screening Level (RSL) Summary Table (TR=1E-06, HQ=1), April 2019. US Environmental Protection Agency: Washington DC, USA, 2019. Available online: https://semspub.epa.gov/src/document/HQ/199432 (accessed on 21 May 2019).
  42. Panel, E.C. Scientific opinion on lead in food—EFSA panel on contaminants in the food chain. Eur. Food Saf. Auth. J. 2010, 8, 151. [Google Scholar]
  43. European Food Safety Authority. Opinion of the scientific committee on a request from EFSA related to a harmonised approach for risk assessment of substances which are both genotoxic and carcinogenic. Eur. Food Saf. Auth. J. 2005, 10, 282. [Google Scholar]
  44. Wang, M.; Liang, B.; Zhang, W.; Chen, K.; Zhang, Y.; Zhou, H.; Cheng, Y.; Liu, H.; Zhong, X.; Li, Y.; et al. Dietary lead exposure and associated health risks in Guangzhou, China. Int. J. Environ. Res. Public Health 2019, 16, 1417. [Google Scholar] [CrossRef]
  45. Dziubanek, G.; Baranowska, R.; Ćwieląg-Drabek, M.; Spychała, A.; Piekut, A.; Rusin, M.; Hajok, I. Cadmium in edible plants from Silesia, Poland, and its implications for health risk in populations. Ecotoxicol. Environ. Safe 2017, 142, 8–13. [Google Scholar] [CrossRef] [PubMed]
  46. Figurska-Ciura, D.; Łoźna, K.; Styczyńska, M. Cadmium, lead, zinc and copper contents in selected vegetables and fruit from garden allotments of the south-western Poland. Pol. J. Food Nutr. Sci. 2007, 57, 137–143. [Google Scholar]
  47. Singh, S.; Zacharias, M.; Kalpana, S.; Mishra, S. Heavy metals accumulation and distribution pattern in different vegetable crops. J. Environ. Chem. Ecotoxicol. 2012, 4, 75–81. [Google Scholar] [CrossRef]
  48. Liu, X.; Song, Q.; Tang, Y.; Wanlu, L.; Xu, J.; Wu, J.; Wang, F.; Brookes, P.C. Human health risk assessment of heavy metals in soil-vegetable system: A multi-medium analysis. Sci. Total Environ. 2013, 463, 530–540. [Google Scholar] [CrossRef]
  49. Chang, C.Y.; Yu, H.Y.; Chen, J.J.; Li, F.B.; Zhang, H.H.; Liu, C.P. Accumulation of heavy metals in leaf vegetables from agricultural soils and associated potential health risks in the Pearl River Delta, South China. Environ. Monit. Assess. 2014, 186, 1547–1560. [Google Scholar] [CrossRef]
  50. Chefri, A.; Abdoun, S.; Gaci, O. Food survey: Levels and potential health risk of chromium, lead, zinc and copper content in fruits and vegetables consumed in Algeria. Food Chem. Toxicol. 2014, 70, 48–53. [Google Scholar]
  51. Li, N.; Kang, Y.; Pan, W.; Zeng, L.; Zhang, Q.; Luo, J. Concentration and transportation of heavy metals in vegetables and risk assessment of human exposure to bioaccessible heavy metals in soils near a waste-incinerator site, South China. Sci. Total Environ. 2015, 521, 144–151. [Google Scholar] [CrossRef]
  52. Baldantoni, D.; Morra, L.; Zaccardelli, M.; Alfani, A. Cadmium accumulation in leaves of leafy vegetables. Ecotoxicol. Environ. Safe 2016, 123, 89–94. [Google Scholar] [CrossRef]
  53. Zhou, H.; Yang, W.T.; Zhou, X.; Liu, L.; Gu, J.F.; Wang, W.L.; Zou, J.L.; Tian, T.; Peng, P.Q.; Liao, B.H. Accumulation of heavy metals in vegetable species planted in contaminated soils and the health risk assessment. Int. J. Environ. Res. Public Health 2016, 13, 289. [Google Scholar] [CrossRef]
  54. Khan, A.; Khan, S.; Khan, M.A.; Qamar, Z.; Waqas, M. The uptake and bioaccumulation of heavy metals by food plants, their effects on plant nutrients, and associated health risk: A review. Environ. Sci. Pollut. Res. 2015, 22, 13772–13799. [Google Scholar] [CrossRef]
  55. Chaves, L.H.G.; Estrela, M.A.; Sena de Souza, R. Effect on plant growth and heavy metal accumulation by sunflower. J. Phytol. 2011, 3, 4–9. [Google Scholar]
  56. Gupta, N.; Yadav, K.K.; Kumar, V.; Kumar, S.; Chadd, R.P.; Kumar, A. Trace elements in soil-vegetables interface: Translocation, bioaccumulation, toxicity and amelioration—A review. Sci. Total Environ. 2019, 651, 2927–2942. [Google Scholar] [CrossRef] [PubMed]
  57. Gall, J.E.; Boyd, R.S.; Rajakaruna, N. Transfer of heavy metals through terrestrial food webs: A review. Environ. Monit. Assess. 2015, 187, 201. [Google Scholar] [CrossRef] [PubMed]
  58. Khan, A.; Rehman, S.; Khan, A.Z.; Khan, M.A.; Shah, M.T. Soil and vegetables enrichment with heavy metals from geological sources in Gilgit, northern Pakistan. Ecotox Environ. Safe 2010, 73, 1820–1827. [Google Scholar] [CrossRef]
  59. Alam, M.; Khan, M.; Khan, A.; Zeb, S.; Khan, M.A.; ul Amin, N.; Sajid, M.; Khattak, A.M. Concentrations, dietary exposure, and human health risk assessment of heavy metals in market vegetables of Peshawar, Pakistan. Environ. Monit. Assess. 2018, 190, 505. [Google Scholar] [CrossRef] [PubMed]
  60. Ávila, P.F.; da Silva, E.F.; Candeias, C. Health risk assessment through consumption of vegetables rich in heavy metals: The case study of the surrounding villages from Panasqueira mine, Central Portugal. Environ. Geochem. Health 2017, 39, 565–589. [Google Scholar] [CrossRef] [PubMed]
  61. Barrio-Parra, F.; Izquierdo-Díaz, M.; Dominguez-Castillo, A.; Medina, R.; De Miguel, E. Human-health probabilistic risk assessment: The role of exposure factors in an urban garden scenario. Landsc. Urban Plan. 2019, 185, 191–199. [Google Scholar] [CrossRef]
  62. Eliku, T.; Leta, S. Heavy metals bioconcentration from soil to vegetables and appraisal of health risk in Koka and Wonji farms, Ethiopia. Environ. Sci. Pollut. Res. 2017, 24, 11807–11815. [Google Scholar] [CrossRef]
  63. Ferri, R.; Hashim, D.; Smith, D.R.; Guazzetti, S.; Donna, F.; Ferretti, E.; Curatolo, M.; Moneta, C.; Beone, G.M.; Lucchini, R.G. Metal contamination of home garden soils and cultivated vegetables in the province of Brescia, Italy: Implications for human exposure. Sci. Total Environ. 2015, 518, 507–517. [Google Scholar] [CrossRef]
  64. Latif, A.; Bilal, M.; Asghar, W.; Azeem, M.; Ahmad, M.I.; Abbas, A.; Ahmad, M.Z.; Shahzad, T. Heavy metal accumulation in vegetables and assessment of their potential health risk. J. Environ. Anal. Chem. 2018, 5, 234. [Google Scholar] [CrossRef]
  65. Kananke, T.; Wansapala, J.; Gunarante, A. Detection of Ni, Cd, and Cu in green leafy vegetables collected from different cultivation areas in and around Colombo District Sri Lanka. Environ. Monit. Assess. 2016, 188, 187. [Google Scholar] [CrossRef] [PubMed]
  66. Liang, G.; Gong, W.; Li, B.; Zuo, J.; Pan, L.; Liu, X. Analysis of heavy metals in foodstuffs and an assessment of the health risks to the general public via consumption in Beijing, China. Int. J. Environ. Res. Public Health 2019, 16, 909. [Google Scholar] [CrossRef] [PubMed]
  67. Margenat, A.; Matamoros, V.; Díez, S.; Cañameras, N.; Comas, J. Occurrence and human health implications of chemical contaminants in vegetables grown in peri-urban agriculture. Environ. Int. 2019, 124, 49–57. [Google Scholar] [CrossRef] [PubMed]
  68. Pipoyan, D.; Beglaryan, M.; Sireyan, L.; Merendino, N. Exposure assessment of potentially toxic trace elements via consumption of fruits and vegetables grown under the impact of Alaverdi’s mining complex. Hum. Ecol. Risk Assess. 2019, 25, 819–834. [Google Scholar] [CrossRef]
  69. Mihaileanu, R.G.; Neamtiu, I.A.; Fleming, M.; Pop, C.; Bloom, M.S.; Roba, C.; Surcel, M.; Stamatian, F.; Gurzau, E. Assessment of heavy metals (total chromium, lead, and manganese) contamination of residential soil and homegrown vegetables near a former chemical manufacturing facility in Tarnaveni, Romania. Environ. Monit. Assess. 2019, 191, 8. [Google Scholar] [CrossRef]
  70. Shaheen, N.; Irfan, N.F.; Khan, I.N.; Islam, S.; Islam, M.S.; Ahmed, M.K. Presence of heavy metals in fruits and vegetables: Health risk implications in Bangladesh. Chemosphere 2016, 152, 431–438. [Google Scholar] [CrossRef]
  71. Wachirawongsakorn, P. Health risk assessment via consumption of Pb and Cd contaminated vegetables collected from fresh markets in the lower north of Thailand. Hum. Ecol. Risk Assess. 2016, 22, 611–622. [Google Scholar] [CrossRef]
  72. Zhong, T.; Xue, D.; Zhao, L.; Zhang, X. Concentration of heavy metals in vegetables and potential health risk assessment in China. Environ. Geochem. Health 2018, 40, 313. [Google Scholar] [CrossRef]
  73. EC 1881/2006. Commission regulation (EC) No 1881/2006 of 19 December 2006 setting maximum levels for certain contaminants in foodstuff. Off. J. Eur. Union 2006, 364, 5–24.
  74. Kumar, V.; Sharma, A.; Dhunna, G.; Chawla, A.; Bhardwaj, R.; Thukral, A.K. A tabulated review on distribution of heavy metals in various plants. Environ. Sci. Pollut. Res. 2017, 24, 2210–2260. [Google Scholar] [CrossRef]
  75. Marles, R.J. Mineral nutrient composition of vegetables, fruits and grains: The context of reports of apparent historical declines. J. Food Compos. Anal. 2017, 56, 93–103. [Google Scholar] [CrossRef]
  76. Kabata-Pendias, A. Trace Elements in Soils and Plants, 4th ed.; CRC Press, Taylor &Francis Group: Boca Raton, FL, USA, 2011. [Google Scholar]
  77. Jolly, Y.N.; Islam, A.; Akbar, S. Transfer of metals from soil to vegetables and possible health risk assessment. SpringerPlus 2013, 2, 385. [Google Scholar] [CrossRef] [PubMed]
  78. Balkhair, K.S.; Ashraf, M.A. Field accumulation risks of heavy metals in soil and vegetable crop irrigated with sewage water in western region of Saudi Arabia. Saudi J. Biol. Sci. 2016, 23, 32–44. [Google Scholar] [CrossRef] [PubMed]
  79. Yabanli, M.; Yozukmaz, A.; Sel, F. Heavy metal accumulation in the leaves, stem and root of the invasive submerged macrophyte Myriophyllum spicatum L. (Haloragaceae): An example of Kadin Creek (Mugla, Turkey). Braz. Arch. Biol. Technol. 2014, 57, 434–440. [Google Scholar] [CrossRef]
  80. Youssef, M.A.; Abd El-Gawad, A.M. Accumulation and translocation of heavy metals in eggplant (Solanum melongena L.) grown in a contaminated soil. J. Energy Environ. Chem. Eng. 2018, 3, 9–18. [Google Scholar] [CrossRef]
  81. Joint, FAO/WHO Expert Committee on Food Additives, and World Health Organization. Evaluation of Certain Food Additives and Contaminants. Thirty-Third Report of the Joint FAO/WHO Expert Committee on Food Additives; WHO Technical Report Series, No. 776; Joint FAO/WHO Expert Committee on Food Additives: Geneva, Switzerland, 1989. [Google Scholar]
  82. Joint, FAO/WHO Expert Committee on Food Additives, and World Health Organization. Summary and Conclusions of the Seventy Third Meeting of the Joint FAO/WHO Expert Committee on Food Additive; JECFA/73/SC; Joint FAO/WHO Expert Committee on Food Additives: Geneva, Switzerland, 2010. [Google Scholar]
  83. Baars, A.J.; Theelen, R.M.C.; Janssen, P.J.C.M.; Hesse, J.M.; van Apeldoorn, M.E.; Meijerink, M.C.M.; Verdam, L.; Zeilmaker, M.J. Re-Evaluation of Human-Toxicological Maximum Permissible Risk Levels. RIVM Report 711701 025; National Institute of Public Health and the Environment: Bilthoven, The Netherlands, 2001. [Google Scholar]
  84. Joint, FAO/WHO Expert Committee on Food Additives, and World Health Organization. Food Additives and Contaminants. Codex Alimentarius Commission. Joint FAO/WHO Food Standards Program, ALI-NORM01/12A; Joint FAO/WHO Expert Committee on Food Additives: The Hague, The Netherlands, 2001. [Google Scholar]
  85. Joint, FAO/WHO Expert Committee on Food Additives, and World Health Organization. Safety Evaluation of Certain Contaminants in Food. Prepared by the Seventy-Second Meeting of the Joint FAO/WHO Expert Committee on Food Additives (JECFA). Mercury (Addendum); Food and Agriculture Organization of the United Nations: Rome, Italy; Joint FAO/WHO Expert Committee on Food Additives: Geneva, Switzerland, 2011. [Google Scholar]
  86. WHO. Guideline for Drinking Water Quality, Third Edition, Incorporating First and Second Addenda. Volume 1 Recommendations; World Health Organization: Geneva, Switzerland, 2008. [Google Scholar]
  87. Sander, S.; Kappenstein, O.; Ebner, I.; Fritsch, K.A.; Schmidt, R.; Pfaff, K.; Luch, A. Release of aluminium and thallium ions from uncoated food contact materials made of aluminium alloys into food and food simulant. PLoS ONE 2018. [Google Scholar] [CrossRef]
  88. Dzwonkowski, W. Evolution of potato production in Poland and the EU. Scientific Journals of the Warsaw University of Life Sciences in Warsaw. Probl. World Agric. 2017, 17, 71–80. [Google Scholar]
  89. Regulation of the Minister of the Environment of 1 September 2016 on the conduct of the assessment of contamination of the surface of the earth. J. Lows 2016, 1396, 1–86.
Figure 1. Vegetable sampling site locations in the Regions of southern Poland (modified from [22]).
Ijerph 16 04053 g001
Figure 2. Soil-to-plant transfer indices for the analyzed groups of vegetables: (a) BAtotal—bioaccumulation coefficient, total PHE content, (b) BCF1—bioconcentration coefficient, PHE content of the F1 fraction of the BCR sequential extraction, (c) BCEDTA—bioconcentration coefficient, PHE content of 0.05 mol/L of the Na2EDTA extraction.
Ijerph 16 04053 g002aIjerph 16 04053 g002b
Figure 3. The HQ values of PHEs caused by vegetable ingestion.
Ijerph 16 04053 g003aIjerph 16 04053 g003bIjerph 16 04053 g003c
Figure 4. Carcinogenic risk (CR) values for As caused by vegetable ingestion.
Ijerph 16 04053 g004
Table 1. Description of the vegetables investigated in this study.
No.Common NameBotanical NameNumber of Samples (n)Edible Part
1.Beet rootBeta vulgaris11root
2.CarrotDaucus carota7root
3.Celery rootApium graveolens8root
4.HorseradishArmoracia rusticana4root
5.Parsley rootPetroselinum hortense5root
6.RadishRaphanus sativus var. sativus4root
7.TurnipBrassica rapa2root
8.GarlicAllium sativum5tuber
9.KohlrabiBrassica oleracea var. gongylodes8tuber
10.OnionAllium cepa9tuber
11.PotatoSolanum tuberosum5tuber
12.ArugulaEruca sativa3leaf
13.Beet topsBeta vulgaris8leaf
14.CabbageBrassica oleracea var. capitata f. alba5leaf
15.Celery topsApium graveolens7leaf
16.ChivesAllium schoenoprasum9leaf
17.KaleBrassica oleracea var. sabellica3leaf
18.LeekAllium porrum6leaf
19.LettuceLactuca sativa8leaf
20.LovageLevisticum officinale4leaf
21.Parsley topsPetroselinum hortense8leaf
22.RhubarbRheum rhaponticum8leaf
23.SpinachSpinacia oleracea5leaf
24.BroccoliBrassica oleracea5inflorescence
25.CauliflowerBrassica oleracea var. botrytis5inflorescence
26.ZucchiniCucurbita pepo convar. giromontiina Greb6fruit
27.PumpkinCucurbita pepo4fruit
28.CucumberCucumis sativus6fruit
29.Sweet pepperCapsicum annuum4fruit
30.TomatoLycopersicon esculentum6fruit
31.AsparagusAsparagus officinalis2shoot
32.Green beanPhaseolus vulgaris7legume
33.Broad beanVicia faba5seed
34.Kidney beanPhaseolus vulgaris4seed
35.PeaPisum sativum4seed
36.Pumpkin seedsCucurbita pepo6seed
Table 2. Intake rates (IR) (g ww./person-day) of the consumed groups of vegetables.
IR (g ww./Person-Day)
Vegetable PartAdult PLAdult USEPAChild USEPA
root23.37738.4
tuber289.512.63.45
leaf15.67.18.1
inflorescence5.756.33.3
fruit4584.732.7
shootnd1.40.3
legumend149.75
seednd23.824.6
nd—not defined.
Table 3. Concentrations of potentially harmful elements (PHEs) (mg/kg ww.) in the groups of vegetables.
PHEStatistical Parameters
mg/kg ww.
Root
(n = 41)
Tuber
(n = 27)
Leaf
(n = 74)
Inflorescence
(n = 10)
Fruit
(n = 29)
Shoot
(n = 2)
Legume
(n = 7)
Seed
(n = 19)
AsminndndndNDNDNDNDND
mean ± SD0.021 ± 0.0040.002 ± 0.0010.009 ± 0.006
max0.0560.0090.028
P950.0480.0070.023
>LOD (%)27.212.725.60.000.000.000.000.00
CdminndndndndndNDndND
mean ± SD0.107 ± 0.0120.046 ± 0.0140.162 ± 0.0160.017 ± 0.0080.012 ± 0.0050.038 ± 0.005
max0.3750.1190.5560.0310.0220.144
P950.3110.1070.4530.0290.0210.135
>LOD (%)88.686.097.690.080.20.0071.40.00
MAC0.100.100.200.050.050.050.050.05
CominndndndndNDNDndnd
mean ± SD0.005 ± 0.0030.004 ± 0.0030.007 ± 0.0020.002 ± 0.0010.006 ± 0.0020.004 ± 0.002
max0.0290.0120.0170.0050.0270.022
P950.0190.0100.0150.0040.0240.017
>LOD (%)15.030.046.030.00.000.0057.136.7
Cuminnd0.126nd0.1510.0420.2340.1280.299
mean ± SD0.698 ± 0.0770.712 ± 0.0640.744 ± 0.0680.339 ± 0.0590.303 ± 0.0850.282 ± 0.0141.582 ± 0.0723.373 ± 0.163
max1.8941.7681.7110.6500.6200.3307.6385.403
P951.6301.4621.3830.5910.5740.2825.6925.264
>LOD (%)92.1100.095.8100.0100.0100.0100.0100.0
HgminndndndNDNDNDndND
mean ± SD0.019 ± 0.0090.009 ± 0.0070.018 ± 0.0050.021 ±0.018
max0.1010.0290.1630.147
P950.0720.0250.1400.103
>LOD (%)36.431.744.70.000.000.0014.30.00
MAC0.020.020.020.020.020.020.020.02
Nimin0.073ndNDNDNDNDNDND
mean ± SD0.130 ± 0.0560.038 ± 0.022
max0.2990.186
P950.2640.149
>LOD (%)4.2010.50.000.000.000.000.000.00
Pbminndnd0.001NDndndndnd
mean ± SD0.063 ± 0.0110.079 ± 0.0100.094 ± 0.0130.030 ± 0.0080.036 ± 0.0100.093 ± 0.0060.019 ± 0.009
max0.3330.3120.3400.0870.0410.5800.070
P950.2480.2620.2780.0790.0360.4200.059
>LOD (%)38.043.269.20.0040.250.057.128.7
MAC0.100.100.300.100.100.100.100.10
Sbminndndndndndndndnd
mean ± SD0.007 ± 0.0040.053 ± 0.0120.018 ± 0.0040.015 ± 0.0080.008 ± 0.0020.013 ± 0.0060.031 ± 0.0040.026 ± 0.006
max0.0710.1630.0860.0710.0830.0020.1160.097
P950.0680.1420.0810.0580.0810.0130.1070.082
>LOD (%)38.844.555.540.031.650.042.930.0
TlminndndndndNDNDndnd
mean ± SD0.055 ± 0.0010.003 ± 0.0010.031 ± 0.0020.008 ± 0.0020.002 ± 0.0010.001 ± 0.000
max0.4520.0080.1150.0170.0140.002
P950.4080.0070.0960.0150.0100.001
>LOD (%)43.138.553.760.00.000.0028.612.5
Znmin2.222.504.512.641.233.932.5210.5
mean ± SD6.72 ± 1.244.36 ± 0.919.46 ± 1.25 3.72 ± 1.251.85 ± 0.754.89 ± 1.083.94 ± 0.9018.8 ± 1.29
max16.26.7716.45.052.585.865.6434.9
P9514.26.3615.34.882.464.895.4632.0
>LOD (%)100.0100.0100.0100.0100.0100.0100.0100.0
ww. wet weight; P95: 95th percentile; nd: <LOD; ND: <LOD in all analyzed samples; MAC: maximum allowable concentration [73]; LOD: limit of detection.
Table 4. Factor loading results obtained from the principal components analysis (PCA).
PHEsVarimax Rotated
PC1PC2PC3PC4
As0.7160.1120.5860.041
Cd0.6460.106−0.0550.512
Co0.8710.251−0.1290.084
Cu0.0950.9720.0000.010
Hg0.9260.0210.1020.094
Ni−0.1030.0120.902−0.042
Pb0.5580.1610.1540.656
Sb0.0220.109−0.0110.908
Tl0.5940.2370.6390.249
Zn0.1970.9070.1490.267
Eigenvalues4.571.521.411.02
Explained variance %32.719.516.416.7
Cumulative variance %32.752.268.685.3
Factor loadings exceeding 0.5 are shown in bold.
Table 5. Margin of exposure (MOE) values for Pb caused by vegetable ingestion.
Vegetable Intake ScenarioMOE
(Mean Exposure)
MOE
(P95 Exposure)
Adult PL3.10.9
Adult USEPA7.72.2
Child USEPA1.60.4
P95 95th percentile. PL—Polish statistical data, USEPA—United States Environmental Protection Agency.

