Assessment of Groundwater Quality and Human Health Risk (HHR) Evaluation of Nitrate in the Central-Western Guanzhong Basin, China


Abstract
:1. Introduction
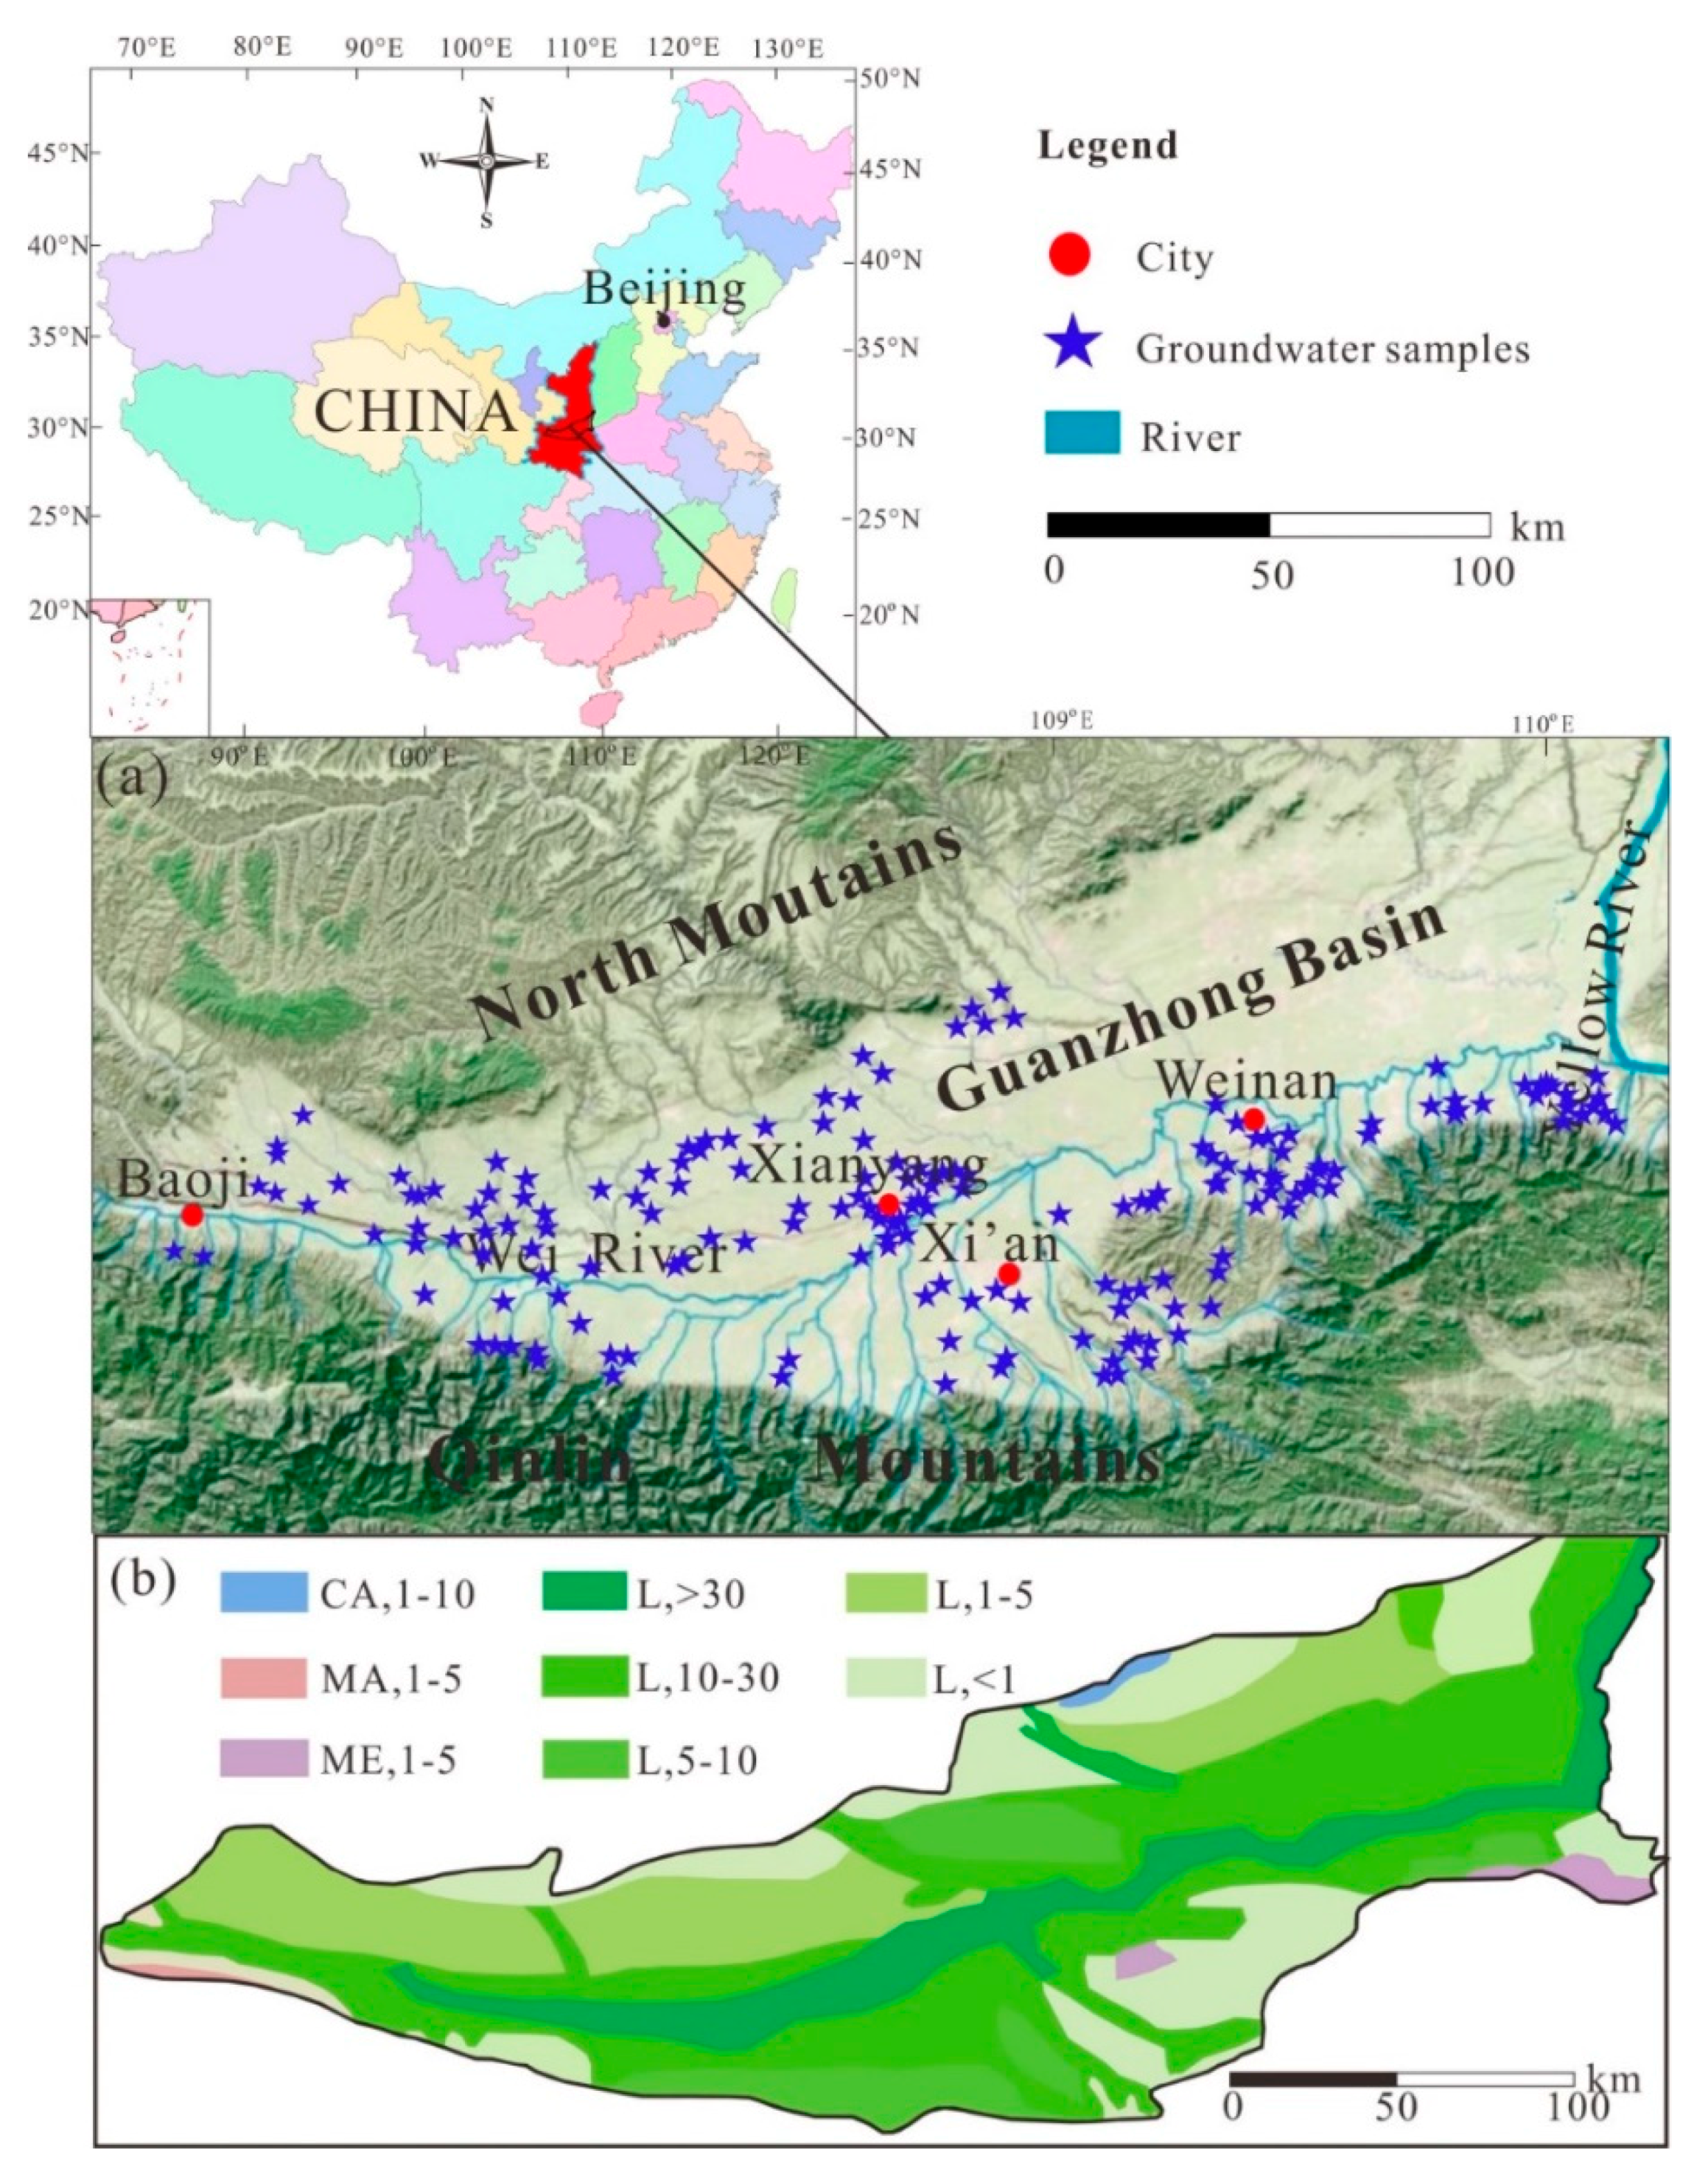
2. Study Area
3. Materials and Methods
3.1. Sample Collection and Analysis
3.2. Water Quality Index (WQI)
3.3. Human Health Risk (HHR) Assessment via Water Pathway
4. Results and Discussion
4.1. Groundwater Chemistry
4.1.1. Physiochemical Parameters
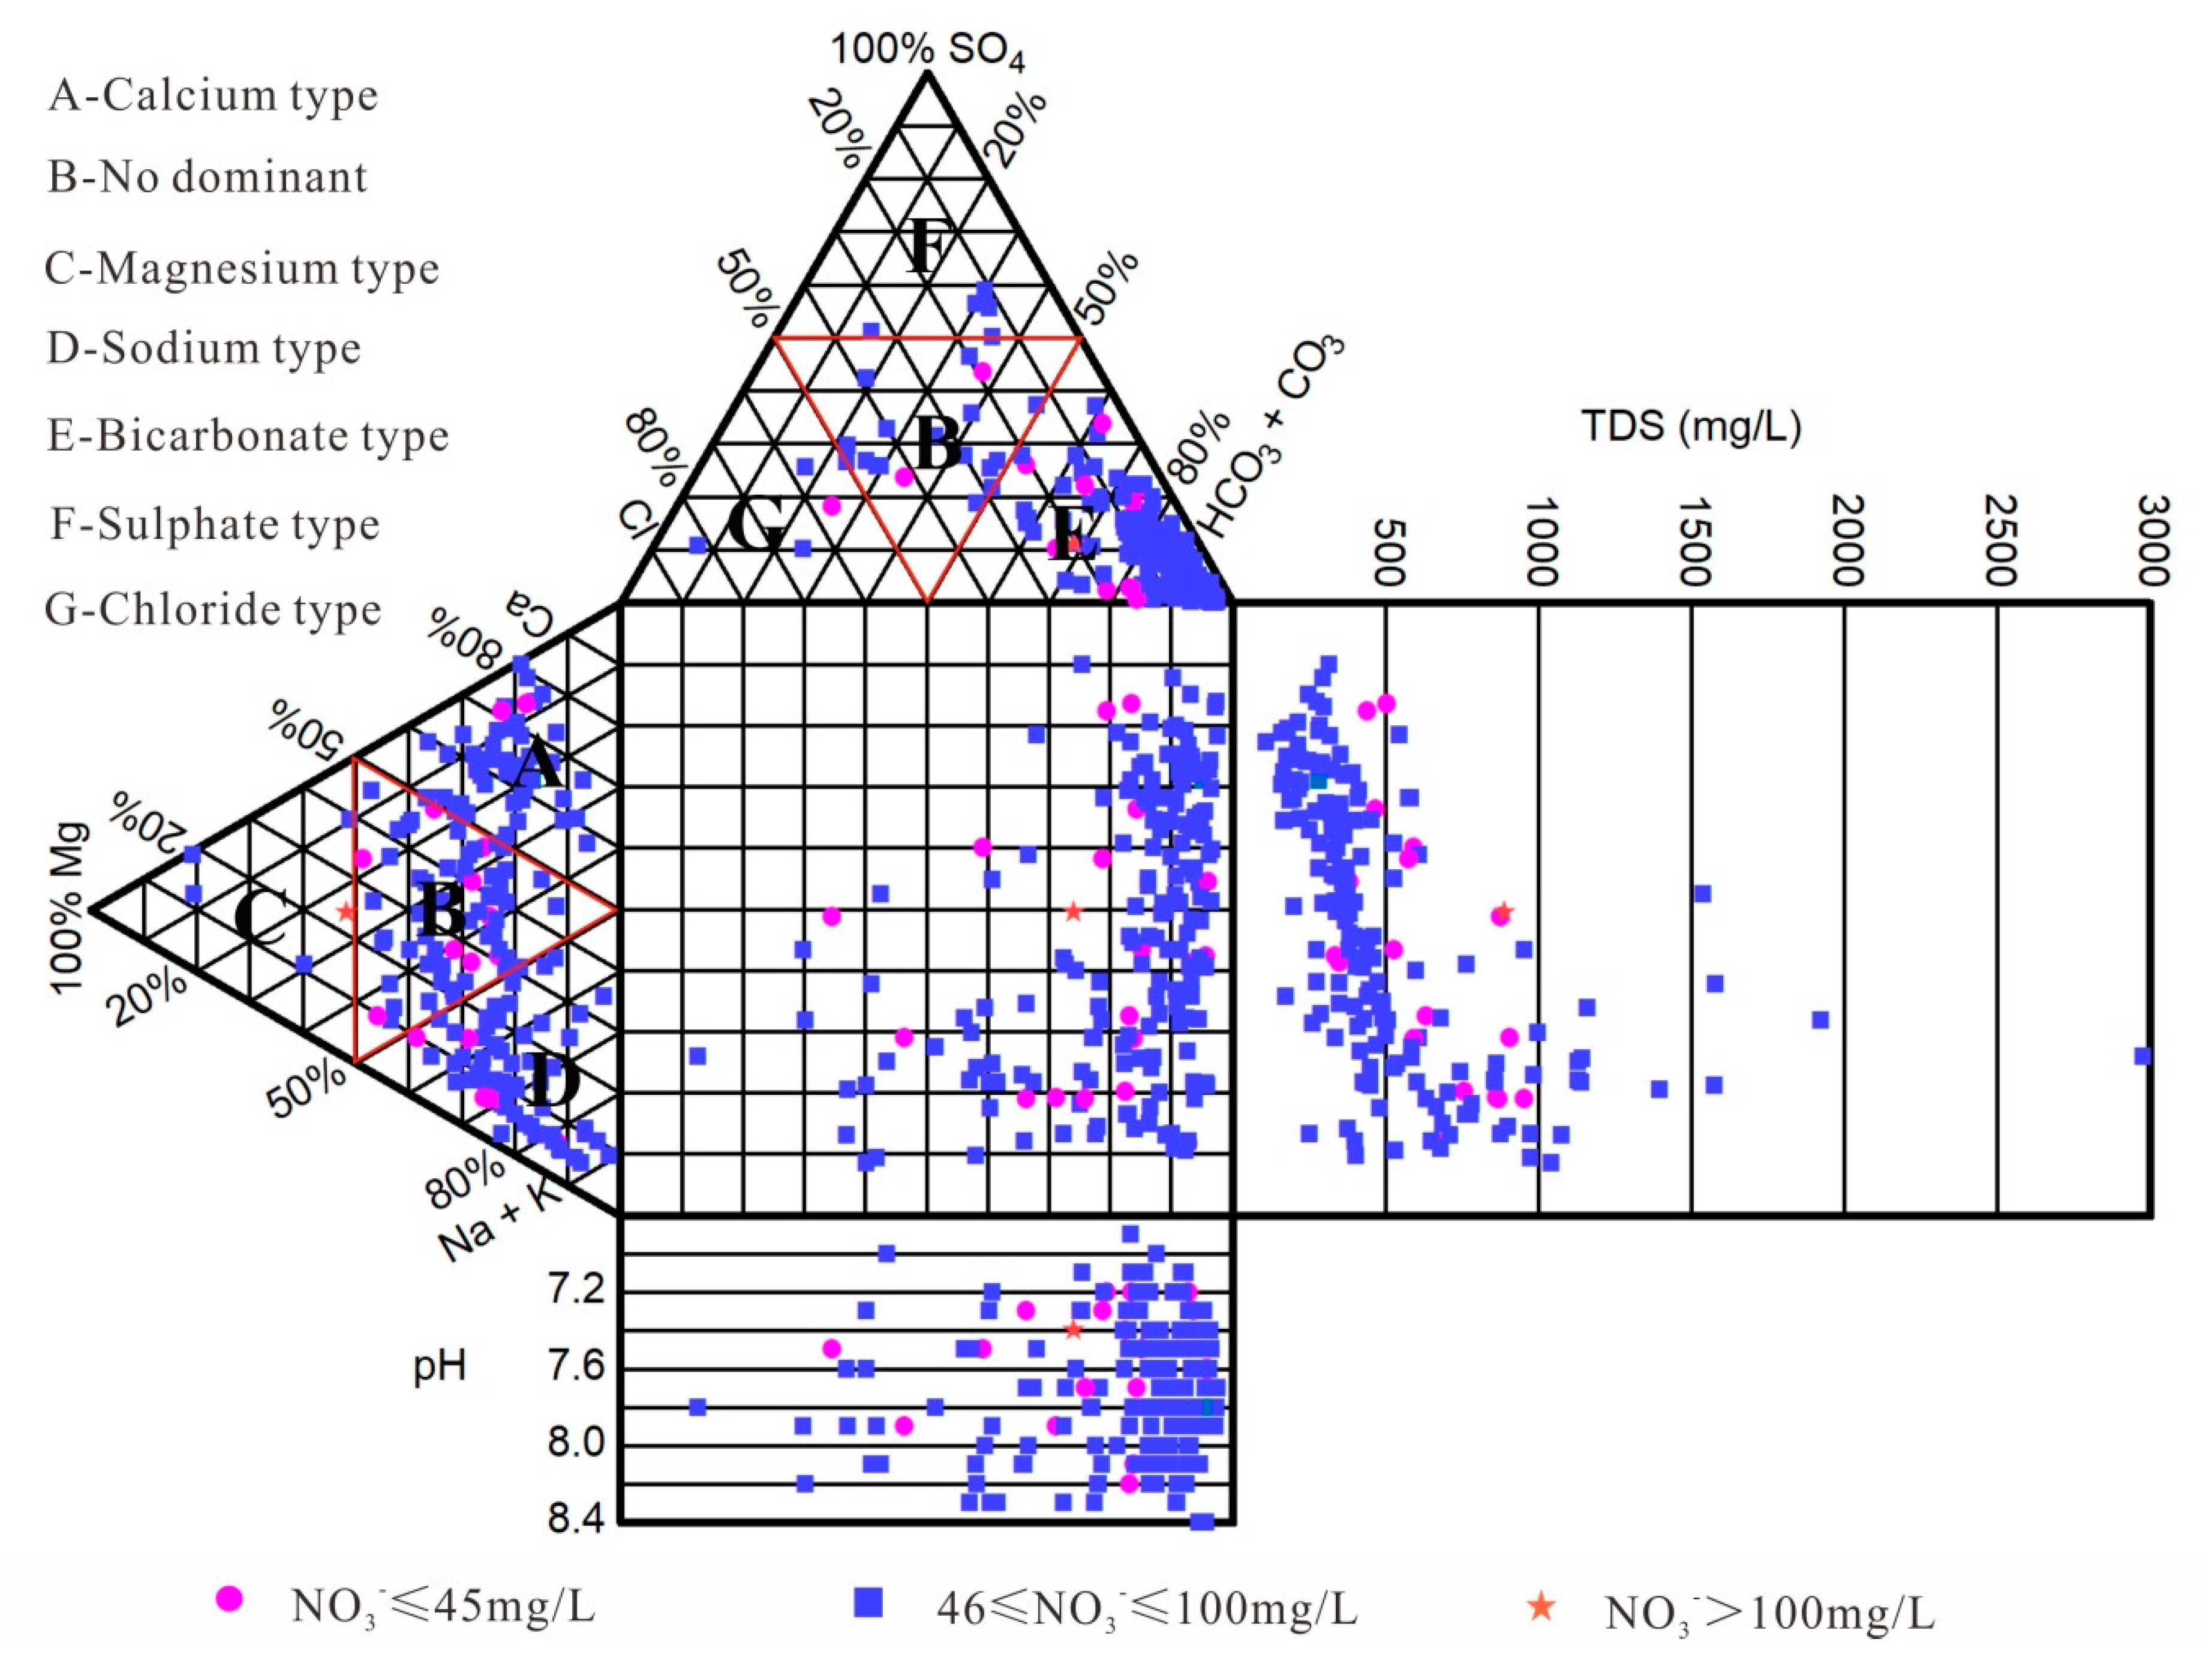
4.1.2. Hydrochemical Types of Groundwater
4.1.3. Mechanisms of Hydrogeochemistry
4.2. Groundwater Quality for Drinking
4.3. Distribution and Occurrence of Nitrate
4.4. Evaluation of Human Health Risk (HHR)
4.5. Sustainable Groundwater Quality Management
- The use of large-scale fertilizers has resulted in nitrogen pollution in the study area, so reducing the use of fertilizers, such as using organic fertilizers, is crucial for reducing nitrogen pollution.
- Since industrial ammonia nitrogen emissions are one of the main sources of nitrogen pollution in the study area, effective treatment of industrial ammonia nitrogen after discharge is necessary, such as industrial nitrogen fixation.
- Additionally, strengthening scientific research, improving the monitoring network, and enhancing cooperation and data sharing are important and necessary for ensuring the sustainable development of groundwater [52].
- In this paper, regrettably, surface water samples were not obtained, so there is no comparative analysis of the relationship and changes between surface water quality and groundwater quality, and it is hoped that supplementary research can be carried out in the future.
5. Conclusions
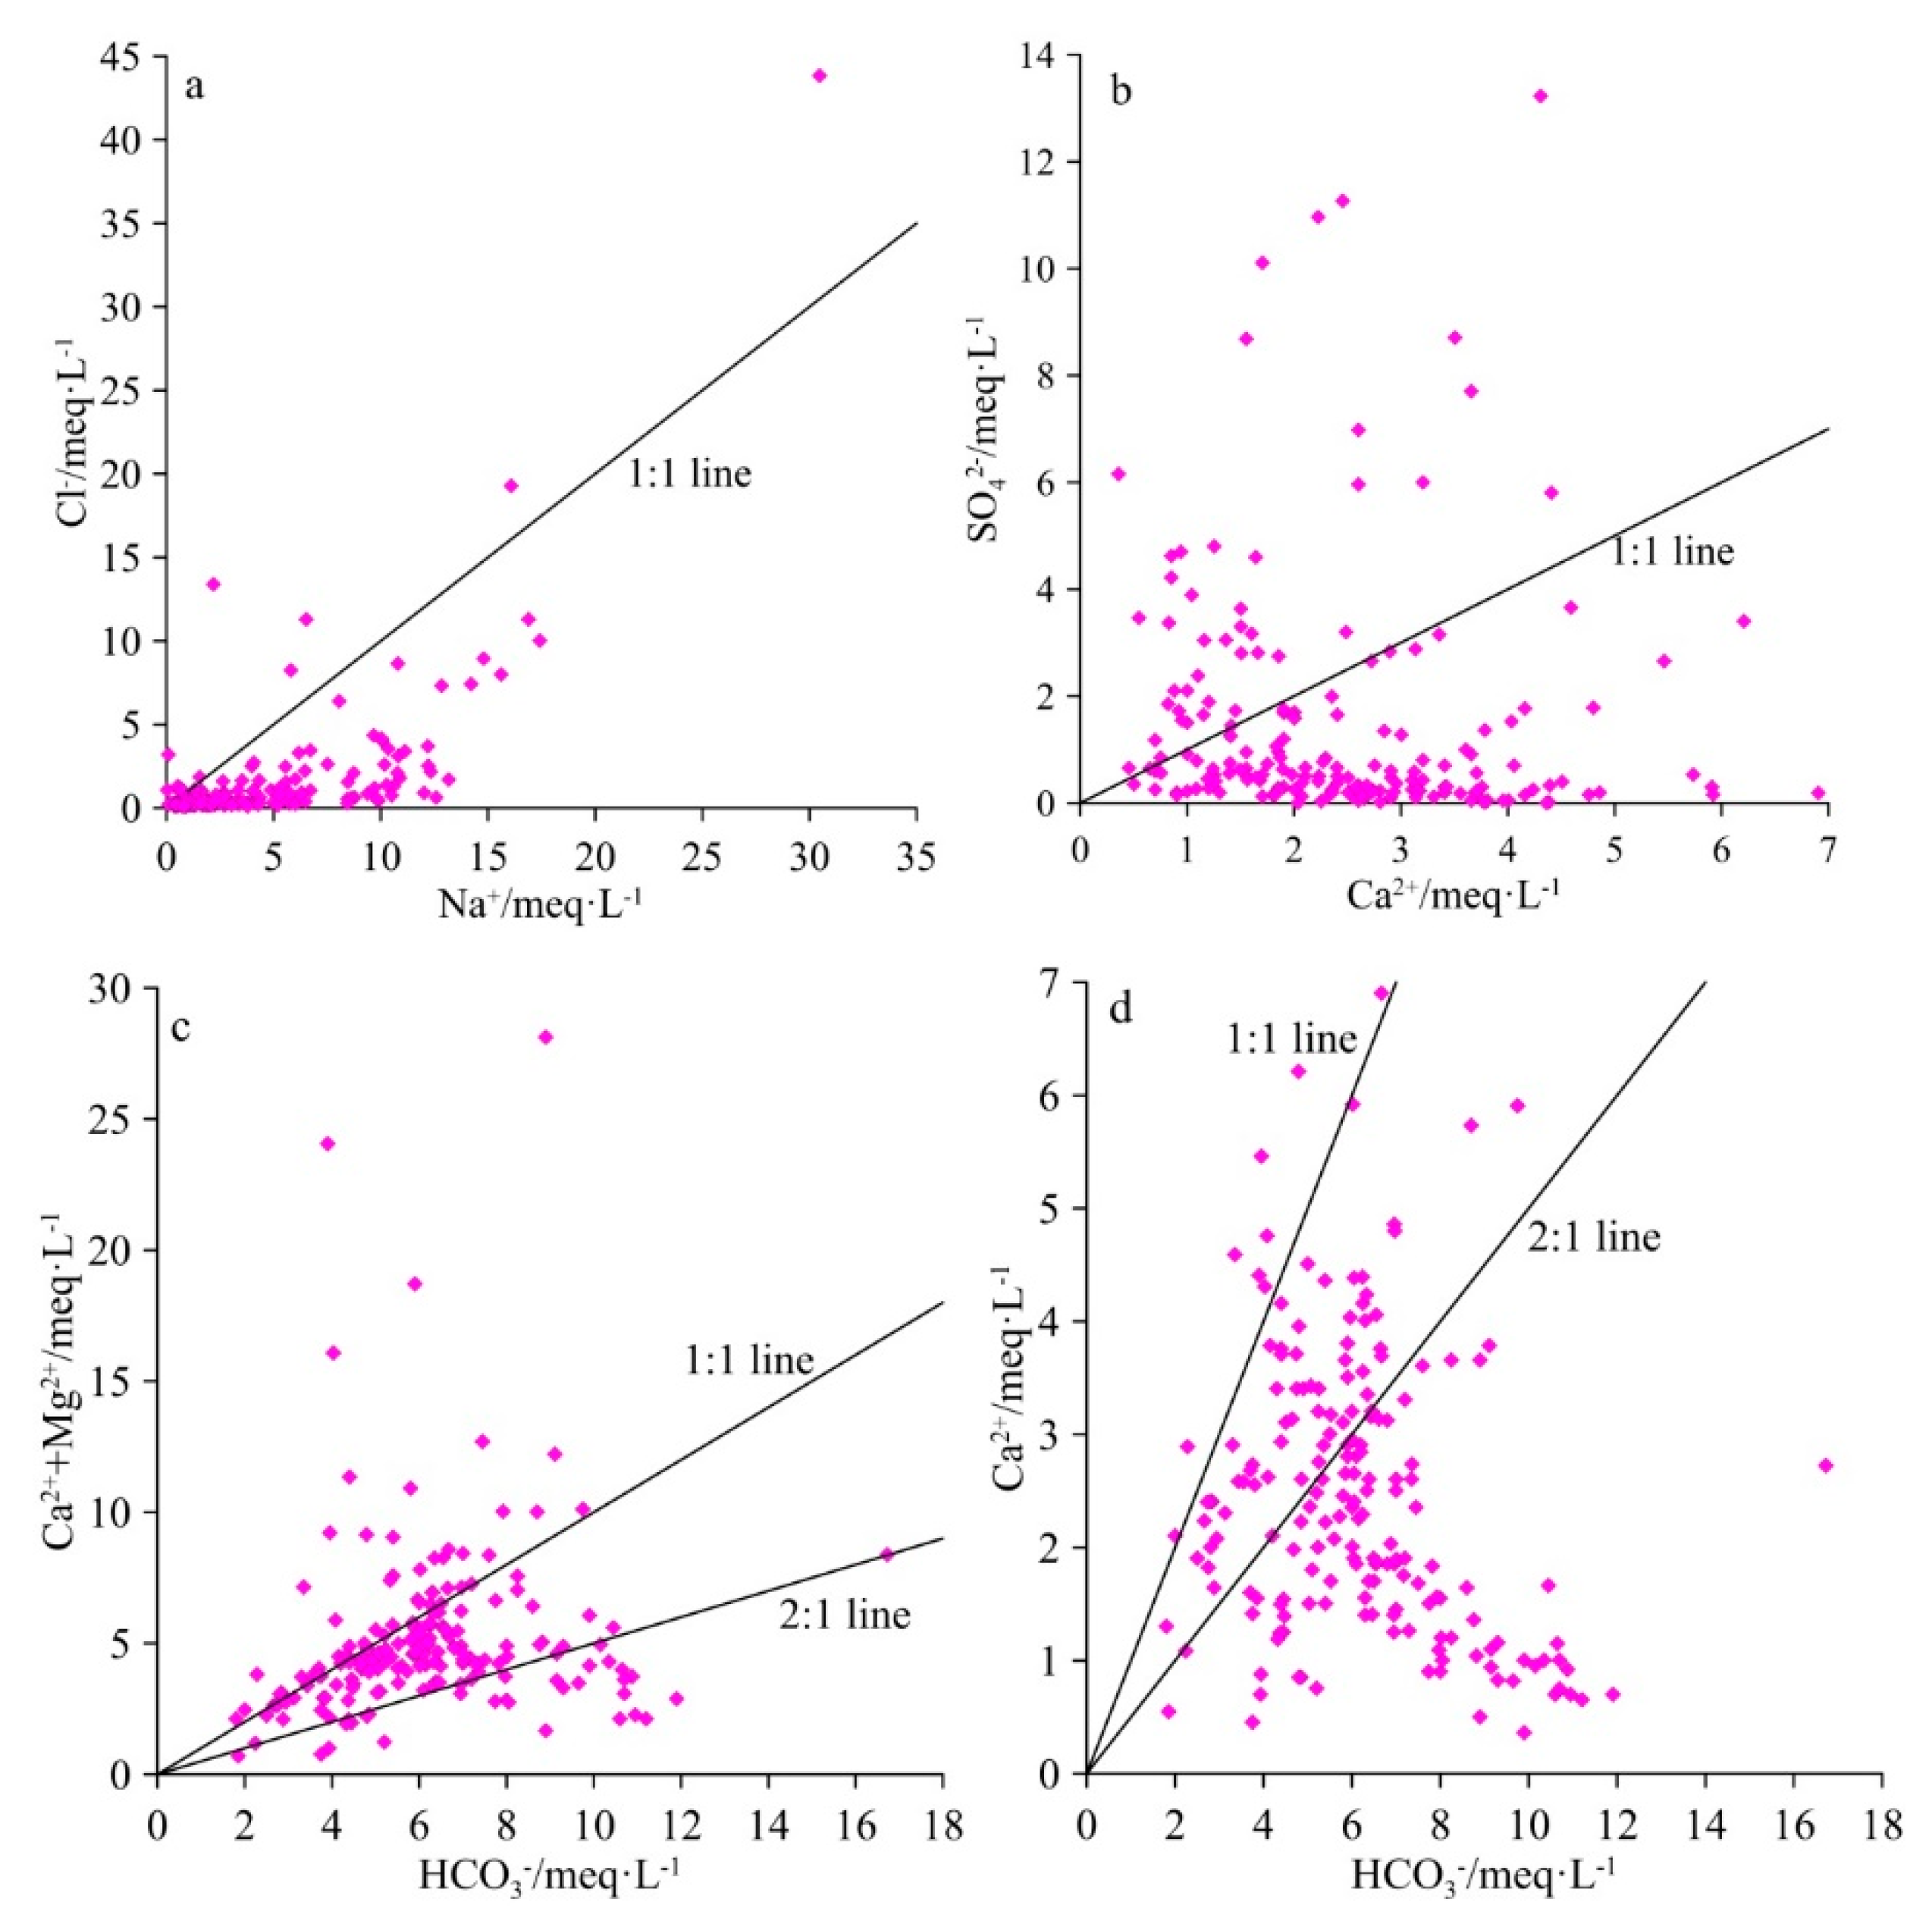
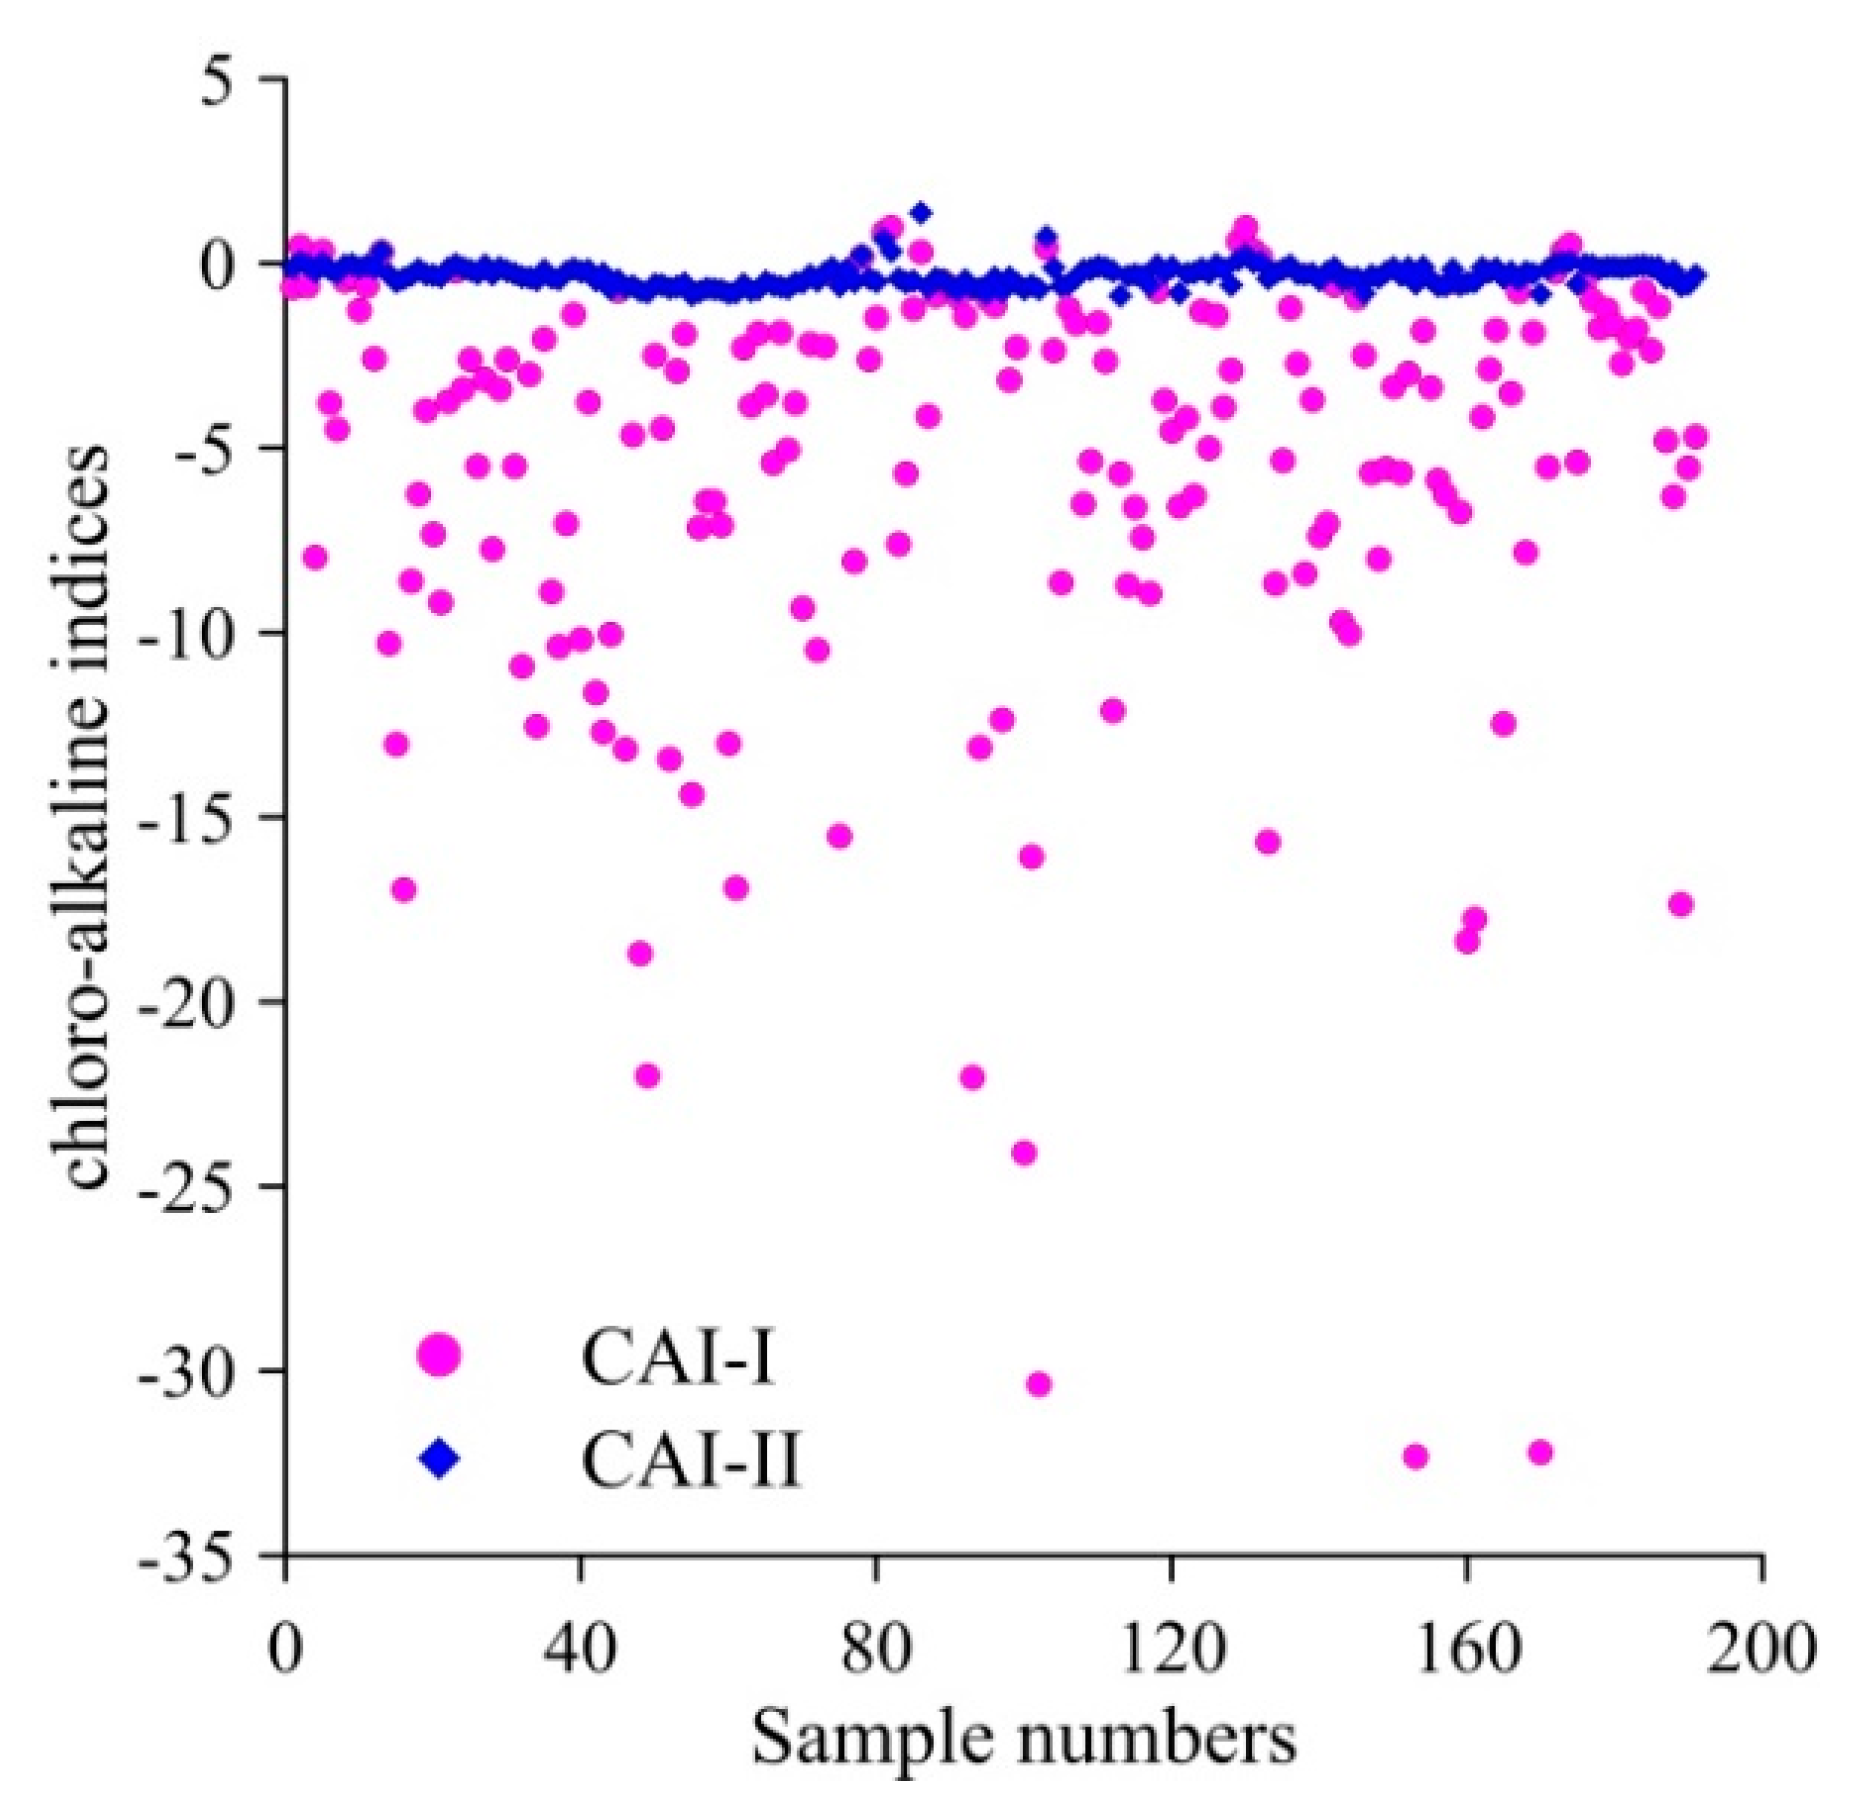
- HCO3-Na and HCO3-Ca species were the dominant hydrochemical facies in the groundwater samples in the study region. Bivariate diagrams and chloro-alkaline indices were used to study the hydrogeochemistry mechanisms. The results showed that halite dissolution, the weathering of silicate minerals, and ion exchange were the major sources responsible for Na+ abundance. Gypsum weathering and dolomite dissolution were the major processes controlling the Ca2+ concentration, while dolomite dissolution was the primary source of Mg2+. Moreover, ion exchange between Ca2+ or Mg2+ in the groundwater with Na+ and K+ in the rocks or soil may have occurred in the groundwater of the study region.
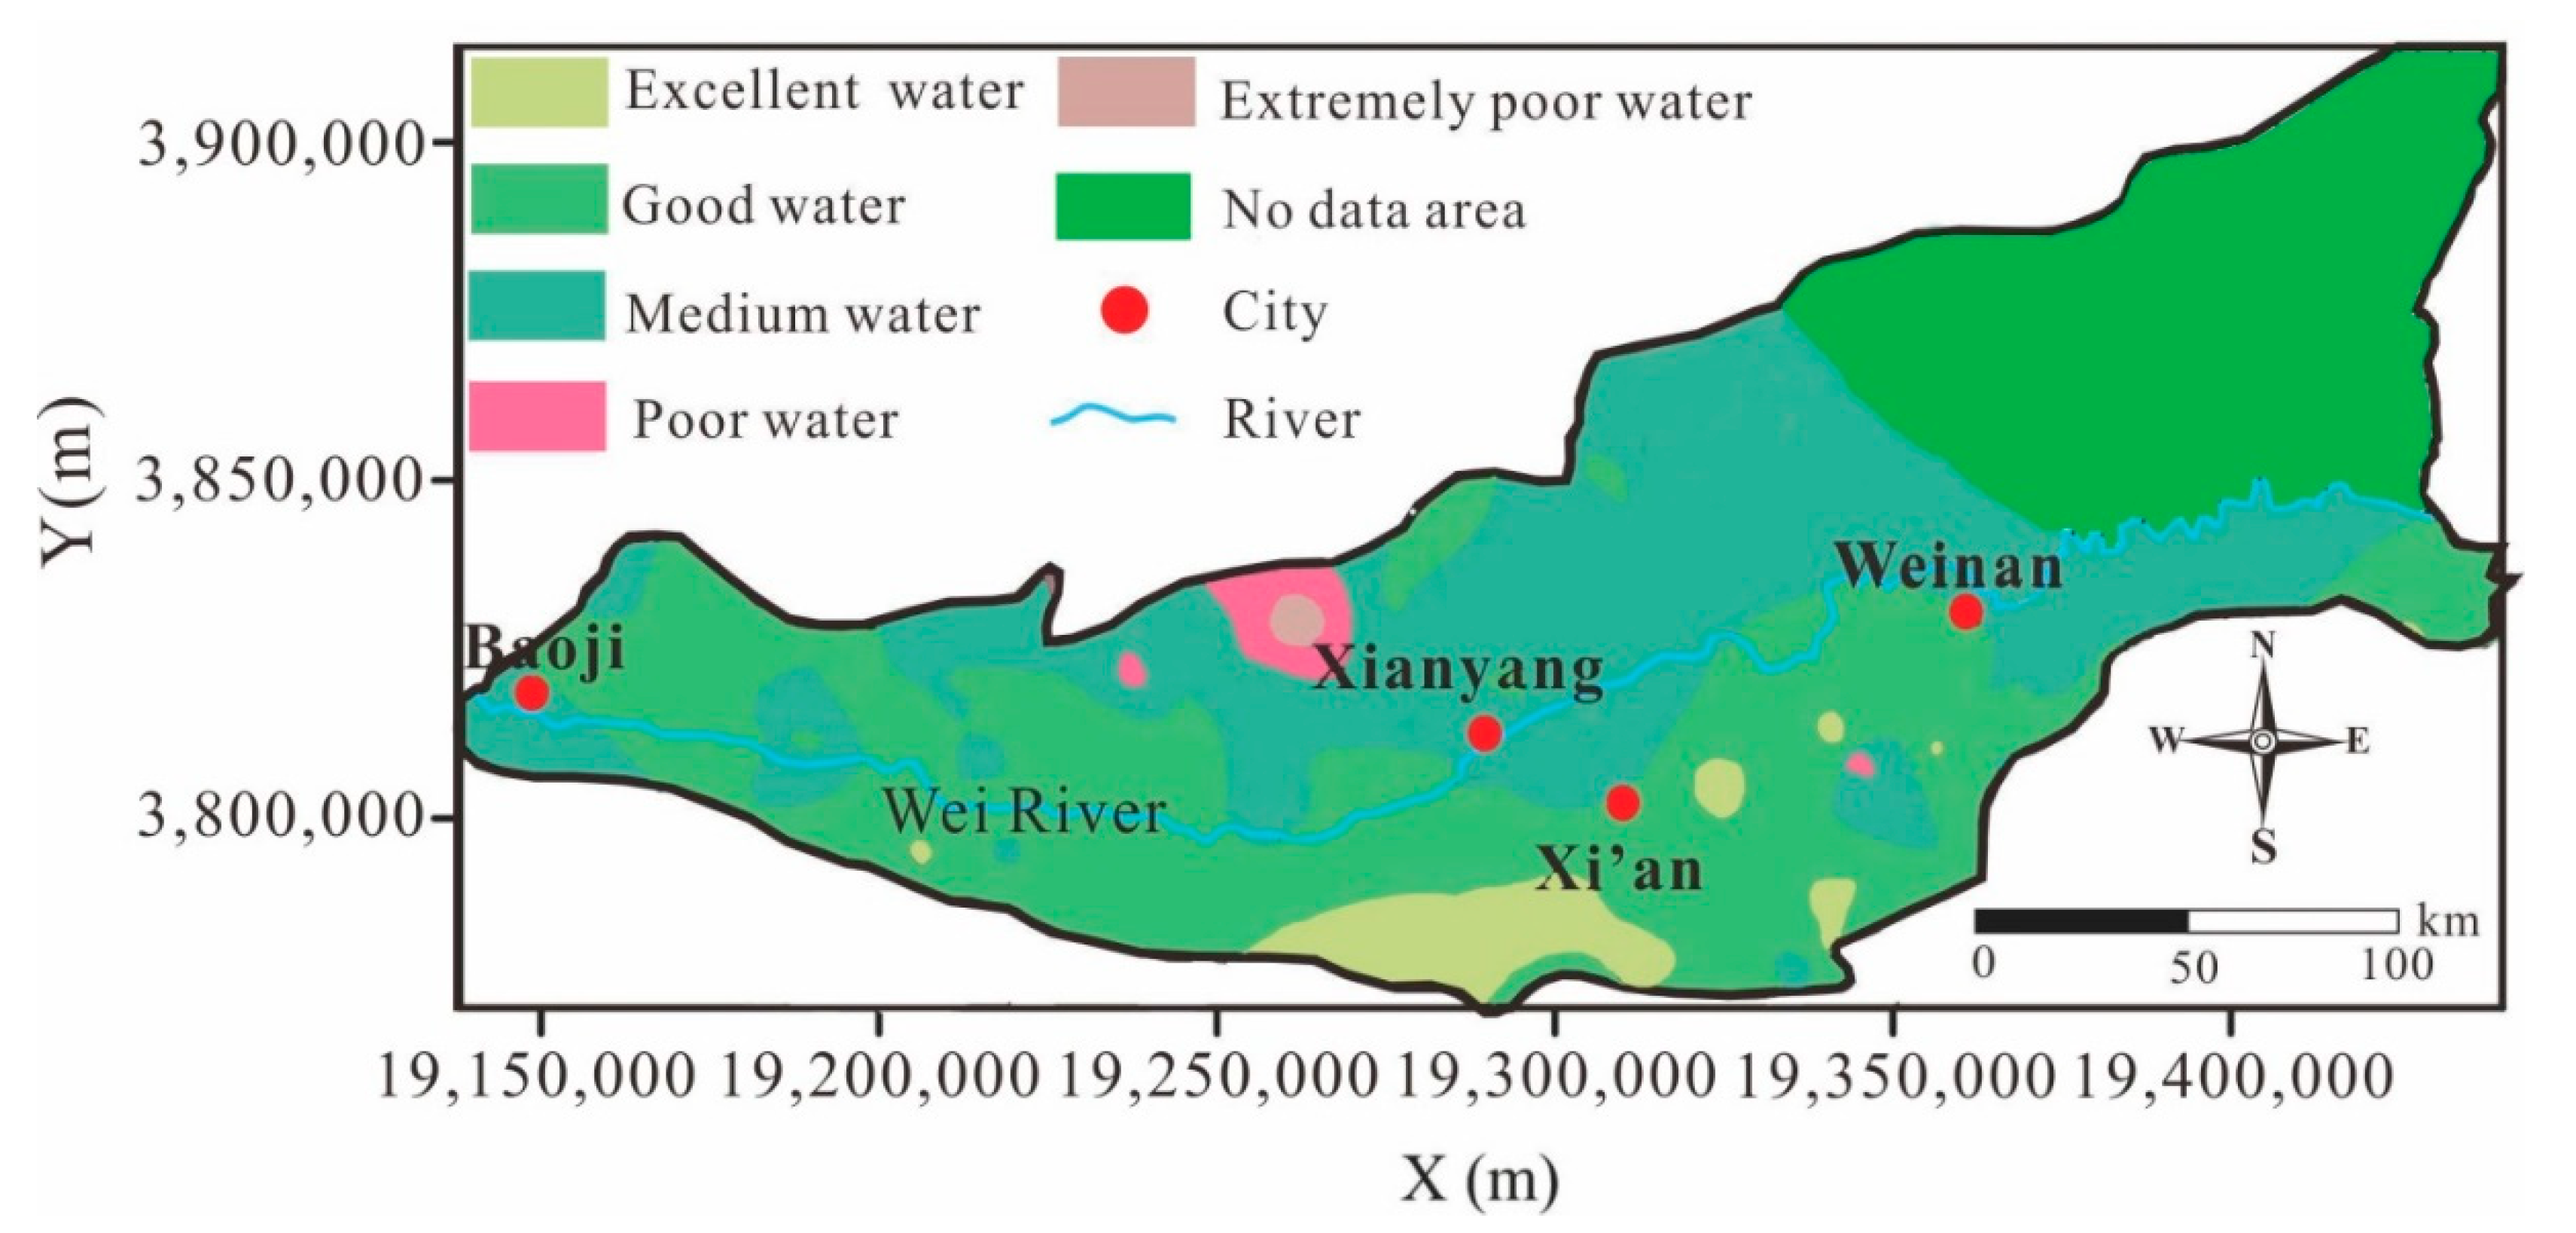
- The groundwater in the Guanzhong Basin predominantly contains good and medium-quality water. The good water was mainly distributed in the area south of the Wei River, while the medium-quality water was mainly distributed in the area north of the Wei River. Very little poor water or extremely poor water was found in the northwest of Xianyang City, and some excellent water was scattered throughout the area south of the Wei River. Generally, the groundwater in the area south of the Wei River was better than that in the area north of the Wei River.
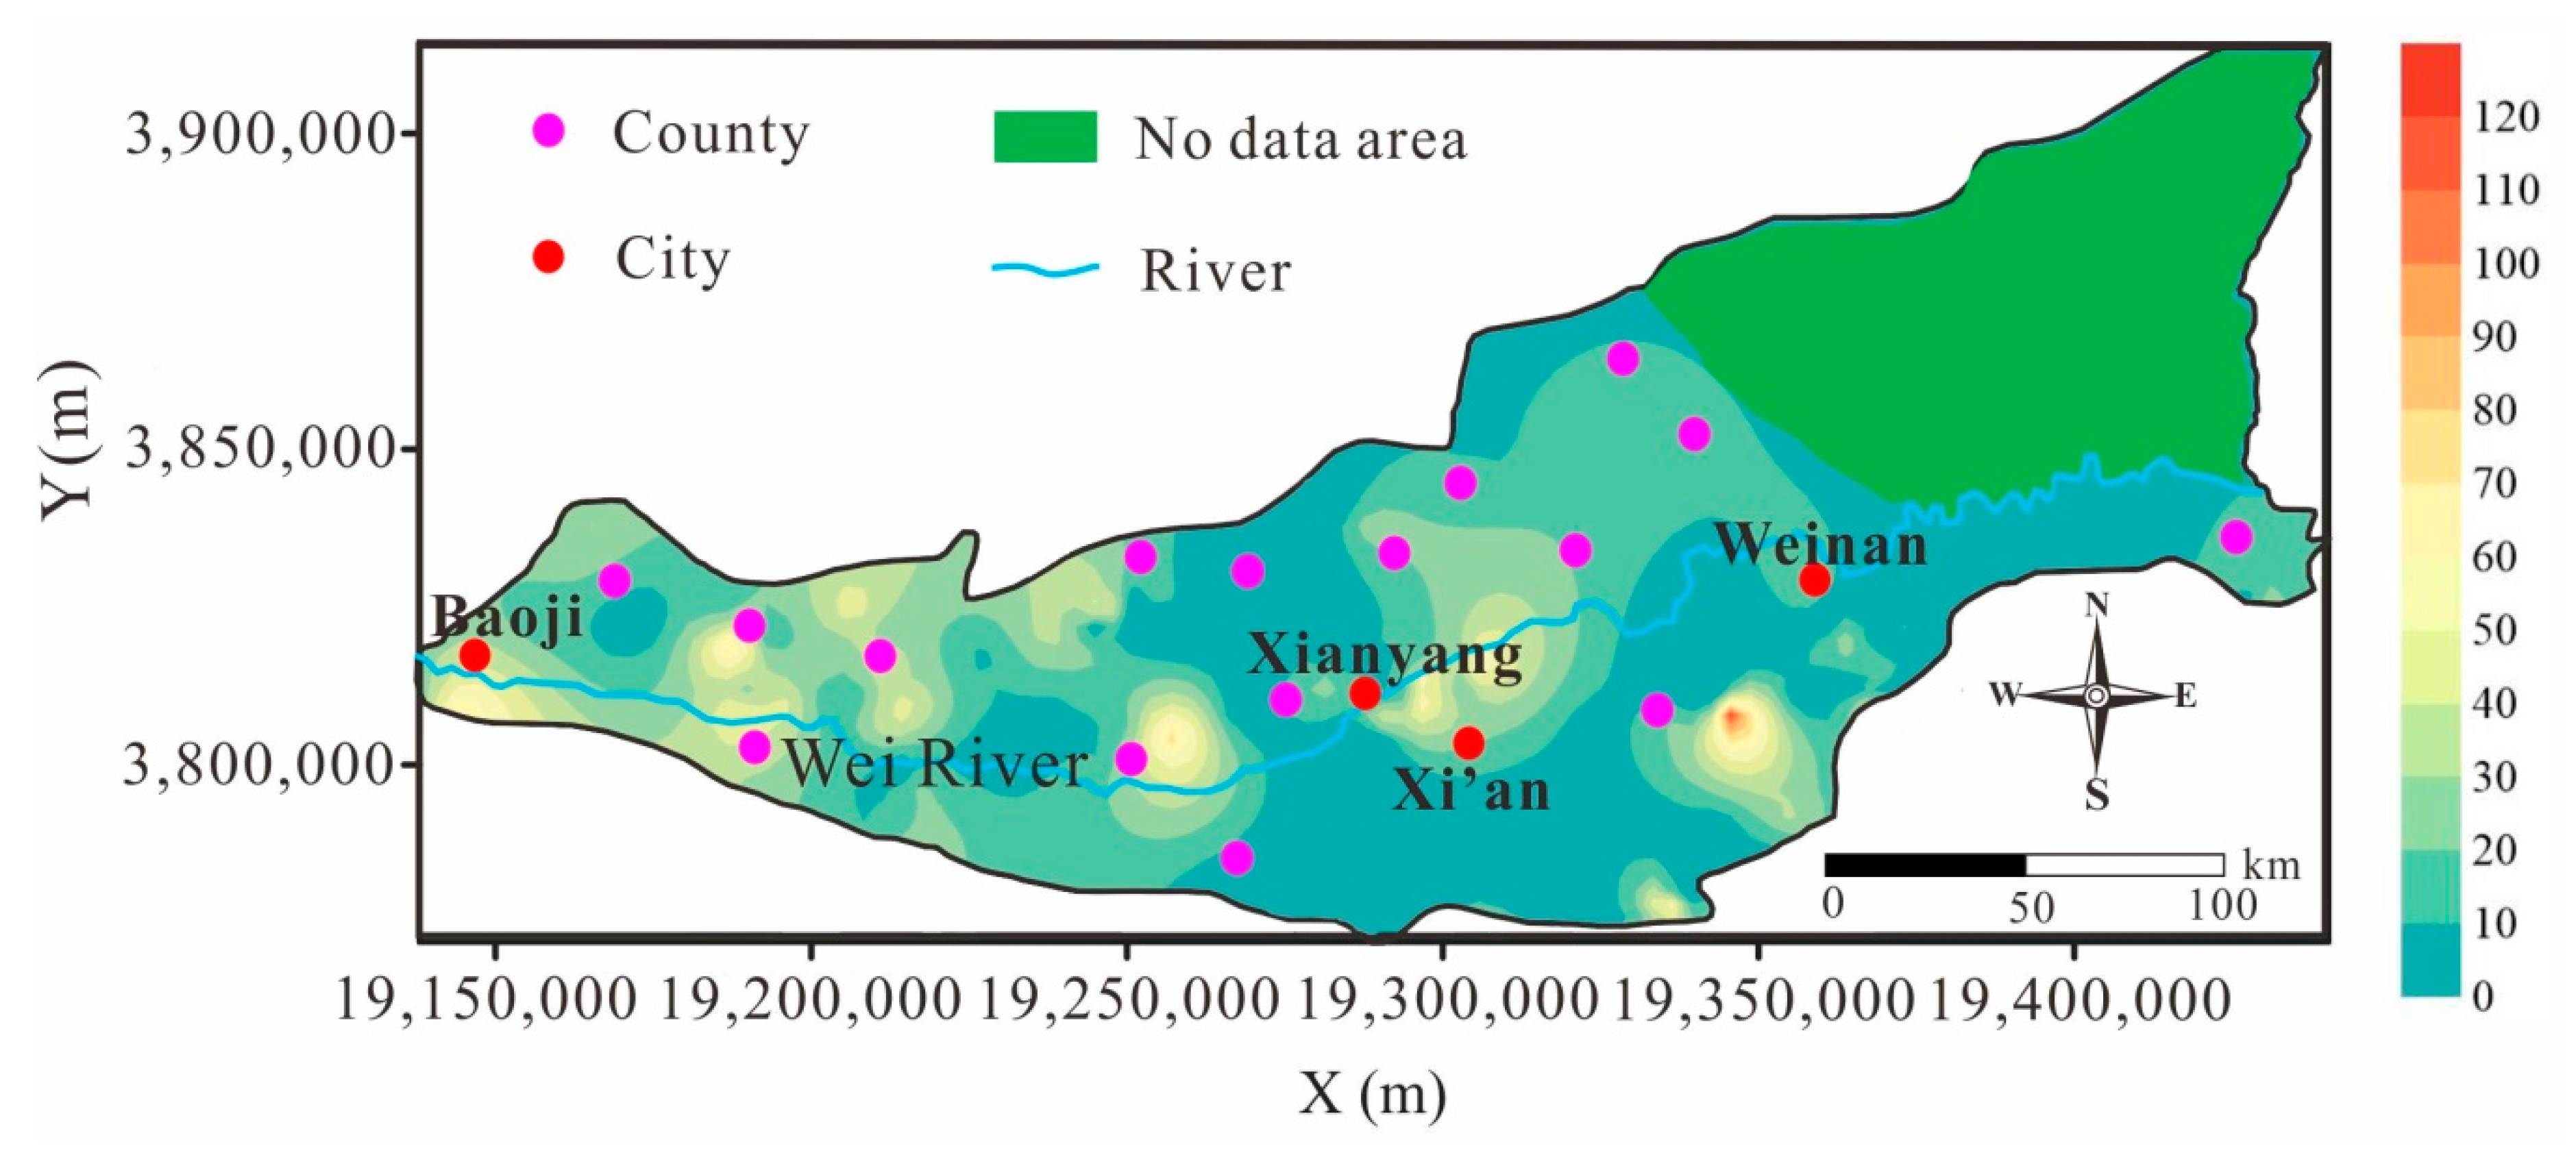
- High nitrate areas were mainly distributed in the area north of the Wei River. The nitrate contamination potentially originated from a large number of human activities, such as the extensive use of fertilizers, manures, and insecticide in agriculture, septic tank leakage, and organic matter effluent. Moreover, industrial ammonia nitrogen also played a role in the pollution of nitrate contamination in Guanzhong. Additionally, the percentages of low risk (<45 mg/L), high risk (45–100 mg/L), and very high risk for nitrate pollution (>100 mg/L) were 90.58%, 8.9%, and 0.52%, respectively.
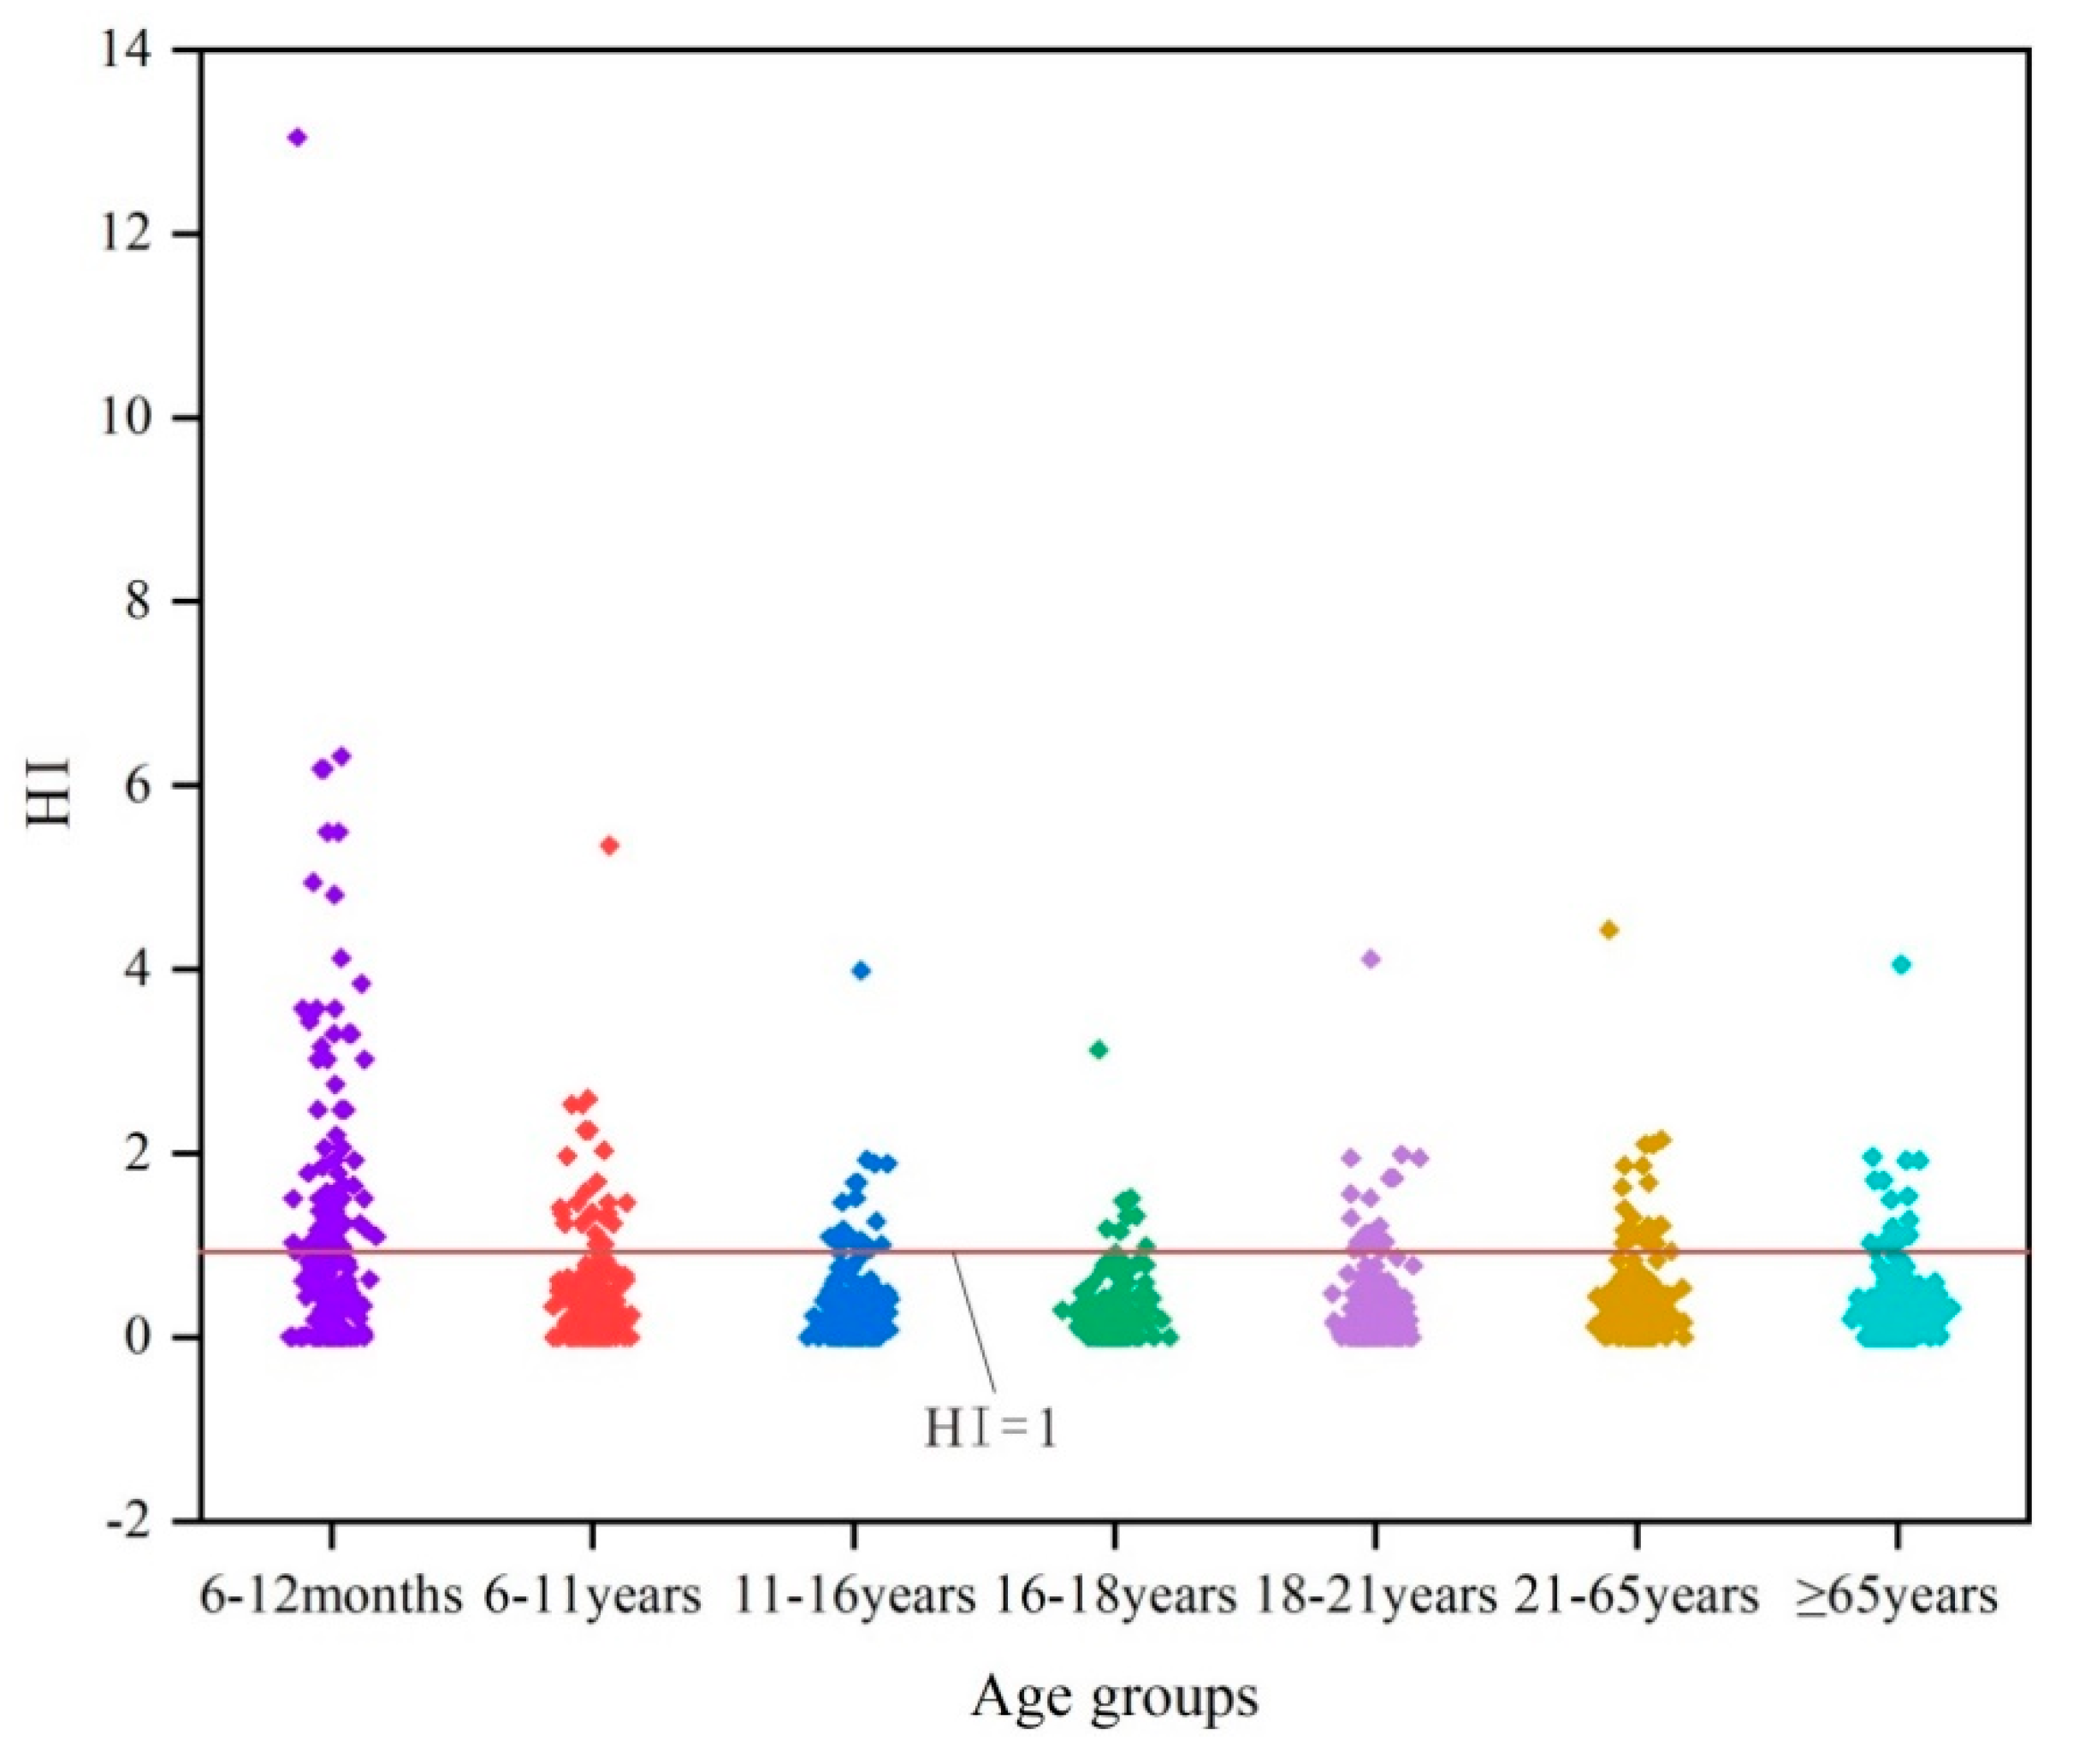
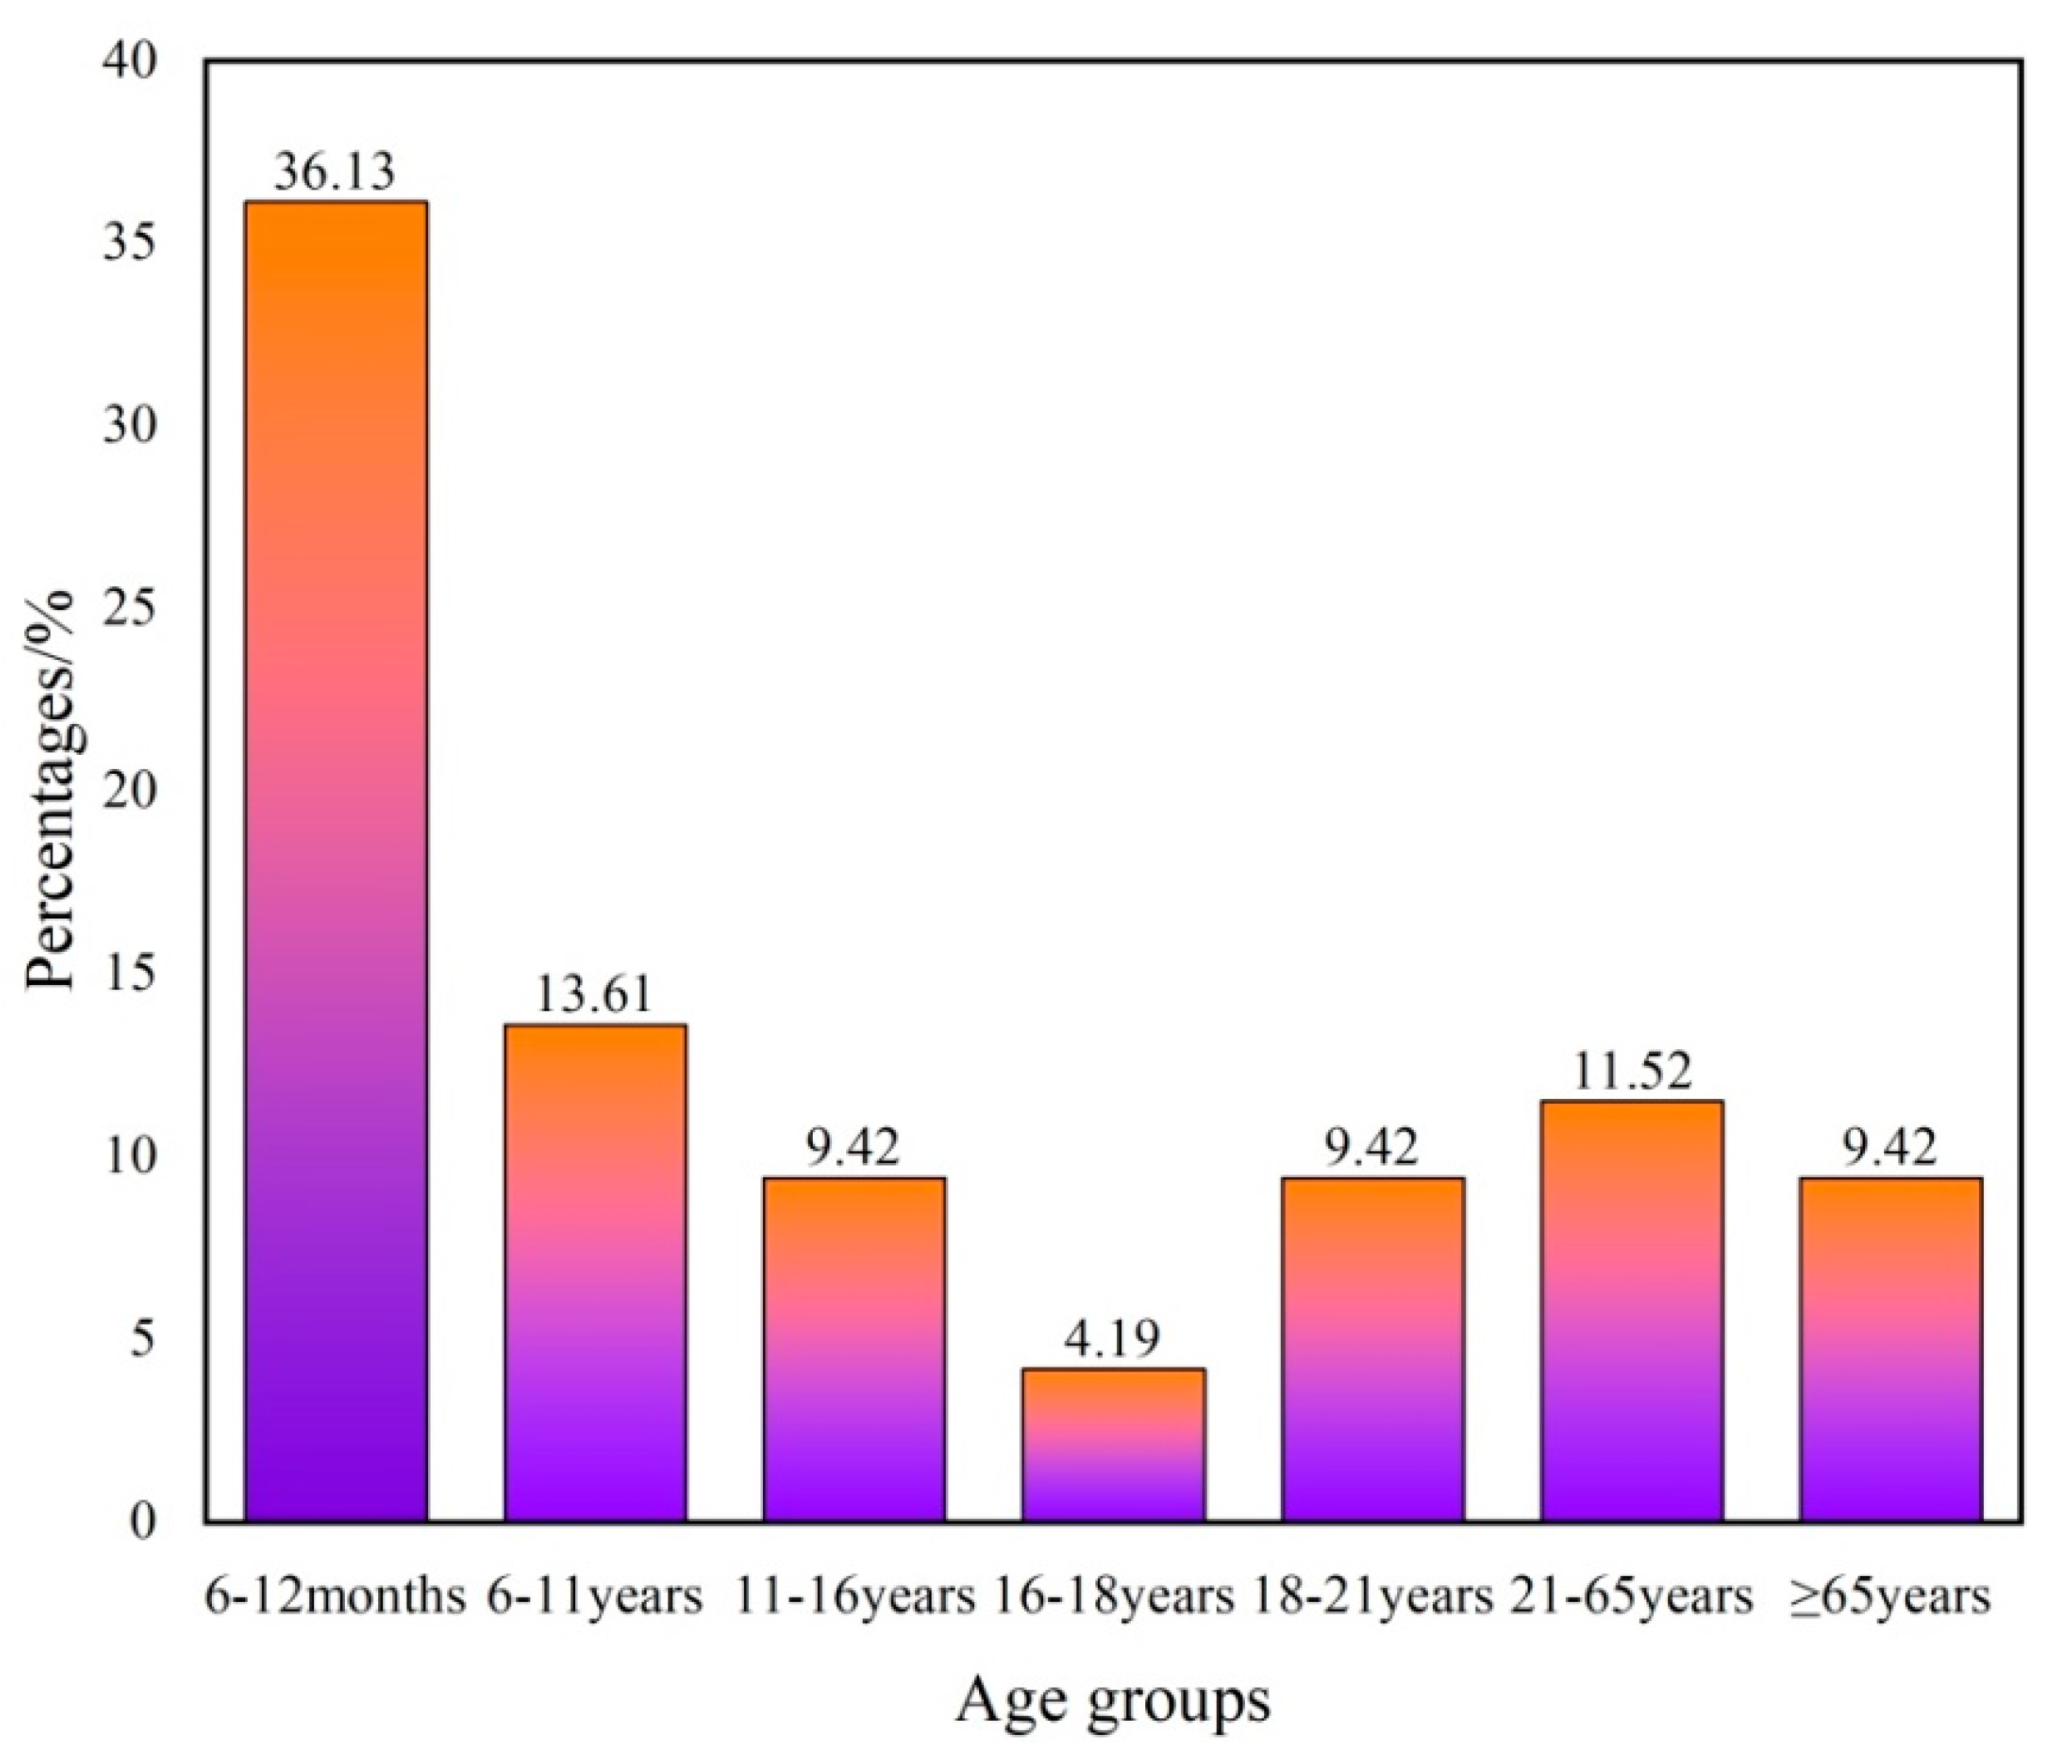
- The HHR results indicated that the 6–12 month age group was more likely to suffer from health complications due to a higher nitrate concentration, followed by 6–11 years, 21–65 years, 18–21 years, ≥65 years, 11–16 years, and 16–18 years age groups based on the average values. These results are especially useful for decision makers and will provide them with general risk information to allow them to make appropriate decisions.
Author Contributions
Funding
Acknowledgments
Conflicts of Interest
References
- Li, P.; Qian, H. Water Resources Research to Support a Sustainable China; Routledge: Abingdon, UK, 2018. [Google Scholar]
- Anantha, R.V.; Chandrakanta, G. Major ion chemistry, hydro-geochemical studies and mapping of variability in ground water quality of Sitanadi basin, Southern Karnataka. Octa J. Environ. Res. 2014, 2, 178–196. [Google Scholar]
- Martos-Rosillo, S.; Marín-Lechado, C.; Pedrera, A.; Vadillo, I.; Motyka, J.; Molina, J.L.; Ortiz, P.; Ramírez, J. Methodology to evaluate the renewal period of carbonate aquifers: A key tool for their management in arid and semiarid regions, with the example of Becerrero aquifer, Spain. Hydrogeol. J. 2014, 22, 679–689. [Google Scholar] [CrossRef]
- Wang, L.; Dong, Y.; Xie, Y.; Song, F.; Wei, Y.; Zhang, J. Distinct groundwater recharge sources and geochemical evolution of two adjacent sub-basins in the lower Shule River Basin, northwest China. Hydrogeol. J. 2016, 24, 1967–1979. [Google Scholar] [CrossRef]
- Shiklomanov, I. Appraisal and assessment of world water resources. Water Int. 2000, 25, 11–32. [Google Scholar] [CrossRef]
- Robertson, W.M.; Sharp, J.M. Estimates of recharge in two arid basin aquifers: A model of spatially variable net infiltration and its implications (Red Light Draw and Eagle Flats, Texas, USA). Hydrogeol. J. 2013, 21, 1853–1864. [Google Scholar] [CrossRef]
- Ray, R.K.; Syed, T.H.; Saha, D.; Sarkar, B.C.; Patre, A.K. Assessment of village-wise groundwater draft for irrigation: A field-based study in hard-rock aquifers of central India. Hydrogeol. J. 2017, 25, 2513–2525. [Google Scholar] [CrossRef]
- Li, P.Y.; Tian, R.; Xue, C.Y.; Wu, J.H. Progress, opportunities, and key fields for groundwater quality research under the impacts of human activities in China with a special focus on western China. Environ. Sci. Pollut. Res. 2017, 24, 13224–13234. [Google Scholar] [CrossRef]
- Xu, P.P.; Feng, W.W.; Qian, H.; Zhang, Q.Y. Hydrogeochemical Characterization and Irrigation Quality Assessment of Shallow Groundwater in the Central-Western Guanzhong Basin, China. Int. J. Environ. Res. Public Health 2019, 16, 1492. [Google Scholar] [CrossRef]
- Islam, M.A.; Zahid, A.; Rahman, M.M.; Rahman, M.S.; Islam, M.J.; Akter, Y.; Shammi, M.; Bodrud-Doza, M.; Roy, B. Investigation of Groundwater Quality and Its Suitability for Drinking and Agricultural Use in the South Central Part of the Coastal Region in Bangladesh. Expo. Health 2017, 9, 27–41. [Google Scholar] [CrossRef]
- Li, P.Y.; Li, X.Y.; Meng, X.Y.; Li, M.N.; Zhang, Y.T. Appraising Groundwater Quality and Health Risks from Contamination in a Semiarid Region of Northwest China. Expo. Health 2016, 8, 361–379. [Google Scholar] [CrossRef]
- Adimalla, N.; Li, P.Y.; Qian, H. Evaluation of groundwater contamination for fluoride and nitrate in semi-arid region of Nirmal Province, South India: A special emphasis on human health risk assessment (HHRA). Hum. Ecol. Risk Assess. 2019, 25, 1107–1124. [Google Scholar] [CrossRef]
- Li, P.Y.; Wu, J.H.; Qian, H.; Lyu, X.S.; Liu, H.W. Origin and assessment of groundwater pollution and associated health risk: A case study in an industrial park, northwest China. Environ. Geochem. Health 2014, 36, 693–712. [Google Scholar] [CrossRef] [PubMed]
- Narsimha, A.; Rajitha, S. Spatial distribution and seasonal variation in fluoride enrichment in groundwater and its associated human health risk assessment in Telangana State, South India. Hum. Ecol. Risk Assess. 2018, 24, 2119–2132. [Google Scholar] [CrossRef]
- Paladino, O.; Seyedsalehi, M.; Massabo, M. Probabilistic risk assessment of nitrate groundwater contamination from greenhouses in Albenga plain (Liguria, Italy) using lysimeters. Sci. Total Environ. 2018, 634, 427–438. [Google Scholar] [CrossRef] [PubMed]
- Wu, J.; Zhao, W.D.; Lu, J.; Jin, S.; Wang, J.Q.; Qian, J.Z. Geographic information system based approach for the investigation of groundwater nitrogen pollution near a closed old landfill site in Beijing, China. Environ. Eng. Manag. J. 2018, 17, 1095–1101. [Google Scholar]
- Wu, J.; Lu, J.; Wen, X.H.; Zhang, Z.H.; Lin, Y.C. Severe Nitrate Pollution and Health Risks of Coastal Aquifer Simultaneously Influenced by Saltwater Intrusion and Intensive Anthropogenic Activities. Arch. Environ. Contam. Toxicol. 2019, 77, 79–87. [Google Scholar] [CrossRef]
- Adimalla, N.; Li, P.Y. Occurrence, health risks, and geochemical mechanisms of fluoride and nitrate in groundwater of the rock-dominant semi-arid region, Telangana State, India. Hum. Ecol. Risk Assess. 2019, 25, 81–103. [Google Scholar] [CrossRef]
- Nejatijahromi, Z.; Nassery, H.R.; Hosono, T.; Nakhaei, M.; Alijani, F.; Okumura, A. Groundwater nitrate contamination in an area using urban wastewaters for agricultural irrigation under arid climate condition, southeast of Tehran, Iran. Agric. Water Manag. 2019, 221, 397–414. [Google Scholar] [CrossRef]
- Zhang, Y.T.; Wu, J.H.; Xu, B. Human health risk assessment of groundwater nitrogen pollution in Jinghui canal irrigation area of the loess region, northwest China. Environ. Earth Sci. 2018, 77, 12. [Google Scholar] [CrossRef]
- Liang, J.; Li, Z.; Yang, Q.; Lei, X.; Kang, A.; Li, S. Specific vulnerability assessment of nitrate in shallow groundwater with an improved DRSTIC-LE model. Ecotoxicol. Environ. Saf. 2019, 174, 649–657. [Google Scholar] [CrossRef]
- Du, J.; Shi, C.-X. Effects of climatic factors and human activities on runoff of the Weihe River in recent decades. Quat. Int. 2012, 282, 58–65. [Google Scholar] [CrossRef]
- Li, P.Y.; Qian, H.; Howard, K.W.F.; Wu, J.H. Building a new and sustainable ”Silk Road economic belt”. Environ. Earth Sci. 2015, 74, 7267–7270. [Google Scholar] [CrossRef]
- Sun, Y.; Wang, W.; Duan, L.; Zhang, C.; Wang, Y. Geochemical evolution mechanisms of shallow Groundwater in Guanzhong basin, China. Hydrogeol. Eng. Geol. 2014, 41, 29–35. [Google Scholar]
- Zuo, D.; Xu, Z.; Wu, W.; Zhao, J.; Zhao, F.J.W. Identification of streamflow response to climate change and human activities in the Wei River Basin, China. Water Resour. Manag. 2014, 28, 833–851. [Google Scholar] [CrossRef]
- Kong, F.; Song, J.; Zhang, Y.; Fu, G.; Cheng, D.; Zhang, G.; Xue, Y.J.G. Surface Water-Groundwater Interaction in the Guanzhong Section of the Weihe River Basin, China. Graundwater 2019, 57, 647–660. [Google Scholar] [CrossRef] [PubMed]
- Adimalla, N.; Qian, H. Hydrogeochemistry and fluoride contamination in the hard rock terrain of central Telangana, India: Analyses of its spatial distribution and health risk. SN Appl. Sci. 2019, 1, 202. [Google Scholar] [CrossRef]
- Xu, P.P.; Zhang, Q.Y.; Qian, H.; Li, M.N.; Hou, K. Characterization of geothermal water in the piedmont region of Qinling Mountains and Lantian-Bahe Group in Guanzhong Basin, China. Environ. Earth Sci. 2019, 78, 17. [Google Scholar] [CrossRef]
- Xu, P.P.; Li, M.N.; Qian, H.; Zhang, Q.Y.; Liu, F.X.; Hou, K. Hydrochemistry and geothermometry of geothermal water in the central Guanzhong Basin, China: A case study in Xian. Environ. Earth Sci. 2019, 78, 20. [Google Scholar] [CrossRef]
- Wang, W.K.; Zhang, Z.Y.; Duan, L.; Wang, Z.F.; Zhao, Y.Q.; Zhang, Q.; Dai, M.L.; Liu, H.Z.; Zheng, X.Y.; Sun, Y.B. Response of the groundwater system in the Guanzhong Basin (central China) to climate change and human activities. Hydrogeol. J. 2018, 26, 1429–1441. [Google Scholar] [CrossRef]
- Ma, Z.Y.; Li, X.C.; Zheng, H.J.; Li, J.B.; Pei, B.; Guo, S.; Zhang, X.L. Origin and Classification of Geothermal Water from Guanzhong Basin, NW China: Geochemical and Isotopic Approach. J. Earth Sci. 2017, 28, 719–728. [Google Scholar] [CrossRef]
- Jia, Z.F.; Ma, Y.D.; Liu, P.; Yao, C.C. Relationship between sand dew and plant leaf dew and its significance in irrigation water supplementation in Guanzhong Basin, China. Environ. Earth Sci. 2019, 78, 10. [Google Scholar] [CrossRef]
- Li, P.Y.; Feng, W.; Xue, C.Y.; Tian, R.; Wang, S.T. Spatiotemporal Variability of Contaminants in Lake Water and Their Risks to Human Health: A Case Study of the Shahu Lake Tourist Area, Northwest China. Expo. Health 2017, 9, 213–225. [Google Scholar] [CrossRef]
- Duan, L.; Wang, W.K.; Sun, Y.B.; Zhang, C.C. Iodine in groundwater of the Guanzhong Basin, China: Sources and hydrogeochemical controls on its distribution. Environ. Earth Sci. 2016, 75, 11. [Google Scholar] [CrossRef]
- Adimalla, N.; Wu, J.H. Groundwater quality and associated health risks in a semi-arid region of south India: Implication to sustainable groundwater management. Hum. Ecol. Risk Assess. 2019, 25, 191–216. [Google Scholar] [CrossRef]
- Horton, R.K. An index number system for rating water quality. J. Water Pollut. Control Fed. 1965, 37, 300–306. [Google Scholar]
- Rabeiy, R.E. Assessment and modeling of groundwater quality using WQI and GIS in Upper Egypt area. Environ. Sci. Pollut. Res. 2018, 25, 30808–30817. [Google Scholar] [CrossRef] [PubMed]
- Li, P.; He, X.; Li, Y.; Xiang, G. Occurrence and Health Implication of Fluoride in Groundwater of Loess Aquifer in the Chinese Loess Plateau: A Case Study of Tongchuan, Northwest China. Expo. Health 2019, 11, 95–107. [Google Scholar] [CrossRef]
- WHO. Guidelines for Drinking Water Quality: Fourth Edition Incorporating the First Addendum; World Health Organization: Geneva, Switzerland, 2017. [Google Scholar]
- Adimalla, N.; Marsetty, S.K.; Xu, P. Assessing groundwater quality and health risks of fluoride pollution in the Shasler Vagu (SV) watershed of Nalgonda, India. Hum. Ecol. Risk Assess. Int. J. 2019, 1–20. [Google Scholar] [CrossRef]
- Oinam, J.D.; Ramanathan, A.L.; Singh, G. Geochemical and statistical evaluation of groundwater in Imphal and Thoubal district of Manipur, India. J. Asian Earth Sci. 2012, 48, 136–149. [Google Scholar] [CrossRef]
- Razowska-Jaworek, L. Calcium and Magnesium in Groundwater: Occurrence and Significance for Human Health; CRC Press: Boca Raton, FL, USA, 2014. [Google Scholar]
- Rao, N.S.; Sunitha, B.; Rambabu, R.; Rao, P.N.; Rao, P.S.; Spandana, B.D.; Sravanthi, M.; Marghade, D. Quality and degree of pollution of groundwater, using PIG from a rural part of Telangana State, India. Appl. Water Sci. 2018, 8, 227. [Google Scholar] [CrossRef] [Green Version]
- Chen, J.; Huang, Q.W.; Lin, Y.L.; Fang, Y.; Qian, H.; Liu, R.P.; Ma, H.Y. Hydrogeochemical Characteristics and Quality Assessment of Groundwater in an Irrigated Region, Northwest China. Water 2019, 11, 96. [Google Scholar] [CrossRef]
- Barzegar, R.; Moghaddam, A.A.; Tziritis, E.; Fakhri, M.S.; Soltani, S. Identification of hydrogeochemical processes and pollution sources of groundwater resources in the Marand plain, northwest of Iran. Environ. Earth Sci. 2017, 76, 297. [Google Scholar] [CrossRef]
- Li, P.Y.; Wu, J.H.; Tian, R.; He, S.; He, X.D.; Xue, C.Y.; Zhang, K. Geochemistry, Hydraulic Connectivity and Quality Appraisal of Multilayered Groundwater in the Hongdunzi Coal Mine, Northwest China. Mine Water Environ. 2018, 37, 222–237. [Google Scholar] [CrossRef]
- Wu, J.; Li, P.; Qian, H.; Duan, Z.; Zhang, X. Using correlation and multivariate statistical analysis to identify hydrogeochemical processes affecting the major ion chemistry of waters: A case study in Laoheba phosphorite mine in Sichuan, China. Arab. J. Geosci. 2014, 7, 3973–3982. [Google Scholar] [CrossRef]
- Schoeller, H. Qualitative evaluation of groundwater resources. Methods and Techniques of Groundwater Investigations and Development; UNESCO: Paris, France, 1965; Volume 5483. [Google Scholar]
- Wan, Z. Temporal and Spatial Variation of Mineral Nitrogen Pollution in Groundwater in Guanzhong Basin, Shanxi Province. Master’s Thesis, Northwest A&F University, Yangling, China, 2018. [Google Scholar]
- Wu, J.H.; Sun, Z.C. Evaluation of Shallow Groundwater Contamination and Associated Human Health Risk in an Alluvial Plain Impacted by Agricultural and Industrial Activities, Mid-West China. Expo. Health 2016, 8, 311–329. [Google Scholar] [CrossRef]
- Rina, K.; Datta, P.S.; Singh, C.K.; Mukherjee, S. Determining the genetic origin of nitrate contamination in aquifers of Northern Gujarat, India. Environ. Earth Sci. 2014, 71, 1711–1719. [Google Scholar] [CrossRef]
- Li, P.Y.; Qian, H.; Wu, J.H. Conjunctive use of groundwater and surface water to reduce soil salinization in the Yinchuan Plain, North-West China. Int. J. Water Resour. Dev. 2018, 34, 337–353. [Google Scholar] [CrossRef]


| Parameters | k++Na++ | Ca2+ | Mg2++ | Cl− | SO42− | HCO3− | NO3− | pH | TDS | TH | EC |
|---|---|---|---|---|---|---|---|---|---|---|---|
| wi | 2 | 3 | 3 | 4 | 3 | 3 | 5 | 3 | 5 | 3 | 4 |
| Wi | 0.053 | 0.079 | 0.079 | 0.105 | 0.079 | 0.079 | 0.132 | 0.079 | 0.132 | 0.079 | 0.105 |
| Si | 200 | 200 | 150 | 250 | 250 | 500 | 20 | 8.5 | 1000 | 450 | 1500 |
| Parameters | Units | 6–12 Months | 6–11 Years | 11–16 Years | 16–18 Years | 18–21 Years | 21–65 Years | ≥65 Years |
|---|---|---|---|---|---|---|---|---|
| Ingestion rate (IR) | L/day | 1 | 1.32 | 1.82 | 1.78 | 2.34 | 2.94 | 2.73 |
| Exposure frequency (EF) | day/year | 365 | 365 | 365 | 365 | 365 | 365 | 365 |
| Exposure duration (ED) | year | 6 | 6 | 6 | 6 | 30 | 30 | 30 |
| Body weight (BW) | kg | 9.1 | 29.3 | 54.2 | 67.6 | 67.6 | 78.8 | 80 |
| Average time (AT) | days | 2190 | 2190 | 2190 | 2190 | 10,950 | 10,950 | 10,950 |
| Concentration of element (Cw) | mg/L | Present study | ||||||
| Reference dose of nitrate (RfD) | - | 1.6 | ||||||
| Parameters | Units | Min. | Max. | Mean | Si | Number of Samples Exceeding the PLAAS | % of Samples Exceeding the PLAAS |
|---|---|---|---|---|---|---|---|
| pH | - | 6.9 | 8.4 | 7.68 | 6.5–8.5 | 0 | 0.00 |
| TDS | mg/L | 110.7 | 2978.73 | 516.81 | 1000 | 14 | 7.33 |
| TH | mg/L | 1.96 | 530.5 | 64.87 | 450 | 2 | 1.05 |
| EC | μS/cm | 201.26 | 4445.86 | 885.75 | 1500 | 19 | 9.95 |
| k++Na+ | mg/L | 2.07 | 400.89 | 102.12 | 200 | 34 | 17.80 |
| Ca2+ | mg/L | 7.21 | 124.2 | 49.14 | 200 | 0 | 0.00 |
| Mg2+ | mg/L | 1.2 | 293.57 | 31.91 | 150 | 3 | 1.57 |
| Cl− | mg/L | 2.48 | 1556.39 | 57.09 | 250 | 11 | 5.76 |
| SO42− | mg/L | 0 | 634.97 | 70.01 | 250 | 12 | 6.28 |
| HCO3− | mg/L | 109.83 | 1020.22 | 374.79 | 500 | 31 | 16.23 |
| NO3− | mg/L | 0 | 90 | 18.26 | 20 | 47 | 24.61 |
| HItotal | Max. | Min. | Mean | Num. | Per. |
|---|---|---|---|---|---|
| 6–12 months | 13.0495 | 0.006868 | 1.129466 | 69 | 36.13% |
| 6–11 years | 5.34983 | 0.002816 | 0.463043 | 26 | 13.61% |
| 11–16 years | 3.98755 | 0.002099 | 0.345133 | 18 | 9.42% |
| 16–18 years | 3.12685 | 0.001646 | 0.270637 | 8 | 4.19% |
| 18–21 years | 4.11058 | 0.002163 | 0.355782 | 18 | 9.42% |
| 21–65 years | 4.43052 | 0.002332 | 0.383474 | 22 | 11.52% |
| ≥65 years | 4.05234 | 0.002133 | 0.350742 | 18 | 9.42% |
© 2019 by the authors. Licensee MDPI, Basel, Switzerland. This article is an open access article distributed under the terms and conditions of the Creative Commons Attribution (CC BY) license (http://creativecommons.org/licenses/by/4.0/).
Share and Cite
Zhang, Q.; Xu, P.; Qian, H. Assessment of Groundwater Quality and Human Health Risk (HHR) Evaluation of Nitrate in the Central-Western Guanzhong Basin, China. Int. J. Environ. Res. Public Health 2019, 16, 4246. https://0-doi-org.brum.beds.ac.uk/10.3390/ijerph16214246
Zhang Q, Xu P, Qian H. Assessment of Groundwater Quality and Human Health Risk (HHR) Evaluation of Nitrate in the Central-Western Guanzhong Basin, China. International Journal of Environmental Research and Public Health. 2019; 16(21):4246. https://0-doi-org.brum.beds.ac.uk/10.3390/ijerph16214246
Chicago/Turabian StyleZhang, Qiying, Panpan Xu, and Hui Qian. 2019. "Assessment of Groundwater Quality and Human Health Risk (HHR) Evaluation of Nitrate in the Central-Western Guanzhong Basin, China" International Journal of Environmental Research and Public Health 16, no. 21: 4246. https://0-doi-org.brum.beds.ac.uk/10.3390/ijerph16214246