Walking Green: Developing an Evidence Base for Nature Prescriptions

 , , , ,
Abstract
:1. Introduction
2. Materials and Methods
2.1. Ethics Statement
2.2. Participants
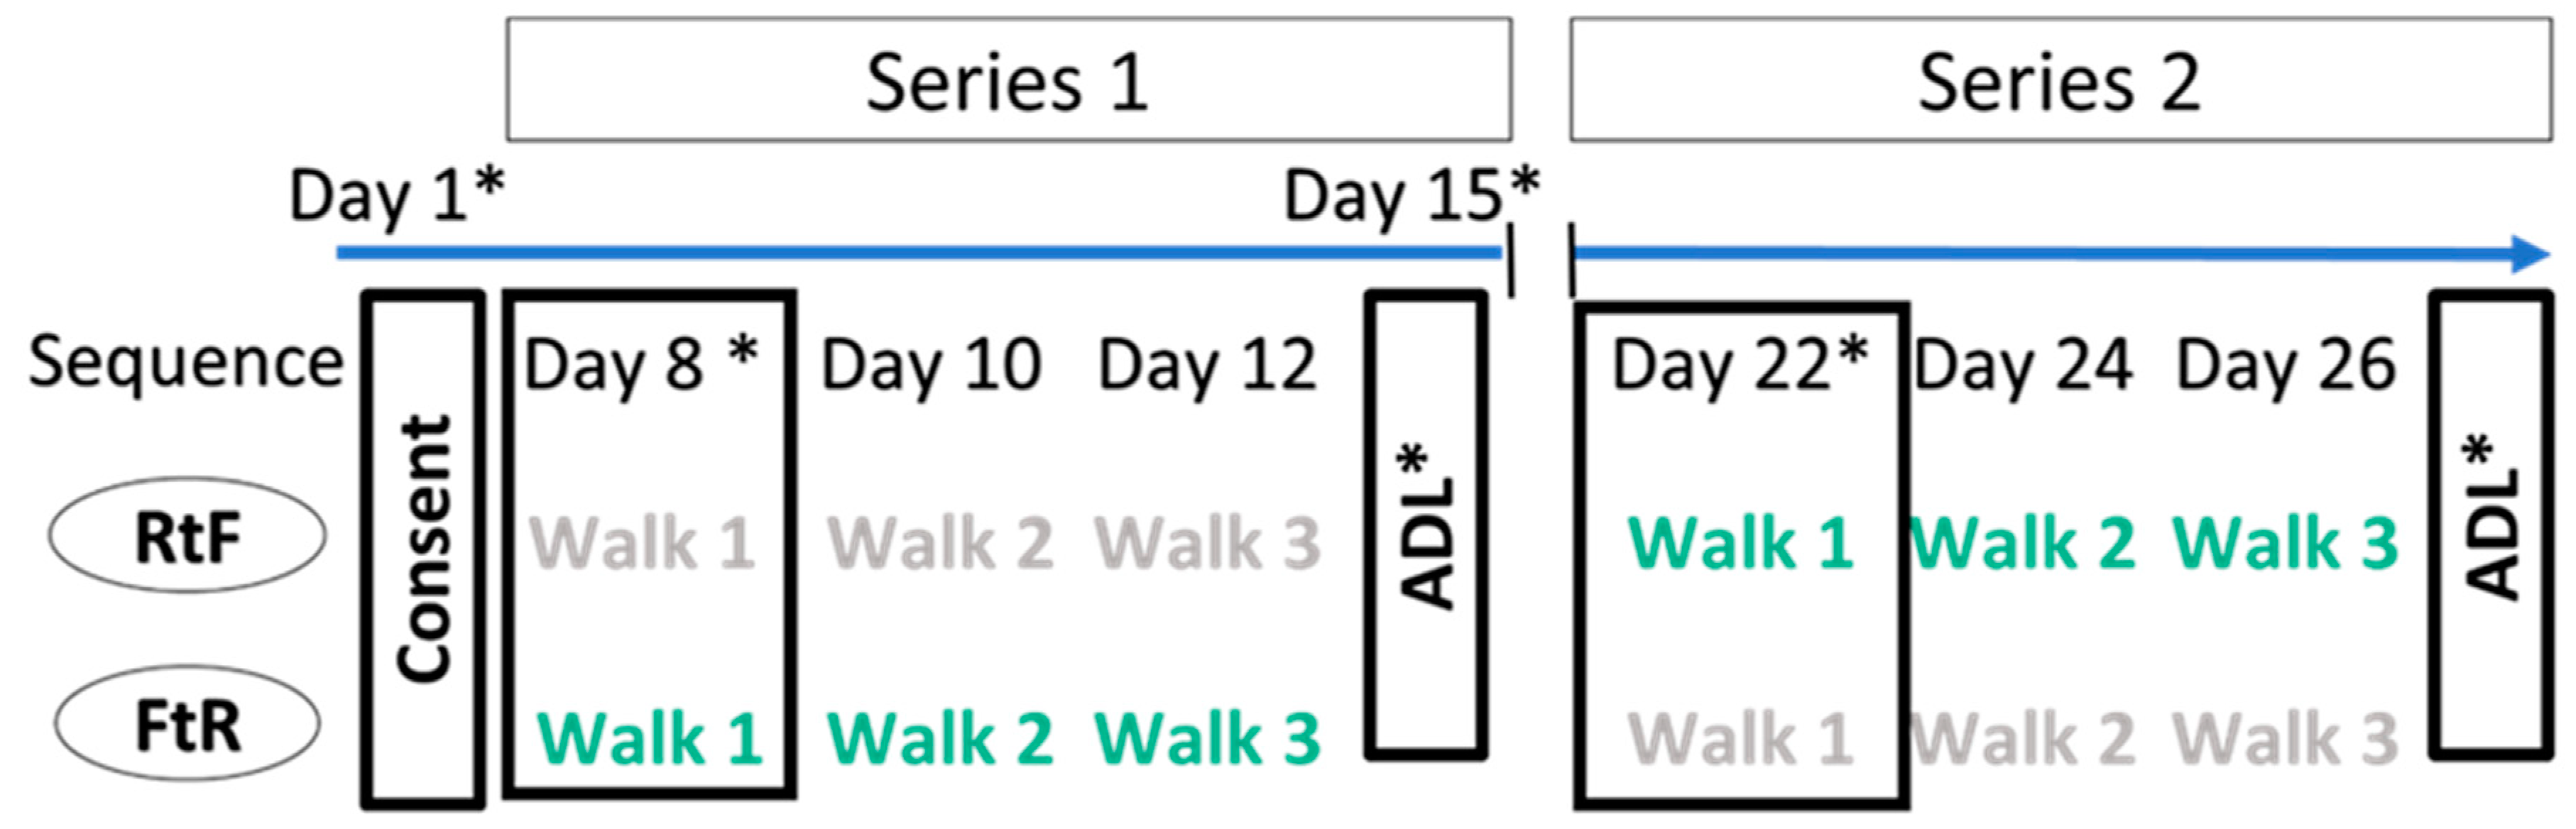
2.3. Study Design
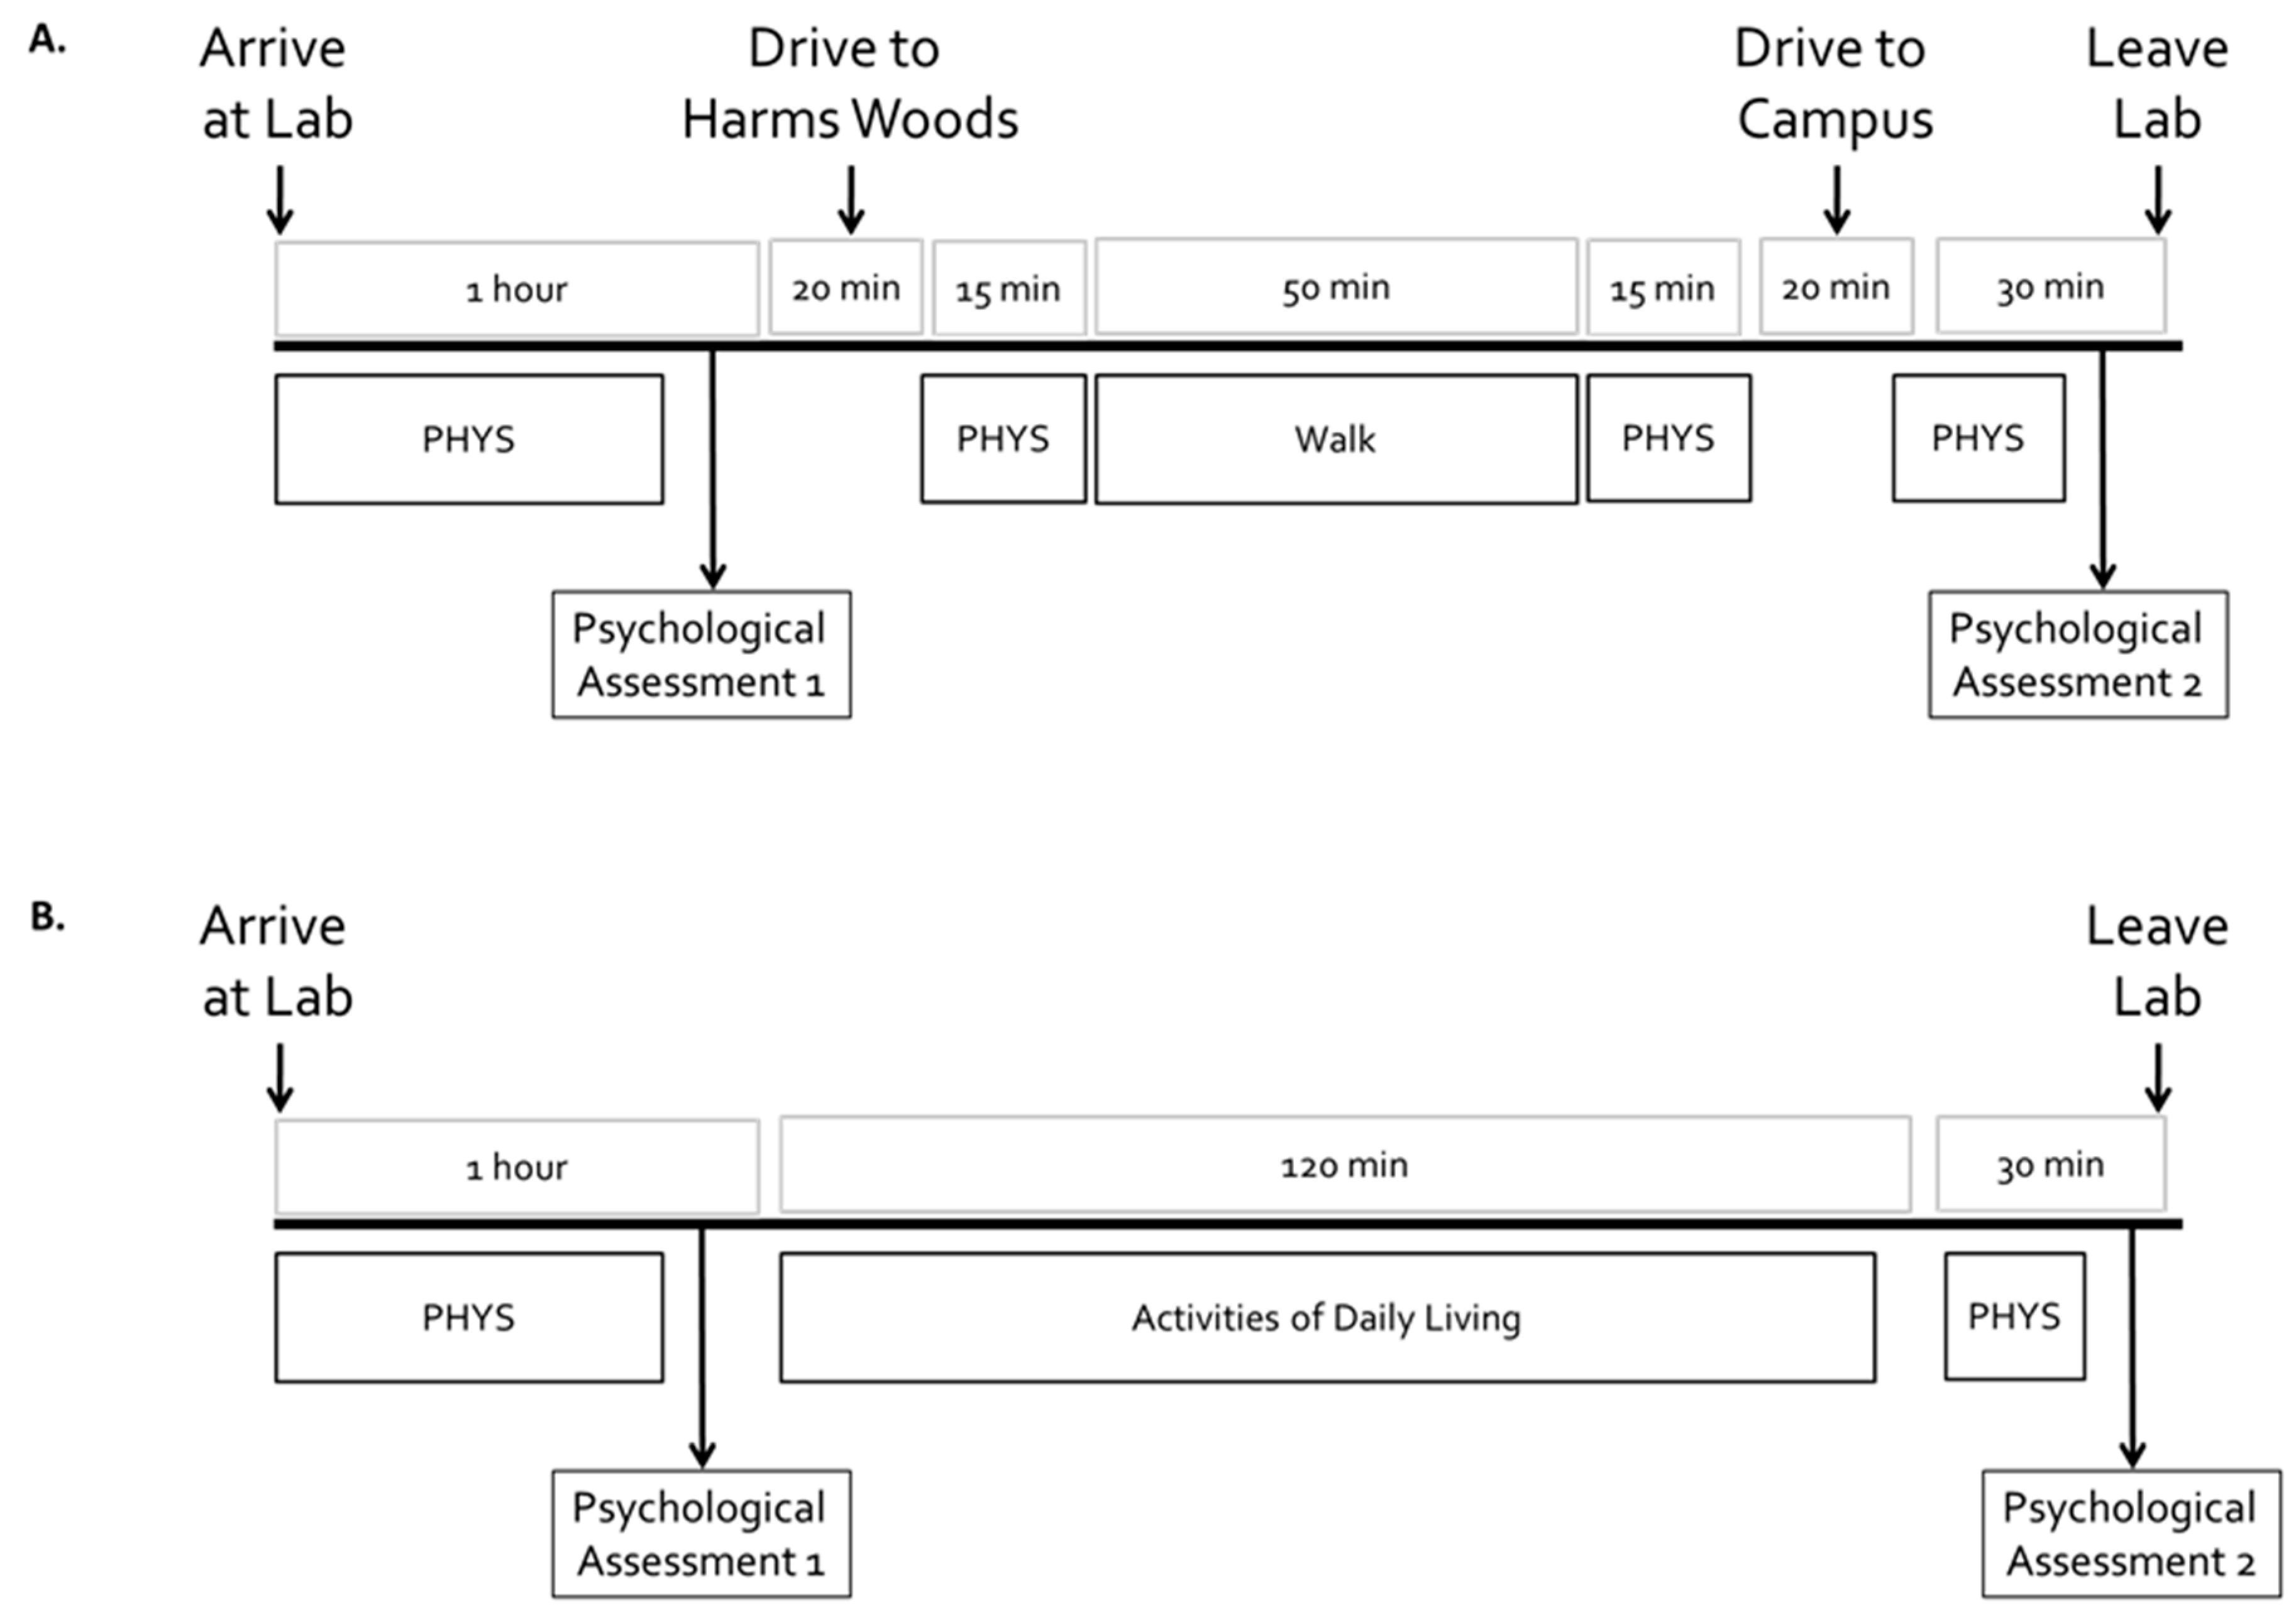
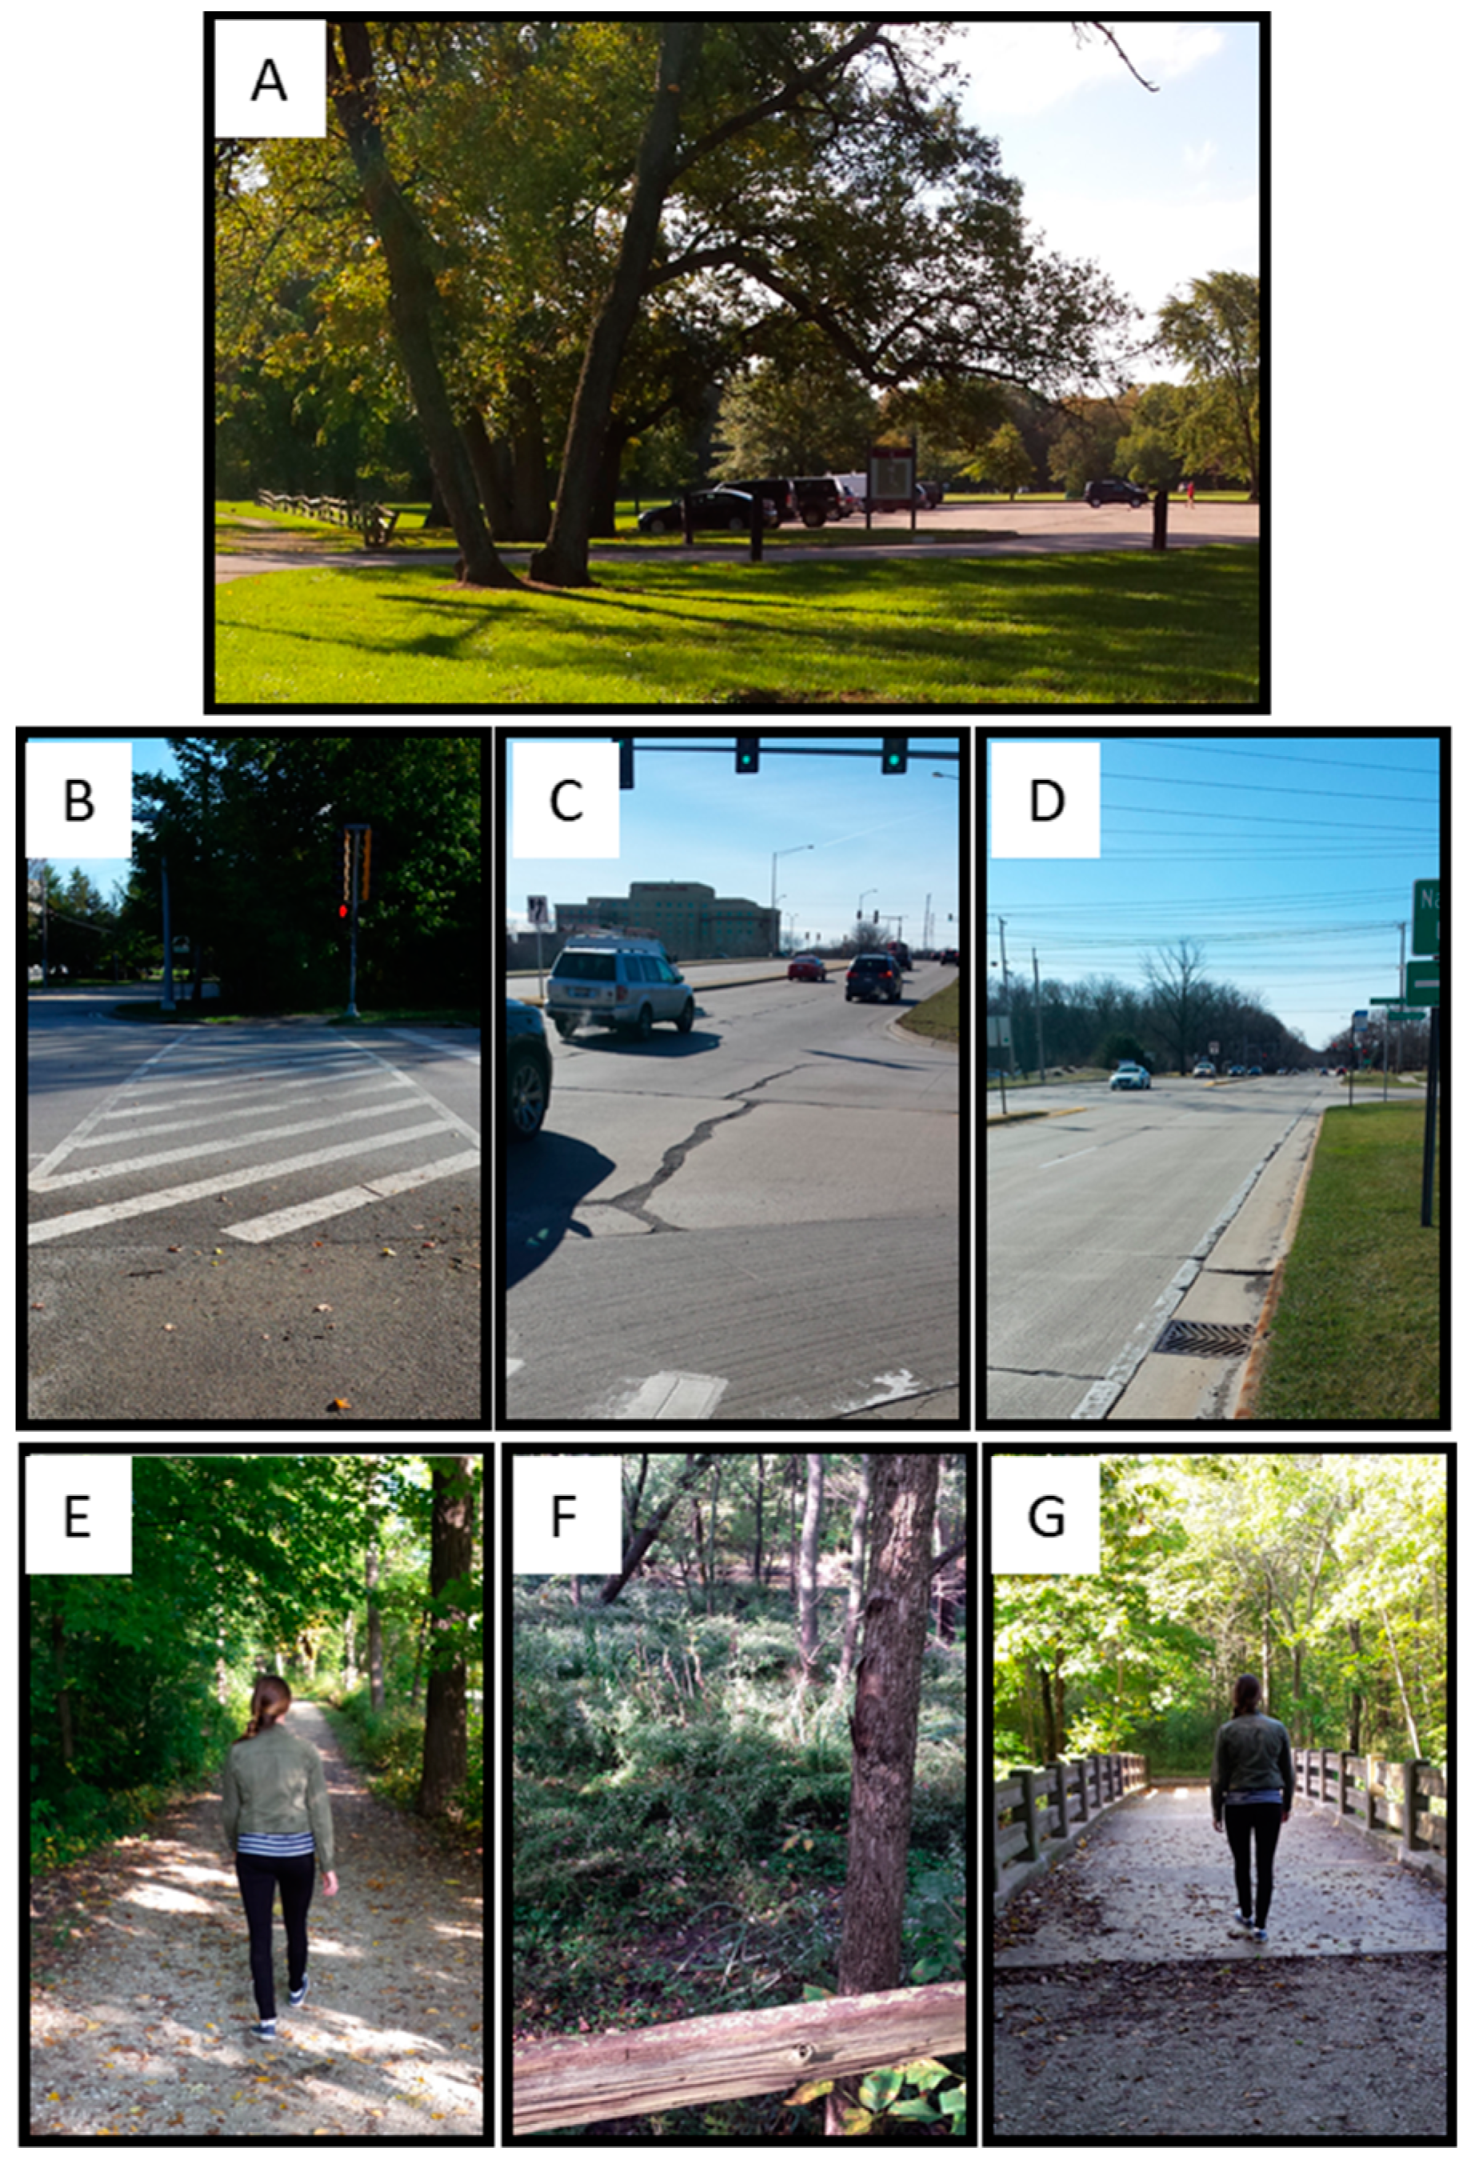
2.4. Location and Instructions for Walks
2.5. Instructions for “Activities of Daily Living” Sessions
2.6. Outcomes of Interest
- The Positive and Negative Affect Schedule (PANAS) is a self-report questionnaire that consists of two 10-item scales that measure both positive and negative affect. Positive affect reflects the extent to which a person feels enthusiastic, active, and alert. Negative affect denotes subjective experiences of distress and unpleasurable engagement and subsumes a verity of unpleasant mood states, including anger, disgust, and fear [61,62].
- The State and Trait Anxiety Inventory (STAI) is a self-report measure that indicates the intensity of feelings of anxiety [63,64]. The STAI distinguishes between state anxiety—a temporary condition experienced in specific situations—and trait anxiety, which is a general tendency to perceive situations as threatening. For this analysis, we focused on STAI-state scores because they aligned with the short-term changes in anxiety we planned to assess.
- Cohen’s Perceived Stress Scale (PSS-10) is a measure of the degree to which situations in one’s life are appraised as stressful. Items were designed to examine how unpredictable, uncontrollable, and overloaded respondents find their lives. The scale also includes several direct queries about current levels of perceived stress [65,66].
- Visual Backward Digit Span Test (vBDS) is a component of the Wechsler Adult Intelligence Scale and is used to assess attention and working memory [67]. This test has been used to evaluate the role of exposure to greenspace in reducing mental fatigue as indicated by increased working memory capacity [46,68,69,70,71]. The test was administered by computer and was non-adaptive (i.e., sequences did not change in response to a participant’s responses). Participants viewed a series of digits at one-second intervals on a computer screen, then were asked to enter the sequence in reverse order using a computer keyboard. The test started with a sequence of three digits and increased to nine digits, with each series length repeated twice. Providing the correct response for each sequence was scored as one point, thus the maximum score possible was 14.
2.7. Statistical Analysis
3. Results
3.1. Psychological and Working Memory Outcomes
3.2. Recruitment and Retention:
4. Discussion
5. Conclusions
- Plans to provide access to greenspace should include public transportation to enable access to greenspace [60].
Supplementary Materials
Author Contributions
Funding
Acknowledgments
Conflicts of Interest
References
- NAMI. Mental Health by the Numbers. 2019. Available online: https://www.nami.org/learn-more/mental-health-by-the-numbers (accessed on 2 November 2019).
- McDonald, R.I.; Beatley, T.; Elmqvist, T. The green soul of the concrete jungle: The urban century, the urban psychological penalty, and the role of nature. Sustain. Earth 2018, 1, 3. [Google Scholar] [CrossRef]
- Berry, H.L. Crowded suburbs and killer cities: A brief review of the relationship between urban environments and mental health. New South Wales Public Health Bull. 2007, 18, 222–227. [Google Scholar] [CrossRef]
- Chen, X.; de Vries, S.; Assmuth, T.; Dick, J.; Hermans, T.; Hertel, O.; Jensen, A.; Jones, L.; Kabisch, S.; Lanki, T.; et al. Research challenges for cultural ecosystem services and public health in (peri-)urban environments. Sci. Total Environ. 2019, 651 Pt 2, 2118–2129. [Google Scholar] [CrossRef]
- Okkels, N.; Kristiansen, C.B.; Munk-Jorgensen, P.; Sartorius, N. Urban mental health: Challenges and perspectives. Curr. Opin. Psychiatry 2018, 31, 258–264. [Google Scholar] [CrossRef]
- Lachowycz, K.; Jones, A.P. Towards a better understanding of the relationship between greenspace and health: Development of a theoretical framework. Landsc. Urban Plan. 2013, 118, 62–69. [Google Scholar] [CrossRef]
- Taylor, L.; Hochuli, D.F. Defining greenspace: Multiple uses across multiple disciplines. Landsc. Urban Plan. 2017, 158, 25–38. [Google Scholar] [CrossRef] [Green Version]
- APHA. Improving health and wellness through access to nature. In Policy Statement; American Public Health Association: Washington, DC, USA, 2013. [Google Scholar]
- Hunter, R.F.; Christian, H.; Veitch, J.; Astell-Burt, T.; Hipp, J.A.; Schipperijn, J. The impact of interventions to promote physical activity in urban green space: A systematic review and recommendations for future research. Soc. Sci. Med. 2015, 124, 246–256. [Google Scholar] [CrossRef] [Green Version]
- WHO. Urban Green Space Interventions and Health: A Review of Impacts and Effectiveness; World Health Organization: Copenhagen, Denmark, 2017. [Google Scholar]
- WHO. Urban Green Spaces and Health. A Review of the Evidence; WHO Regional Office for Europe: Copenhagen, Denmark, 2016. [Google Scholar]
- Ulmer, J.M.; Wolf, K.L.; Backman, D.R.; Tretheway, R.L.; Blain, C.J.A.; O’Neil-Dunne, J.P.M.; Frank, L.D. Multiple health benefits of urban tree canopy: The mounting evidence for a green prescription. Health Place 2016, 42, 54–62. [Google Scholar] [CrossRef]
- Gribben, B.; Goodyear-Smith, F.; Grobbelaar, M.; O’Neill, D.; Walker, S. The early experience of general practitioners using Green Prescription. N. Z. Med. J. 2000, 113, 372–373. [Google Scholar]
- Zarr, R.; Cottrell, L.; Merrill, C. Park Prescription (DC Park Rx): A New Strategy to Combat Chronic Disease in Children. J. Phys. Act. Health 2017, 14, 1–2. [Google Scholar] [CrossRef]
- Razani, N.; Morshed, S.; Kohn, M.A.; Wells, N.M.; Thompson, D.; Alqassari, M.; Agodi, A.; Rutherford, G.W. Effect of park prescriptions with and without group visits to parks on stress reduction in low-income parents: SHINE randomized trial. PLoS ONE 2018, 13, e0192921. [Google Scholar] [CrossRef]
- James, J.J.; Christiana, R.W.; Battista, R.A. A historical and critical analysis of park prescriptions. J. Leis. Res. 2019, 50, 1–19. [Google Scholar] [CrossRef]
- Hunter, M.R.; Gillespie, B.W.; Chen, S.Y.-P. Urban Nature Experiences Reduce Stress in the Context of Daily Life Based on Salivary Biomarkers. Front. Psychol. 2019, 10, 722. [Google Scholar] [CrossRef]
- Bell, S.L.; Leyshon, C.; Foley, R.; Kearns, R.A. The “healthy dose” of nature: A cautionary tale. Geogr. Compass 2019, 13, e12415. [Google Scholar] [CrossRef]
- Sullivan, W.C.; Frumkin, H.; Jackson, R.J.; Chang, C.-Y. Gaia meets Asclepius: Creating healthy places. Landsc. Urban Plan. 2014, 127, 182–184. [Google Scholar] [CrossRef]
- Frumkin, H.; Bratman, G.N.; Breslow, S.J.; Cochran, B.; Kahn, P.H., Jr.; Lawler, J.J.; Levin, P.S.; Tandon, P.S.; Varanasi, U.; Wolf, K.L.; et al. Nature Contact and Human Health: A Research Agenda. Environ. Health Perspect. 2017, 125, 075001. [Google Scholar] [CrossRef]
- Kaplan, R.; Kaplan, S. The Experience of Nature: A Psychological Perspective; Cambridge University Press: New York, NY, USA, 1989; p. 368. [Google Scholar]
- Ulrich, R.S.; Simons, R.F.; Losito, B.D.; Fiorito, E.; Miles, M.A.; Zelson, M. Stress Recovery during Exposure to Natural and Urban Environments. J. Environ. Psychol. 1991, 11, 201–230. [Google Scholar] [CrossRef]
- Ulrich, R.S. View through a window may influence recovery from surgery. Science 1984, 224, 420–421. [Google Scholar] [CrossRef]
- Kaplan, S. The Restorative Benefits of Nature - toward an Integrative Framework. J. Environ. Psychol. 1995, 15, 169–182. [Google Scholar] [CrossRef]
- Takano, T.; Nakamura, K.; Watanabe, M. Urban residential environments and senior citizens’ longevity in megacity areas: The importance of walkable green spaces. J. Epidemiol. Community Health 2002, 56, 913–918. [Google Scholar] [CrossRef]
- Sullivan, W.C.; Kuo, F.E.; DePooter, S.F. The fruit of urban nature - Vital neighborhood spaces. Environ. Behav. 2004, 36, 678–700. [Google Scholar] [CrossRef]
- Hartig, T.; Mitchell, R.; de Vries, S.; Frumkin, H. Nature and health. Annu. Rev. Public Health 2014, 35, 207–228. [Google Scholar] [CrossRef] [PubMed]
- Maas, J.; Verheij, R.A.; Spreeuwenberg, P.; Groenewegen, P.P. Physical activity as a possible mechanism behind the relationship between green space and health: A multilevel analysis. BMC Public Health 2008, 8, 206. [Google Scholar] [CrossRef] [PubMed]
- Mitchell, R. Is physical activity in natural environments better for mental health than physical activity in other environments? Soc. Sci. Med. 2013, 91, 130–134. [Google Scholar] [CrossRef] [PubMed]
- Gladwell, V.F.; Brown, D.K.; Wood, C.; Sandercock, G.R.; Barton, J.L. The great outdoors: How a green exercise environment can benefit all. Extrem. Physiol. Med. 2013, 2, 3. [Google Scholar] [CrossRef]
- Franco, L.S.; Shanahan, D.F.; Fuller, R.A. A Review of the Benefits of Nature Experiences: More Than Meets the Eye. Int. J. Environ. Res. Public Health 2017, 14, 864. [Google Scholar] [CrossRef]
- Thompson, C.W.; Roe, J.; Aspinall, P.; Mitchell, R.; Clow, A.; Miller, D. More green space is linked to less stress in deprived communities: Evidence from salivary cortisol patterns. Landsc. Urban Plan. 2012, 105, 221–229. [Google Scholar] [CrossRef] [Green Version]
- Roe, J.J.; Thompson, C.W.; Aspinall, P.A.; Brewer, M.J.; Duff, E.I.; Miller, D.; Mitchell, R.; Clow, A. Green space and stress: Evidence from cortisol measures in deprived urban communities. Int. J. Environ. Res. Public Health 2013, 10, 4086–4103. [Google Scholar] [CrossRef] [PubMed]
- Dadvand, P.; Bartoll, X.; Basagana, X.; Dalmau-Bueno, A.; Martinez, D.; Ambros, A.; Cirach, M.; Triguero-Mas, M.; Gascon, M.; Borrell, C.; et al. Green spaces and General Health: Roles of mental health status, social support, and physical activity. Environ. Int. 2016, 91, 161–167. [Google Scholar] [CrossRef] [PubMed] [Green Version]
- Gascon, M.; Sanchez-Benavides, G.; Dadvand, P.; Martinez, D.; Gramunt, N.; Gotsens, X.; Cirach, M.; Vert, C.; Molinuevo, J.L.; Crous-Bou, M.; et al. Long-term exposure to residential green and blue spaces and anxiety and depression in adults: A cross-sectional study. Environ. Res. 2018, 162, 231–239. [Google Scholar] [CrossRef] [PubMed]
- Twohig-Bennett, C.; Jones, A. The health benefits of the great outdoors: A systematic review and meta-analysis of greenspace exposure and health outcomes. Environ. Res. 2018, 166, 628–637. [Google Scholar] [CrossRef]
- South, E.C.; Hohl, B.C.; Kondo, M.C.; MacDonald, J.M.; Branas, C.C. Effect of greening vacant land on mental health of community-dwelling adults: A cluster randomized trial. JAMA Netw. Open 2018, 1, e180298. [Google Scholar] [CrossRef] [PubMed]
- Jerrett, M.; van den Bosch, M. Nature exposure gets a boost from a cluster randomized trial on the mental health benefits of greening vacant lots. JAMA Netw. Open 2018, 1, e180299. [Google Scholar] [CrossRef]
- Dalton, A.M.; Jones, A.P.; Sharp, S.J.; Cooper, A.J.; Griffin, S.; Wareham, N.J. Residential neighbourhood greenspace is associated with reduced risk of incident diabetes in older people: A prospective cohort study. BMC Public Health 2016, 16, 1171. [Google Scholar] [CrossRef]
- Ekelund, U.; Tarp, J.; Steene-Johannessen, J.; Hansen, B.H.; Jefferis, B.; Fagerland, M.W.; Whincup, P.; Diaz, K.M.; Hooker, S.P.; Chernofsky, A.; et al. Dose-response associations between accelerometry measured physical activity and sedentary time and all cause mortality: Systematic review and harmonised meta-analysis. BMJ 2019, 366, l4570. [Google Scholar] [CrossRef]
- Sallis, J.F.; Bull, F.; Guthold, R.; Heath, G.W.; Inoue, S.; Kelly, P.; Oyeyemi, A.L.; Perez, L.G.; Richards, J.; Hallal, P.C.; et al. Progress in physical activity over the Olympic quadrennium. Lancet 2016, 388, 1325–1336. [Google Scholar] [CrossRef]
- Penedo, F.J.; Dahn, J.R. Exercise and well-being: A review of mental and physical health benefits associated with physical activity. Curr. Opin. Psychiatry 2005, 18, 189–193. [Google Scholar] [CrossRef]
- Kelly, P.; Williamson, C.; Niven, A.G.; Hunter, R.; Mutrie, N.; Richards, J. Walking on sunshine: Scoping review of the evidence for walking and mental health. Br. J. Sports Med. 2018, 52, 800–806. [Google Scholar] [CrossRef]
- Pretty, J.; Peacock, J.; Sellens, M.; Griffin, M. The mental and physical health outcomes of green exercise. Int. J. Environ. Health Res. 2005, 15, 319–337. [Google Scholar] [CrossRef]
- Takayama, N.; Korpela, K.; Lee, J.; Morikawa, T.; Tsunetsugu, Y.; Park, B.J.; Li, Q.; Tyrvainen, L.; Miyazaki, Y.; Kagawa, T. Emotional, restorative and vitalizing effects of forest and urban environments at four sites in Japan. Int. J. Environ. Res. Public Health 2014, 11, 7207–7230. [Google Scholar] [CrossRef]
- Berman, M.G.; Jonides, J.; Kaplan, S. The cognitive benefits of interacting with nature. Psychol. Sci. 2008, 19, 1207–1212. [Google Scholar] [CrossRef]
- Bratman, G.N.; Hamilton, J.P.; Hahn, K.S.; Daily, G.C.; Gross, J.J. Nature experience reduces rumination and subgenual prefrontal cortex activation. Proc. Natl. Acad. Sci. USA 2015, 112, 8567–8572. [Google Scholar] [CrossRef] [Green Version]
- Park, B.J.; Tsunetsugu, Y.; Kasetani, T.; Hirano, H.; Kagawa, T.; Sato, M.; Miyazaki, Y. Physiological effects of Shinrin-yoku (taking in the atmosphere of the forest)--using salivary cortisol and cerebral activity as indicators. J. Physiol. Anthropol. 2007, 26, 123–128. [Google Scholar] [CrossRef] [PubMed]
- Park, B.J.; Tsunetsugu, Y.; Kasetani, T.; Kagawa, T.; Miyazaki, Y. The physiological effects of Shinrin-yoku (taking in the forest atmosphere or forest bathing): Evidence from field experiments in 24 forests across Japan. Environ. Health Prev. Med. 2010, 15, 18–26. [Google Scholar] [CrossRef]
- Cimprich, B.; Ronis, D.L. An environmental intervention to restore attention in women with newly diagnosed breast cancer. Cancer Nurs. 2003, 26, 284–292, quiz 293–294. [Google Scholar] [CrossRef] [PubMed]
- Aspinall, P.; Mavros, P.; Coyne, R.; Roe, J. The urban brain: Analysing outdoor physical activity with mobile EEG. Br. J. Sports Med. 2015, 49, 272–276. [Google Scholar] [CrossRef] [PubMed]
- Rogerson, M.; Gladwell, V.F.; Gallagher, D.J.; Barton, J.L. Influences of Green Outdoors versus Indoors Environmental Settings on Psychological and Social Outcomes of Controlled Exercise. Int. J. Environ. Res. Public Health 2016, 13, 363. [Google Scholar] [CrossRef] [PubMed]
- Rimmer, J.H.; Hsieh, K.; Graham, B.C.; Gerber, B.S.; Gray-Stanley, J.A. Barrier removal in increasing physical activity levels in obese African American women with disabilities. J. Womens Health (Larchmt) 2010, 19, 1869–1876. [Google Scholar] [CrossRef] [PubMed]
- Robbins, L.B.; Pfeiffer, K.A.; Vermeesch, A.; Resnicow, K.; You, Z.; An, L.; Wesolek, S.M. “Girls on the Move” intervention protocol for increasing physical activity among low-active underserved urban girls: A group randomized trial. BMC Public Health 2013, 13, 474. [Google Scholar] [CrossRef]
- Hurley, J.C.; Hollingshead, K.E.; Todd, M.; Jarrett, C.L.; Tucker, W.J.; Angadi, S.S.; Adams, M.A. The Walking Interventions Through Texting (WalkIT) Trial: Rationale, Design, and Protocol for a Factorial Randomized Controlled Trial of Adaptive Interventions for Overweight and Obese, Inactive Adults. JMIR Res. Protoc. 2015, 4, e108. [Google Scholar] [CrossRef] [PubMed]
- Johnson, U.; Ivarsson, A.; Parker, J.; Andersen, M.; Svetoft, I. Connection in the fresh air: A study on the benefits of participation in an electronic tracking outdoor gym exercise programme. Montenegrin J. Sports Sci. Med. 2019, 8, 61–67. [Google Scholar] [CrossRef]
- Chudyk, A.; Petrella, R.J. Effects of exercise on cardiovascular risk factors in type 2 diabetes: A meta-analysis. Diabetes Care 2011, 34, 1228–1237. [Google Scholar] [CrossRef] [PubMed]
- Perez-Lopez, F.R.; Martinez-Dominguez, S.J.; Lajusticia, H.; Chedraui, P.; The Health Outcomes Systematic Analyses Project. Effects of programmed exercise on depressive symptoms in midlife and older women: A meta-analysis of randomized controlled trials. Maturitas 2017, 106, 38–47. [Google Scholar] [CrossRef] [PubMed]
- De Brito, J.N.; Pope, Z.C.; Mitchell, N.R.; Schneider, I.E.; Larson, J.M.; Horton, T.H.; Pereira, M.A. Changes in Psychological and Cognitive Outcomes after Green versus Suburban Walking: A Pilot Crossover Study. Int. J. Environ. Res. Public Health 2019, 16, 2894. [Google Scholar] [CrossRef]
- NCCP. Commission. Next Century Conservation Plan. 2014. Available online: Nextcenturyconservationplan.org (accessed on 1 June 2019).
- Watson, D.; Clark, L.A. The PANAS-X: Manual for the positive and negative affect schedule-expanded form. In Iowa Research Online: The University of Iowa’s Institutional Repository; University of Iowa: Iowa City, IA, USA, 1999; p. 28. [Google Scholar]
- Watson, D.; Clark, L.A.; Tellegen, A. Development and validation of brief measures of positive and negative affect: The PANAS scales. J. Pers. Soc. Psychol. 1988, 54, 1063–1070. [Google Scholar] [CrossRef]
- Spielberger, C.D. State-Trait Anxiety Inventory for Adults™. 2015. Available online: http://www.mindgarden.com/145-state-trait-anxiety-inventory-for-adults#horizontalTab3 (accessed on 25 September 2015).
- Spielberger, C.D.; Vagg, P.R. Psychometric properties of the STAI: A reply to Ramanaiah, Franzen, and Schill. J. Pers. Assess 1984, 48, 95–97. [Google Scholar] [CrossRef]
- Cohen, S.; Williamson, G.M. Perceived Stress in a Probability Sample of the United-States, in the Social Psychology of Health; S. Spacapan and S. Oskamp; Sage, Inc.: Thousand Oaks, CA, USA, 1988; pp. 31–67. [Google Scholar]
- Cohen, S.; Kamarck, T.; Mermelstein, R. A global measure of perceived stress. J. Health Soc. Behav. 1983, 24, 385–396. [Google Scholar] [CrossRef]
- Kemtes, K.A.; Allen, D.N. Presentation modality influences WAIS Digit Span performance in younger and older adults. J. Clin. Exp. NeuroPsychol. 2008, 30, 661–665. [Google Scholar] [CrossRef]
- Cowan, N. The magical number 4 in short-term memory: A reconsideration of mental storage capacity. Behav. Brain Sci. 2001, 24, 87–114, discussion 114–185. [Google Scholar] [CrossRef] [Green Version]
- Powell, D.H.; Hiatt, M.D. Auditory and Visual Recall of Forward and Backward Digit Spans. Percept. Mot. Skills 1996, 82 (Suppl. 3), 1099–1103. [Google Scholar] [CrossRef]
- Emfield, A.G.; Neider, M.B. Evaluating visual and auditory contributions to the cognitive restoration effect. Front. Psychol. 2014, 5, 548. [Google Scholar] [CrossRef] [PubMed] [Green Version]
- Van Hedger, S.C.; Nusbaum, H.C.; Clohisy, L.; Jaeggi, S.M.; Buschkuehl, M.; Berman, M.G. Of cricket chirps and car horns: The effect of nature sounds on cognitive performance. Psychon. Bull. Rev. 2019, 26, 522–530. [Google Scholar] [CrossRef] [PubMed]
- Faul, F.; Erdfelder, E.; Lang, A.G.; Buchner, A. G*Power 3: A flexible statistical power analysis program for the social, behavioral, and biomedical sciences. Behav. Res. Methods 2007, 39, 175–191. [Google Scholar] [CrossRef] [PubMed]
- Faul, F.; Erdfelder, E.; Buchner, A.; Lang, A.G. Statistical power analyses using G*Power 3.1: Tests for correlation and regression analyses. Behav. Res. Methods 2009, 41, 1149–1160. [Google Scholar] [CrossRef] [PubMed] [Green Version]
- Cohen, J. Statistical Power Analysis for the Behavioral Sciences, 2nd ed.; Routledge Academic: New York, NY, USA, 1988. [Google Scholar]
- Ranganathan, P.; Pramesh, C.S.; Aggarwal, R. Common pitfalls in statistical analysis: Intention-to-treat versus per-protocol analysis. Perspect. Clin. Res. 2016, 7, 144–146. [Google Scholar] [CrossRef]
- Bolker, B.M.; Brooks, M.E.; Clark, C.J.; Geange, S.W.; Poulsen, J.R.; Stevens, M.H.H.; White, J.-S.S. Generalized linear mixed models: A practical guide for ecology and evolution. Trends Ecol. Evol. 2009, 24, 127–135. [Google Scholar] [CrossRef]
- Goad, C.L.; Johnson, D.E. Crossover experiments: A comparison of ANOVA tests and alternative analyses. J. Agric. Biol. Environ. Stat. 2000, 5, 69–87. [Google Scholar] [CrossRef]
- Senn, S. Cross-over Trials in Clinical Research, 2nd ed.; John Wiley & Sons, Ltd.: Hoboken, NJ, USA, 2002. [Google Scholar]
- Harrington, D.; D’Agostino, R.B.; Gatsonis, C.; Hogan, J.W.; Hunter, D.J.; Normand, S.-L.T.; Drazen, J.M.; Hamel, M.B. New Guidelines for Statistical Reporting in the Journal. N. Engl. J. Med. 2019, 381, 285–286. [Google Scholar] [CrossRef]
- Amrhein, V.; Greenland, S.; McShane, B. Scientists rise up against statistical significance. Nature 2019, 567, 305–307. [Google Scholar] [CrossRef] [Green Version]
- Hintze, J. NCSS 8. Number Cruncher Statistical Software. Citation for NCSS 8. 2012. Available online: https://www.ncss.com/ (accessed on 12 June 2019).
- Saarinen, F. Using mixed models in a cross-over study with repeated measurements within periods. In Mathematical Statistics; Department of Mathematics, Stockholm University: Stockholm, Sweden, 2004; Available online: http://www.math.su.se/matstat (accessed on 24 September 2019).
- Fox, K.R. The influence of physical activity on mental well-being. Public Health Nutr. 1999, 2, 411–418. [Google Scholar] [CrossRef] [Green Version]
- Heath, A.C.; Howells, W.; Kirk, K.M.; Madden, P.A.; Bucholz, K.K.; Nelson, E.C.; Slutske, W.S.; Statham, D.J.; Martin, N.G. Predictors of non-response to a questionnaire survey of a volunteer twin panel: Findings from the Australian 1989 twin cohort. Twin Res. 2001, 4, 73–80. [Google Scholar] [CrossRef]
- Guo, X.; Vittinghoff, E.; Olgin, J.E.; Marcus, G.M.; Pletcher, M.J. Volunteer Participation in the Health eHeart Study: A Comparison with the US Population. Sci. Rep. 2017, 7, 1956. [Google Scholar] [CrossRef] [Green Version]
- Todd, M.; Davis, K.E.; Cafferty, T.P. Who volunteers for adult development research? Research findings and practical steps to reach low volunteering groups. Int. J. Aging Hum. Dev. 1983, 18, 177–184. [Google Scholar] [CrossRef]
- Senn, C.Y.; Desmarais, S. Are our recruitment practices for sex studies working across gender? The effect of topic and gender of recruiter on participation rates of university men and women. J. Sex Res. 2001, 38, 111–117. [Google Scholar] [CrossRef]
- Demir, M.; Haynes, A.; Orthel-Clark, H.; Ozen, A. Volunteer Bias in Research on Friendship Among Emerging Adults. Emerg. Adulthood 2017, 5, 53–68. [Google Scholar] [CrossRef]
- Husk, K.; Lovell, R.; Cooper, C.; Stahl-Timmins, W.; Garside, R. Participation in environmental enhancement and conservation activities for health and well-being in adults: A review of quantitative and qualitative evidence. Cochrane Database Syst. Rev. 2016, 5, CD010351. [Google Scholar] [CrossRef] [PubMed]
- Pretty, J.; Peacock, J.; Hine, R.; Sellens, M.; South, N.; Griffin, M. Green exercise in the UK countryside: Effects on health and psychological well-being, and implications for policy and planning. J. Environ. Plan. Manag. 2007, 50, 211–231. [Google Scholar] [CrossRef]
- Lee, J.; Tsunetsugu, Y.; Takayama, N.; Park, B.J.; Li, Q.; Song, C.; Komatsu, M.; Ikei, H.; Tyrvainen, L.; Kagawa, T.; et al. Influence of forest therapy on cardiovascular relaxation in young adults. Evid. Based Complement. Alternat. Med. 2014, 2014, 834360. [Google Scholar] [CrossRef]
- Hartig, T.; Evans, G.W.; Jamner, L.D.; Davis, D.S.; Garling, T. Tracking restoration in natural and urban field settings. J. Environ. Psychol. 2003, 23, 109–123. [Google Scholar] [CrossRef]
- Perkins, S.; Searight, H.R.; Ratwik, S. Walking in a Natural Winter Setting to Relieve Attention Fatigue: A Pilot Study. Psychology 2011, 2, 777–780. [Google Scholar] [CrossRef] [Green Version]
- Fuegen, K.; Breitenbecher, K.H. Walking and Being Outdoors in Nature Increase Positive Affect and Energy. Ecopsychology 2018, 10, 14–25. [Google Scholar] [CrossRef]
- French, C.C.; Beaumont, J.G. Microcomputer Version of a Digit Span Test in Clinical Use. Interact. Comput. 1992, 4, 163–178. [Google Scholar] [CrossRef]
- Lakens, D. Calculating and reporting effect sizes to facilitate cumulative science: A practical primer for t-tests and ANOVAs. Front. Psychol. 2013, 4, 863. [Google Scholar] [CrossRef] [PubMed]
- Sallis, J.F.; Spoon, C.; Cavill, N.; Engelberg, J.K.; Gebel, K.; Parker, M.; Thornton, C.M.; Lou, D.; Wilson, A.L.; Cutter, C.L.; et al. Co-benefits of designing communities for active living: An exploration of literature. Int. J. Behav. Nutr. Phys. Act. 2015, 12, 30. [Google Scholar] [CrossRef] [PubMed]
- Gascon, M.; Triguero-Mas, M.; Martinez, D.; Dadvand, P.; Forns, J.; Plasencia, A.; Nieuwenhuijsen, M.J. Mental health benefits of long-term exposure to residential green and blue spaces: A systematic review. Int. J. Environ. Res. Public Health 2015, 12, 4354–4379. [Google Scholar] [CrossRef] [PubMed]
- Nielsen, T.S.; Hansen, K.B. Do green areas affect health? Results from a Danish survey on the use of green areas and health indicators. Health Place 2007, 13, 839–850. [Google Scholar] [CrossRef]
- Schipperijn, J.; Ekholm, O.; Stigsdotter, U.K.; Toftager, M.; Bentsen, P.; Kamper-Jorgensen, F.; Randrup, T.B. Factors influencing the use of green space: Results from a Danish national representative survey. Landsc. Urban Plan. 2010, 95, 130–137. [Google Scholar] [CrossRef]
- Annerstedt van den Bosch, M.; Mudu, P.; Uscila, V.; Barrdahl, M.; Kulinkina, A.; Staatsen, B.; Swart, W.; Kruize, H.; Zurlyte, I.; Egorov, A.I. Development of an urban green space indicator and the public health rationale. Scand. J. Public Health 2016, 44, 159–167. [Google Scholar] [CrossRef]
- Beute, F.; de Kort, Y.A.W. The natural context of wellbeing: Ecological momentary assessment of the influence of nature and daylight on affect and stress for individuals with depression levels varying from none to clinical. Health Place 2018, 49, 7–18. [Google Scholar] [CrossRef]
- Razani, N.; Kohn, M.A.; Wells, N.M.; Thompson, D.; Hamilton Flores, H.; Rutherford, G.W. Design and evaluation of a park prescription program for stress reduction and health promotion in low-income families: The Stay Healthy in Nature Everyday (SHINE) study protocol. Contemp Clin. Trials 2016, 51, 8–14. [Google Scholar] [CrossRef]
- Stigsdotter, U.K.; Grahn, P. Stressed individuals’ preferences for activities and environmental characteristics in green spaces. Urban For. Urban Green. 2011, 10, 295–304. [Google Scholar] [CrossRef]
- Pretty, J.; Rogerson, M.; Barton, J. Green Mind Theory: How Brain-Body-Behaviour Links into Natural and Social Environments for Healthy Habits. Int. J. Environ. Res. Public Health 2017, 14, 706. [Google Scholar] [CrossRef] [PubMed]
- Miller, D. A Prescription for Nature. [Web] 2014. Available online: http://www.npca.org/news/magazine/all-issues/2014/spring/a-prescription-for-nature.html (accessed on 5 November 2014).
- Handcock, P.; Jenkins, C. The Green Prescription: A field of dreams? N. Z. Med. J. 2003, 116, U713. [Google Scholar] [PubMed]
- Anonymous, A prescription for better health: Go alfresco. Spending time outside might have some health benefits--and the ‘greening’ of exercise might have some more. Harv. Health Lett. 2010, 35, 1–2.
- Leung, W.; Ashton, T.; Kolt, G.S.; Schofield, G.M.; Garrett, N.; Kerse, N.; Patel, A. Cost-effectiveness of pedometer-based versus time-based Green Prescriptions: The Healthy Steps Study. Aust. J. Prim. Health 2012, 18, 204–211. [Google Scholar] [CrossRef] [PubMed]


| Characteristic | Sequence of Walks | Comparison | |
|---|---|---|---|
| Road to Forest (RtF) (n = 20) | Forest to Road (FtR) (n = 18) | Significance Level (p) | |
| Sex, male (n (%)) | 10 (50%) | 8 (44%) | 0.73 |
| Age in years (Mean (SD)) | 24.6 (5.3) | 21.2 (2.9) | 0.02 |
| Education level (n = 37) 1 | |||
| Some college | 11 | 12 | 0.46 |
| College graduate | 5 | 4 | 0.84 |
| Graduate school | 4 | 1 | 0.19 |
| Employment status (n = 40) 2 | |||
| Full-time student | 12 | 14 | 0.24 |
| Part-time employee | 3 | 7 | 0.1 |
| Full-time employee | 4 | 0 | 0.05 |
| Ethnicity (n = 35)1 | |||
| African American | 1 | 1 | 0.97 |
| Asian | 12 | 8 | 0.079 |
| Hispanic | 2 | 2 | 1 |
| White non-Hispanic | 5 | 7 | 1 |
| Household income (n = 31) 1 | |||
| <$50,000 | 10 | 6 | 0.3 |
| $50,000–$99,999 | 4 | 6 | 0.35 |
| >$100,000 | 4 | 3 | 0.79 |
| Childhood home location (n = 31) 1 | |||
| Rural | 3 | 0 | 0.09 |
| Suburban | 9 | 11 | 0.32 |
| Urban | 8 | 6 | 0.67 |
| Current home location (n = 31) 1 | |||
| Suburban | 10 | 13 | 0.16 |
| Urban | 10 | 4 | 0.08 |
| Roadside First (Sequence RtF) | Forest First (Sequence FtR) | Significance Level (p) 1 | ||
|---|---|---|---|---|
| Outcome Measures | Reference Values Ages 18–35 yrs | Mean (95%CI) | Mean (95%CI) | |
| Positive affect (10–50) 2 | 25.3–29 3 | 29.8 (25.8, 33.9) | 32.1 (29.0, 35.3) | 0.36 |
| Negative affect (10–50) 2 | 15.2–15.8 3 | 14.8 (11.8, 17.8) | 14.6 (11.2, 18.0) | 0.93 |
| State anxiety (20–80) 2 | 37.62 3 | 36.9 (31.4, 42.4) | 35.0 (29.2, 40.8)) | 0.62 |
| Perceived stress (0–40) 2 | 14.2 3 | 15.1 (11.3, 18.8) | 13.7 (10.8, 16.6) | 0.56 |
| Backward digit span (visual) (0–14) 2 | 6.5–7.8 3 | 7.3 (6.0, 8.7) | 6.9 (5.6, 8.3) | 0.68 |
| Dependent Variable (Change = Post Score − Pre Score) | Intervention Effect | ||
|---|---|---|---|
| F | DF | p | |
| Positive Affect | 2.5 | 3, 70.3 | 0.07 |
| Negative Affect | 3.5 | 6, 69.5 | 0.02 |
| STAI-State | 3.1 | 3, 57.2 | 0.04 |
| PSS | 2.9 | 3, 72.5 | 0.04 |
| Backward Digit Span (visual) | 0.67 | 3, 74.1 | 0.57 |
© 2019 by the authors. Licensee MDPI, Basel, Switzerland. This article is an open access article distributed under the terms and conditions of the Creative Commons Attribution (CC BY) license (http://creativecommons.org/licenses/by/4.0/).
Share and Cite
Koselka, E.P.D.; Weidner, L.C.; Minasov, A.; Berman, M.G.; Leonard, W.R.; Santoso, M.V.; de Brito, J.N.; Pope, Z.C.; Pereira, M.A.; Horton, T.H. Walking Green: Developing an Evidence Base for Nature Prescriptions. Int. J. Environ. Res. Public Health 2019, 16, 4338. https://0-doi-org.brum.beds.ac.uk/10.3390/ijerph16224338
Koselka EPD, Weidner LC, Minasov A, Berman MG, Leonard WR, Santoso MV, de Brito JN, Pope ZC, Pereira MA, Horton TH. Walking Green: Developing an Evidence Base for Nature Prescriptions. International Journal of Environmental Research and Public Health. 2019; 16(22):4338. https://0-doi-org.brum.beds.ac.uk/10.3390/ijerph16224338
Chicago/Turabian StyleKoselka, Elizabeth P.D., Lucy C. Weidner, Arseniy Minasov, Marc G. Berman, William R. Leonard, Marianne V. Santoso, Junia N. de Brito, Zachary C. Pope, Mark A. Pereira, and Teresa H. Horton. 2019. "Walking Green: Developing an Evidence Base for Nature Prescriptions" International Journal of Environmental Research and Public Health 16, no. 22: 4338. https://0-doi-org.brum.beds.ac.uk/10.3390/ijerph16224338