Article

Modification of the Association between Visual Impairment and Mortality by Physical Activity: A Cohort Study among the Korean National Health Examinees

1
Division of Public Health and Preventive Medicine, Seoul National University Hospital, Seoul 03080, Korea
2
Department of Preventive Medicine, Seoul National University College of Medicine, Seoul 03080, Korea
3
Department of Ophthalmology, Seoul National University Bundang Hospital, Seoul National University College of Medicine, Seongnam 13620, Korea
4
Department of Psychiatry, Kyung Hee University Hospital, Seoul 02447, Korea
5
Department of Family Medicine, Seoul National University College of Medicine, Seoul 03080, Korea
6
Department of Psychiatry and Behavioral Science, Seoul National University College of Medicine, Seoul 03080, Korea
7
Department of Forensic Medicine, Seoul National University College of Medicine, Seoul 03080, Korea
*
Author to whom correspondence should be addressed.
Int. J. Environ. Res. Public Health 2019, 16(22), 4386; https://0-doi-org.brum.beds.ac.uk/10.3390/ijerph16224386
Submission received: 30 July 2019 / Revised: 6 November 2019 / Accepted: 8 November 2019 / Published: 10 November 2019

Abstract

:
The association between visual impairment and higher mortality remains unclear. In addition, evidence is lacking on the interaction between visual function and physical activity on mortality. We used data of individuals with no disability or with visual impairment among those who participated in the National Health Screening Program in Korea in 2009 or 2010. We constructed Cox proportional hazard models adjusted for potential confounders to evaluate the independent association between visual impairment and mortality. More severe visual impairment was associated with higher all-cause mortality (p-value for trend = 0.03) and mortality due to cardiovascular diseases (p-value for trend = 0.02) and that due to other diseases (p-value for trend = 0.01). We found an interaction on an additive scale between visual impairment and no physical activity on all-cause mortality (relative excess risk due to interaction = 1.34, 95% confidence interval: 0.37, 2.30, p-value = 0.01). When we stratified the study population by physical activity, the association between visual impairment and mortality was only found among individuals who did not engage in regular physical activity (p-value for trend = 0.01). We found an independent association between visual impairment and mortality and modification of this association by physical activity.

1. Introduction

Visual impairment lowers the health-related quality of life and independence in activities of daily living [1,2] and leads to adverse health outcomes such as depression and fractures, resulting in a considerable socioeconomic burden [3]. Globally, in 2015, 441.1 million people were estimated to have visual impairment. Due to worldwide population aging, the number of people with visual impairment has been sharply increasing (35.5% increase for moderate or severe visual impairment from 1990 to 2015) [4]. Visual impairment has emerged as a public health concern during the last decades.
Therefore, the effects of visual impairment on health, physical activity, chronic diseases, and mortality should be elucidated to mitigate its burden on individuals, communities, and the healthcare system. However, unlike others, the effect of visual impairment on mortality has puzzled researchers; some studies have reported an increased mortality in individuals with visual impairment [5,6,7,8,9,10,11], while others have not [12,13,14,15,16]. In addition, as visual impairment exacerbates the impact of chronic conditions on health-related quality of life [1], the association between visual impairment and mortality should be investigated considering the possible interaction between health-related conditions including physical activity, which is one of the modifiable factors affecting mortality in individuals with deteriorated vision. Physical activity has been shown to lower mortality in various populations, and, therefore, the association between visual function and mortality may differ by physical activity status. However, evidence is lacking on the interaction between visual function and physical activity with regard to mortality [5].
Therefore, in the present study, we hypothesized that visual impairment would be independently associated with increased mortality and that physical activity would modify the association between visual function and mortality. We evaluated these hypotheses using a cohort of the Korean national health examinees.

2. Materials and Methods

2.1. Study Participants

We used data from the National Health Insurance Service-National Health Screening Cohort (NHIS-HEALS) of the Republic of Korea, which has been constructed by the NHIS to enhance public research. The study protocol and detailed information of the NHIS-HEALS has been published elsewhere [17]. In brief, a random sample of the participants in the National Health Screening Program, which is free and invites all residents aged ≥40 years in the Republic of Korea at least every 2 years, constitutes this cohort (n = 514,866). Information on sociodemographic factors, lifestyle, past medical history, physical examinations, clinical laboratory test results, and mortality are included in the NHIS-HEALS.
In the present study, we used data of 362,285 individuals who participated in the National Health Screening Program in 2009 or 2010 because the health screening program was reorganized in 2009 and the number of survey items increased from 33 to 47 in that year. We further excluded individuals with physical (n = 687), auditory (n = 463), language (n = 209), intellectual (n = 117), and mental (n = 93) disabilities, brain lesions (n = 328), and other types of disability (including developmental, kidney, heart, and liver disabilities) (n = 404), leading to a final sample size of 359,984 individuals. We used information on disabilities from the National Handicapped Registry, which was provided to researchers by the NHIS-HEALS. The final study population comprised 359,523 individuals with no disabilities and 461 with visual impairment.
The Ethics Review Board of Seoul National University Hospital reviewed and approved the protocol of this study (E-1804-045-936). We conducted the present study using de-identified data (NHIS-HEALS) released to researchers for the purpose of public research.

2.2. Visual Impairment

In the Republic of Korea, individuals diagnosed with visual impairment by a medical doctor are registered in the National Handicapped Registry to receive disability benefits. Visual impairment is assessed by the diagnosing physicians on six grades according to severity [18]. Although individuals with visual impairment were assessed as 6 grades (grade 1 to grade 6) in the National Handicapped Registry, the NHIS-HEALS provides information on the grade of visual impairment only as “severe” (grade 1 or 2) and “mild” (grades 3–6) due to confidentiality issue. Because individuals who have a best-corrected visual acuity of ≤0.02 (20/1000) in the better-seeing eye are classified as grade 1 and those with best-corrected visual acuity of 0.02–0.04 (20/1000–20/500) in the better-seeing eye as grade 2, severe visual impairment was defined as best-corrected visual acuity ≤0.02 (20/1000) in the better-seeing eye in the present study. Meanwhile, mild visual impairment was defined as a best-corrected visual acuity of 0.06–0.2 (6/100–20/100) in the better-seeing eye, ≤0.02 (20/1000) in the worse-seeing eye, or any visual field defects (grades 3–6) in the present study.
We coded a variable for visual impairment as 0 (no visual impairment, reference), 1 (mild visual impairment), and 2 (severe visual impairment) and used it in further analyses as an independent variable.

2.3. Physical Activity

Information on physical activity is obtained in the NHIS-HEALS using a self-reported questionnaire inquiring on the frequency of leisure-time exercise ≥20 min, which causes rapid breathing (e.g., running, aerobics, fast cycling, or mountain climbing), corresponding to vigorous-intensity physical activity. We categorized the frequency of physical activity (day/week) as none (0 day/week), 1 or 2 days/week, 3 or 4 days/week, or ≥5 days/week and used the categorized frequency of physical activity in further analyses.

2.4. All-Cause and Cause-Specific Mortality

We obtained information on dates and causes of death occurring between 1 January 2010 and 31 December 2013. Statistics Korea provided the information on mortality, and the NHIS merged this information with the other data using personal identification numbers. We categorized cause of death as death caused by cardiovascular disease (defined as International Classification of Disease, 10th Revision [ICD-10] codes I20–I25, I50, and I60–I70), cancer (C00–C97), and other causes, according to a previous study [6].

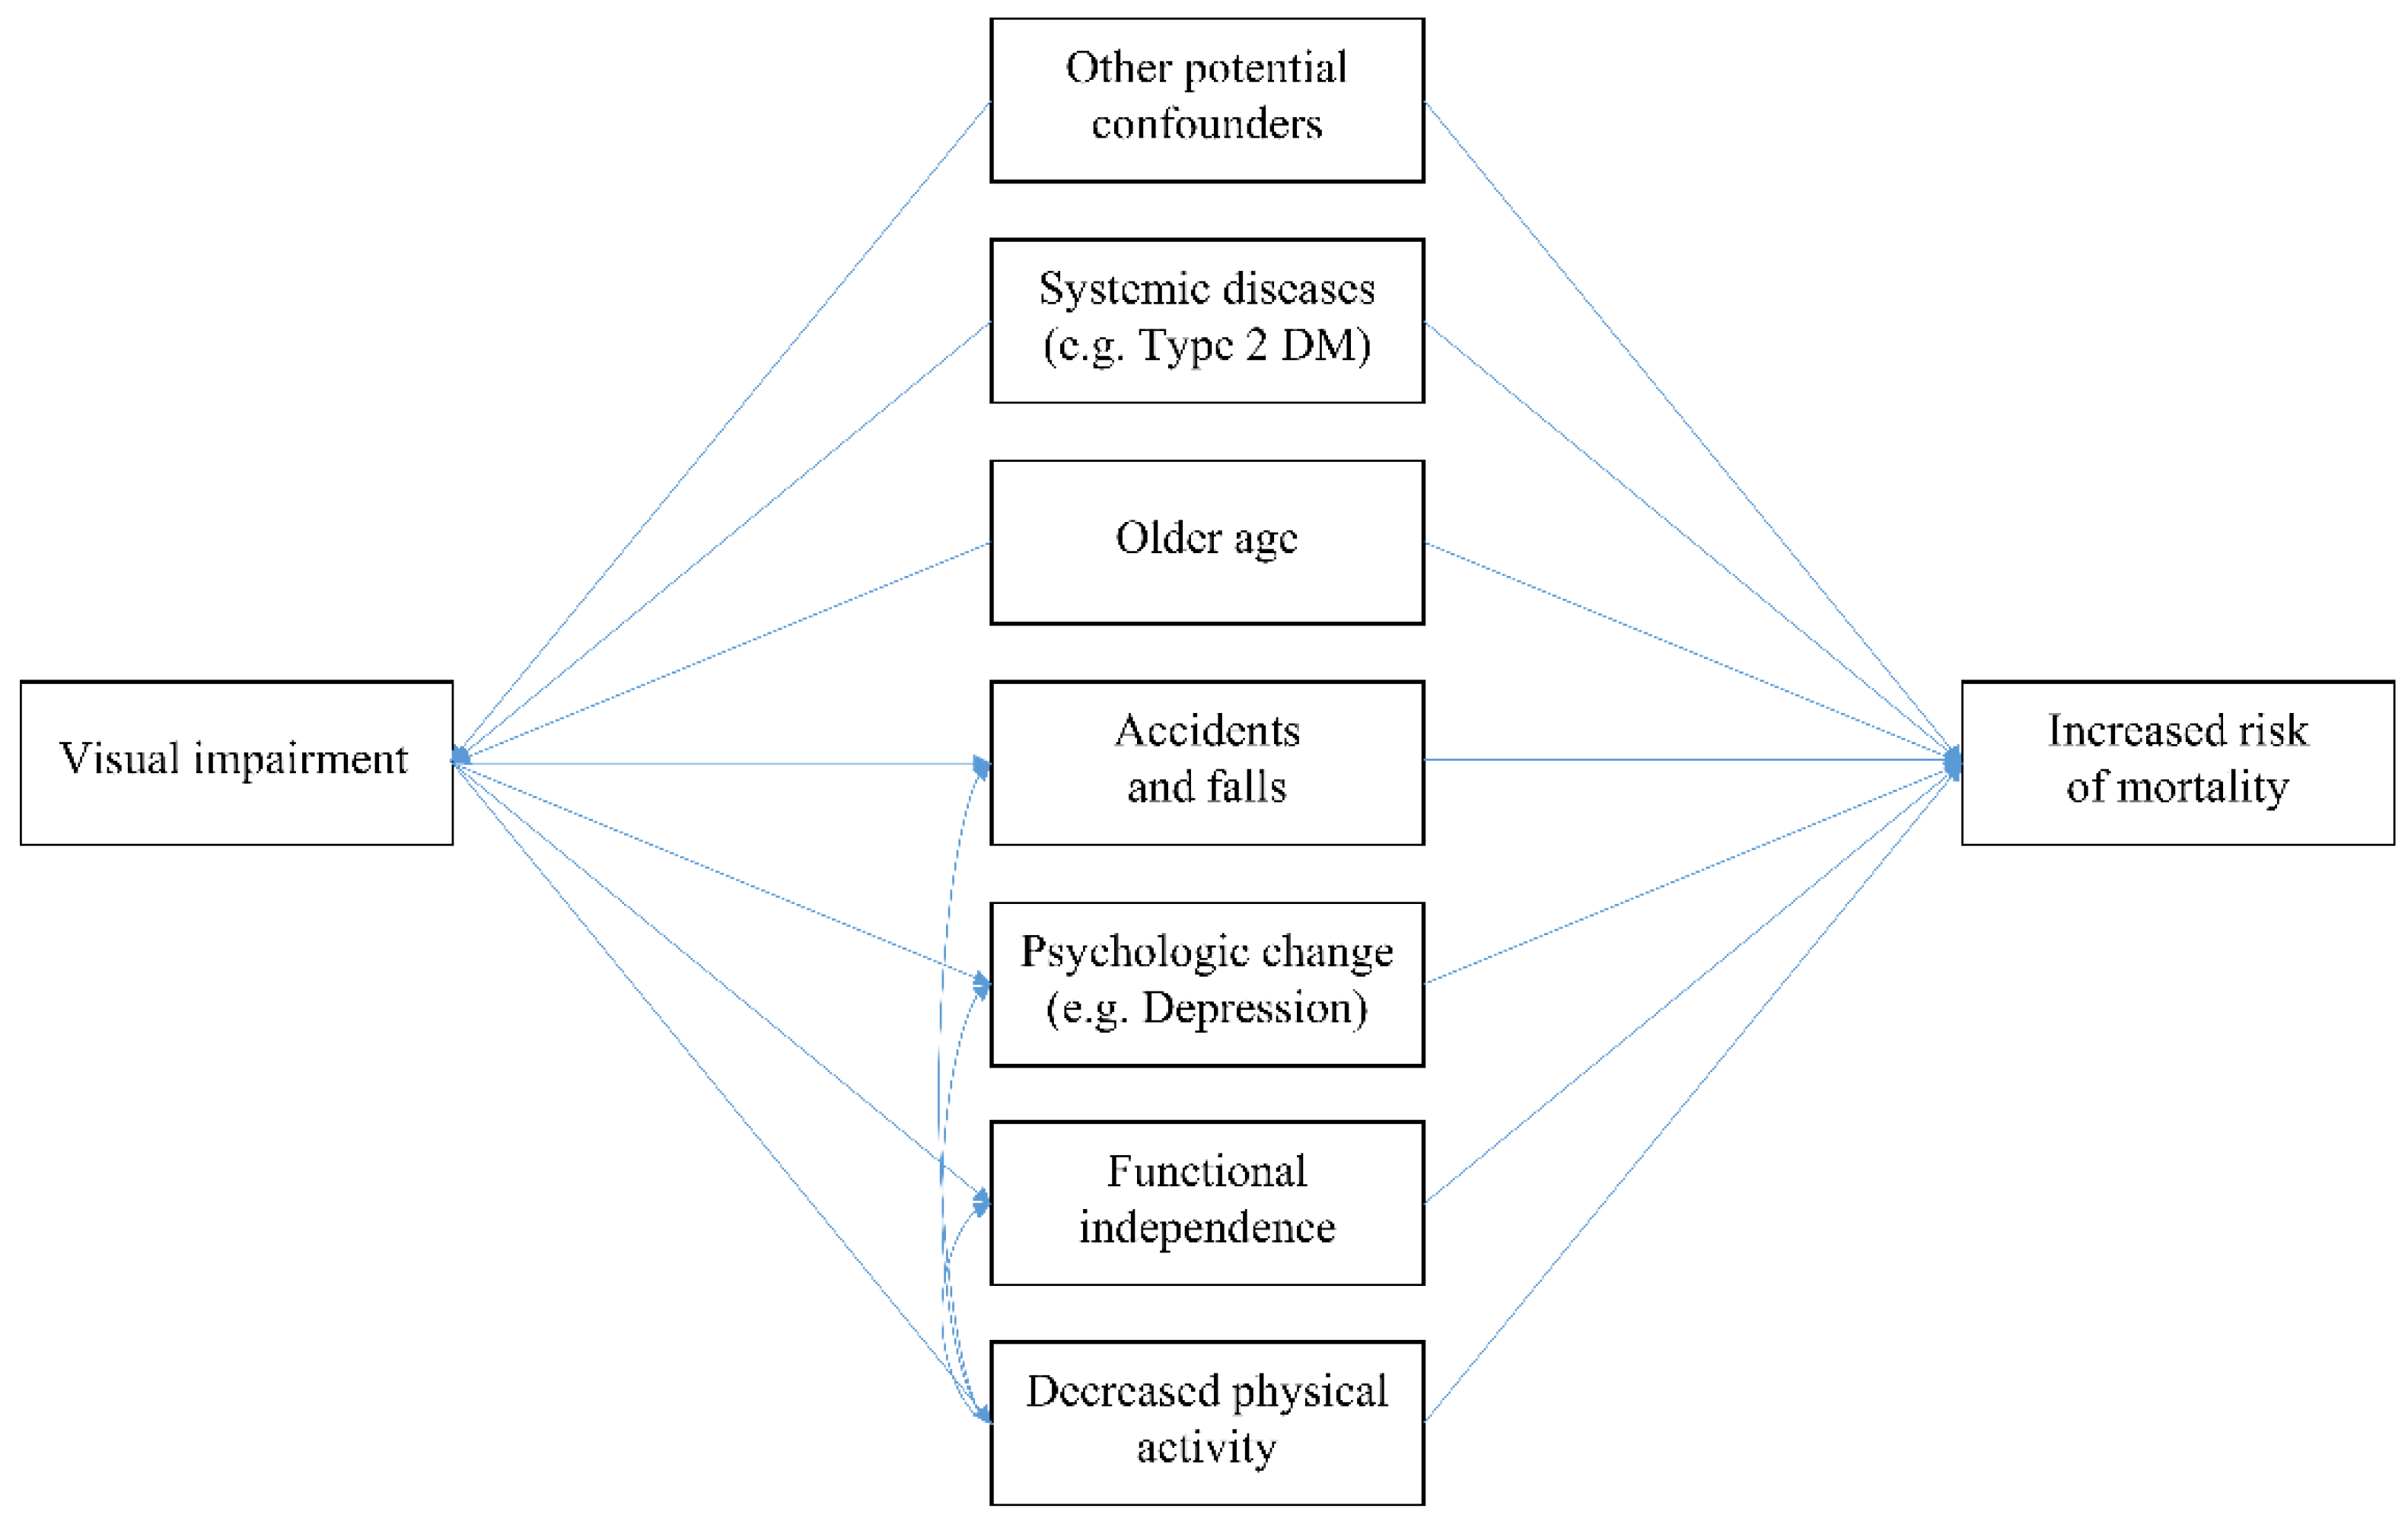
2.5. Assumed Causal Pathway and Adjusted Covariates

We assumed a causal pathway for the association between visual impairment and mortality as depicted in Figure 1, based on previous studies [5,6,7,8,9,12,13,14,19,20,21,22], to assess the independent association by identifying potential confounders and mediators. In brief, we selected older age, systematic diseases and conditions (body mass index, waist circumference, systolic and diastolic blood pressure, serum levels of fasting glucose, creatinine, aspartate aminotransferase, alanine aminotransferase, and gamma glutamyltransferase, and history of stroke, heart disease, hypertension, type 2 diabetes, dyslipidemia, and other diseases including cancer), income, residing area, and lifestyle factors (smoking status and alcohol consumption) as potential confounders, which could affect both visual function and mortality and possibly bias the results. After identifying the potential confounders, we adjusted them in further analyses. We did not adjust for physical activity in the main models because physical activity may mediate the association between visual function and mortality partially (Figure 1) [5,19,21] and the association between visual impairment and mortality could be underestimated when adjusting for physical activity. Detailed information on selected covariates is presented in the Supplementary Material.

2.6. Statistical Analysis

After visually checking that survival curves did not cross by visual function (no visual impairment, mild visual impairment, and severe visual impairment) using the Kaplan–Meier curves (Supplemental Material Figure S1), we constructed Cox proportional hazard models adjusted for potential confounders to evaluate the association between visual impairment and all-cause mortality. We also constructed cause-specific proportional hazard models adjusted for the same covariates to assess the associations between visual impairment and cause-specific mortality (mortality due to cardiovascular disease, cancer, or other diseases). We estimated p-values for trend by treating the variable for visual impairment as a continuous variable, not as an ordinal one. We also conducted the same analyses further adjusted for physical activity (none, 1–2, 3–4, or ≥5 times/week).
We then conducted stratified analysis using the same Cox models by the household income levels (0–3 deciles as lower income level, 4–7 as middle income level, and 8–10 as higher income level), sex, and body mass index (≥23 kg/m2 and <23 kg/m2) to identify vulnerable groups for decreased visual function.
We investigated whether physical activity would modify the association between visual impairment and mortality. It has been argued that interaction on an additive scale, rather than that on a multiplicative scale, is more suitable for evaluating biological interactions [23]. Therefore, we estimated a measure for additive interaction (i.e., relative excess risk due to interaction (RERI)). If the risk of certain outcome for exposure X1 is A and the risk of outcome for exposure X2 is B, then the RERI is greater than zero in case the risk of outcome noted as C is greater than A + B when simultaneously exposed to X1 and X2 (RERI = C − (A + B)).
To conduct this analysis, we re-categorized physical activity as no or yes (≥once/week) and assigned yes (≥once/week) as a reference because it has been reported that preventive factors (e.g., physical activity) should be recoded as risk factors to adequately estimate measures for additive interaction [24]. We also re-categorized visual impairment as no or yes (collapsed the categories for severe and mild visual impairment) and estimated the RERI between visual impairment (no or yes) and physical activity (no or yes) using logistic regression models adjusted for the same covariates. We assessed the null hypothesis that RERI = 0 using the Z-test and estimated the confidence interval (CI) and p-value [24]. Because a RERI score >0 denotes greater risk than the sum of each main effect in the case when exposures occur simultaneously, in the present study, a RERI score >0 can be interpreted as higher mortality due to interaction compared to the additive effects of both visual impairment and no physical activity. We assessed the association between visual impairment and mortality in each stratum stratified by physical activity (none and ≥once/week).
In sensitivity analyses, we performed analyses after excluding individuals diagnosed with vision-threatening conditions such as detachment of retinal pigment epithelium (H33.0, H33.1, H33.2, H33.3, H33.4, and H33.5), central retinal artery occlusion (H34.1), degeneration of the macula and posterior pole (H35.3), optic neuropathy (H46), visual disturbances (H53.0, H53.2, H53.2, H53.3, H53.4, H53.5, H53.6, H53.8, and H53.9), and visual impairment (H54.0, H54.1, H54.2, H54.3, H54.4, H54.6, and H54.9) between 2002 and 2010 (n = 25,782) among those classified in the no visual impairment group. Finally, we conducted analyses further including individuals with physical, auditory, language, intellectual, and mental disabilities, brain lesions, and other types of disability classified in the no visual impairment group.
We performed the analyses using SAS version 9.4 (SAS Institute Inc., Cary, NC, USA) and R version 3.5.2 (The Comprehensive R Archive Network, Vienna, Austria; http://cran.r-project.org).

3. Results

We analyzed the data of 359,523 individuals with no visual impairment, 328 with mild visual impairment, and 133 with severe visual impairment in the present study. Compared with individuals with no visual impairment, those with visual impairment were more likely to be older (71.5 years vs. 59.0 years), not exercise regularly (78.4% vs. 59.3%), and have history of stroke (6.5% vs. 1.8%), heart disease (8.4% vs. 4.7%), hypertension (51.3% vs. 36.5%), and type 2 diabetes (21.2% vs. 12.1%) (Table 1).
Because only 461 individuals with visual impairment were included compared with 359,523 with no visual impairment, we controlled for extensive aforementioned covariates in further analyses, to increase the comparability between individuals with no visual impairment and those with visual impairment. After adjusting for potential confounders, more severe visual impairment was associated with higher all-cause mortality (p-value for trend = 0.03) and mortality due to cardiovascular (p-value for trend = 0.02) and due to other diseases (p-value for trend = 0.01). Severe visual impairment was associated with all-cause mortality (hazard ratio [HR] = 1.90, 95% CI: 1.08, 3.35) and mortality due to cardiovascular disease (HR = 1.84, 95% CI: 1.04, 3.23) compared with no visual impairment (Table 2). When we conducted analyses further adjusted for physical activity, there were no marked changes in the results (Table 2).
We conducted stratified analyses by household income levels, sex, and body mass index to identify vulnerable populations for visual impairment. When we stratified the analyses by household income level, more severe visual impairment was associated with higher all-cause mortality among those with lower income levels (p-value for trend = 0.01) but not among those with middle (p-value for trend = 0.79) or higher income levels (p-value for trend = 0.21). We found the association between severe visual impairment and all-cause mortality among those with lower income levels (HR = 3.63, 95% CI: 1.36, 9.73) but not with those with middle (HR = 1.67, 95% CI: 0.63, 4.48) or higher income levels (HR = 1.39, 95% CI: 0.52, 3.72) (Figure 2).
When we further stratified the study population with lower income levels by sex and body mass index, more severe visual impairment was associated with higher all-cause mortality among women with lower income levels (p-value for trend = 0.01) and individuals with lower income levels and a body mass index ≥23 kg/m2 (p-value for trend = 0.01). The association between severe visual impairment and all-cause mortality was found among women with lower income levels (HR = 3.95, 95% CI: 1.25, 12.46) but not among men with lower income levels (HR = 2.52, 95% CI: 0.35, 18.05). In addition, the association between severe visual impairment and all-cause mortality was also found among individuals with lower income levels and a body mass index ≥23 kg/m2 (HR = 4.64, 95% CI: 1.15, 18.74) but not among those with lower income levels and a body mass index <23 kg/m2 (HR = 3.18, 95% CI: 0.79, 12.87) (Figure 2). The confidence intervals were wider in these analyses, because we further stratified the lower income group by sex or body mass index and, therefore, the sample size in each stratum was smaller.
We found an interaction on an additive scale between visual impairment and no physical activity on all-cause mortality (RERI = 1.34, 95% CI: 0.37, 2.30, p-value = 0.01). When we stratified the study population by physical activity, an association between visual impairment and mortality was found among individuals who did not engage in regular physical activity (p-value for trend = 0.01), but not among those who engaged in regular physical activity (p-value for trend = 0.41) (Table 3).
When we excluded individuals diagnosed with possibly vision-threatening conditions among those classified in the no visual impairment group, the results were robust (Supplementary Material Table S1). The results were also robust in the analyses including individuals with physical, auditory, language, intellectual, and mental disabilities, brain lesions, and other types of disability (Supplementary Material Table S2).

4. Discussion

We found an independent association between visual impairment and mortality after adjusting for potential confounders, which was stronger among individuals with lower income levels. However, when we stratified the study population by physical activity, the association between visual impairment and mortality was not found among individuals who engaged in regular physical activity.
Previous studies have produced inconsistent results regarding the association between visual impairment and mortality, with some studies reporting the association [5,6,7,8,9,10,11], while other studies reporting no association [12,13,14,15,16]. This inconsistency may be due to differences in various factors, such as the sociodemographic features of the study population, the assessment method of visual function and mortality, study design, sample size, and follow-up period. Because various factors could confound or mediate the association (Figure 1), inadequate selection of covariates and specification of analytical models may also contribute to the inconsistency (e.g., adjustment of mediating factors, such as depressive symptoms and falls) [5,6,7,8,9,10,11,12,13,14,15,16]. In the present study, we performed analyses adjusted for potential confounders (older age, systemic diseases and conditions, and other potential confounders) and not mediators based on carefully assumed pathways (association mediated by increased accidents and falls [25], psychological change, such as depression [26], functional independence [27], and decreased physical activity [28]) (Figure 1). Therefore, the present study provides additional evidence for the independent association between visual impairment and mortality. However, although these pathways can be affected by social support and resource availability, and therefore, income levels, to our knowledge, no studies have reported a stronger association of visual impairment and mortality in lower income levels. Further studies are warranted to confirm the results of the present study.
Although physical activity has been associated with overall health, well-being, and decreased mortality [29,30] and reportedly individuals with visual impairment and blindness have lower physical activity levels [19,31,32], to our knowledge, only one study investigated the interaction between visual impairment and physical activity on mortality [5]. In that study, conducted with a prospective cohort in Norway, the mortality risk for both visual impairment and no physical activity was much higher than the sum of the mortality risk for only visual impairment and the mortality risk for only no physical activity. This departure from additivity was most substantial among those aged <60 years [5]. In addition, few studies have evaluated the association between physical activity and decreased mortality among individuals with visual impairment [28,33]. The results of the present study are consistent with the results of these previous studies [5,28,33]. These results highlight the importance of physical activity as a matter of concern when designing public health interventions for the visually impaired, such as developing appropriate physical activity programs and providing regular physical activity sessions through public health centers.
There are several limitations in the present study. First, although the overall prevalence of visual impairment was assessed to be 4.3% in the Republic of Korea [34], only a small proportion of individuals with visual impairment were included in the present study (359,523 with no visual impairment vs. 461 with visual impairment). However, we considered extensive factors including sociodemographic features, lifestyle, past medical history, physical examinations, and clinical laboratory test results of both participants with and those without visual impairment and controlled for the possible confounding effects of these factors in assessing the association between visual impairment and mortality. Second, instead of evaluating visual function directly during the survey, we used the information from the National Handicapped Registry [18] to identify individuals with visual impairment, leading to misclassification bias. Because diagnosis by a medical doctor and assessment of disability are needed to register in the National Handicapped Registry, it is possible that some individuals with visual impairment (especially those with mild visual impairment) were not registered in the Registry, leading to misclassification and shifting the results toward the null hypothesis. In addition, individuals with visual field defects and normal central visual acuity (e.g., patients with various diseases, such as glaucoma and retinitis pigmentosa) could have been included in the mild visual impairment group in the present study, which might also have shifted the results toward the null hypothesis. Third, the heterogeneity of the association between visual impairment and mortality by physical activity could be partly due to residual confounding of health conditions, including those pertaining to visual function, that limit physical activity, although we adjusted the analyses for extensive covariates. Fourth, the results of no association between visual impairment and mortality among individuals who engage in regular physical activity should be cautiously interpreted due to the small number of deaths, although the point estimates for the associations between visual impairment and mortality were near or less than 1, which suggest no association.
However, the present study also has some notable strengths. First, it provides new evidence for issues (e.g., interaction between visual function and physical activity on mortality and stronger association between visual impairment and mortality among those with lower income levels) that are important for implementing health policies and designing public health interventions for the visually impaired but have been investigated by a limited number of studies. Second, we considered the severity of visual impairment and assessed the dose-response association between visual function and mortality, which has not been comprehensively evaluated despite its importance in establishing causal inference [35].

5. Conclusions

We found an independent association between visual impairment and higher mortality adjusted for potential confounders, which was stronger among those with lower income levels. When we performed stratified analyses by physical activity, the association between visual impairment and mortality was found among individuals who did not engage in regular physical activity but not found among those who engaged in regular physical activity. Because early detection of visual impairment and effective treatment of associated problems can maximize visual function for the visually impaired, the present study suggests the importance of early detection of visual impairment and adequate treatment of associated visual problems, especially among those with lower income levels. In addition, the present study also suggests the importance of physical activity as a public health intervention for individuals with visual impairment to lower adverse health outcomes such as mortality.

Supplementary Materials

The Supplementary Materials are available online at https://0-www-mdpi-com.brum.beds.ac.uk/1660-4601/16/22/4386/s1, Methods: Assumed causal pathway and adjusted covariates, Table S1. Associations of visual impairment with all-cause and cause-specific mortality among the Korean national health examinees, excluding individuals diagnosed with vision-threatening conditions among those classified in the no visual impairment group, Table S2. Associations of visual impairment with all-cause and cause-specific mortality among the Korean national health examinees, including individuals with physical, auditory, language, intellectual, and mental disabilities, brain lesions, and other types of disability. Figure S1. Kaplan-Meier curves of survival by visual function.

Author Contributions

Conceptualization, K.-N.K., W.K., J.J., H.K., K.H.K., J.H.S., and Y.J.K.; methodology, K.-N.K. and S.J.P.; software, K.-N.K.; formal analysis, K.-N.K.; writing—original draft preparation, K.-N.K.; writing—review & editing, S.J.P., W.K., J.J., H.K., K.H.K., J.H.S., and Y.J.K.; supervision, Y.J.K.; project administration, Y.J.K.; funding acquisition, K.-N.K. and Y.J.K.

Funding

This study was supported by the Seoul National University Hospital and the National Health Insurance Service of the Republic of Korea (NHIS-2017-4-042).

Acknowledgments

We thank the National Health Insurance Service of the Republic of Korea for providing the data for the present study.

Conflicts of Interest

The authors declare no conflicts of interest. The funding organization had no role in the design, conduct, or interpretation of the results of the present study.

References

  1. Park, S.J.; Ahn, S.; Woo, S.J.; Park, K.H. Extent of Exacerbation of Chronic Health Conditions by Visual Impairment in Terms of Health-Related Quality of Life. JAMA Ophthalmol. 2015, 133, 1267–1275. [Google Scholar] [CrossRef] [PubMed] [Green Version]
  2. Park, S.J.; Ahn, S.; Park, K.H. Burden of Visual Impairment and Chronic Diseases. JAMA Ophthalmol. 2016, 134, 778–784. [Google Scholar] [CrossRef] [PubMed] [Green Version]
  3. Köberlein, J.; Beifus, K.; Schaffert, C.; Finger, R.P. The economic burden of visual impairment and blindness: A systematic review. BMJ Open 2013, 3, e003471. [Google Scholar] [CrossRef] [PubMed]
  4. Bourne, R.R.A.; Flaxman, S.R.; Braithwaite, T.; Cicinelli, M.V.; Das, A.; Jonas, J.B.; Keeffe, J.; Kempen, J.H.; Leasher, J.; Limburg, H.; et al. Magnitude, temporal trends, and projections of the global prevalence of blindness and distance and near vision impairment: A systematic review and meta-analysis. Lancet Glob. Health 2017, 5, e888–e897. [Google Scholar] [CrossRef]
  5. Brunes, A.; Flanders, W.D.; Augestad, L.B. Self-reported visual impairment, physical activity and all-cause mortality: The HUNT Study. Scand. J. Public Health 2017, 45, 33–41. [Google Scholar] [CrossRef] [PubMed]
  6. Age-Related Eye Disease Study 2 Research Group; Papudesu, C.; Clemons, T.E.; Agrón, E.; Chew, E.Y. Association of Mortality with Ocular Diseases and Visual Impairment in the Age-Related Eye Disease Study 2: Age-Related Eye Disease Study 2 Report Number 13. Ophthalmology 2018, 125, 512–521. [Google Scholar] [CrossRef]
  7. Ng, S.K.; Kahawita, S.; Andrew, N.H.; Henderson, T.; Craig, J.E.; Landers, J. Association of Visual Impairment and All-Cause 10-Year Mortality Among Indigenous Australian Individuals Within Central Australia: The Central Australian Ocular Health Study. JAMA Ophthalmol. 2018, 136, 534–537. [Google Scholar] [CrossRef]
  8. Hong, Y.A.; Kim, S.Y.; Kim, S.H.; Kim, Y.O.; Jin, D.C.; Song, H.C.; Choi, E.J.; Kim, Y.L.; Kim, Y.S.; Kang, S.W.; et al. The Association of Visual Impairment with Clinical Outcomes in Hemodialysis Patients. Medicine 2016, 95, e3591. [Google Scholar] [CrossRef]
  9. Siantar, R.G.; Cheng, C.Y.; Gemmy Cheung, C.M.; Lamoureux, E.L.; Ong, P.G.; Chow, K.Y.; Mitchell, P.; Aung, T.; Wong, T.Y.; Cheung, C.Y. Impact of Visual Impairment and Eye diseases on Mortality: The Singapore Malay Eye Study (SiMES). Sci. Rep. 2015, 5, 16304. [Google Scholar] [CrossRef]
  10. Thomas, B.J.; Sanders, D.S.; Oliva, M.S.; Orrs, M.S.; Glick, P.; Ruit, S.; Chen, W.; Luoto, J.; Tasfaw, A.K.; Tabin, G.C. Blindness, cataract surgery and mortality in Ethiopia. Br. J. Ophthalmol. 2016, 100, 1157–1162. [Google Scholar] [CrossRef]
  11. Liu, E.; Ng, S.K.; Kahawita, S.; Andrew, N.H.; Henderson, T.; Craig, J.E.; Landers, J. Ten-year all-cause mortality and its association with vision among Indigenous Australians within Central Australia: The Central Australian Ocular Health Study. Clin. Experiment. Ophthalmol. 2017, 45, 348–356. [Google Scholar] [CrossRef]
  12. Zhu, Z.; Wang, L.; Young, C.A.; Huang, S.; Chang, B.H.W.; He, M. Cataract-Related Visual Impairment Corrected by Cataract Surgery and 10-Year Mortality: The Liwan Eye Study. Investig. Ophthalmol. Vis. Sci. 2016, 57, 2290–2295. [Google Scholar] [CrossRef] [PubMed]
  13. Schubert, C.R.; Fischer, M.E.; Pinto, A.A.; Klein, B.E.K.; Klein, R.; Tweed, T.S.; Cruickshanks, K.J. Sensory Impairments and Risk of Mortality in Older Adults. J. Gerontol. A Biol. Sci. Med. Sci. 2017, 72, 710–715. [Google Scholar] [CrossRef] [PubMed]
  14. Kuang, T.M.; Tsai, S.Y.; Liu, C.J.L.; Lee, S.M.; Hsu, W.M.; Chou, P. The association of visual impairment and 3-year mortality among the elderly in Taiwan: The Shihpai Eye Study. J. Chin. Med. Assoc. 2015, 78, 177–181. [Google Scholar] [CrossRef] [PubMed] [Green Version]
  15. Mitoku, K.; Masaki, N.; Ogata, Y.; Okamoto, K. Vision and hearing impairments, cognitive impairment and mortality among long-term care recipients: A population-based cohort study. BMC Geriatr. 2016, 16, 112. [Google Scholar] [CrossRef] [PubMed]
  16. Yamada, Y.; Denkinger, M.D.; Onder, G.; van der Roest, H.G.; Finne-Soveri, H.; Bernabei, R.; Topinkova, E. Joint Associations of Dual Sensory Impairment and No-Activity Involvement with 1-Year Mortality in Nursing Homes: Results from the SHELTER Study. J. Gerontol. A Biol. Sci. Med. Sci. 2016, 71, 643–648. [Google Scholar] [CrossRef] [PubMed]
  17. Seong, S.C.; Kim, Y.Y.; Park, S.K.; Khang, Y.H.; Kim, H.C.; Park, J.H.; Kang, H.J.; Do, C.H.; Song, J.S.; Lee, E.J.; et al. Cohort profile: The National Health Insurance Service-National Health Screening Cohort (NHIS-HEALS) in Korea. BMJ Open 2017, 7, e016640. [Google Scholar] [CrossRef]
  18. Song, S.J.; Han, K.; Choi, K.S.; Ko, S.H.; Rhee, E.J.; Park, C.Y.; Park, J.Y.; Lee, K.U.; Ko, K.S. Task Force Team for Diabetes Fact Sheet of the Korean Diabetes Association Trends in diabetic retinopathy and related medical practices among type 2 diabetes patients: Results from the National Insurance Service Survey 2006–2013. J. Diabetes. Investig. 2018, 9, 173–178. [Google Scholar] [CrossRef]
  19. Williams, G.; Aggio, D.; Stubbs, B.; Pardhan, S.; Gardner, B.; Smith, L. Physical activity levels in children with sensory problems: Cross-sectional analyses from the Millennium Cohort Study. Disabil. Health J. 2018, 11, 58–61. [Google Scholar] [CrossRef] [Green Version]
  20. Estevez, J.; Kaidonis, G.; Henderson, T.; Craig, J.E.; Landers, J. Association of disease-specific causes of visual impairment and 10-year mortality amongst Indigenous Australians: The Central Australian Ocular Health Study. Clin. Experiment. Ophthalmol. 2018, 46, 18–24. [Google Scholar] [CrossRef]
  21. Korpelainen, R.; Lämsä, J.; Kaikkonen, K.M.; Korpelainen, J.; Laukkanen, J.; Palatsi, I.; Takala, T.E.; Ikäheimo, T.M.; Hautala, A.J. Exercise capacity and mortality—A follow-up study of 3033 subjects referred to clinical exercise testing. Ann. Med. 2016, 48, 359–366. [Google Scholar] [CrossRef] [PubMed]
  22. Wang, A.G. Visual impairment and mortality: Are they related? J. Chin. Med. Assoc. 2015, 78, 137–138. [Google Scholar] [CrossRef] [PubMed] [Green Version]
  23. Andersson, T.; Alfredsson, L.; Källberg, H.; Zdravkovic, S.; Ahlbom, A. Calculating measures of biological interaction. Eur. J. Epidemiol. 2005, 20, 575–579. [Google Scholar] [CrossRef] [PubMed]
  24. Knol, M.J.; VanderWeele, T.J.; Groenwold, R.H.H.; Klungel, O.H.; Rovers, M.M.; Grobbee, D.E. Estimating measures of interaction on an additive scale for preventive exposures. Eur. J. Epidemiol. 2011, 26, 433–438. [Google Scholar] [CrossRef] [PubMed] [Green Version]
  25. Skalska, A.; Wizner, B.; Piotrowicz, K.; Klich-Rączka, A.; Klimek, E.; Mossakowska, M.; Rowiński, R.; Kozak-Szkopek, E.; Jóźwiak, A.; Gąsowski, J.; et al. The prevalence of falls and their relation to visual and hearing impairments among a nation-wide cohort of older Poles. Exp. Gerontol. 2013, 48, 140–146. [Google Scholar] [CrossRef] [PubMed]
  26. Zheng, D.D.; Christ, S.L.; Lam, B.L.; Arheart, K.L.; Galor, A.; Lee, D.J. Increased mortality risk among the visually impaired: The roles of mental well-being and preventive care practices. Investig. Ophthalmol. Vis. Sci. 2012, 53, 2685–2692. [Google Scholar] [CrossRef]
  27. Christ, S.L.; Zheng, D.D.; Swenor, B.K.; Lam, B.L.; West, S.K.; Tannenbaum, S.L.; Muñoz, B.E.; Lee, D.J. Longitudinal relationships among visual acuity, daily functional status, and mortality: The Salisbury Eye Evaluation Study. JAMA Ophthalmol. 2014, 132, 1400–1406. [Google Scholar] [CrossRef]
  28. Loprinzi, P.D.; Joyner, C. Accelerometer-determined physical activity and mortality in a national prospective cohort study: Considerations by visual acuity. Prev. Med. 2016, 87, 18–21. [Google Scholar] [CrossRef]
  29. Lear, S.A.; Hu, W.; Rangarajan, S.; Gasevic, D.; Leong, D.; Iqbal, R.; Casanova, A.; Swaminathan, S.; Anjana, R.M.; Kumar, R.; et al. The effect of physical activity on mortality and cardiovascular disease in 130000 people from 17 high-income, middle-income, and low-income countries: The PURE study. Lancet 2017, 390, 2643–2654. [Google Scholar] [CrossRef]
  30. Kikuchi, H.; Inoue, S.; Lee, I.M.; Odagiri, Y.; Sawada, N.; Inoue, M.; Tsugane, S. Impact of Moderate-Intensity and Vigorous-Intensity Physical Activity on Mortality. Med. Sci. Sports Exerc. 2018, 50, 715–721. [Google Scholar] [CrossRef]
  31. Barbosa Porcellis da Silva, R.; Marques, A.C.; Reichert, F.F. Objectively measured physical activity in Brazilians with visual impairment: Description and associated factors. Disabil. Rehabil. 2018, 40, 2131–2137. [Google Scholar] [CrossRef] [PubMed]
  32. Ong, S.R.; Crowston, J.G.; Loprinzi, P.D.; Ramulu, P.Y. Physical activity, visual impairment, and eye disease. Eye 2018, 32, 1296–1303. [Google Scholar] [CrossRef] [PubMed] [Green Version]
  33. Kulmala, J.; Era, P.; Törmäkangas, T.; Pärssinen, O.; Rantanen, T.; Heikkinen, E. Visual acuity and mortality in older people and factors on the pathway. Ophthalmic Epidemiol. 2008, 15, 128–134. [Google Scholar] [CrossRef]
  34. Rim, T.H.T.; Nam, J.S.; Choi, M.; Lee, S.C.; Lee, C.S. Prevalence and risk factors of visual impairment and blindness in Korea: The Fourth Korea National Health and Nutrition Examination Survey in 2008–2010. Acta Ophthalmol. 2014, 92, e317–e325. [Google Scholar] [CrossRef] [PubMed]
  35. Zhang, T.; Jiang, W.; Song, X.; Zhang, D. The association between visual impairment and the risk of mortality: A meta-analysis of prospective studies. J. Epidemiol. Community Health 2016, 70, 836–842. [Google Scholar] [CrossRef] [PubMed]
Figure 1. Directed acyclic graph for the association between visual impairment and mortality.
Ijerph 16 04386 g001
Figure 2. Association between visual impairment and all-cause mortality stratified by income, sex, and body mass index.
Ijerph 16 04386 g002
Table 1. Sociodemographic characteristics of the study participants by visual function (n = 359,984).
CharacteristicsNo Visual Impairment (n = 359,523)Mild Visual Impairment (n = 328)Severe Visual Impairment (n = 133)p-Value a
Sex
Men194,785 (54.2)197 (60.1)70 (52.6)0.10
Women164,738 (45.8)131 (39.9)63 (47.4)
Household income (deciles)
0–373,251 (20.4)80 (24.4)25 (18.8)0.41
4–7115,402 (32.1)104 (31.7)46 (34.6)
8–10170,870 (47.5)144 (43.9)62 (46.6)
Body mass index (kg/m2)
<18.57848 (2.2)19 (5.8)7 (5.3)<0.01
18.5–22.9125,809 (35.0)114 (34.8)48 (36.1)
23–24.9100,866 (28.1)93 (28.4)32 (24.1)
≥25124,894 (34.8)102 (31.1)46 (34.6)
Smoking status
Non-smoker227,957 (64.5)229 (70.0)89 (68.5)0.04
Ex-smoker65,591 (18.5)63 (19.3)21 (16.2)
Smoker60,142 (17.0)35 (10.7)20 (15.4)
Alcohol consumption
None215,080 (60.3)234 (71.6)99 (74.4)<0.01
1–2 times/week91,879 (25.7)47 (14.4)20 (15.0)
3–4 times/week32,086 (9.0)21 (6.4)8 (6.0)
≥5 times/week17,876 (5.0)25 (7.7)6 (4.5)
Physical activity
None211,833 (59.3)258 (79.1)101 (76.5)<0.01
1–2 times/week78,179 (21.9)36 (11.0)20 (15.2)
3–4 times/week39,323 (11.0)7 (2.2)3 (2.3)
≥5 times/week28,044 (7.9)25 (7.7)8 (6.1)
History of stroke
No253,662 (98.2)251 (93.7)97 (93.3)<0.01
Yes4638 (1.8)17 (6.3)7 (6.7)
History of heart disease
No246,268 (95.3)246 (92.1)94 (90.4)<0.01
Yes12,137 (4.7)21 (7.9)10 (9.6)
History of hypertension
No164,856 (63.5)133 (49.4)49 (46.7)<0.01
Yes94,633 (36.5)136 (50.6)56 (53.3)
History of type 2 diabetes
No227,279 (87.9)212 (79.1)82 (78.1)<0.01
Yes31,401 (12.1)56 (20.9)23 (21.9)
History of dyslipidemia
No242,507 (93.8)251 (94.0)98 (92.5)0.84
Yes16,087 (6.2)16 (6.0)8 (7.6)
History of other diseases including cancer
No229,876 (88.9)219 (82.0)88 (84.6)<0.01
Yes28,576 (11.1)48 (18.0)16 (15.4)
Age (years)59.0 ± 8.872.5 ± 8.868.9 ± 9.2<0.01
Waist circumference (cm)82.0 ± 8.283.0 ± 8.982.9 ± 8.50.05
Systolic blood pressure (mmHg)125.3 ± 15.2130.5 ± 16.3129.1 ± 16.3<0.01
Diastolic blood pressure (mmHg)77.6 ± 9.978.6 ± 9.977.9 ± 10.80.18
Fasting serum glucose level (mg/dL)101.2 ± 25.3106.7 ± 32.1104.4 ± 26.2<0.01
Serum creatinine level (mg/dL)1.1 ± 1.21.1 ± 1.01.0 ± 1.00.94
AST level (U/L)26.5 ± 18.425.9 ± 10.027.4 ± 14.30.71
ALT level (U/L)25.1 ± 19.121.9 ± 12.123.2 ± 15.6<0.01
γ-GT level (U/L)38.2 ± 53.630.9 ± 23.836.1 ± 36.60.04
Note. ALT = alanine aminotransferase; AST = aspartate aminotransferase; γ-GT = gamma glutamyltransferase. Values are presented as n (%) for categorical variables and mean ± standard deviation for continuous variables. a p-values were estimated by Chi-square test for categorical variables and ANOVA test for continuous variables.
Table 2. Associations between visual impairment and mortality among the Korean national health examinees.
Visual FunctionNo. of DeathsHR95% CIp-Value for Trend
Analyses not adjusted for physical activity a
All-cause mortality
No visual impairment8211Ref.Ref.0.03
Mild visual impairment341.170.81, 1.69
Severe visual impairment161.901.08, 3.35
Mortality due to cardiovascular diseases
No visual impairment1202Ref.Ref.0.02
Mild visual impairment61.220.85, 1.76
Severe visual impairment51.841.04, 3.23
Mortality due to cancers
No visual impairment3415Ref.Ref.0.34
Mild visual impairment90.830.39, 1.74
Severe visual impairment20.440.06, 3.10
Mortality due to other diseases
No visual impairment3504Ref.Ref.0.01
Mild visual impairment191.601.00, 2.54
Severe visual impairment92.200.99, 4.90
Analyses further adjusted for physical activityb
All-cause mortality
No visual impairment8211Ref.Ref.0.03
Mild visual impairment341.160.81, 1.67
Severe visual impairment161.871.06, 3.29
Mortality due to cardiovascular diseases
No visual impairment1202Ref.Ref.0.03
Mild visual impairment61.210.84, 1.75
Severe visual impairment51.801.02, 3.18
Mortality due to cancers
No visual impairment3415Ref.Ref.0.33
Mild visual impairment90.830.39, 1.74
Severe visual impairment20.430.06, 3.07
Mortality due to other diseases
No visual impairment3504Ref.Ref.0.01
Mild visual impairment191.580.99, 2.51
Severe visual impairment92.150.96, 4.79
Note. CI = confidence interval; HR = hazard ratio; Ref. = reference. a Adjusted for age, sex, household income decile, residing province, smoking status, alcohol consumption, body mass index, waist circumference, systolic and diastolic blood pressure, serum levels of fasting glucose, creatinine, aspartate aminotransferase, alanine aminotransferase, and gamma glutamyltransferase, and history of stroke, heart disease, hypertension, type 2 diabetes, dyslipidemia, and other diseases including cancer. b Adjusted for the aforementioned covariates and physical activity.
Table 3. Associationsa between visual impairment and all-cause mortality stratified by physical activity.
Visual FunctionNo. of DeathHR95% CIp-Value for Trend
Not engaging in physical activity (None)
No visual impairment5921Ref.Ref.0.01
Mild visual impairment311.280.88, 1.86
Severe visual impairment151.961.09, 3.55
Engaging in physical activity (≥once/week)
No visual impairment2234Ref.Ref.0.41
Mild visual impairment30.290.04, 2.09
Severe visual impairment11.110.16, 7.88
Note. CI = confidence interval; HR = hazard ratio; Ref. = reference. a Adjusted for age, sex, household income decile, residing province, smoking status, alcohol consumption, body mass index, waist circumference, systolic and diastolic blood pressure, serum levels of fasting glucose, creatinine, aspartate aminotransferase, alanine aminotransferase, and gamma glutamyltransferase, and history of stroke, heart disease, hypertension, type 2 diabetes, dyslipidemia, and other diseases including cancer.

