A Novel Approach for a Sustainability Evaluation of Developing System Interchange: The Case Study of the Sheikhfazolah-Yadegar Interchange, Tehran, Iran


Abstract
:1. Introduction
- Building and developing effective, economical, and adaptive transport infrastructure and transport system for all people who live in the world;
- Providing an environmentally friendly atmosphere, reducing waste, reducing consumed non-renewable resources, decreasing land use, decreasing noise pollution, and minimizing of using fossil fuels.
2. Theoretical Background
3. Method and Data
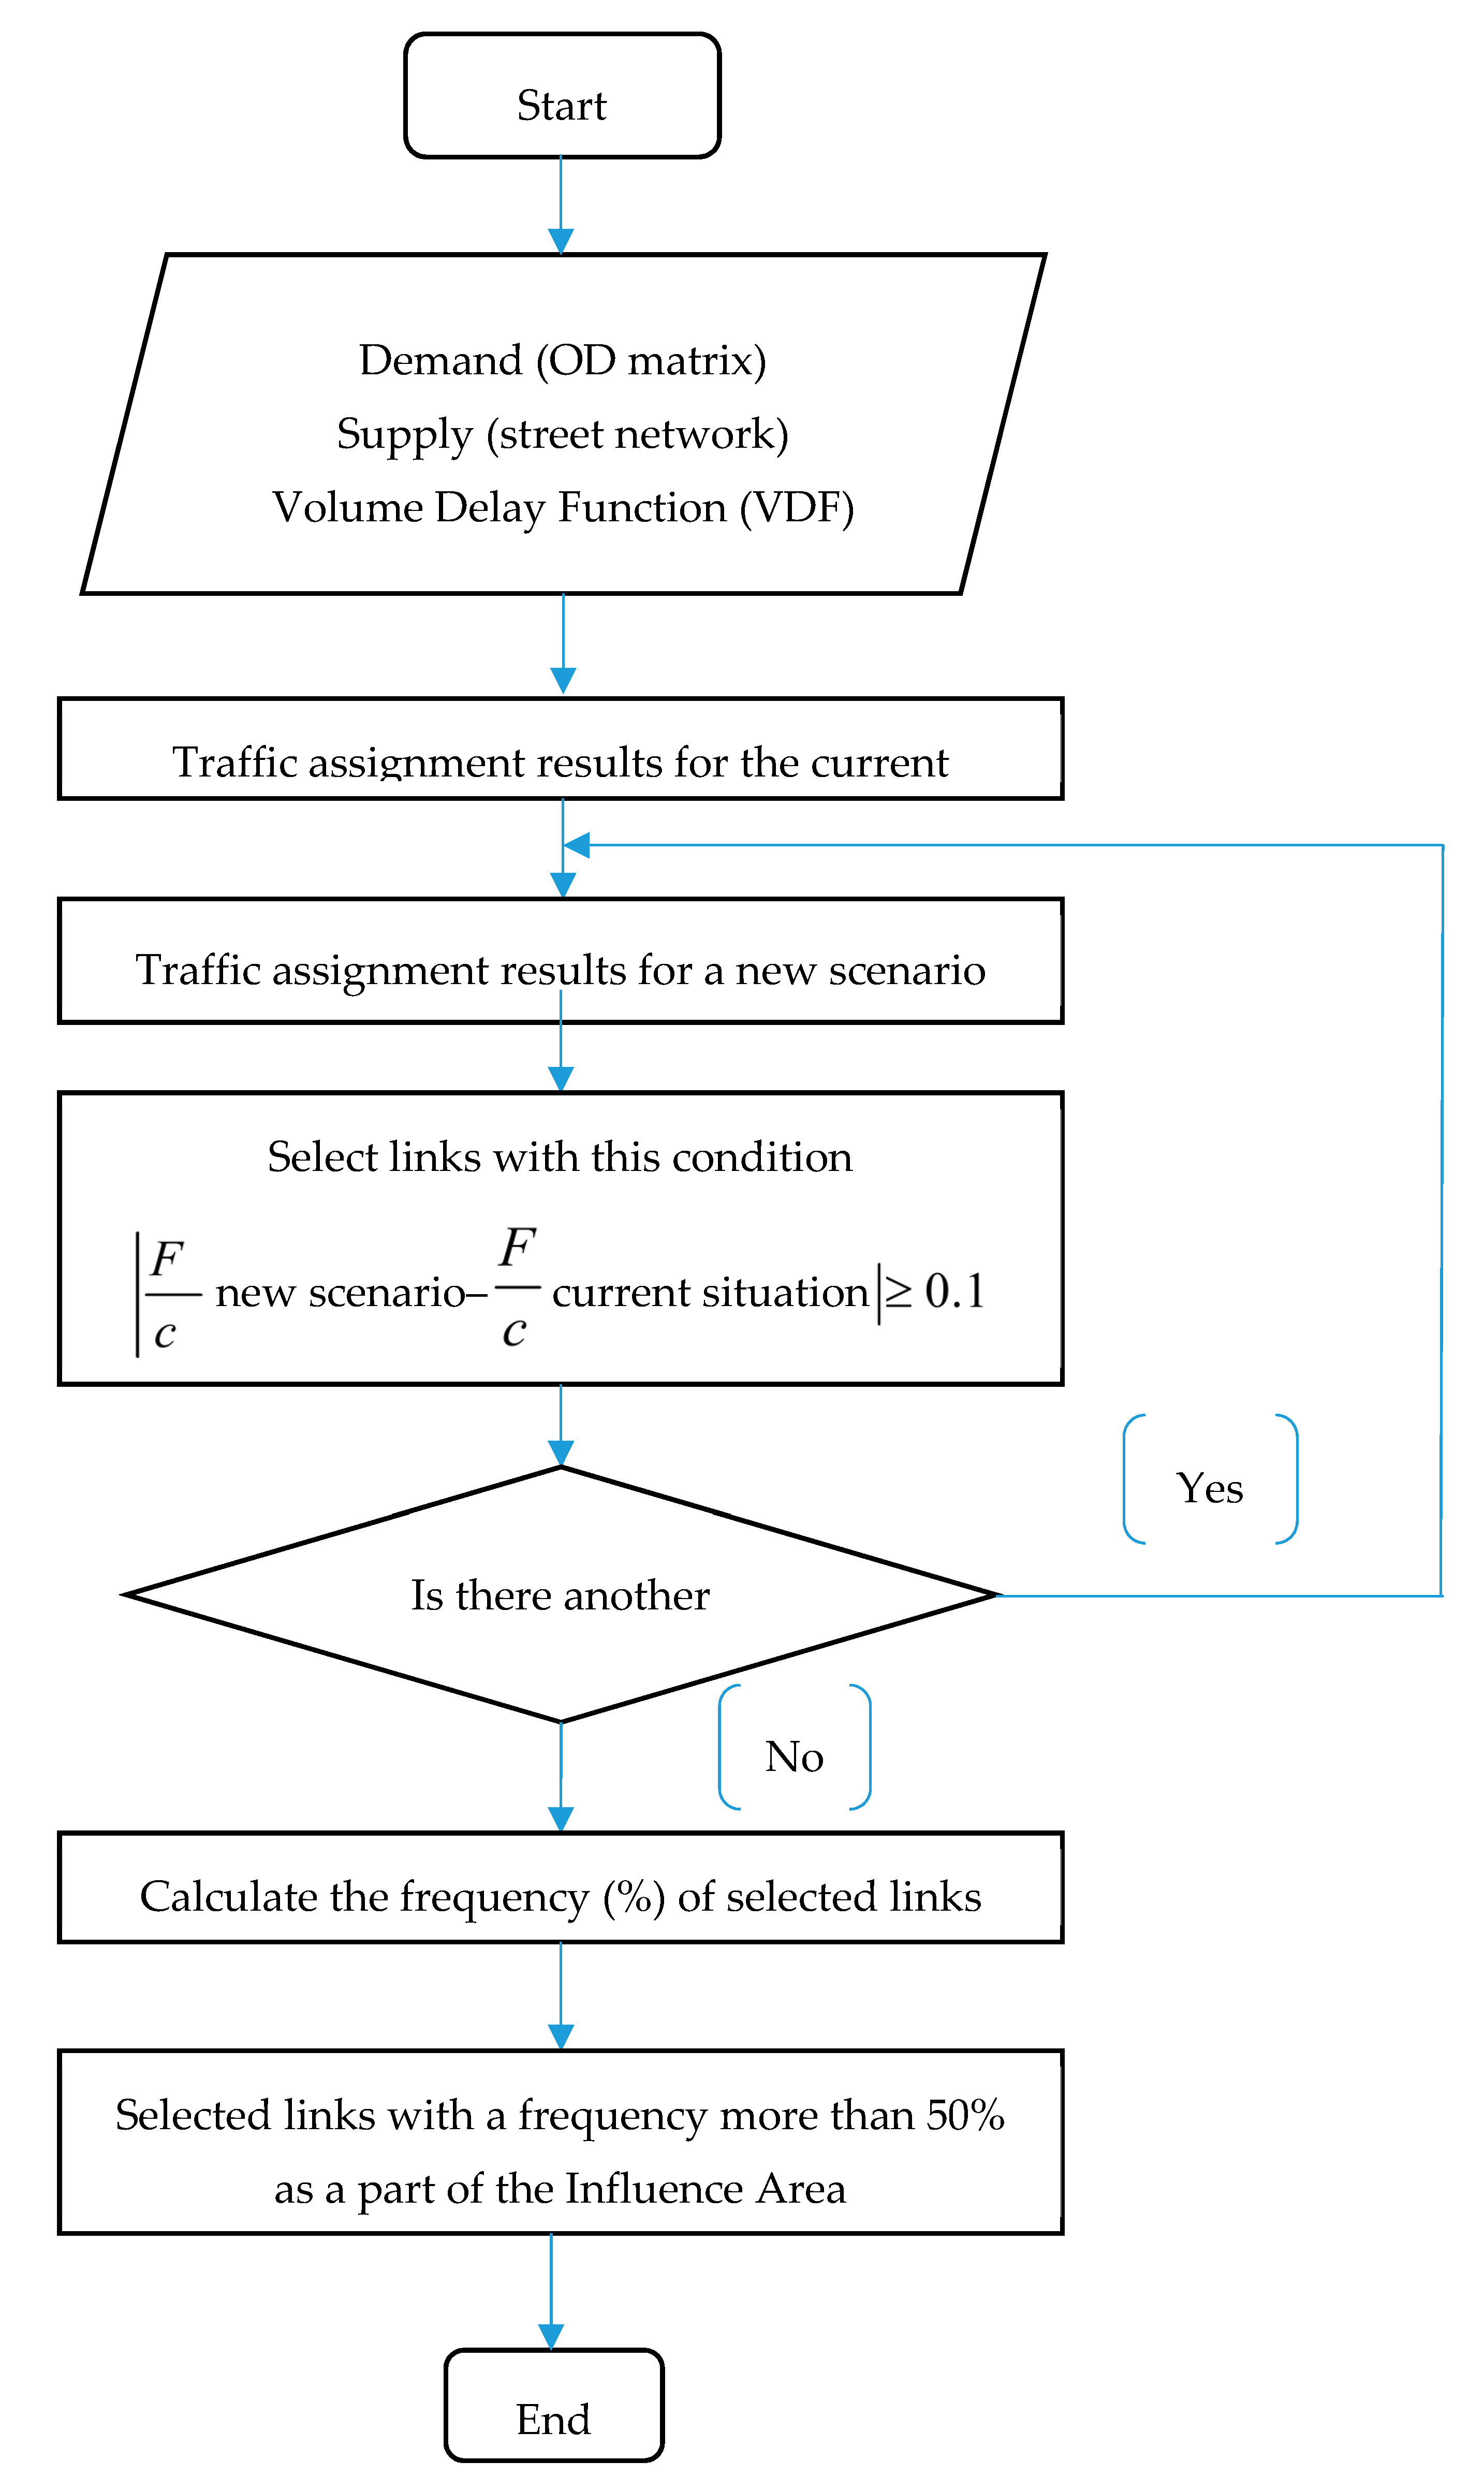
3.1. Method
- (1)
- Modeling scenarios and measuring IA. According to the utilized source and interviewing with experts, all feasible scenarios that can improve the traffic situation in Sheikhfazolah-Yadegar interchange of Tehran were modeled in Trans CAD 5 software to measure their IA as the study region.
- (2)
- Choosing eminent sustainable indicators and interviewing with experts to calculate a weight of indicators. Sustainability evaluation of transportation infrastructure plans was carried out with respect to environmental, social, and economic parameters. To assess each of these parameters, the relevant criteria to these parameters were defined to determine the sustainable scenarios. According to defined indicators and accessible data, ten indexes were selected including three sustainability principle. To calculate the weight of these indicators, interviewing with experts were carried out. The values of indicators were normalized based on TOPSIS and AECIEI methods. The normalized indicators values could be summed after applying the weight of each indicator to its value.
- (3)
- Assessing results of scenarios by evaluating sustainable development indicators: the IA and all scenarios were modeled by AIMSUN software, and indicator’s values were done through AIMSUN results in an indirect and direct procedure.
- (4)
- Ranking scenarios and choosing the great scenario. Combining indicators were done by the TOPSIS method. Ranking the scenarios was done by this method, and then the best scenario was chosen. The combined indicator was required to rank the scenarios, which could help to compare scenarios in a quick and easy manner [36,44].
- (5)
- Defining a simplified approach. The AECIEI was defined based on the MCDA approach; by using this method, the effect of changes intensity of each indicator was applied in MCDA. Although the previous methods applied the weight of each indicator to sum the effect of all indicators for sorting and finding the best scenario, the effect of changes intensity was not applied on sustainability evaluation. When there were various values of an indicator in various scenarios, and difference of these values was significant, and these changes had a different effect on sustainability, AECIEI could apply the effect of changes intensity to the normalized value of each indicator in a scenario against the values of the same indicator in other scenarios. On the other hand, when there was a high change in the value of an indicator of a scenario against other scenarios, the effect of changes intensity should be applied. For example, the effect of air pollution or green space destruction in a different range was not the same on sustainability; therefore, they should be normalized based on the effect of changes intensity on sustainability. By interviewing with experts, the effect of changes intensity of each indicator could be specified. In this study, the results of AECIEI were compared with the result of TOPSIS.
3.2. Data
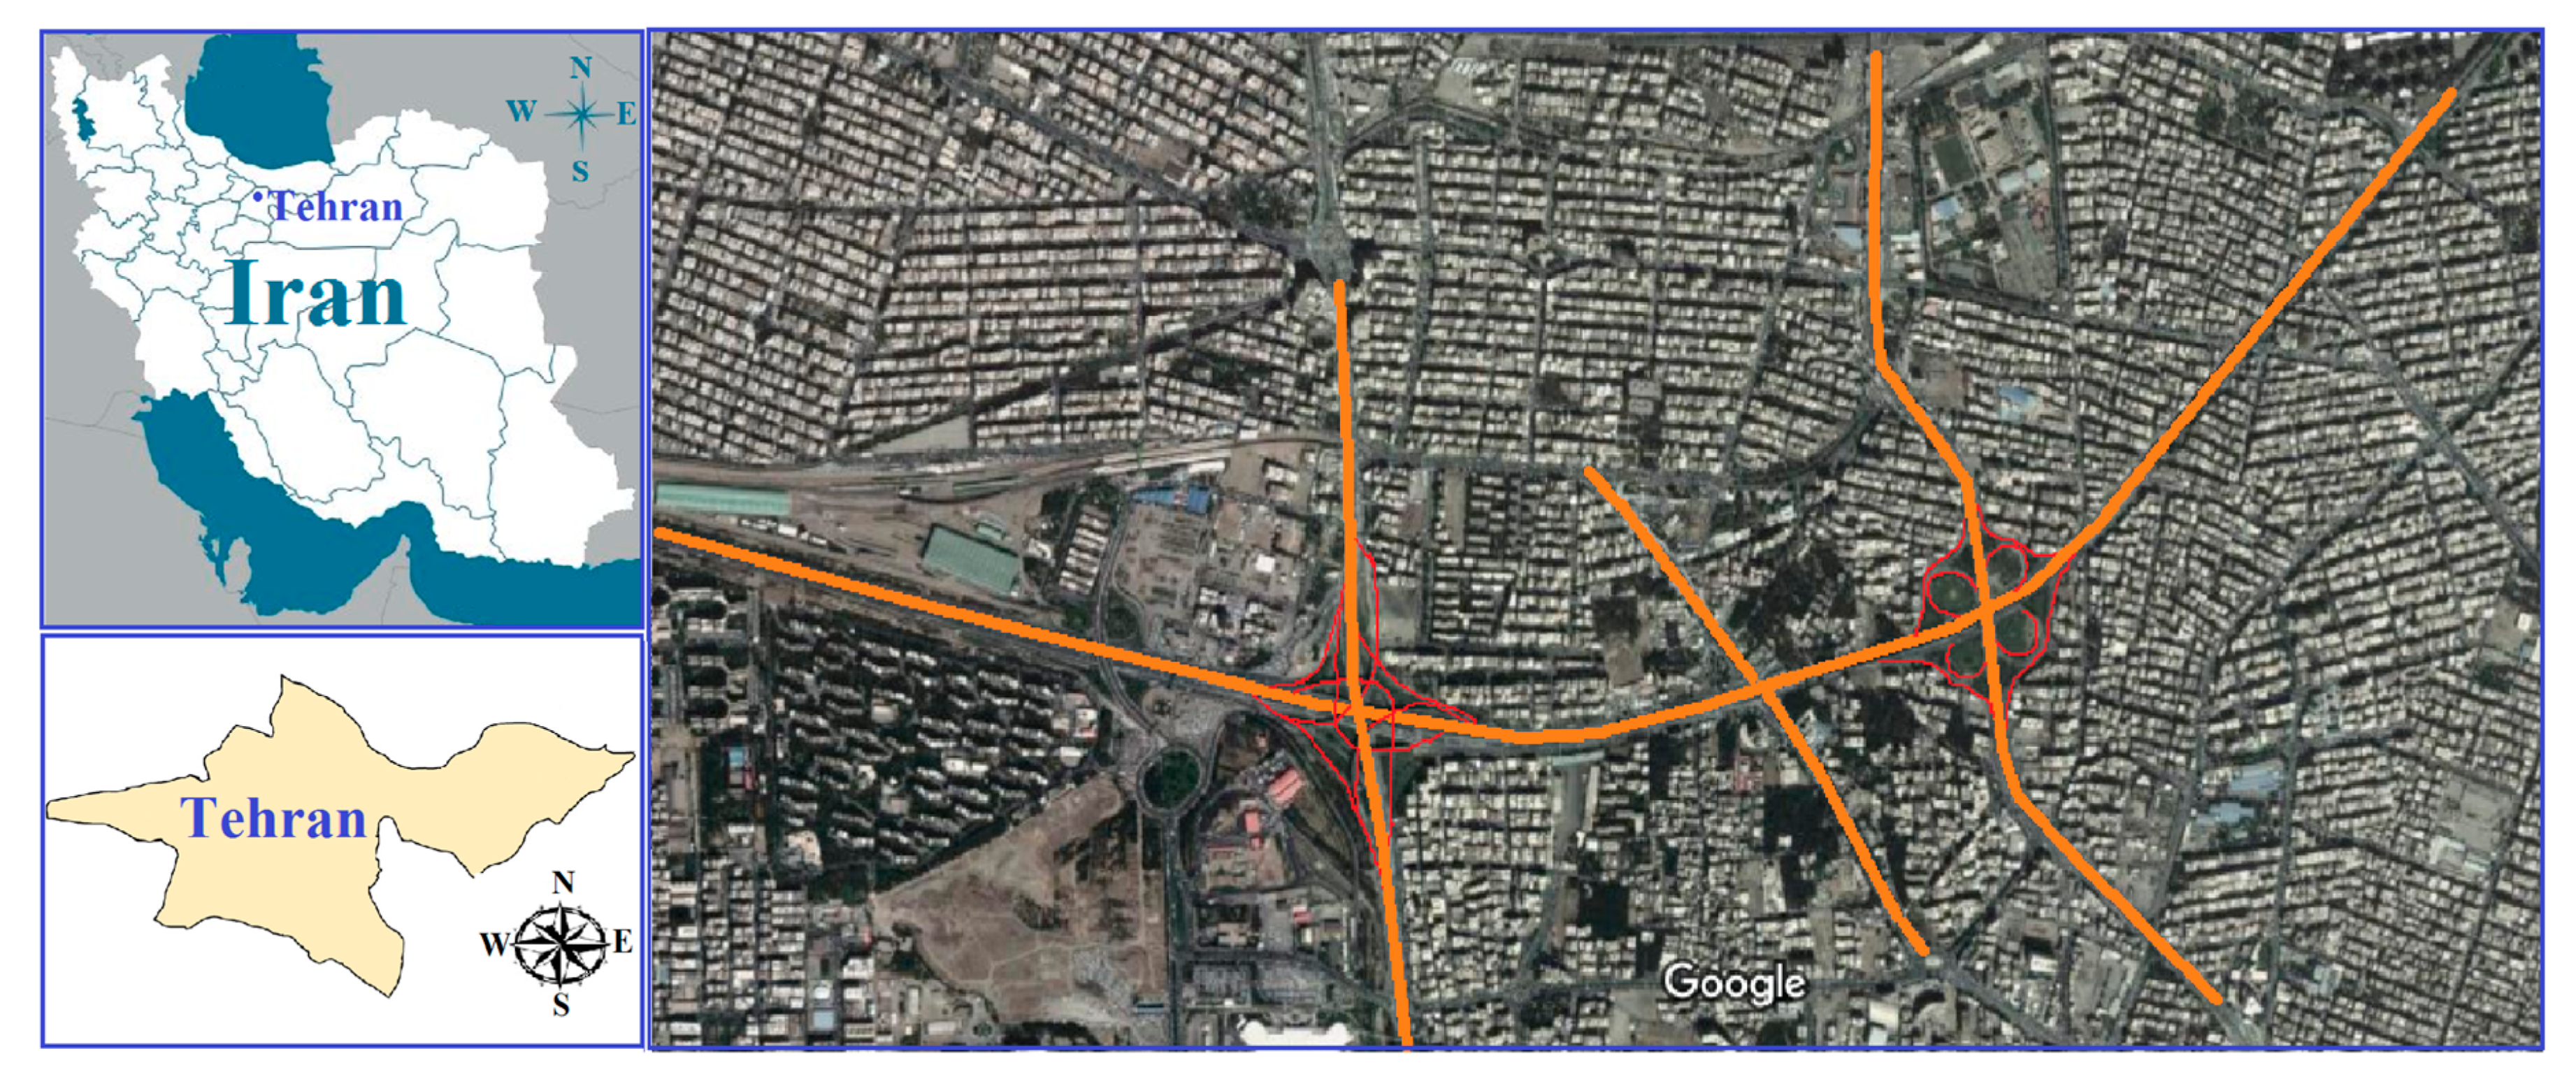
3.3. Case Study
4. Study Framework
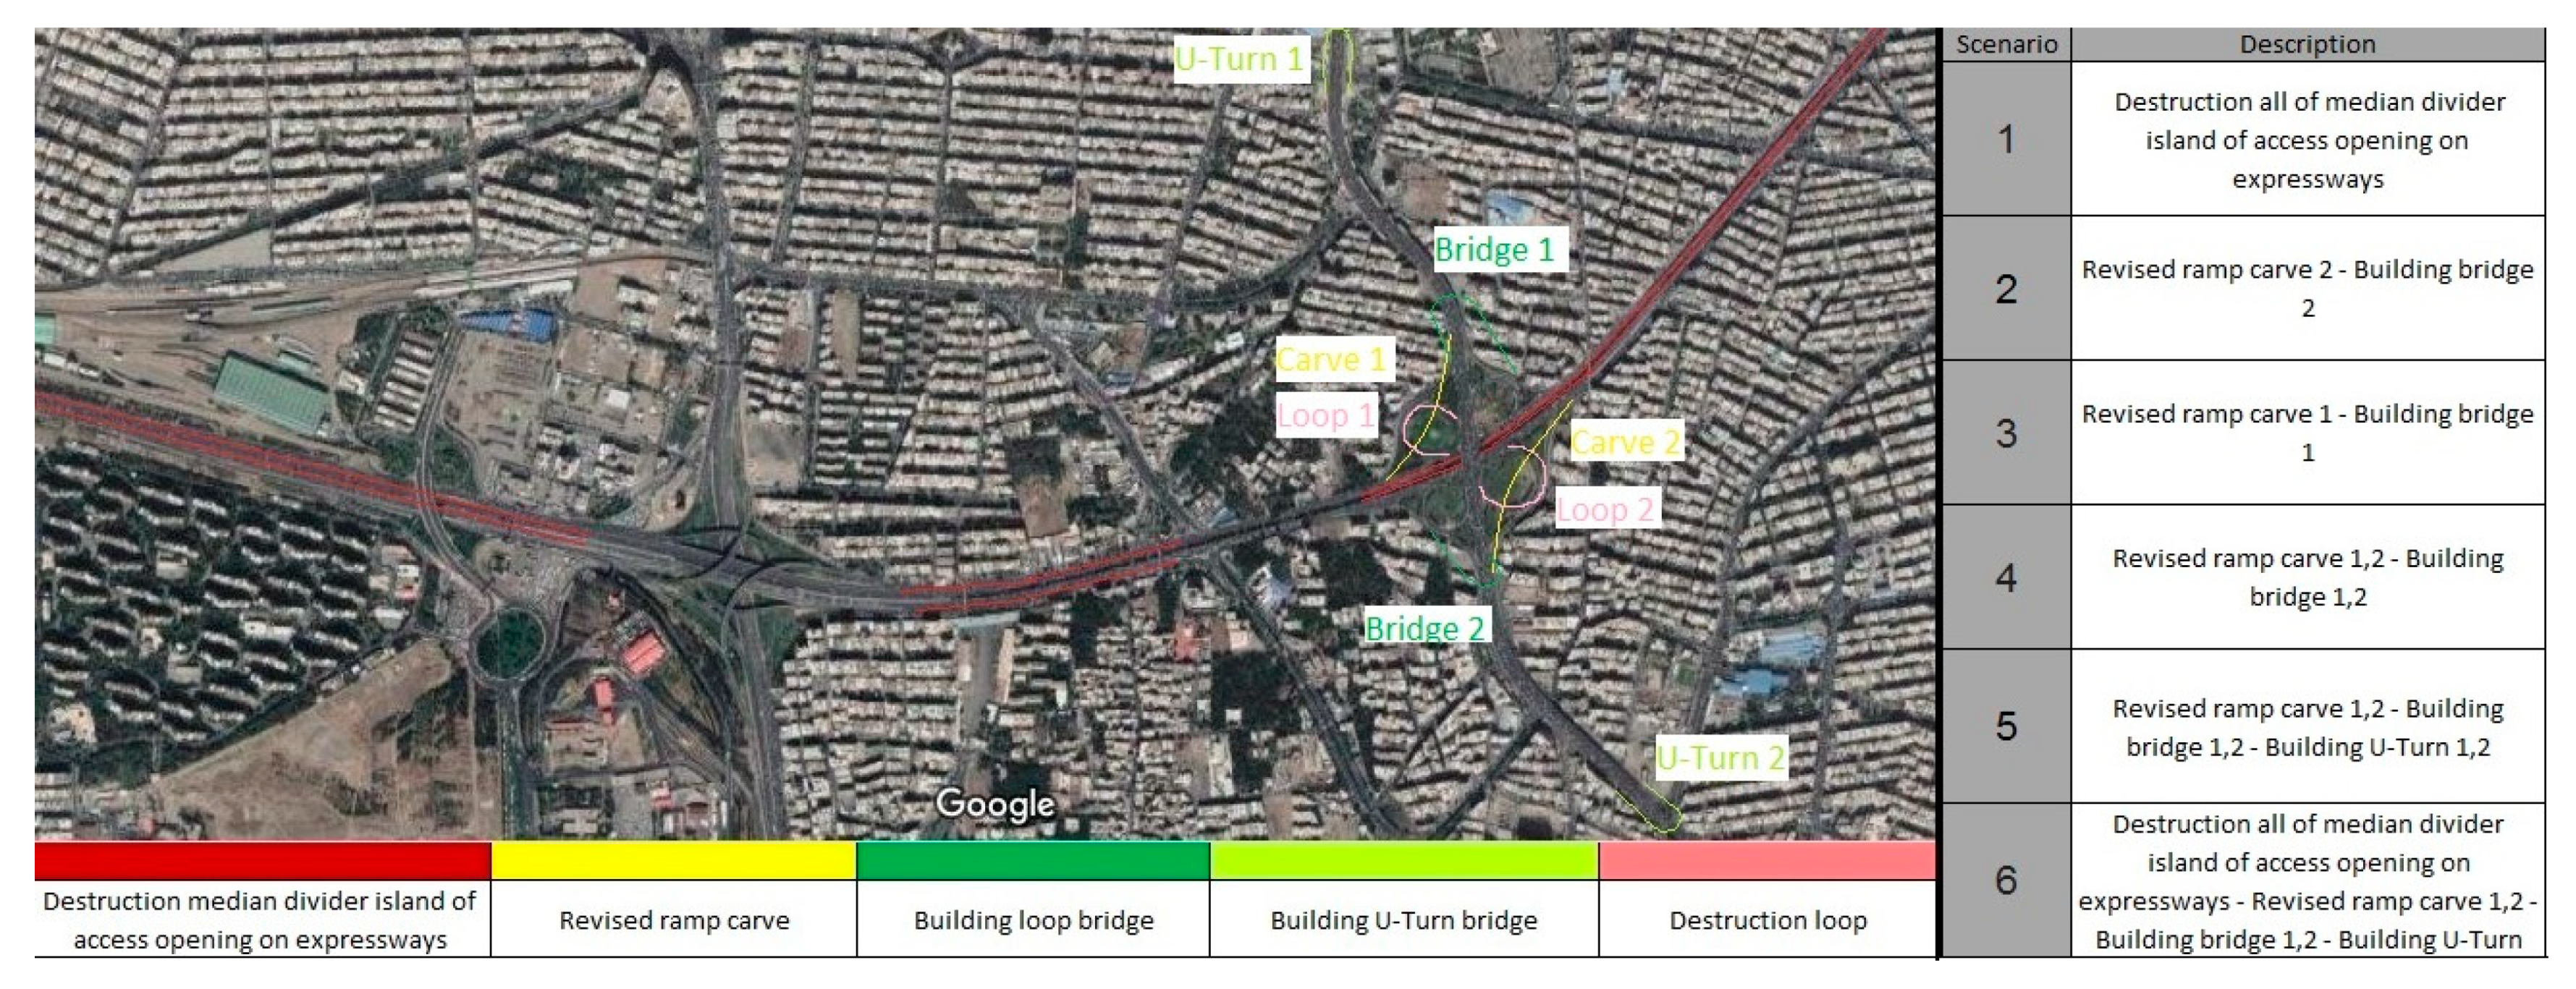
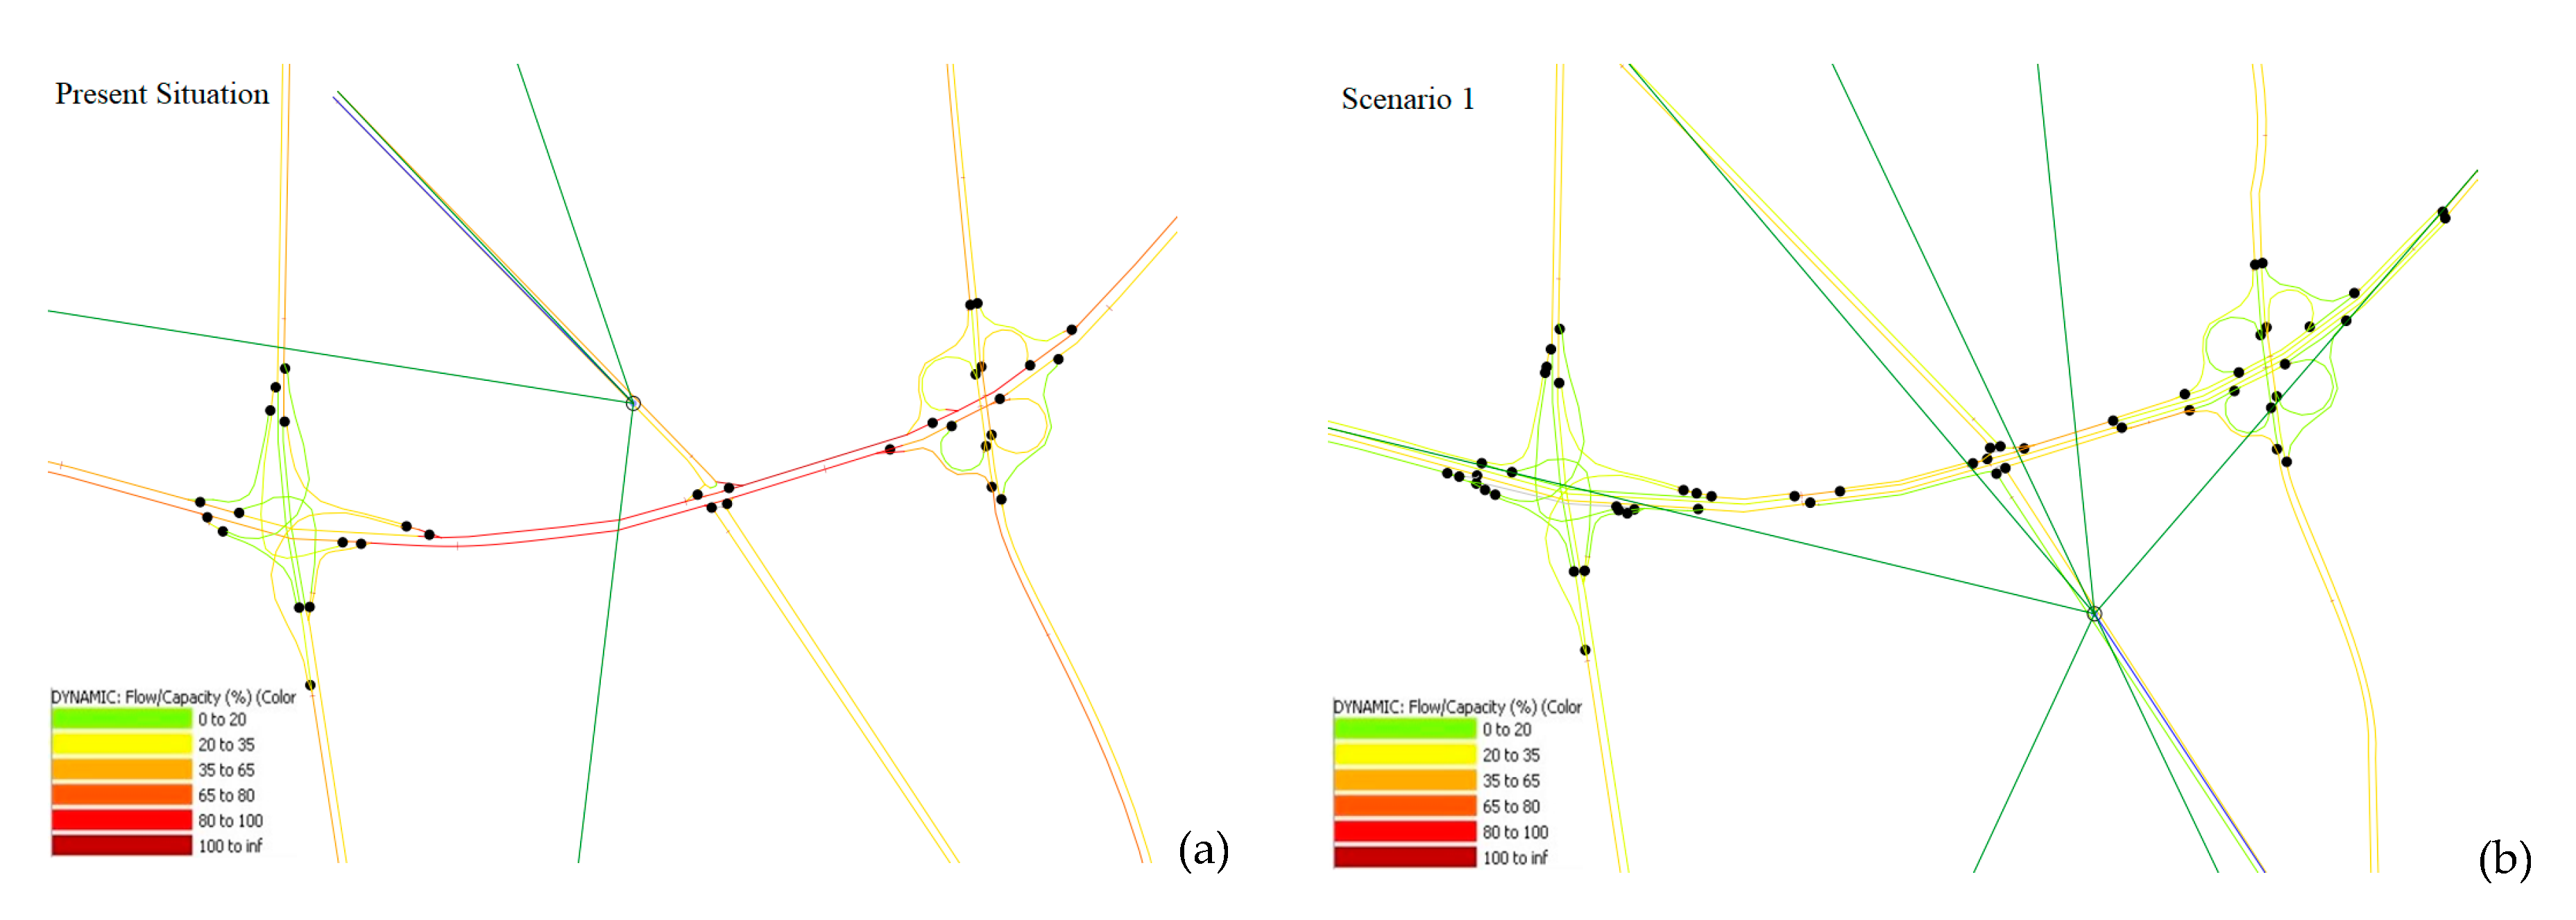
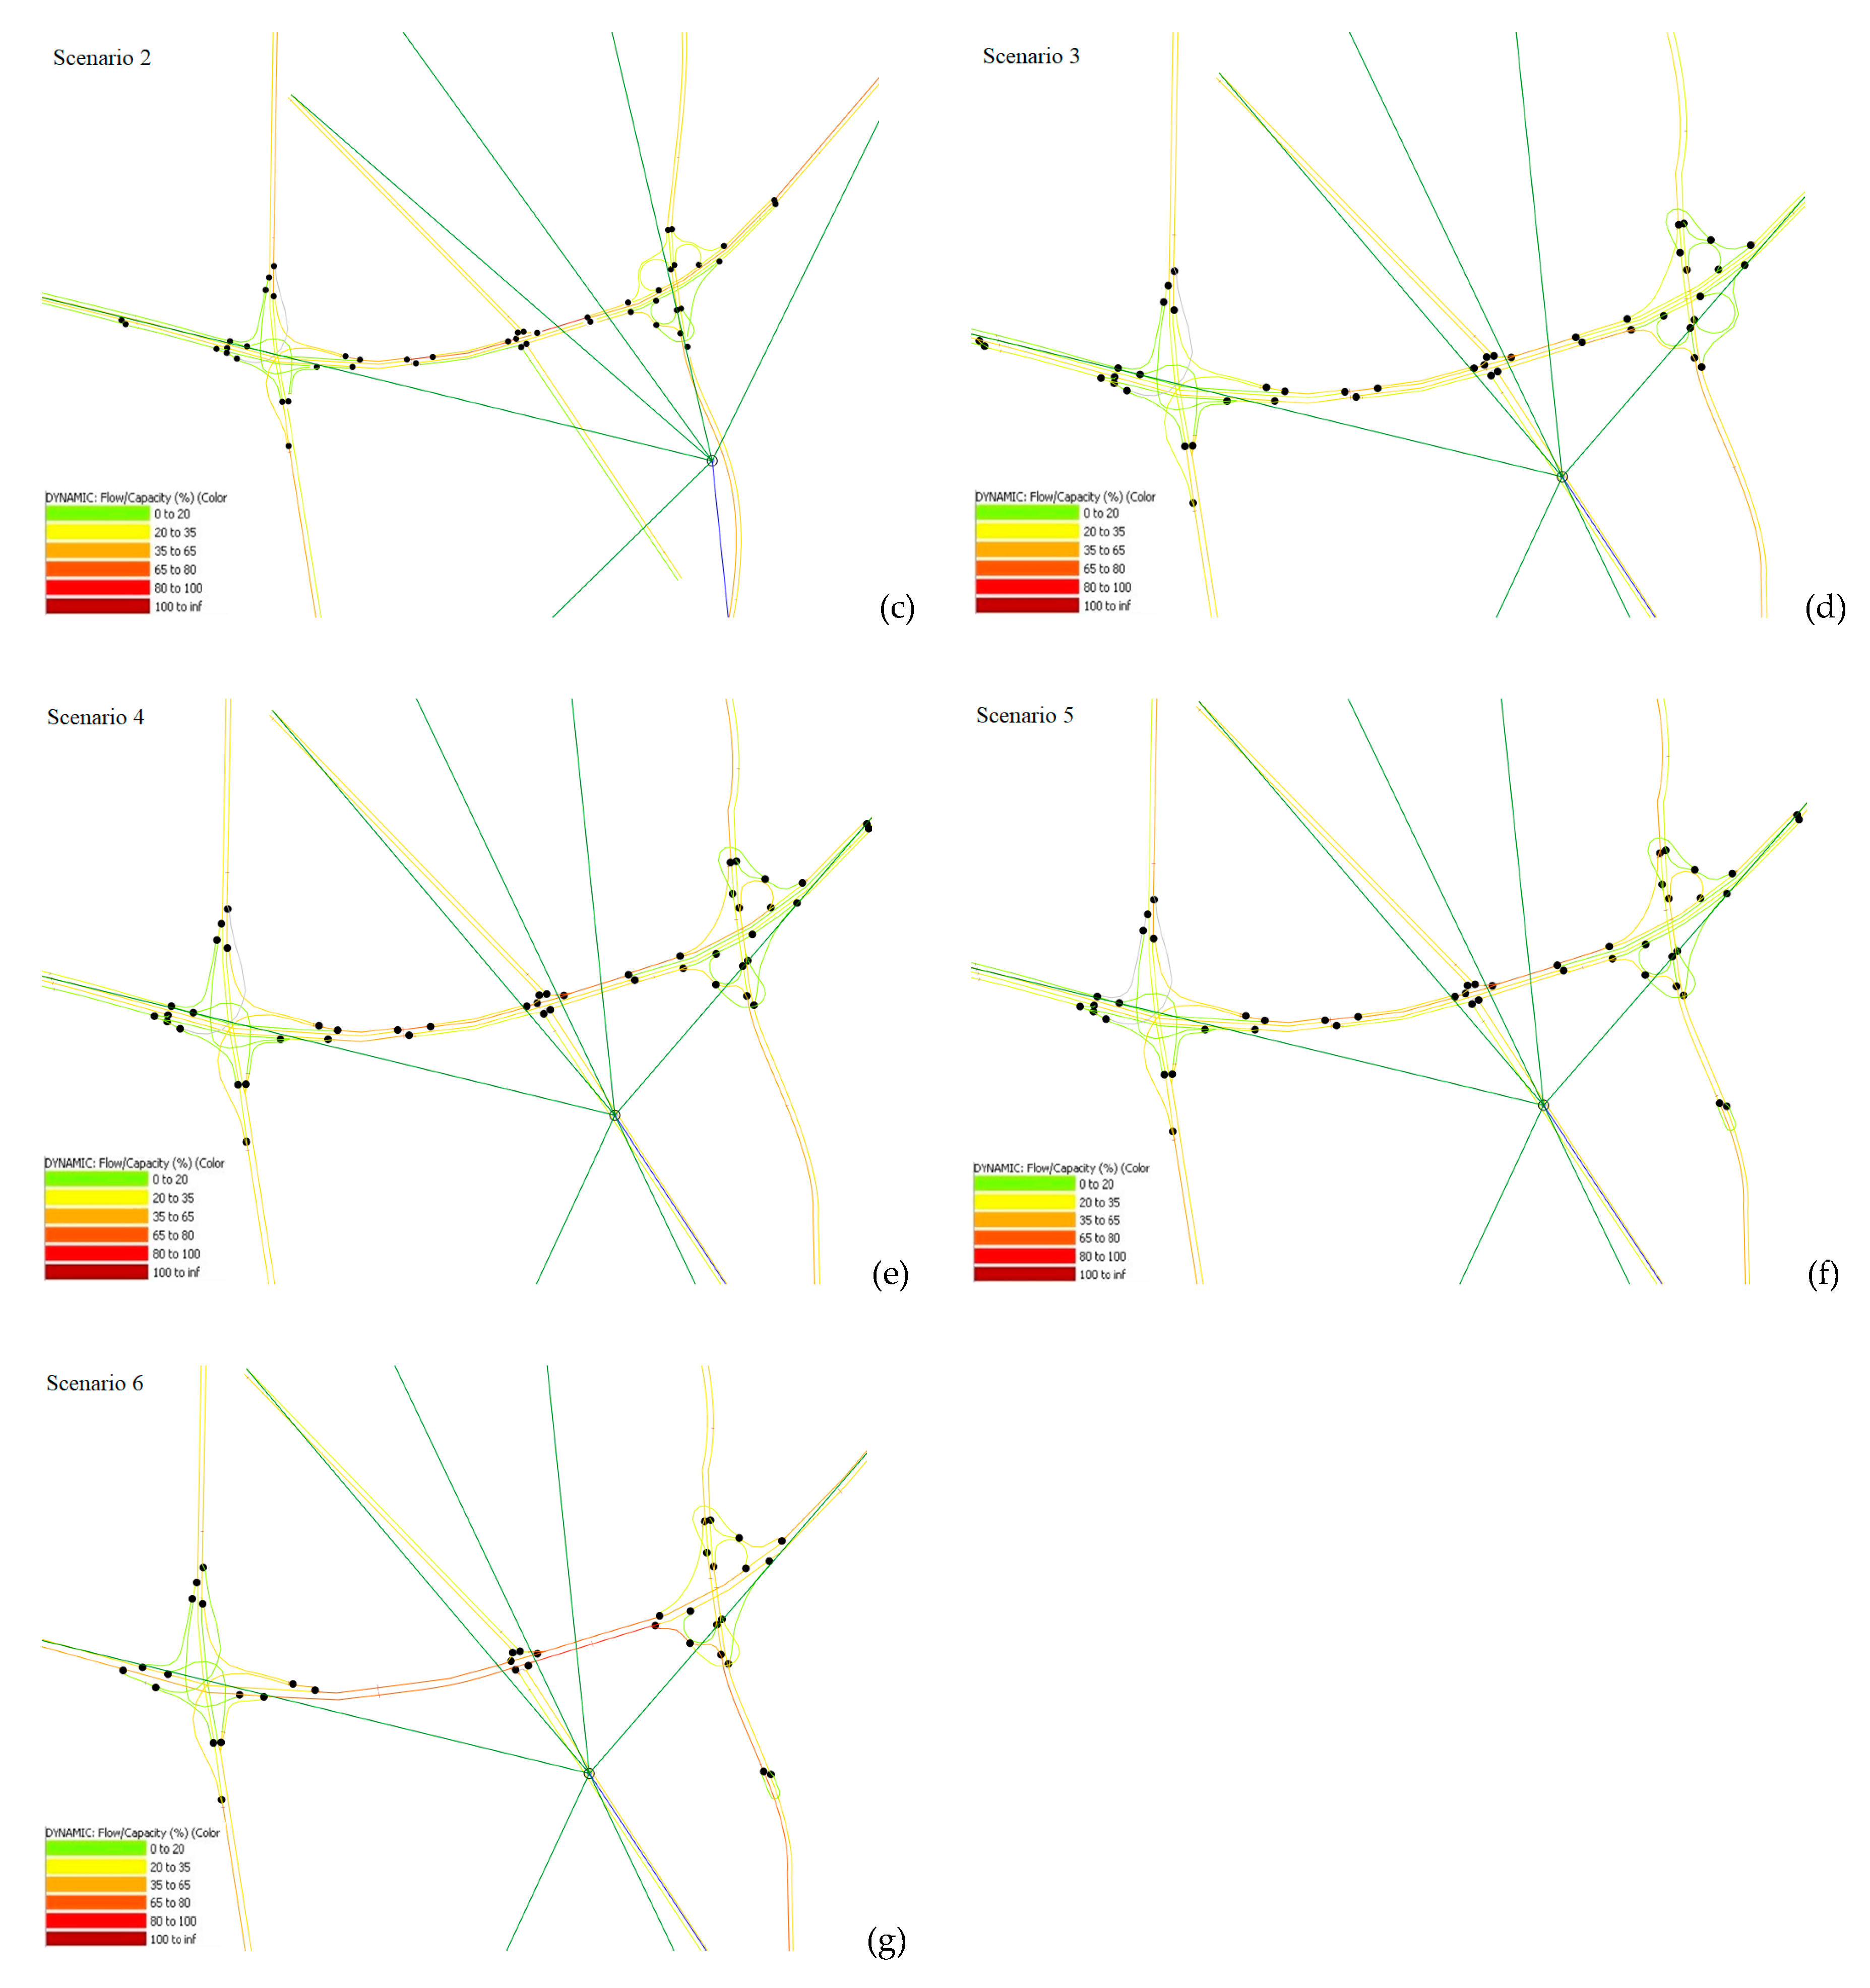
4.1. Scenario Building
4.2. Specifying Influence Area (IA)
4.3. Choosing Eminent Sustainable Indicators
- There is a relationship between the selected indicators with environmental, economic, and social aspects;
- The chosen indicators should be understandable and useable by anybody;
- Users can understand how the final value is calculated;
- The selected indicators should be predictable;
- All selected indicators should be comparative;
- The selected indicators should be calculated at the appropriate spatial and temporal scales;
- The data of each selected indicator should be reliable and available at a reasonable cost;
- The selected indicators should be measurable, quantifiable, and reproducible;
- Each selected indicator should be independent of each other.
4.4. Indicator Quantification
4.4.1. Environmental Indicators
4.4.2. Social Indicators
4.4.3. Economic Indicators
4.5. Sorting and Ranking Based on TOPSIS
4.5.1. Indicator Normalization
4.5.2. Selecting Weights of Indicators
4.5.3. Finding the Best and Worst Solution Based on TOPSIS
4.6. Sorting and Ranking Based on AECIEI
5. Results
5.1. Ranking Based on TOPSIS
5.2. Ranking Based on AECIEI
6. Conclusions
Author Contributions
Acknowledgments
Conflicts of Interest
References
- World Bank. Sustainable Transport—Priorities for Policy Reform; World Bank: Washington, DC, USA, 1996. [Google Scholar]
- OECD (Organisation for Economic Co-operation and Development); Environment Policy Committee; Working Group on the State of the Environment. Indicators for the Integration of Environmental Concerns into Transport Policies; OECD Publications: Paris, France, 1999. [Google Scholar]
- Sdoukopoulos, A.; Pitsiava-Latinopoulou, M.; Basbas, S.; Papaioannou, P. Measuring progress towards transport sustainability through indicators: Analysis and metrics of the main indicator initiatives. Transp. Res. Part D 2019, 67, 316–333. [Google Scholar] [CrossRef]
- UN (United Nations). Report of the World Commission on Environment and Development; United Nations Publication: New York, NY, USA, 1987. [Google Scholar]
- Litman, T. Reinventing Transportation: Exploring the Paradigm Shift Needed to Reconcile Transportation and Sustainability Objectives; Victoria Transport Policy Institute: Victoria, BC, Canada, 2003. [Google Scholar]
- Bueno, P.C.; Vassallo, J.M.; Cheung, K. Sustainability assessment of transport infrastructure projects: A review of existing tools and methods. Transp. Rev. 2015, 35, 622–649. [Google Scholar] [CrossRef] [Green Version]
- Litman, T.; Burwell, M. Issues in Sustainable Transportation International. J. Glob. Environ. Issues 2006, 6, 331–347. [Google Scholar] [CrossRef]
- Marsden, G.; Snell, C. The Role of Indicators, Targets and Monitoring in Decision-Support for Transport. EJTIR 2009, 9, 219–236. [Google Scholar]
- WCED (World Commission on Environment and Development). Our Common Future; Oxford University Press: Oxford, UK, 1987. [Google Scholar]
- Quaddus, M.A.; Siddique, M.A.B. Modeling sustainable development planning: A multi criteria decision conferencing approach. Environ. Int. 2001, 27, 89–95. [Google Scholar] [CrossRef]
- Ahuti, S. Industrial growth and environmental degradation. Int. Educ. Res. J. 2015, 1, 5–7. [Google Scholar]
- Gilbert, R.; Irwin, N.; Hollingworth, B.; Blais, P. Sustainable Transportation Performance Indicators (STPI). In Proceedings of the 82nd Transportation Research Board Annual Meeting, Washington, DC, USA, 12–16 January 2003. [Google Scholar]
- Haghshenas, H.; Vaziri, M. Urban sustainable transportation indicators for global comparison. Ecol. Indic. 2012, 15, 115–121. [Google Scholar] [CrossRef]
- Litman, T. Well Measured: Developing Indicators for Sustainable and Liveable Transport Planning; Victoria Transport Policy Institute: Victoria, BC, Canada, 2012. [Google Scholar]
- Zegras, C. Sustainable Urban Mobility. Exploring the Role of the Built Environment. Ph.D. Thesis, Urban and Regional Planning, Massachusetts Institute of Technology, Cambridge, MA, USA, 2005. [Google Scholar]
- Zegras, C. Sustainable transport indicators and assessment methodologies. In Proceedings of the Biannual Conference and Exhibit of the Clean Air Initiative for Latin American Cities, Sao Paulo, Brazil, 25–27 July 2006. [Google Scholar]
- Castillo, H.; Pitfield, D.E. ELASTIC-A methodological framework for identifying and selecting sustainable transport indicators. Transp. Res. Part D Transp. Environ. 2010, 15, 179–188. [Google Scholar] [CrossRef] [Green Version]
- Jeon, C.M.; Amekudzi, A. Addressing sustainability in transportation systems: Definitions, indicators, and metrics. J. Infrastruct. Syst. 2005, 11, 31–50. [Google Scholar] [CrossRef]
- Zheng, J.; Garrick, N.W.; Atkinson-Palombo, C.; McCahill, C.; Marshall, W. Guidelines on developing performance metrics for evaluating transportation sustainability. Res. Transp. Bus. Manag. 2013, 7, 4–13. [Google Scholar] [CrossRef]
- Thompson, U.C.; Marsan, J.F.; Fournier-Peyresblanques, B.; Forgues, C.; Ogaa, A.; Jaeger, J.A. Using compliance analysis for PPP to bridge the gap between SEA and EIA: Lessons from the Turcot interchange reconstruction in Montréal, Québec. Environ. Impact Assess. Rev. 2013, 42, 74–86. [Google Scholar] [CrossRef]
- Litman, T. Sustainable Transportation Indicators: A Recommended Program to Define a Standard Set of Indicators for Sustainable Transportation Planning; Victoria Transport Policy Institute: Victoria, BC, Canada, 2008. [Google Scholar]
- Jeon, C.M.; Amekudzi, A.; Guensler, R.L. Sustainability assessment at the transportation planning level: Performance measures and indexes. Transp. Policy 2013, 25, 10–21. [Google Scholar] [CrossRef]
- Mansourianfar, M.H.; Haghshenas, H. Micro-scale sustainability assessment of infrastructure projects on urban transportation systems: Case study of Azadi district, Isfahan, Iran. Cities 2018, 72, 149–159. [Google Scholar] [CrossRef]
- Clevenger, C.M.; Ozbek, M.E.; Simpson, S. Review of sustainability rating systems used for infrastructure projects. In Proceedings of the 49th ASC Annual International Conference, San Luis Obispo, CA, USA, 10–13 April 2013. [Google Scholar]
- Simpson, S.P. A Framework for Assessing Transportation Sustainability Rating Systems for Implementation in US State Departments of Transportation. Ph.D. Thesis, Colorado State University, Fort Collins, CO, USA, 2013. [Google Scholar]
- Reisi, M.; Aye, L.; Rajabifar, D.A.; Ngo, T. Transport sustainability index: Melbourne case study. Ecol. Indic. 2014, 43, 288–296. [Google Scholar] [CrossRef]
- CEM. Sustainability and the Built Environment, 1st ed.; College of Estate Management: London, UK, 2008. [Google Scholar]
- McVoy, G.R.; Nelson, D.A.; Krekeler, P.; Kolb, E.; Gritsavage, J.S. Moving towards sustainability: New York State Department of Transportation’s GreenLITES story. In Proceedings of the Green Streets and Highways 2010: An Interactive Conference on the State of the Art and How to Achieve Sustainable Outcomes, Denver, CO, USA, 14–17 November 2010; pp. 461–479. [Google Scholar]
- Lee, J.; Edil, T.; Benson, C.; Tinjum, J. Evaluation of variables affecting sustainable highway design with BE2ST-in-Highways system. Transportation Research Record. J. Transp. Res. Board 2011, 2233, 178–186. [Google Scholar] [CrossRef]
- Bristow, A.L.; Nellthorp, J. Transport project appraisal in the European Union. Transp. Policy 2000, 7, 51–60. [Google Scholar] [CrossRef]
- Bonneson, J.; Zimmerman, K.; Jacobson, M. Review and Evaluation of Interchange Ramp Design Considerations for Facilities without Frontage Roads; Report No. FHWA/TX-04/4538-1; Texas Transportation Institute: College Station, TX, USA, 2003. [Google Scholar]
- Edwards, B. Sustainability and the Design of Transport Interchanges; Routledge: Abingdon, UK, 2011. [Google Scholar]
- Wolhuter, K.M. Geometric Design of Roads Handbook; CRC Press: Boca Raton, FL, USA, 2015. [Google Scholar]
- Hancock, M.W.; Wright, B. A Policy on Geometric Design of Highways and Streets; American Association of State Highway Transportation Officials: Washington, DC, USA, 2013. [Google Scholar]
- Falcocchio, J.C.; Levinson, H.S. Road Traffic Congestion: A Concise Guide; Springer: Cham, Switzerland, 2015; Volume 7. [Google Scholar]
- Wolshon, B.; Pande, A. Traffic Engineering Handbook; John Wiley & Sons: Hoboken, NJ, USA, 2016. [Google Scholar]
- John, A.; Yang, Z.; Riahi, R.; Wang, J. Application of a collaborative modelling and strategic fuzzy decision support system for selecting appropriate resilience strategies for seaport operations. J. Traffic Transp. Eng. Engl. Ed. 2014, 1, 159–179. [Google Scholar] [CrossRef] [Green Version]
- Teng, J.; He, C.; Liu, X.; Yang, X. Traffic management plan evaluation outside the station in emergent events of urban rail transit. Urban Rail Transit 2016, 2, 16–27. [Google Scholar] [CrossRef] [Green Version]
- Lu, K.; Han, B.; Zhou, X. Smart urban transit systems: From integrated framework to interdisciplinary perspective. Urban Rail Transit 2018, 4, 49–67. [Google Scholar] [CrossRef]
- Wu, L.; Xia, H.; Cao, X.; Zhang, C.; Dai, C. Research on Quantitative Demand of Underground Space Development for Urban Rail Transit Station Areas: A Case Study of Metro Line 1 in Xuzhou, China. Urban Rail Transit 2018, 4, 257–273. [Google Scholar] [CrossRef] [Green Version]
- Olojede, O.A. The Hell-Bound Bandwagon: Train Rooftop Riding in Lagos Metropolis, Nigeria. Urban Rail Transit 2019, 5, 29–38. [Google Scholar] [CrossRef] [Green Version]
- Jeihani, M.; James, P.; Saka, A.A.; Ardeshiri, A. Traffic recovery time estimation under different flow regimes in traffic simulation. J. Traffic Transp. Eng. Engl. Ed. 2015, 2, 291–300. [Google Scholar] [CrossRef] [Green Version]
- An, H.K.; Yue, W.L.; Stazic, B. Estimation of vehicle queuing lengths at metering roundabouts. J. Traffic Transp. Eng. Engl. Ed. 2017, 4, 545–554. [Google Scholar] [CrossRef]
- Freudenberg, M. Composite Indicators of Country Performance: A Critical Assessment; OECD Publishing: Paris, France, 2003. [Google Scholar]
- Caliper Corporation. The User’s Guide to Trans CAD 5.0 Transportation Planning Software; Caliper Corporation: Newton, MA, USA, 2007. [Google Scholar]
- TSS. AIMSUN 8.0 Dynamic Simulators User’s Manual; Aimsun SLU: Barcelona, Spain, 2012. [Google Scholar]
- Shiftan, Y.; Kaplan, S.; Hakkert, S. Scenario building as a tool for planning a sustainable transportation system. Transp. Res. Part D Transp. Environ. 2003, 8, 323–342. [Google Scholar] [CrossRef]
- EEA. Core Set of Indicators: Guide; European Environment Agency Technical Report 1; European Environment Agency: Luxembourg, Luxembourg, 2005; pp. 1725–2237. [Google Scholar]
- OECD (Organisation for Economic Co-operation and Development). Glossary of Statistical Terms, Organization for Economic Cooperation and Development Statistics Portal; Organisation for Economic Co-operation and Development: Paris, France, 2005. [Google Scholar]
- EPA. Air Quality Index Reporting, Final Rule; Federal Register, Part III, CFR Part 58; US Environmental Protection Agency: Washington, DC, USA, 2016. [Google Scholar]
- Ebrahimi, A.; Ghanbari, A. Air pollutant emission model development of urban transportation activities. In Proceedings of the 11th International Conference on Traffic and Transportation, Tehran, Iran, 21–22 February 2012. (In Persian). [Google Scholar]
- Isfahan University of Technology. Evaluation of First Phase Activities in Comprehensive Transport Studies in Isfahan; Initial Report; Isfahan University of Technology: Isfahan, Iran, 2006. [Google Scholar]
- Sharif University of Technology Transportation Research Center. Traffic Allocation Model and Performance of the Metropolitan Transportation System of Isfahan in 2000; Report No. 04-83; Sharif University of Technology Transportation Research Center: Tehran, Iran, 2004. [Google Scholar]
- Harwood, D.W.; Bauer, K.M.; Richard, K.R.; Gilmore, D.K.; Graham, J.L.; Potts, I.B.; Hauer, E. Methodology to Predict the Safety Performance of Urban and Suburban Arterials (No. NCHRP Project 17-26); National Cooperative Highway Research Program: Washington, DC, USA, 2007. [Google Scholar]
- AASHTO (American Association of State Highway Transportation Officials). Highway Safety Manual; American Association of State Highway Transportation Officials: Washington, DC, USA, 2010. [Google Scholar]
- Dixon, K.; Monsere, C.; Xie, F.; Gladhill, K. Calibrating the Future Highway Safety Manual Predictive Methods for Oregon State Highways (No. FHWA-OR-RD-12-07); Federal Highway Administration, Department of Transportation, Research Section: Oregon, OR, USA, 2012. [Google Scholar]
- D’Agostino, C. Investigating transferability and goodness of fit of two different approaches of segmentation and model form for estimating safety performance of motorways. Procedia Eng. 2014, 84, 613–623. [Google Scholar] [CrossRef] [Green Version]
- WHO (World Health Organization). Burden of Disease from Environmental Noise. 2011. Available online: http://docs.wind-watch.org/WHO-burden-of-disease-from-environmentalnoise-2011.pdf (accessed on 12 October 2019).
- Givargis, S.; Mahmoodi, M. Converting the UK calculation of road traffic noise (CORTN) to a model capable of calculating LAeq, 1h for the Tehran’s roads. Appl. Acoust. 2008, 69, 1108–1113. [Google Scholar] [CrossRef]
- Haghshenas, H.; Vaziri, M.; Gholamialam, A. Sustainable urban transport assessment in Asian cities. Curr. World Environ. 2013, 8, 221–230. [Google Scholar] [CrossRef]
- Plan and Budget Organization. Presidency Islamic Republic of Iran; Plan and Budget Organization: Tehran, Iran, 2018. [Google Scholar]
- Flyvbjerg, B.; Bruzelius, N.; van Wee, B. Comparison of capital costs per route-kilometer in urban rail. Eur. J. Transp. Infrastruct. Res. 2008, 8, 17–30. [Google Scholar]
- Heggie, I.G.; Vickers, P. Commercial Management and Financing of Roads; World Bank Publications: Washington, DC, USA, 1998; Volume 23. [Google Scholar]
- Mandell, S. Carbon Emissions and Cost Benefit Analyses; International Transport Forum Discussion Paper; OECD Publications: Paris, France, 2013. [Google Scholar]
- van Wee, B. Rail infrastructure: Challenges for cost—Benefit analysis and other ex-ante evaluations. Transp. Plan. Technol. 2007, 30, 31–48. [Google Scholar] [CrossRef]
- Tudela, A.; Akiki, N.; Cisternas, R. Comparing the output of cost benefit and multi-criteria analysis: An application to urban transport investments. Transp. Res. Part A Policy Pract. 2006, 40, 414–423. [Google Scholar] [CrossRef]
- Walker, G. Environmental justice, impact assessment and the politics of knowledge: The implications of assessing the social distribution of environmental outcomes. Environ. Impact Assess. Rev. 2010, 30, 312–318. [Google Scholar] [CrossRef]
- Hwang, C.L.; Yoon, K. Methods for multiple attribute decision making. In Multiple Attribute Decision Making; Springer: Berlin/Heidelberg, Germany, 1981; pp. 58–191. [Google Scholar]
- Yoon, K. A reconciliation among discrete compromise solutions. J. Oper. Res. Soc. 1987, 38, 277–286. [Google Scholar] [CrossRef]
- Hwang, C.L.; Lai, Y.J.; Liu, T.Y. A new approach for multiple objective decision making. Comput. Oper. Res. 1993, 20, 889–899. [Google Scholar] [CrossRef]
- Hahn, R.; Kühnen, M. Determinants of sustainability reporting: A review of results, trends, theory, and opportunities in an expanding field of research. J. Clean. Prod. 2013, 59, 5–21. [Google Scholar] [CrossRef]
- Rösch, C.; Skarka, J.; Raab, K.; Stelzer, V. Energy production from grassland. Assessing the sustainability of different process chains under German conditions. Biomass Bioenergy 2009, 33, 689–700. [Google Scholar] [CrossRef]


| Sustainability Dimension | Area | Indicator | Unit |
|---|---|---|---|
| Environmental indicators | Air pollution | NOx, HC and CO emission per hour | kg/h |
| GHG emission | CO2 emissions per hour | kg/h | |
| Consumption of natural resources | Fuel consumption | L/h | |
| Green spaces destruction | m² | ||
| Land consumed for transport | m² | ||
| Social indicators | Safety | Average crash frequency | accident/km |
| Public satisfaction | Average travel time | second/person | |
| Noise pollution | Exposure to noise level above 55 dB | m² | |
| Economic indicators | Operator costs | Capital cost | dollar |
| Maintenance and repair cost | dollar |
| Area | Goals |
|---|---|
| Interchanges, Highways, and relevant streets | -Decreasing traffic congestion |
| -Safety promotion | |
| -Decreasing air pollution, CO2 emission and noise pollution | |
| -Improving the visual aesthetics | |
| -Revising reasons for weaving | |
| -Increasing speed and fluidity of traffic | |
| -Creating easy access to highways and streets |
| Kind of Effect | Effect Value (EV) |
|---|---|
| Very high effect | 5 |
| High effect | 4 |
| Moderate effect | 3 |
| Low effect | 2 |
| Slight effect | 1 |
| Indicator | Environmental Indicators | Social Indicators | Economic Indicators | ci* | |||||||
|---|---|---|---|---|---|---|---|---|---|---|---|
| Air Pollution | Carbon Dioxide Emissions | Fuel Consumption | Green Space Destruction | Land Consumption | Safety | Average Travel Time per Capita | Exposure to Noise Level above 55 dB | Capital Cost | Maintenance and Repair | ||
| (kg/h) | (kg/h) | (L/h) | (m²) | (m²) | (acc/year) | (s/pers) | (m²) | (Million $) | (1000 $) | ||
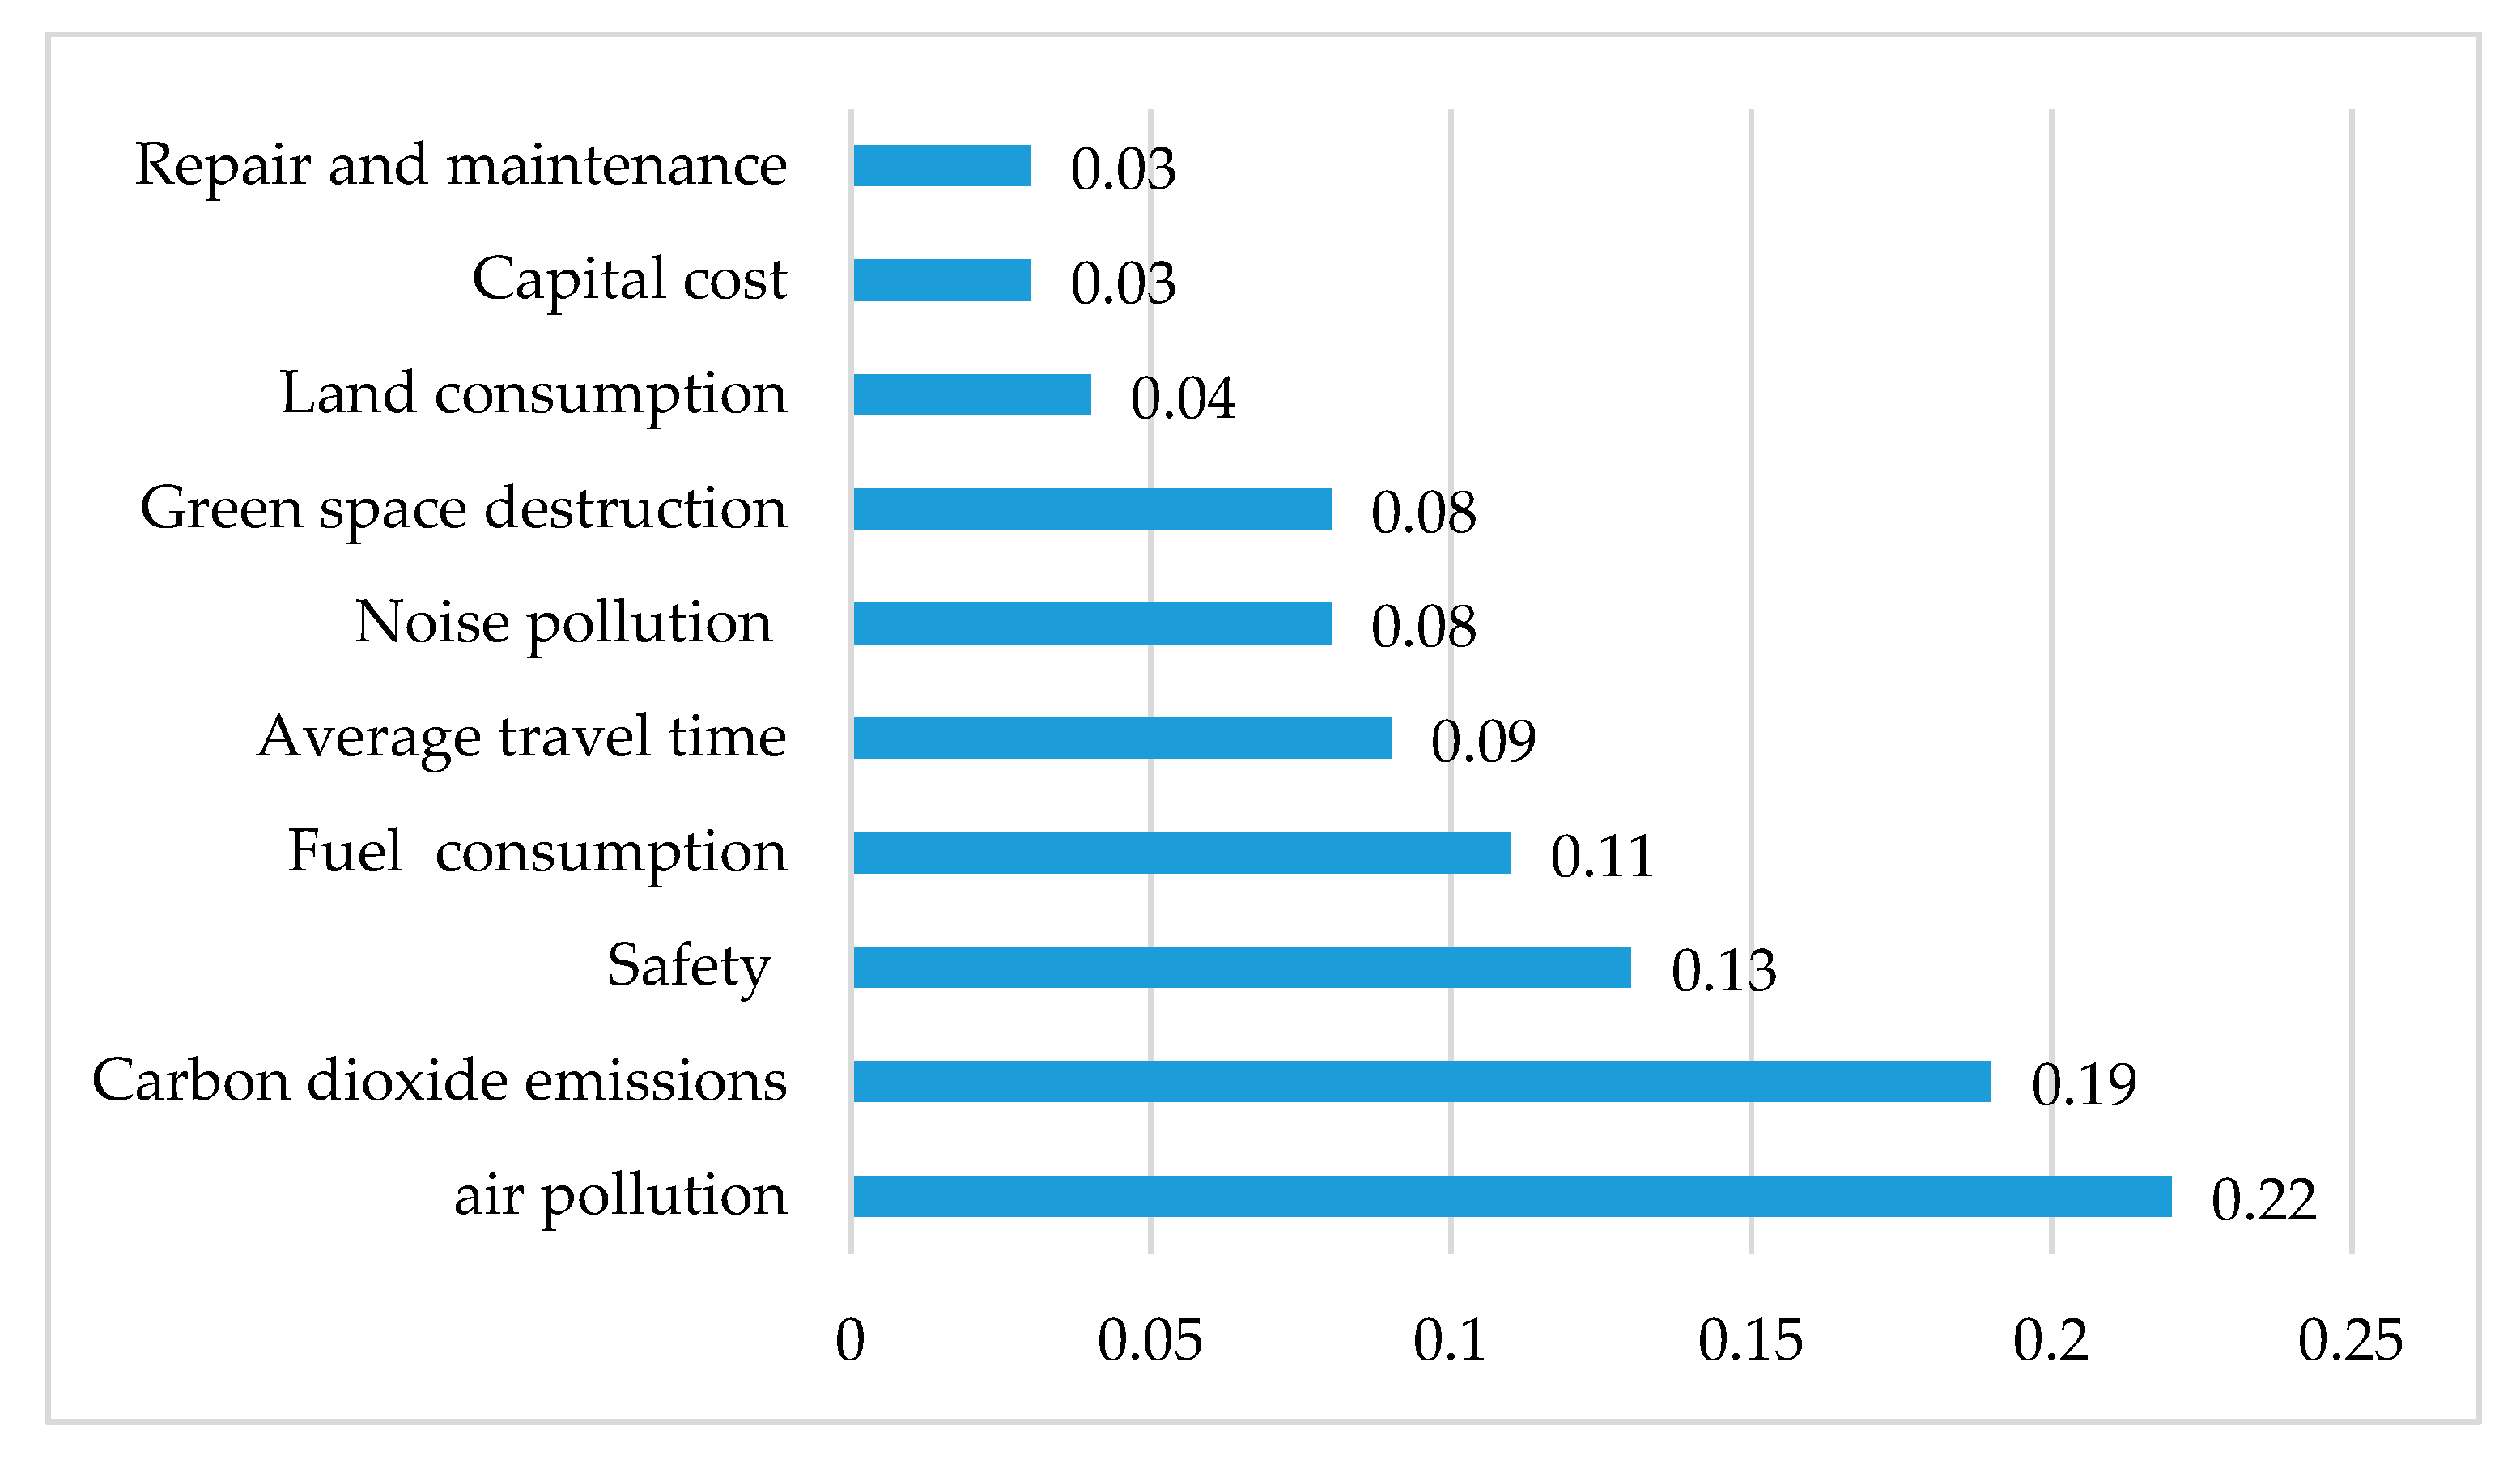
| Weight | 0.22 | 0.19 | 0.11 | 0.08 | 0.04 | 0.13 | 0.09 | 0.08 | 0.03 | 0.03 | |
| current Sc. | 16.85 | 193.13 | 4275.6 | 0.00 | 0.00 | 405.44 | 358.45 | 553,151.4 | 0.00 | 1071.6 | 0.35 |
| 0.43 | 0.43 | 0.43 | 0.00 | 0.00 | 0.38 | 0.41 | 0.37 | 0.00 | 0.27 | ||
| Scenario 1 | 12.29 | 149.81 | 3233.2 | 28,760 | 28,760.0 | 405.41 | 294.20 | 580,887.4 | 0.53 | 2222.0 | 0.64 |
| 0.32 | 0.32 | 0.32 | 0.71 | 0.70 | 0.38 | 0.34 | 0.39 | 0.35 | 0.56 | ||
| Scenario 2 | 14.83 | 191.13 | 4248.1 | 0.00 | 290.0 | 405.44 | 308.54 | 553,772.9 | 0.20 | 1072.0 | 0.29 |
| 0.38 | 0.42 | 0.42 | 0.00 | 0.01 | 0.38 | 0.36 | 0.37 | 0.13 | 0.27 | ||
| Scenario 3 | 16.18 | 167.48 | 3716.0 | 0.00 | 270.0 | 405.44 | 335.98 | 553,608.2 | 0.20 | 1072.8 | 0.28 |
| 0.42 | 0.37 | 0.37 | 0.00 | 0.01 | 0.38 | 0.39 | 0.37 | 0.13 | 0.27 | ||
| Scenario 4 | 16.38 | 176.77 | 3927.7 | 0.00 | 560.0 | 405.44 | 339.15 | 553,395.2 | 0.39 | 1073.2 | 0.32 |
| 0.42 | 0.39 | 0.39 | 0.00 | 0.01 | 0.38 | 0.39 | 0.37 | 0.26 | 0.27 | ||
| Scenario 5 | 13.18 | 165.83 | 3670.9 | 0.00 | 560.0 | 405.44 | 354.78 | 552,769.4 | 0.65 | 1089.2 | 0.21 |
| 0.34 | 0.37 | 0.37 | 0.00 | 0.01 | 0.38 | 0.41 | 0.37 | 0.43 | 0.27 | ||
| Scenario 6 | 11.93 | 146.89 | 3338.5 | 28,760 | 29,320.0 | 405.41 | 299.30 | 565,795.7 | 1.18 | 2239.6 | 0.65 |
| 0.31 | 0.32 | 0.33 | 0.71 | 0.71 | 0.38 | 0.34 | 0.38 | 0.77 | 0.56 | ||
| Indicator | Environmental Indicators | Social Indicators | Economic Indicators | SVi | |||||||
|---|---|---|---|---|---|---|---|---|---|---|---|
| Air Pollution | Carbon Dioxide Emissions | Fuel Consumption | Green Space Destruction | Land Consumption | Safety | Average Travel Time per Capita | Exposure to Noise Level above 55 dB | Capital Cost | Maintenance and Repair | ||
| (Kg/h) | (Kg/h) | (L/h) | (m²) | (m²) | (acc/year) | (s/pers) | (m²) | (Million $) | (1000 $) | ||
| Weight | 0.22 | 0.19 | 0.11 | 0.08 | 0.04 | 0.13 | 0.09 | 0.08 | 0.03 | 0.03 | |
| Effect Value | 5 | 5 | 4 | 3 | 1 | 4 | 3 | 3 | 1 | 1 | |
| current Sc. | 16.85 | 193.13 | 4275.6 | 0.00 | 0.00 | 405.44 | 358.45 | 553,151.4 | 0.00 | 1071.6 | −0.177 |
| 0.26 | 0.24 | 0.22 | 0.00 | 0.00 | 0.14 | 0.18 | 0.14 | 0.00 | 0.11 | ||
| Scenario 1 | 12.29 | 149.81 | 3233.2 | 28,760 | 28,760.0 | 405.41 | 294.20 | 580,887.4 | 0.53 | 2222.0 | −0.144 |
| 0.05 | 0.07 | 0.07 | 0.50 | 0.48 | 0.14 | 0.10 | 0.16 | 0.17 | 0.23 | ||
| Scenario 2 | 14.83 | 191.13 | 4248.1 | 0.00 | 290.0 | 405.44 | 308.54 | 553,772.9 | 0.20 | 1072.0 | −0.143 |
| 0.14 | 0.23 | 0.22 | 0.00 | 0.00 | 0.14 | 0.12 | 0.14 | 0.06 | 0.11 | ||
| Scenario 3 | 16.18 | 167.48 | 3716.0 | 0.00 | 270.0 | 405.44 | 335.98 | 553,608.2 | 0.20 | 1072.8 | −0.132 |
| 0.21 | 0.12 | 0.13 | 0.00 | 0.00 | 0.14 | 0.15 | 0.14 | 0.06 | 0.11 | ||
| Scenario 4 | 16.38 | 176.77 | 3927.7 | 0.00 | 560.0 | 405.44 | 339.15 | 553,395.2 | 0.39 | 1073.2 | −0.147 |
| 0.22 | 0.16 | 0.16 | 0.00 | 0.01 | 0.14 | 0.16 | 0.14 | 0.12 | 0.11 | ||
| Scenario 5 | 13.18 | 165.83 | 3670.9 | 0.00 | 560.0 | 405.44 | 354.78 | 552,769.4 | 0.65 | 1089.2 | −0.107 |
| 0.08 | 0.11 | 0.12 | 0.00 | 0.01 | 0.14 | 0.18 | 0.14 | 0.21 | 0.11 | ||
| Scenario 6 | 11.93 | 146.89 | 3338.5 | 28,760 | 29,320.0 | 405.41 | 299.30 | 565,795.7 | 1.18 | 2239.6 | −0.149 |
| 0.05 | 0.06 | 0.08 | 0.50 | 0.49 | 0.14 | 0.11 | 0.15 | 0.38 | 0.23 | ||
© 2020 by the authors. Licensee MDPI, Basel, Switzerland. This article is an open access article distributed under the terms and conditions of the Creative Commons Attribution (CC BY) license (http://creativecommons.org/licenses/by/4.0/).
Share and Cite
Shishegaran, A.; Shishegaran, A.; Mazzulla, G.; Forciniti, C. A Novel Approach for a Sustainability Evaluation of Developing System Interchange: The Case Study of the Sheikhfazolah-Yadegar Interchange, Tehran, Iran. Int. J. Environ. Res. Public Health 2020, 17, 435. https://0-doi-org.brum.beds.ac.uk/10.3390/ijerph17020435
Shishegaran A, Shishegaran A, Mazzulla G, Forciniti C. A Novel Approach for a Sustainability Evaluation of Developing System Interchange: The Case Study of the Sheikhfazolah-Yadegar Interchange, Tehran, Iran. International Journal of Environmental Research and Public Health. 2020; 17(2):435. https://0-doi-org.brum.beds.ac.uk/10.3390/ijerph17020435
Chicago/Turabian StyleShishegaran, Aydin, Arshia Shishegaran, Gabriella Mazzulla, and Carmen Forciniti. 2020. "A Novel Approach for a Sustainability Evaluation of Developing System Interchange: The Case Study of the Sheikhfazolah-Yadegar Interchange, Tehran, Iran" International Journal of Environmental Research and Public Health 17, no. 2: 435. https://0-doi-org.brum.beds.ac.uk/10.3390/ijerph17020435