Article

Short-Term Associations of Fine Particulate Matter and Synoptic Weather Types with Cardiovascular Mortality: An Ecological Time-Series Study in Shanghai, China

1
Department of Public Health Sciences, Karolinska Institutet, 17177 Stockholm, Sweden
2
Center for Assessment of Medical Technology, Örebro University Hospital, Örebro University, 70182 Örebro, Sweden
3
Clinical Epidemiology and Biostatistics, School of Medical Sciences, Örebro University, 70182 Örebro, Sweden
4
Clinical Epidemiology Division, Department of Medicine, Karolinska Institutet, 17177 Stockholm, Sweden
5
Department of Epidemiology and Public Health, University College London, London WC1E 6BT, UK
6
Division of Vital Statistics, Shanghai Municipal Center for Disease Control and Prevention, Shanghai 200336, China
7
Institute of Health Information, Shanghai Municipal Center for Disease Control and Prevention, Shanghai 200336, China
*
Authors to whom correspondence should be addressed.
Int. J. Environ. Res. Public Health 2020, 17(3), 1111; https://0-doi-org.brum.beds.ac.uk/10.3390/ijerph17031111
Submission received: 24 December 2019 / Revised: 5 February 2020 / Accepted: 9 February 2020 / Published: 10 February 2020
(This article belongs to the Special Issue Air Pollution and Climate Change-Mediated Health Impacts)

Abstract

:
Background: Exposures to both ambient fine particulate matter (PM2.5) and extreme weather conditions have been associated with cardiovascular disease (CVD) deaths in numerous epidemiologic studies. However, evidence on the associations with CVD deaths for interaction effects between PM2.5 and weather conditions is still limited. This study aimed to investigate associations of exposures to PM2.5 and weather conditions with cardiovascular mortality, and further to investigate the synergistic or antagonistic effects of ambient air pollutants and synoptic weather types (SWTs). Methods: Information on daily CVD deaths, air pollution, and meteorological conditions between 1 January 2012 and 31 December 2014 was obtained in Shanghai, China. Generalized additive models were used to assess the associations of daily PM2.5 concentrations and meteorological factors with CVD deaths. A 15-day lag analysis was conducted using a polynomial distributed lag model to access the lag patterns for associations with PM2.5. Results: During the study period, the total number of CVD deaths in Shanghai was 59,486, with a daily mean of 54.3 deaths. The average daily PM2.5 concentration was 55.0 µg/m3. Each 10 µg/m3 increase in PM2.5 concentration was associated with a 1.26% (95% confidence interval (CI): 0.40%, 2.12%) increase in CVD mortality. No SWT was statistically significantly associated with CVD deaths. For the interaction between PM2.5 and SWT, statistically significant interactions were found between PM2.5 and cold weather, with risk for PM2.5 in cold dry SWT decreasing by 1.47% (95% CI: 0.54%, 2.39%), and in cold humid SWT the risk decreased by 1.45% (95% CI: 0.52%, 2.36%). In the lag effect analysis, statistically significant positive associations were found for PM2.5 in the 1–3 lag days, while no statistically significant effects were found for other lag day periods. Conclusions: Exposure to PM2.5 was associated with short-term increased risk of cardiovascular deaths with some lag effects, while the cold weather may have an antagonistic effect with PM2.5. However, the ecological study design limited the possibility to identify a causal relationship, so prospective studies with individual level data are warranted.

Graphical Abstract

1. Introduction

Exposure to air pollution has been widely acknowledged as an important influencing factor for cardiovascular health [1]. In recent years, evolving epidemiological and clinical research has provided convincing evidence that exposure to air pollution, especially to fine particulate matter or PM2.5, can lead to progression of cardiovascular disease and triggering of acute cardiac events. PM2.5 refers to particulate matters with an aerodynamic equivalent diameter of 2.5 μm or less, which can be suspended in the air and inhaled into the lung to reach the alveoli. The higher its concentration in the air, the more serious is the air pollution. Investigations found that inhalation of air pollutants promotes the development of heart failure, arrhythmia, ischemic heart disease, and high blood pressure, and increases the incidence and mortality of cardiovascular diseases (CVD) [2]. Not only cardiovascular and respiratory diseases, but also all-cause mortality could be partly attributable to exposure to PM2.5 air pollution, regardless of the duration of the exposed window period [3,4].
Air pollution is a risk factor that can be modified, and scholars predicted potential mortality benefits of air pollution control in urban China, such that approximately 241,000–1,841,000 life-years could be saved annually for different scenarios of air pollution improvements, indicating substantial health benefits such as a 25% improvement in hypertension control and 30% reduction in cigarette control combined [5].
The effects of air pollution on cardiac function are both long term and short term. A recent international study revealed that an increase of 10 μg/m3 in the two-day moving average of PM2.5 concentration was associated with increase of 0.55% (95% confidence interval (CI): 0.45%, 0.66%) in daily cardiovascular mortality [6]. A systematic review gathered evidence on the long-term effects of exposure to PM2.5, finding that an increase of 10 μg/m3 in PM2.5 concentration was associated with as high as 11% excess CVD mortality [7]. Furthermore, studies discovered that one of the independent modifiable risk factors triggering cardiovascular deaths was a long-term exposure to particulate matter [8,9]. For short-term effects, a meta-analysis in China summarized the evidence and concluded that 0.68% (95% CI: 0.39%, 0.97%) higher incidence of cardiovascular mortality is related to each 10 µg/m3 increase in PM2.5 [10]. Evidence from American and European countries also showed similar findings, suggesting that increased PM2.5 levels would significantly increase the risk of CVD deaths [4,11].
Meteorological conditions have been shown to influence daily mortality and disease burden in many studies, especially for the cardiovascular system. Weather conditions such as extreme temperature [12], diurnal temperature range [13,14], temperature variation [15], and humidity [16] have been defined as risk factors or effect modifiers that may contribute to CVD mortality.
However, results from research on ambient temperature and cardiovascular events have been inconsistent. A recent review gathered literature on associations of cold and heat on CVD risk, and concluded that both high and low temperatures were associated with higher cardiovascular risk [17]. In contrast, another review suggested that only heat waves might increase cardiovascular mortality, while cold spells increase the morbidity risk [18]. Excessively hot episodes in tropical areas have been shown to increase CVD mortality by 16.63 times (95% CI: 10.47, 26.42) compared with other seasons [19]. A study in Hong Kong identified that cold weather was associated with emergency hospital admission for cardiovascular events, with a relative risk (RR) of 1.22 (95% CI: 1.15, 1.29) [20]. Researchers from Vietnam found a 1 °C decrease in temperature was associated with an increase in CVD admissions of 12% (95% CI: 1%, 25%) [21]. A case series study in Catalonia concluded that cold spells, but not heat waves, increased the incidence of emergency cardiovascular hospitalizations [22].
Other weather factors have also been found associated with cardiovascular health. The presence of extreme weather and sudden decrease in air pressure are associated with more hospital admissions for CVD [23]. Descriptive analysis suggests that both cold, cloudy days and warm, rainy days with high humidity are related to CVD morbidity [24]. Long sunshine duration has been associated with a 15% increased risk of cardiovascular events [25].
Although PM2.5 and extreme weather conditions have been widely studied, results from research into CVD mortality associated with synergistic or antagonistic effects between PM2.5 and weather conditions remains inconsistent and inconclusive. Many previous studies included meteorological variables as individual covariates, while few of them fully considered the internal relationship of these variables and their collective effects. Importantly, investigations in high-income countries may not be applicable to China, which has one of the largest populations exposed to high levels of air pollution.
Our previous study indicated that PM2.5 together with favorable synoptic weather types (SWTs) was significantly associated with higher non-accidental mortality [26]. Based on our previous findings, we wanted to further investigate the associations between CVD deaths and PM2.5 pollution and weather conditions using a large-scale database of daily mortality in Shanghai, aiming at providing updated evidence on the associations of CVD mortality with PM2.5 and weather conditions, especially the effects of the interaction between air pollutants and the SWT.

2. Materials and Methods

2.1. Study Design and Setting

The study is observational and ecological, for the time period 1 January 2012 to 31 December 2014, aiming to access the associations of environmental factors with non-accidental CVD deaths. The environmental factors include air pollutants PM2.5, nitrogen dioxide (NO2), sulfur dioxide (SO2), six SWTs, and interactions between PM2.5 and SWT.
The population of the study was the residents who were registered in the Household Register of Shanghai (HRS). Shanghai is a municipality and the largest city in the east China, with longitude and latitude of 121° E and 31° N, located in the Yangtze River Delta Region, with a territory of about 6340 km2. Shanghai is the most populous city in the east China with a permanent resident population of around 24.18 million in 2017 and a local gross domestic product of approximately 3.27 trillion Yuan in 2017 [27].

2.2. Data Collection

Because PM2.5 was not routinely monitored in Shanghai until the end of 2012, we obtained hourly PM2.5 concentrations in 2012 published by the Shanghai US Consulate General, which was regarded as a reliable source of PM2.5 concentrations in China [28]. Daily average PM2.5 concentrations from 1 January 2013 to 31 December 2014 were obtained from the Shanghai Meteorological Bureau. The data came from only one air monitor during our study period to present the PM2.5 level for the whole city.
Daily weather meteorological data, including temperature, relative humidity, air pressure, wind speed, precipitation, and sunshine hours, during the same period were also obtained from the Shanghai Meteorological Bureau. Weather conditions were categorized into six SWTs using the method introduced by Vanos [29]. The extraction of daily SWT was based on the cluster analysis using measurements of temperature, barometric pressure, humidity, sunshine time, precipitation, and wind velocity, etc. constituting 18 meteorological variables during a day. The final weather types identified in our study included: hot dry, warm humid, cold dry, cool dry, cool humid, and cold humid [26].
Daily CVD mortality data in Shanghai were obtained from the Causes of Death Register of Shanghai (CDRS) provided by the Shanghai Municipal Center for Disease Control and Prevention (SCDC). Mortality from major CVDs was identified according to the International Classification of Diseases, 10th edition (ICD-10) codes I00-I78. There were no district-specific data available in the current study. CVD mortality was represented using daily death counts. Because the total population was relatively stable during the study period, we treated it as if it remained unchanged to produce mortality rates.

2.3. Statistical Analyses

Descriptive statistical methods were used to describe the characteristics of the variables. Daily CVD mortality and daily concentrations of air pollutants were examined graphically using time-series plots.
Generalized additive models (GAM) were used to assess the associations of exposure to PM2.5 and SWT with CVD mortality [30,31,32]. The regression models included the following components:
(1) The main risk factors PM2.5 and (2) SWT, using an indicator variable; (3) an interaction term between them; (4) an indicator variable for day of the week (DOW); and (5) a smooth function S for time to control for seasonal trend and unobserved confounders. The final model is described below, which was evaluated using Akaike’s information criterion (AIC):
log E Y t = β 0 + β 1 · P M 2.5 , t + β 2 · S W T t + β 3 · P M 2.5 , t × S W T t + β 4 · D O W t + S t ,
where E(Yt) refers to the expected cardiovascular deaths on day t; β0 represents the intercept; β1β4 refer to the coefficients for each variable; PM2.5,t represents the daily average PM2.5 concentration on day t; DOWt represents a 6 × 1 vector of DOW for day t; SWTt denotes a 5 × 1 vector of SWT for day t; PM2.5,t × SWTt denotes the interaction between PM2.5 and SWT for day t. S(t) is a smoothing function implemented by cubic B-splines, giving associations with unobserved factors and seasonal trends [33]. According to the AIC, we used a total of 45 knots for the splines to present the time trend and capture the true underlying parameters.
We also examined the 15-day lag patterns of PM2.5 by applying the polynomial distributed lag model (DLM) with the same splines to control for the nonlinear time trend [34]. The reason that 15 days were chosen as a lag period was to assess the short-term effects of PM2.5.
All statistical analyses were performed using the packages mgcv and dlnm in the software R 3.6.1 (R Foundation for Statistical Computing, Vienna, Austria). Statistical graphing was achieved using the packages plotrix and ggplot2 in R. Two-sided statistical tests were performed, and the regression coefficients with a P-value < 0.05 were considered statistically significant. To check the robustness of our model, a sensitivity analysis was applied by changing the knots in the smoothness of time and adding the co-exposed pollutants NO2 and SO2 in the models.

2.4. Ethical Consideration and Data Availability

The study is an ecological and observational study, based on the data from population-based registers in Shanghai. No personal identification was disclosed in our data. The study was approved by the Ethical Review Committee of the SCDC (approval number: SCDC2016-08).
The use of the data was under the agreement between the Institute of Environmental Medicine, Karolinska Institutet, Sweden and the SCDC within a bilateral collaboration framework. The data were not publicly available but may be available upon reasonable request and with permission of the SCDC ([email protected]).

3. Results

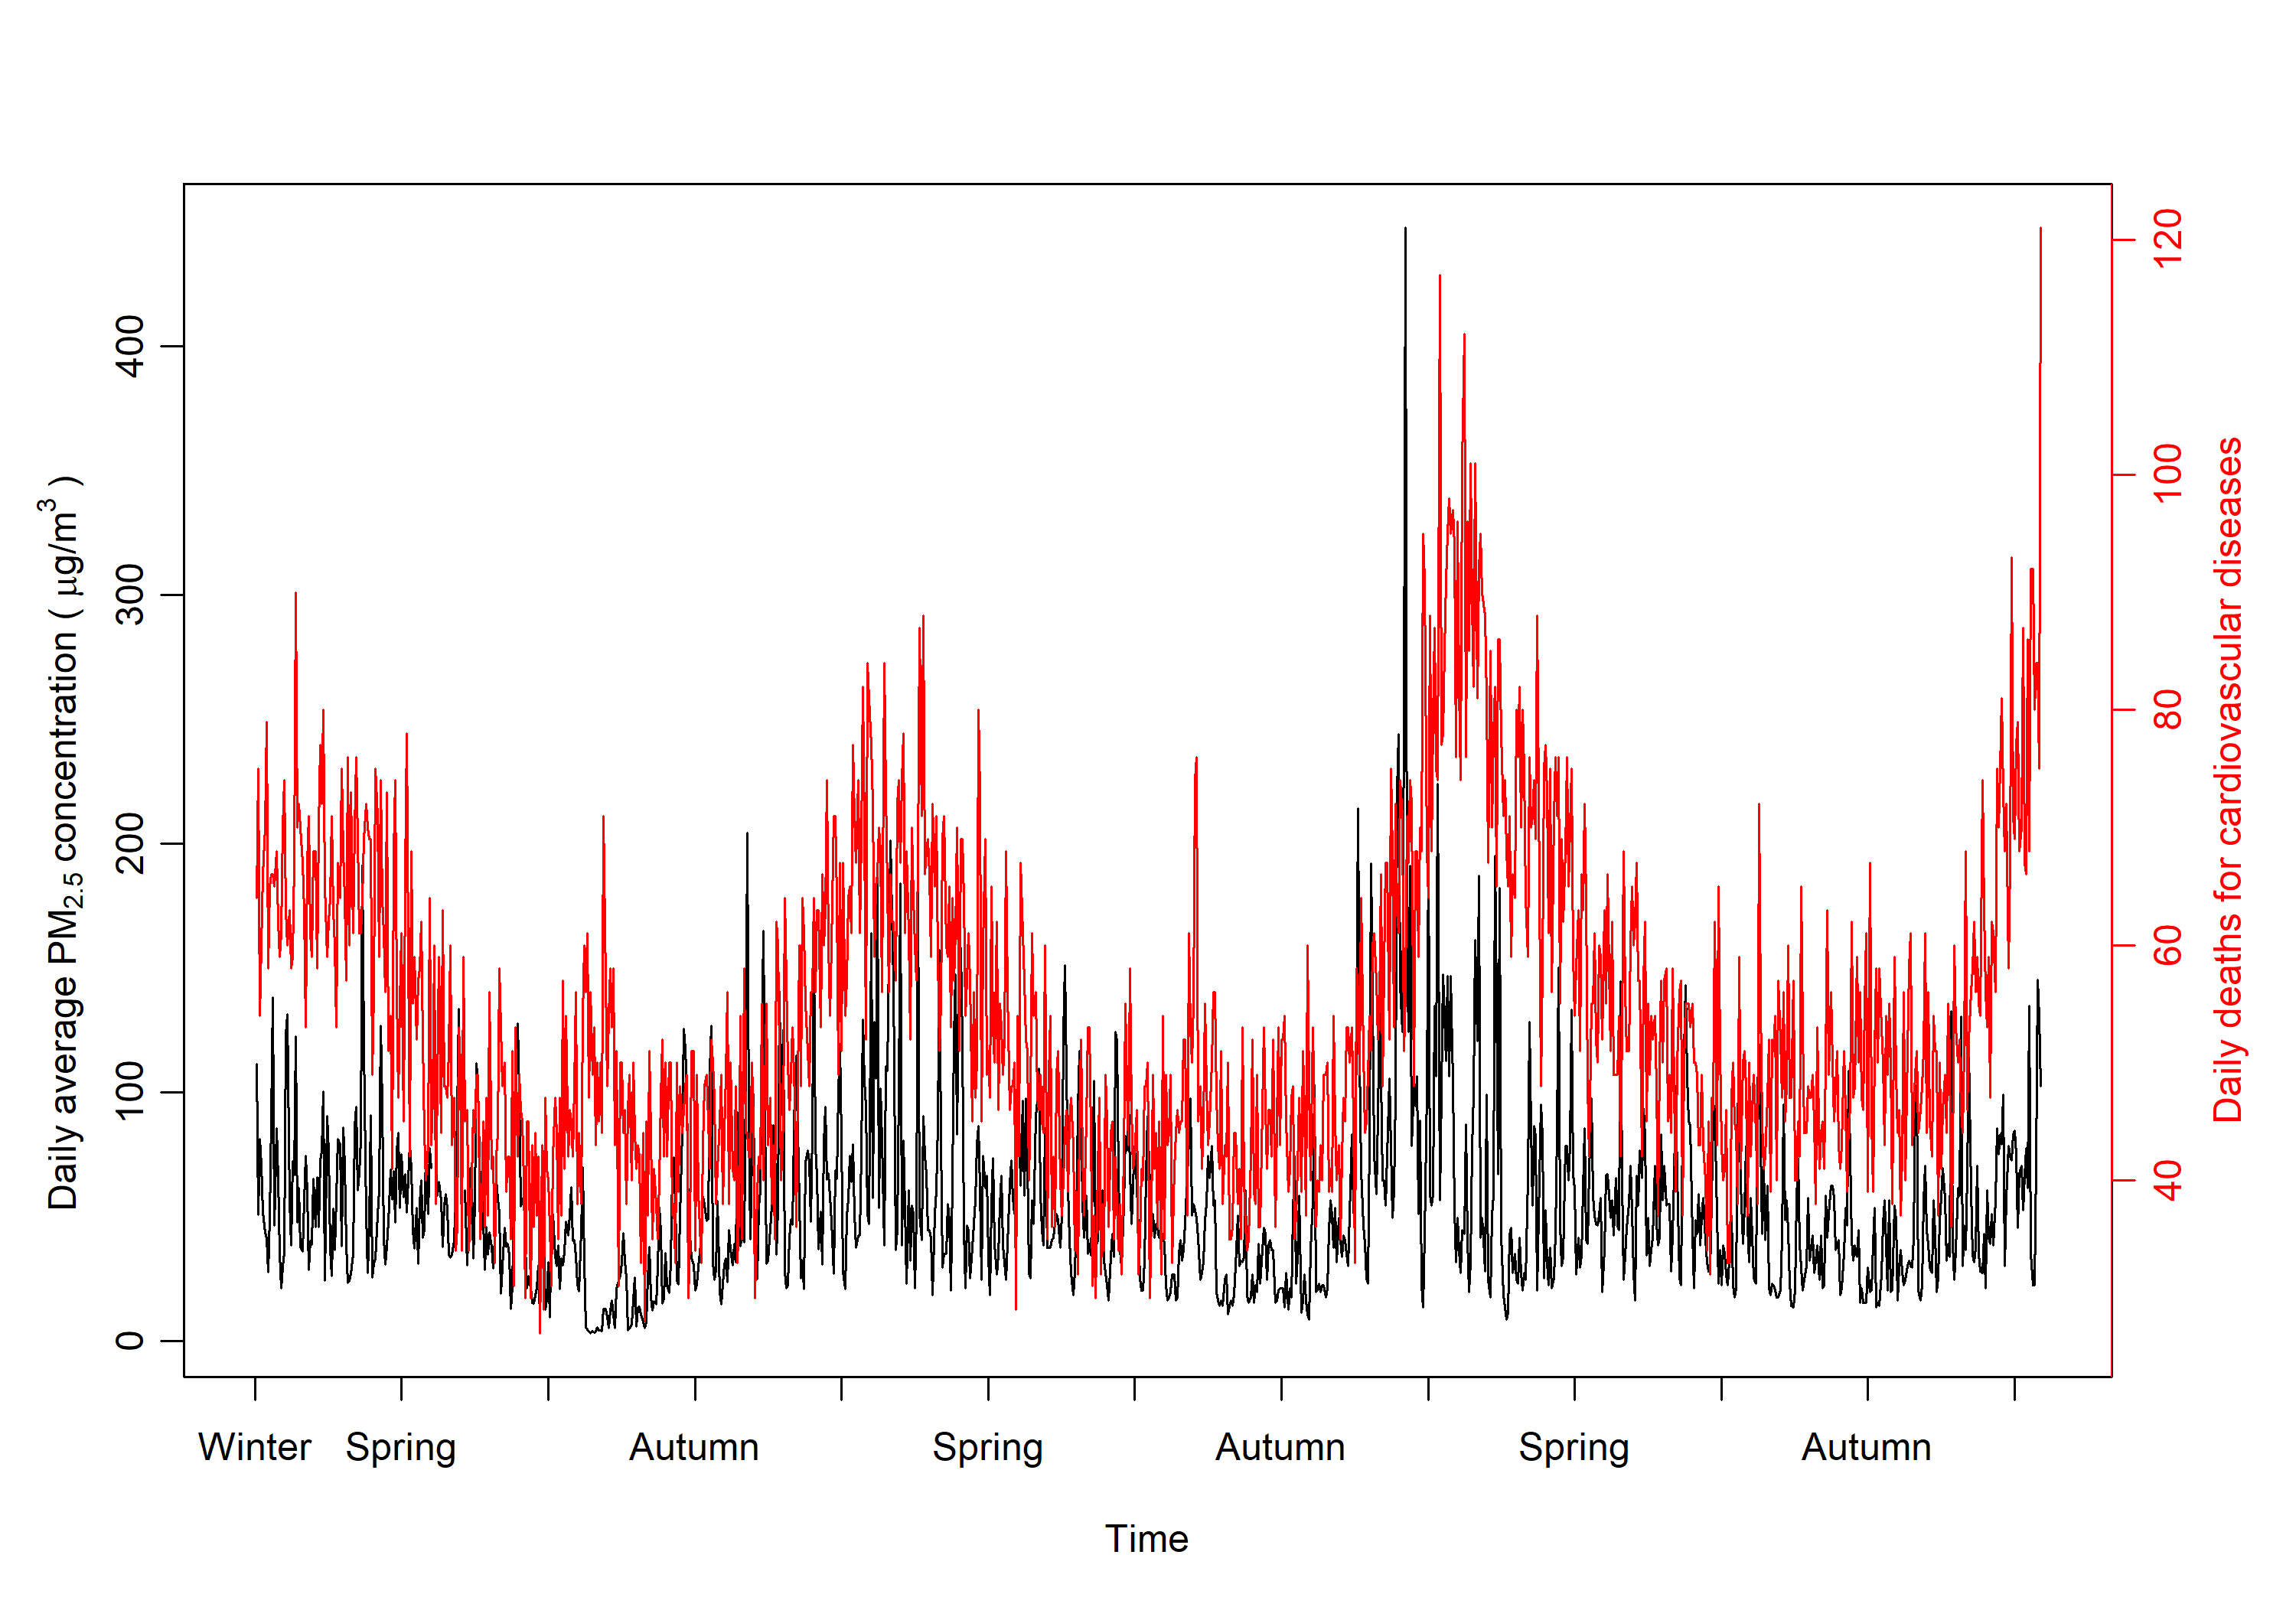
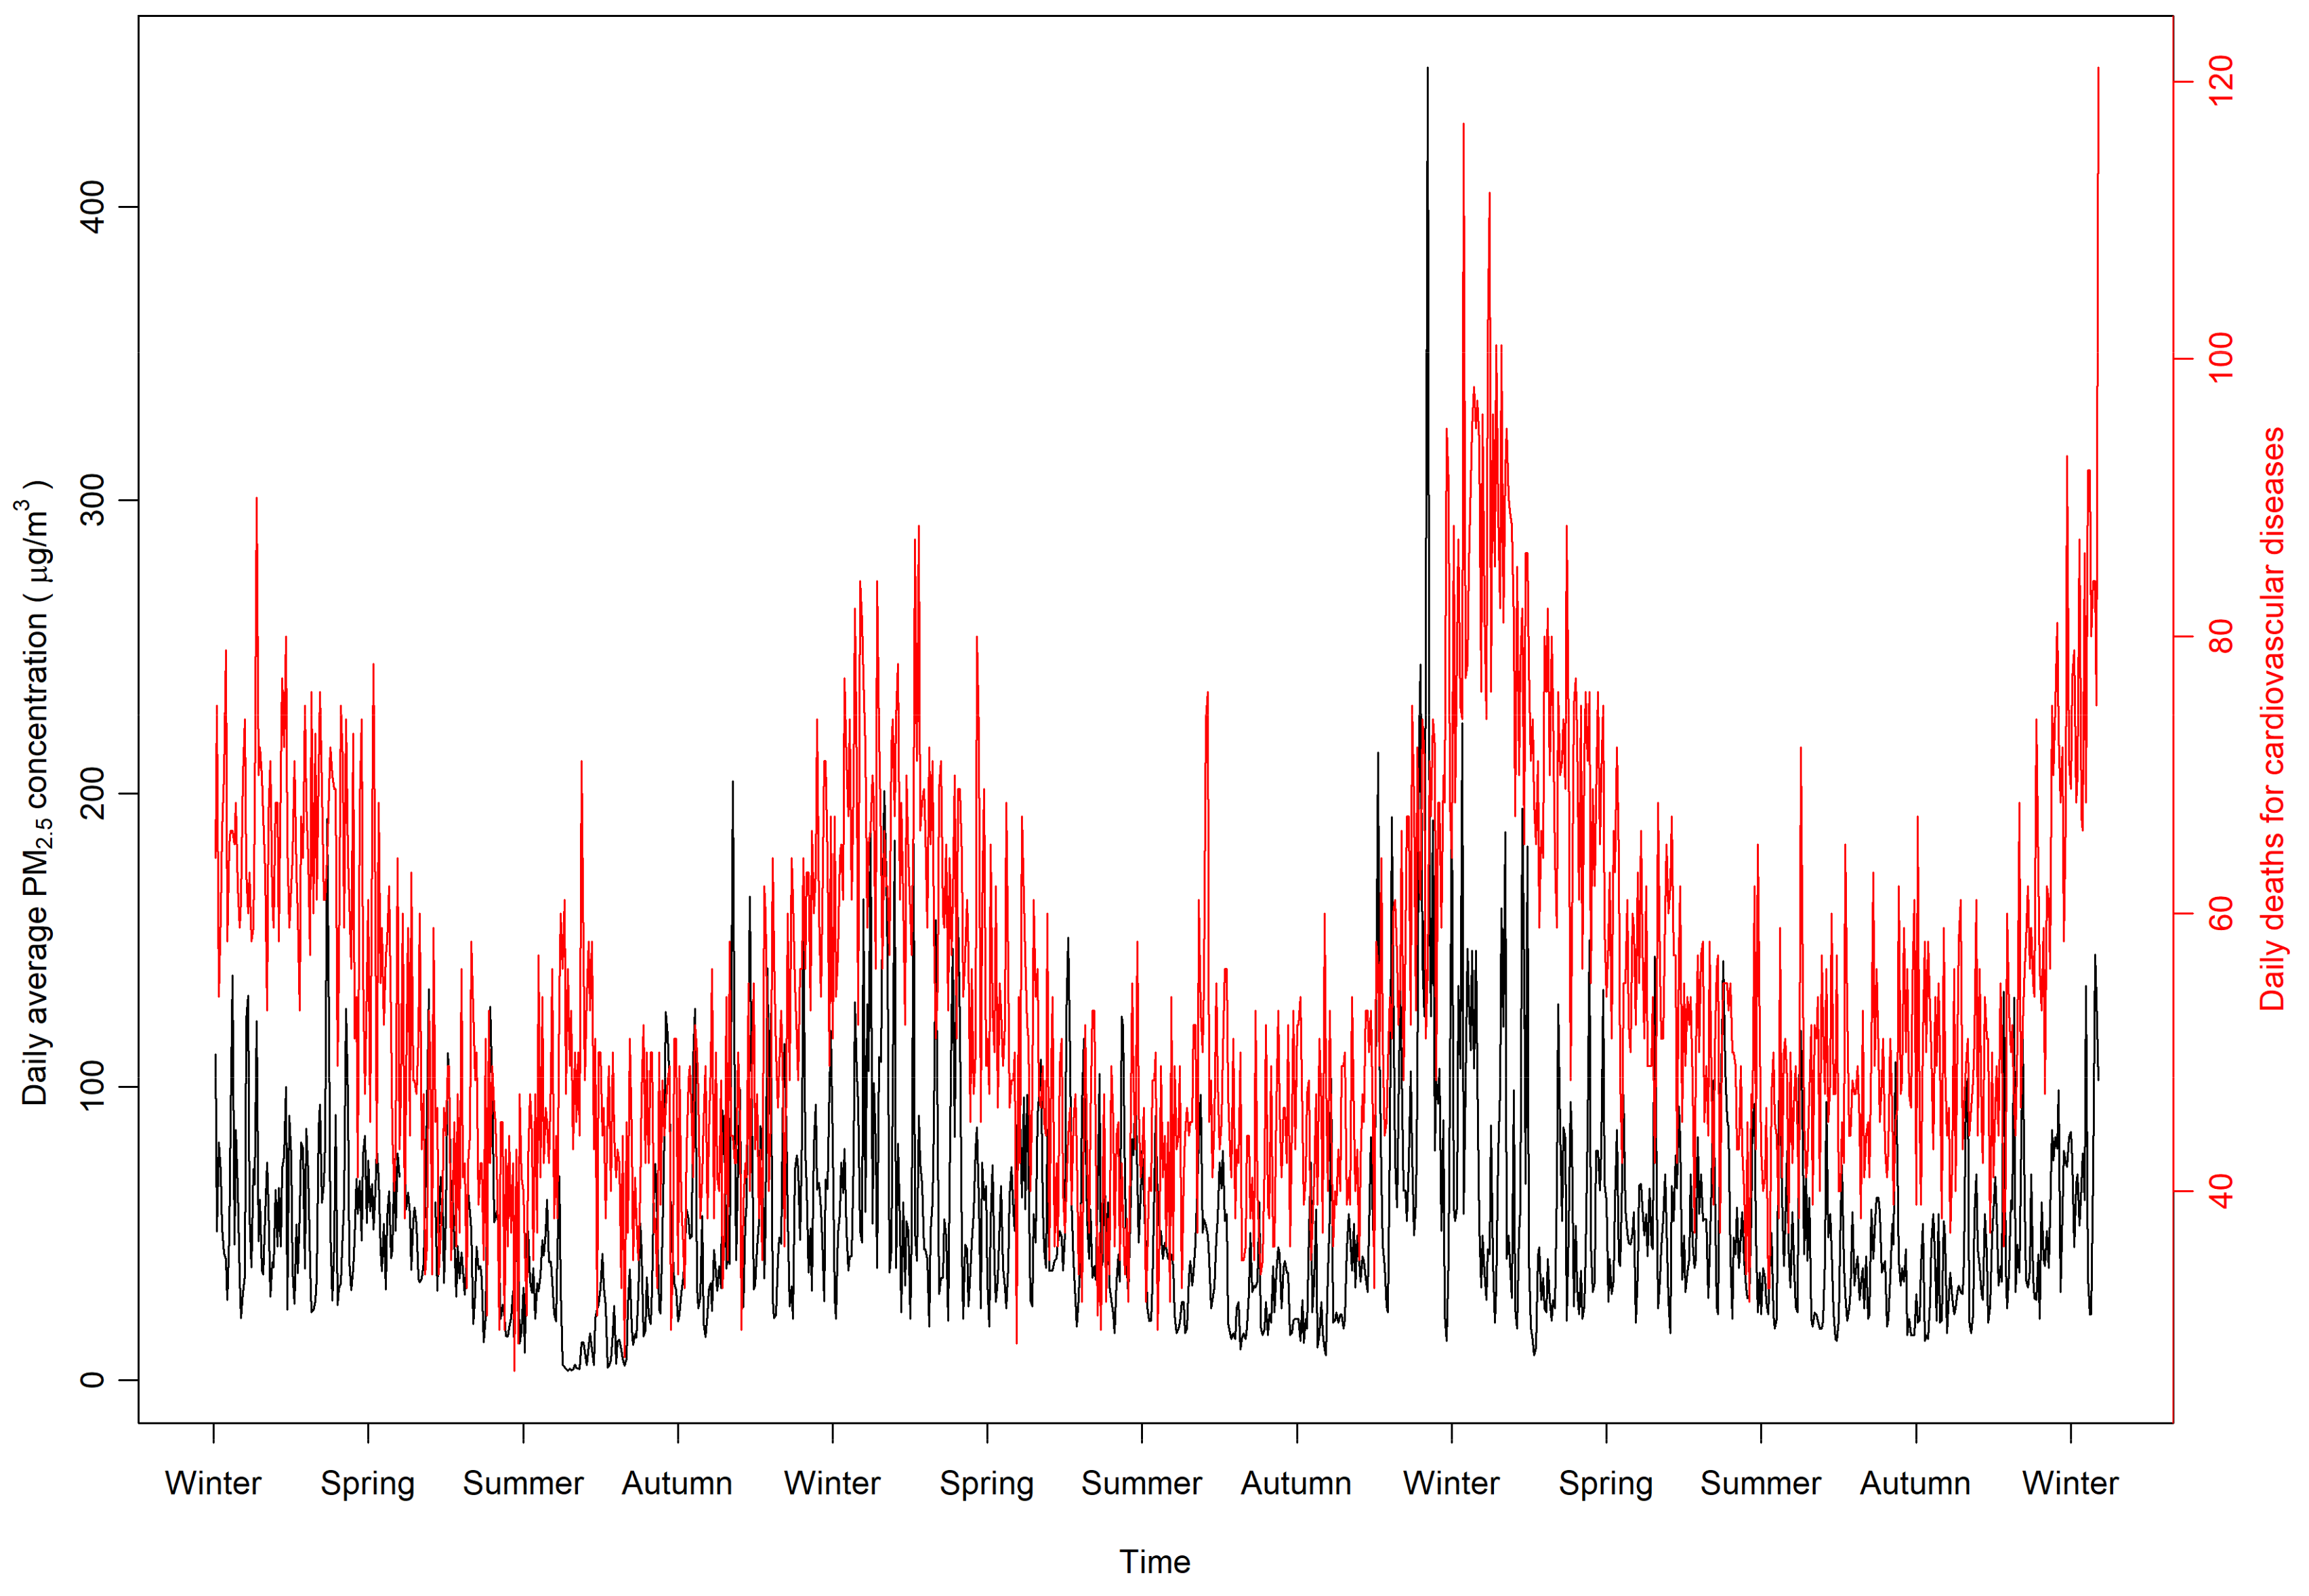
3.1. Characteristics of CVD Mortality, PM2.5 Concentration, and Meteorological Conditions

During the study period, a total of 59,486 CVD deaths occurred in Shanghai, with a mean of 54.3 daily deaths and a median of 51. Distribution of daily CVD deaths approximated to a quasi-Poisson distribution with a mean of 54.3 and an overdispersion index of 1.47. Overall, the annual average concentrations of PM2.5 in Shanghai was 55.0 µg/m3, with a median value of 45.5 µg/m3. In general, the daily average PM2.5 concentrations and the numbers of daily deaths show similar seasonal trends. For both measurements, the values presented high in cold seasons and low in the warm seasons (Figure 1). The predicted daily death counts by the GAM, including PM2.5, DOW, SWT, and the interactions between PM2.5 and SWT, indicate that 71.2% of the deviance can be explained by the model.
The meteorological features of the six SWTs were described in detail in our previous study and are also provided in the Supplementary Table S1 [26]. In general, the annual average temperature in Shanghai is 17.2 °C, and the precipitation is about 1190 mm a year. The humid SWT, including warm humid, cold humid, and moderate humid days, occurs nearly half (49.8%) of the days, while dry weather occurs for the other half. Average levels of PM2.5, SO2, and NO2 by SWT are provided in the Supplementary Table S2.

3.2. Effects of PM2.5, SWT, and Their Interactions on CVD Mortality

The effects of PM2.5 and SWT on CVD deaths are shown in Table 1. Both the models with (adjusted R2 = 0.704) and without (adjusted R2 = 0.705) the co-exposed pollutants SO2 and NO2 show similar statistically significant associations between PM2.5 and CVD deaths. However, no statistically significant association was found between SO2 (risk ratio (RR) = 1.0007, 95% CI: 0.9993, 1.0021) or NO2 (RR = 0.9998, 95% CI: 0.9990, 1.0005) and CVD deaths in our data (Table 1). Without adjusting for SO2 and NO2, each 10 μg/m3 increase in PM2.5 concentration was associated with 1.26% (95% CI: 0.40%, 2.12%) increase in daily CVD mortality (RR = 1.0126, 95 CI: 1.0040, 1.0212; Table 1).
None of the SWTs alone had a statistically significant association with CVD deaths. Nevertheless, humid weather tended to have a higher-magnitude association with CVD deaths. Compared to hot dry SWT, cool humid SWT had positive association with mortality (RR = 1.037, 95% CI: 0.967, 1.112), followed by cold humid SWT (RR = 1.014, 95% CI: 0.944, 1.089). In contrast, cold dry SWT had a negative association (RR = 0.989, 95% CI: 0.919, 1.065).
In terms of interaction between the air pollutant and SWT, the interaction between PM2.5 and cold SWT had the largest association compared with other interactions. Statistically significant interactions were found between PM2.5 and cold dry SWT (RR = 0.985, 95% CI: 0.976, 0.995) and cold humid SWT (RR = 0.986, 95% CI: 0.976, 0.995) (Table 1).

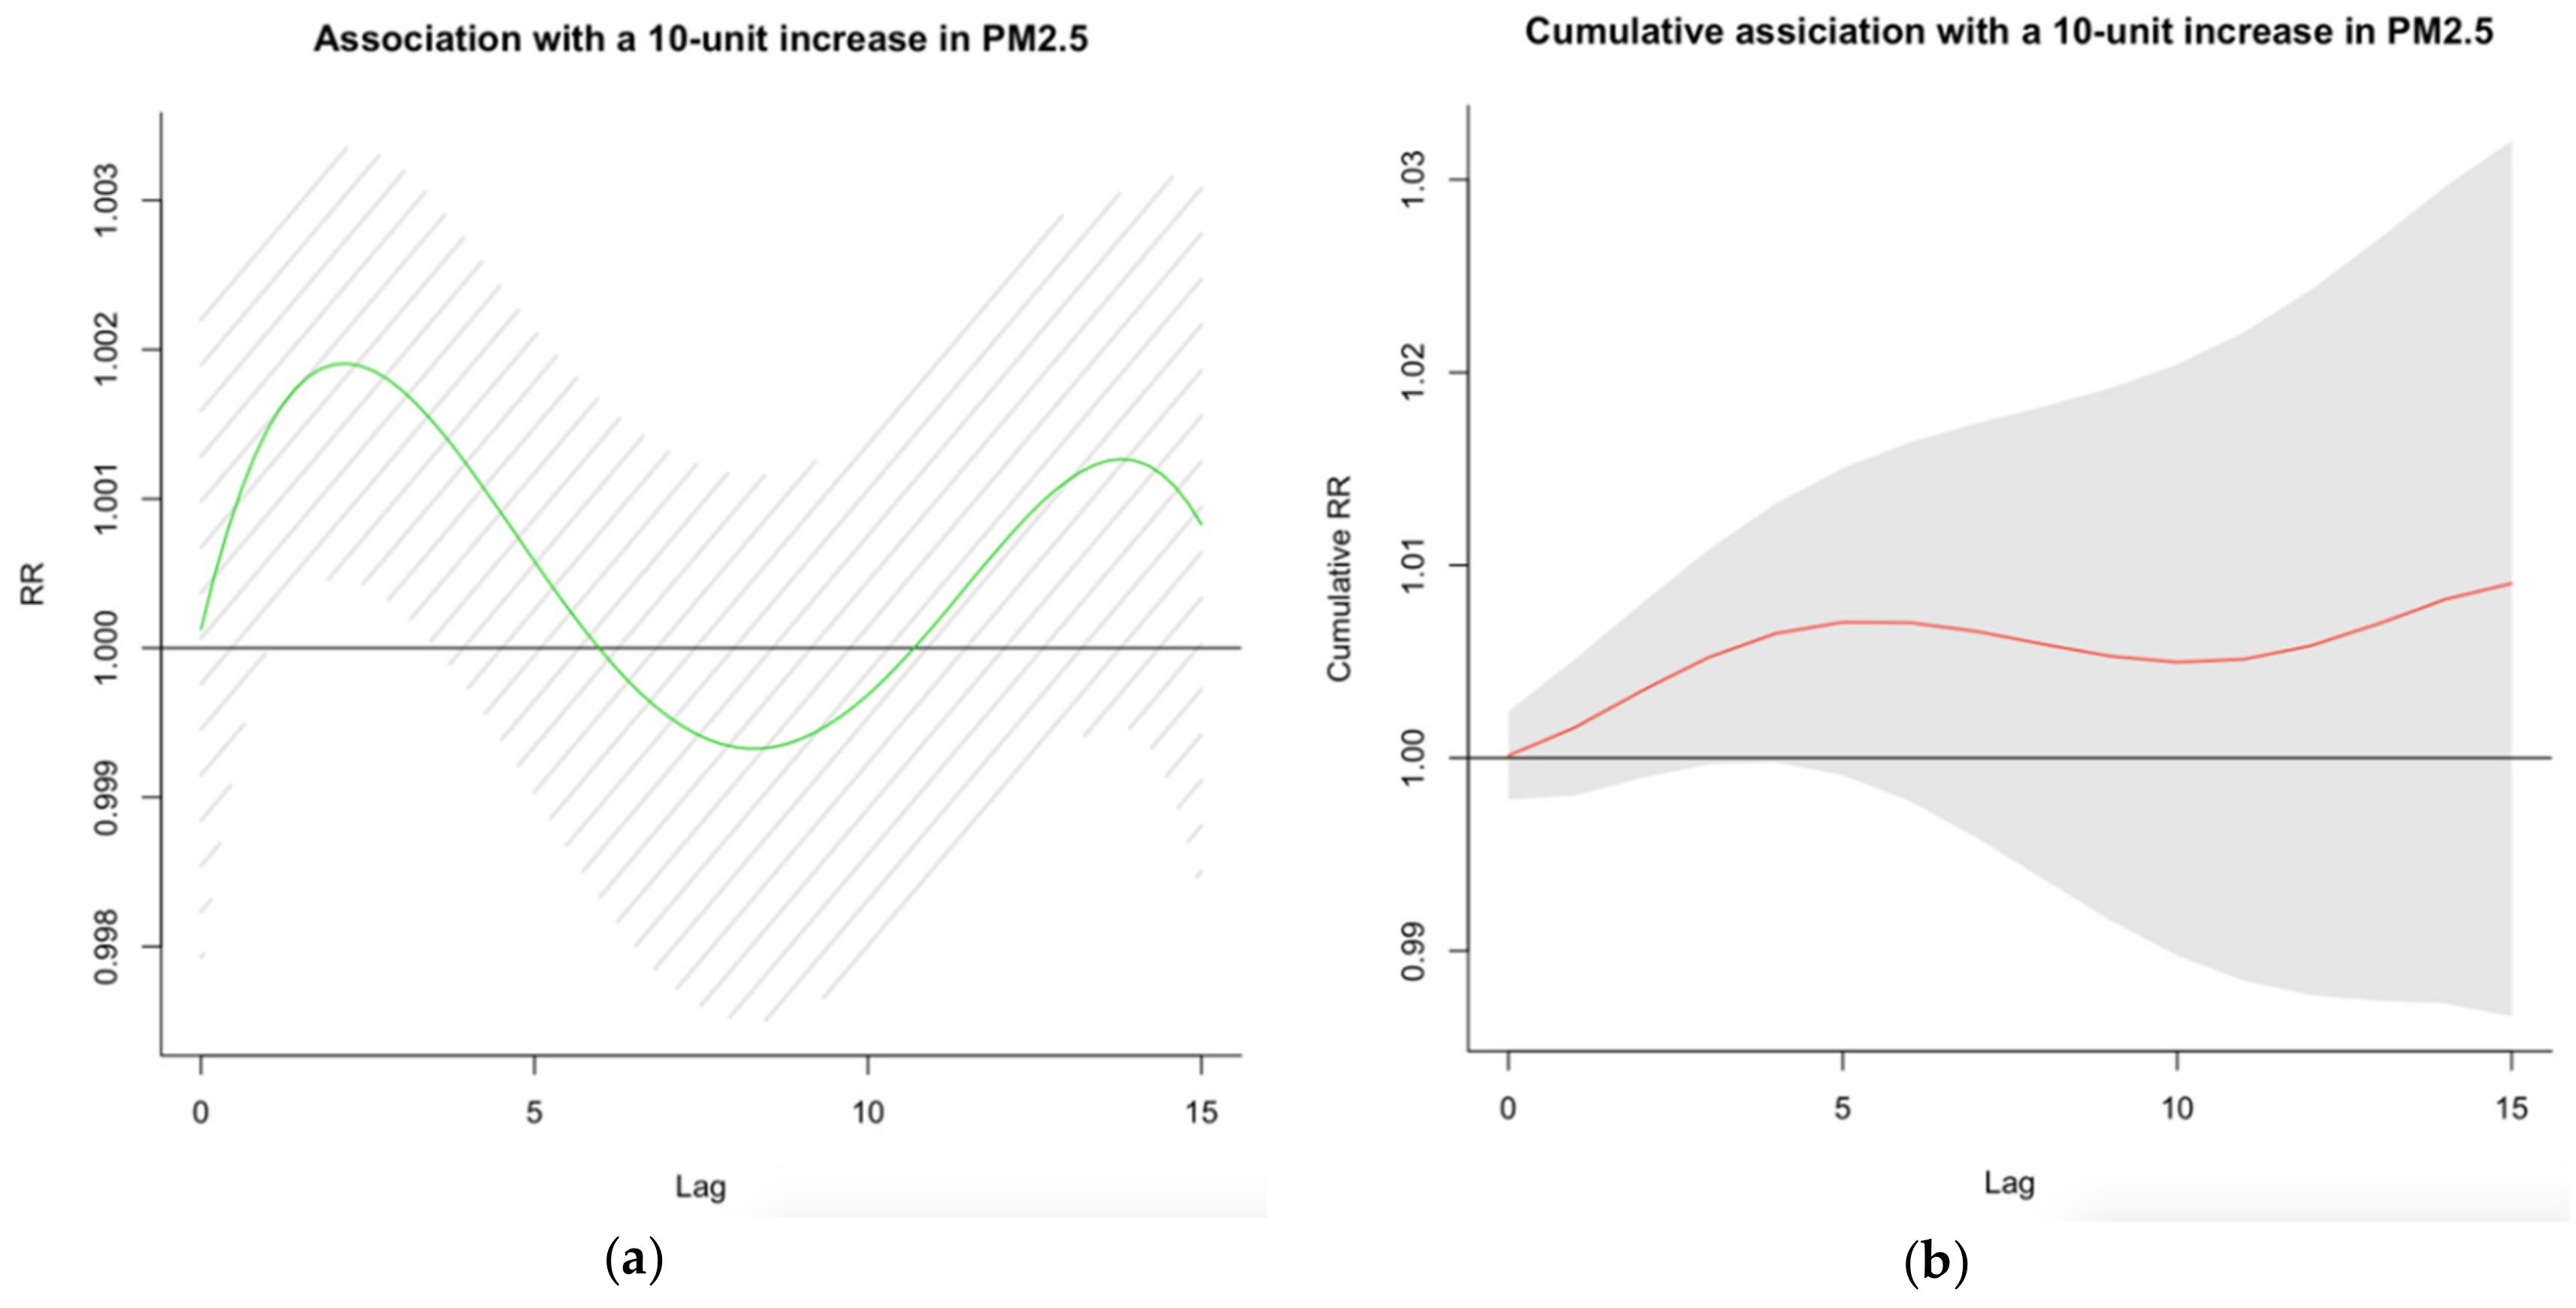
3.3. Lag Effect of PM2.5 on CVD Mortality

The lag effects of exposure to PM2.5 on CVD mortality based on the polynomial DLM analysis are shown in Figure 2a,b and Table 2. Figure 2a illustrates the single-day lag effects of PM2.5 on with CVD mortality associated with a 10 µg/m3 increase in PM2.5. Figure 2b illustrates the cumulative lag effects on CVD mortality associated with a 10 µg/m3 increase in PM2.5 concentration.
Generally, the associations of PM2.5 with CVD deaths presented a tri-phase pattern within the 15 days, as seen in Figure 2a. Statistically significant effects of PM2.5 in single lag day on CVD mortality were observed between lag day 1 and day 3, and the largest magnitude association on the second and the third lag days (RR = 1.0019, 95% CI: 1.0004–1.0033; RR = 1.0017, 95% CI: 1.0003–1.0032, respectively). A harvesting effect [35], i.e., the decrease in overall CVD mortality during the subsequent days, was found between lag days 6 and 11 (Figure 2a,b). However, the effect was not statistically significant.
For cumulative lag effects, although no statistically significant effects was found for all lag days, the largest effects were found for lag days 14 and 15 (RR = 1.0082, 95% CI: 0.9873, 1.0296; RR = 1.0091, 95% CI: 0.9866, 1.0320, respectively) followed by lags 5 and 6 (RR = 1.0070, 95% CI: 0.9991, 1.0150; RR = 1.0070, 95% CI: 0.9978, 1.0164, respectively) (Table 2).

3.4. Sensitivity Analysis

Multi-pollutants including PM2.5, SO2, and NO2 were included in both the GAM analyses (Table 1) and polynomial DLM analyses (data not shown) to compare with the single-pollutant model. The results remained almost unchanged.

4. Discussion

Our study focuses on the short-term associations of ambient air pollutant PM2.5, SWT, and their interaction with daily CVD mortality between 2012 and 2014 in Shanghai, China. The average daily concentration of PM2.5 in Shanghai was 55.0 μg/m3, which is much higher than the reference value in the World Health Organization guidelines (10 μg/m3 for the annual mean) [36]. In this study, we found that a 10 μg/m3 increase in PM2.5 was associated with an overall 1.26% (95% CI: 0.40%, 2.12%) increase in acute CVD mortality, which is of higher magnitude than the results from other studies (between 0.63% and 0.80%) [6,10,37,38]. A multicenter meta-analysis in East Asia including Shanghai suggested that each 10 μg/m3 increase in PM2.5 was related to a 0.96% (95% CI: 0.46%, 1.46%) increase in cardiovascular mortality [39], which is similar to our study. The lag analysis in our study also indicates that the associations of PM2.5 with CVDs mortality are mainly within the first six days (from lag 0 to lag 5).
We also tried to assess whether there is an association between the SWT and CVD deaths. However, no statistically significant association was found for any SWT in our data. The results are similar to those for Shenzhen, another populous city in China, i.e., no detectable association was found in extreme weather and cardiovascular events [40]. It is of note that we found interactions between cold SWT and PM2.5 which were inversely associated with the risk of CVD deaths, i.e., cold weather was found to potentially compensate the adverse effect of PM2.5 on cardiovascular health. Some other research is consistent with our results. Vanos et al. conducted an investigation in ten cities in Canada on the combined effect of weather and air pollution, and found that cool days were less harmful for cardiovascular-related mortality [41]. In European countries, the relationship between air pollutants and cardiovascular mortality has been found to be overall positive and of higher magnitude at high air temperatures [42]. In Asia, a study in Korea also found similar modification effects [43].
Although the relationship between cardiovascular mortality and weather condition has been widely investigated, few studies have categorized weather types and analyzed the interaction with air pollution. SWT comprises more than just humidity, temperature, and diurnal temperature; instead, it includes the already known and potentially unknown meteorological characteristics relevant to mortality. If we only include individual meteorological variables as covariates in the regression models, bias could be produced in the model because of the exclusion of other variables. The statistically non-significant associations between the SWT alone and CVD deaths in our study may be due to the insufficient data or short time period, and the categorization of SWT also deserves further investigation
According to our lag analysis, the lag association of PM2.5 with CVD mortality kept statistically significant for about 4 days, from lag day 0 to day 3, while cumulative lag effects were not statistically significantly related to increased CVD mortality. The results suggest that the effects of PM2.5 is acute in terms of CVD deaths. Other studies discovered similar findings. Results from a national study in the U.S. showed on lag day 0 and 1, PM2.5 had the largest effect on CVDs [44]. Another study in Beijing also discovered PM2.5′s lag effects within 0–3 lag days [45]. Higher levels of gaseous components, including NO2 and SO2, have long been associated with poorer cardiovascular health [46,47]. A systematic review of the studies in China indicated that a 10 μg/m3 increase in the concentrations of NO2 and SO2 was associated with a 1.12% (95% CI: 0.76%, 1.48%) and 0.75% (95% CI: 0.42%, 1.09%) increase in cardiovascular mortality, respectively [10]. No statistically significant associations of NO2 and SO2 observed in our study may be due to the different modeling strategy (no SWT and interaction were used in previous studies) or the relative shorter time period in our study, which should be investigated using long-term time-series data [48].
Based on our findings, air pollution, in the top five risk factors for health, has increased CVD mortality with modification from SWT, and might cause heavy burden on health and social development in view of the large population in Shanghai, China. Though the association is subtle, air pollution and extreme weather together have a great excessive impact when considering the entire population. Learning from the Chinese experience [49,50], governments are supposed to continue strengthening control on air pollution, in order to reduce mortality and related costs. For individuals, it is suggested that the population should reduce travel in hot weather, especially with high levels of air pollution, and they can employ physical or dietary interventions, which offer protection against short-term air pollution-induced adverse cardiovascular responses [51,52].
There are some strengths and limitations to our study. To some extent, the study provides new evidence about environmental conditions associated with health, for few other studies investigated the interaction between air pollutants and weather conditions. Therefore, this study might contribute to the pool of global knowledge regarding this topic. Second, SWTs rather than individual meteorological variables should be used to control for weather conditions, which examine the biological effect as the organism’s response to weather conditions as a whole, rather than to individual meteorological variables [53]. However, there are also limitation in our study. First, because of different socioeconomic condition and climates, the lessons and experiences learned from our study are hard to generalize to other cities and populations. Secondly, because of the ecological nature of this study, the study design restricted us in exploring the causal nature of relationships. However, since weather can influence the whole region, it is hard to measure those variables at individual level sufficiently in a large population. Thirdly, the lag analysis was only conducted for PM2.5, because the method only takes continuous variables while SWT is a categorical variable. Fourth, no interaction between lags time for PM2.5 and SWT was examined in the lag analysis, because when too many interaction terms (in total 75 interaction terms for 15 lag days and 6 SWTs even when no cross-basis matrix for the interactions was taken into account) were included, the model failed to estimate the parameters. Considering the acute antagonistic effect found between PM2.5 and cold SWT, and the largest cumulative effect found for lag day 15, the PM2.5′s lag effects and their interaction with SWT deserve further investigation using appropriate models.
We recognize that the pollution data from a single monitoring station could not accurately reflect the distribution of the PM2.5 concentrations in Shanghai. However, we interpreted the associations between CVD deaths and the risk factors using the relative risk (RR), i.e., mortality rate ratio. Theoretically, the coefficient of PM2.5 in the regression model (or its exponential format RR) only depends on the change in PM2.5 levels but not on the absolute PM2.5 levels, and the coefficient β0 (or baseline mortality rate) was not of the interest in our study. Therefore, the estimation of PM2.5′s effect is valid when the change in PM2.5 from the single station might reflect the change in PM2.5 of the whole of Shanghai city, i.e., when the single station’s PM2.5 level increased, Shanghai city’s PM2.5 level also increased and vice versa. We would also like to point out that Shanghai is the city with the highest life expectancy in China and one of the highest in the world, therefore, we must explain the results cautiously and cannot generalize them to other parts of China.

5. Conclusions

Exposure to PM2.5 was associated with increased short-term risk of CVD deaths with lag effects within four days in Shanghai, China, while cold weather was associated with lower risk. Since the ecological study design restricted us in identifying causal relationships, in-depth prospective studies with individual level data are warranted in the future.

Supplementary Materials

The following are available online at https://0-www-mdpi-com.brum.beds.ac.uk/1660-4601/17/3/1111/s1, Table S1: Meteorological characteristics of the six synoptic weather types (SWTs) in Shanghai, 2012–2014, Table S2: Daily average levels of the three pollutants by SWT in Shanghai, 2012–2014.

Author Contributions

Data curation, B.F. and T.X.; formal analysis, Q.T. and Y.C.; investigation, B.F., C.W., and T.X.; methodology, M.L., S.M., and Y.C.; project administration, Y.C.; resources, C.W. and Y.C.; software, Y.C.; supervision, S.M. and Y.C.; visualization, Q.T.; writing—original draft, Q.T. and M.L.; writing—review and editing, Q.T., M.L., S.M., B.F., C.W., T.X., and Y.C. All authors have read and agreed to the published version of the manuscript.

Funding

This work was supported by a grant from the National Natural Science Foundation of China, approval no.: 31971485 (C.W., T.X., and B.F.).

Acknowledgments

We thank the Shanghai Municipal Center for Disease Control and Prevention for their cooperation in data retrieval and cleaning.

Conflicts of Interest

The funding body was not involved in the design of the study, data collection and analysis, interpretation of results, or writing the manuscript. The authors declare no conflict of interest.

References

  1. Brunekreef, B.; Beelen, R.; Hoek, G.; Schouten, L.; Bausch-Goldbohm, S.; Fischer, P.; Armstrong, B.; Hughes, E.; Jerrett, M.; van den Brandt, P. Effects of long-term exposure to traffic-related air pollution on respiratory and cardiovascular mortality in the Netherlands: The NLCS-AIR study. Res. Rep. Health Eff. Inst. 2009, 139, 5–71. [Google Scholar]
  2. Meo, S.A.; Suraya, F. Effect of environmental air pollution on cardiovascular diseases. Eur. Rev. Med. Pharmacol. Sci. 2015, 19, 4890–4897. [Google Scholar] [PubMed]
  3. Shang, Y.; Sun, Z.; Cao, J.; Wang, X.; Zhong, L.; Bi, X.; Li, H.; Liu, W.; Zhu, T.; Huang, W. Systematic review of Chinese studies of short-term exposure to air pollution and daily mortality. Environ. Int. 2013, 54, 100–111. [Google Scholar] [CrossRef] [PubMed]
  4. Pinault, L.L.; Weichenthal, S.; Grouse, D.L.; Brauer, M.; Erickson, A.; van Donkelaar, A.; Martin, R.V.; Hystad, P.; Chen, H.; Fines, P.; et al. Associations between fine particulate matter and mortality in the 2001 Canadian Census Health and Environment Cohort. Environ. Res. 2017, 159, 406–415. [Google Scholar] [CrossRef]
  5. Huang, C.; Moran, A.E.; Coxson, P.G.; Yang, X.; Liu, F.; Cao, J.; Chen, K.; Wang, M.; He, J.; Goldman, L.; et al. Potential Cardiovascular and Total Mortality Benefits of Air Pollution Control in Urban China. Circulation 2017, 136, 1575–1584. [Google Scholar] [CrossRef]
  6. Liu, C.; Chen, R.; Sera, F.; Vicedo-Cabrera, A.M.; Guo, Y.; Tong, S.; Coelho, M.; Saldiva, P.H.N.; Lavigne, E.; Matus, P.; et al. Ambient Particulate Air Pollution and Daily Mortality in 652 Cities. N. Engl. J. Med. 2019, 381, 705–715. [Google Scholar] [CrossRef]
  7. Bourdrel, T.; Bind, M.A.; Bejot, Y.; Morel, O.; Argacha, J.F. Cardiovascular effects of air pollution. Arch. Cardiovasc. Dis. 2017, 110, 634–642. [Google Scholar] [CrossRef]
  8. Argacha, J.F.; Bourdrel, T.; van de Borne, P. Ecology of the cardiovascular system: A focus on air-related environmental factors. Trends Cardiovasc. Med. 2018, 28, 112–126. [Google Scholar] [CrossRef]
  9. Kim, H.; Kim, J.; Kim, S.; Kang, S.H.; Kim, H.J.; Kim, H.; Heo, J.; Yi, S.M.; Kim, K.; Youn, T.J.; et al. Cardiovascular Effects of Long-Term Exposure to Air Pollution: A Population-Based Study with 900,845 Person-Years of Follow-up. J. Am. Heart Assoc. 2017, 6. [Google Scholar] [CrossRef] [Green Version]
  10. Zhao, L.; Liang, H.R.; Chen, F.Y.; Chen, Z.; Guan, W.J.; Li, J.H. Association between air pollution and cardiovascular mortality in China: A systematic review and meta-analysis. Oncotarget 2017, 8, 66438–66448. [Google Scholar] [CrossRef] [Green Version]
  11. Vidale, S.; Arnaboldi, M.; Bosio, V.; Corrado, G.; Guidotti, M.; Sterzi, R.; Campana, C. Short-term air pollution exposure and cardiovascular events: A 10-year study in the urban area of Como, Italy. Int. J. Cardiol. 2017, 248, 389–393. [Google Scholar] [CrossRef] [PubMed]
  12. Zhang, Y.; Yu, C.; Bao, J.; Li, X. Impact of temperature on mortality in Hubei, China: A multi-county time series analysis. Sci. Rep. 2017, 7, 45093. [Google Scholar] [CrossRef] [PubMed] [Green Version]
  13. Zhang, Y.; Yu, C.; Yang, J.; Zhang, L.; Cui, F. Diurnal Temperature Range in Relation to Daily Mortality and Years of Life Lost in Wuhan, China. Int. J. Environ. Res. Public Health 2017, 14, 891. [Google Scholar] [CrossRef]
  14. Zhang, Y.; Peng, M.; Wang, L.; Yu, C. Association of diurnal temperature range with daily mortality in England and Wales: A nationwide time-series study. Sci. Total Environ. 2018, 619, 291–300. [Google Scholar] [CrossRef]
  15. Zhang, Y.; Yu, C.; Bao, J.; Li, X. Impact of temperature variation on mortality: An observational study from 12 counties across Hubei Province in China. Sci. Total Environ. 2017, 587, 196–203. [Google Scholar] [CrossRef] [PubMed]
  16. Zeng, J.; Zhang, X.H.; Yang, J.; Bao, J.Z.; Xiang, H.; Dear, K.; Liu, Q.Y.; Lin, S.; Lawrence, W.R.; Lin, A.H.; et al. Humidity May Modify the Relationship between Temperature and Cardiovascular Mortality in Zhejiang Province, China. Int. J. Environ. Res. Public Health 2017, 14, 1383. [Google Scholar] [CrossRef] [Green Version]
  17. Liu, C.; Yavar, Z.; Sun, Q. Cardiovascular response to thermoregulatory challenges. Am. J. Physiol. Heart Circ. Physiol. 2015, 309, H1793–H1812. [Google Scholar] [CrossRef] [Green Version]
  18. Song, X.; Wang, S.; Hu, Y.; Yue, M.; Zhang, T.; Liu, Y.; Tian, J.; Shang, K. Impact of ambient temperature on morbidity and mortality: An overview of reviews. Sci. Total Environ. 2017, 586, 241–254. [Google Scholar] [CrossRef]
  19. Mendez-Lazaro, P.A.; Perez-Cardona, C.M.; Rodriguez, E.; Martinez, O.; Taboas, M.; Bocanegra, A.; Mendez-Tejeda, R. Climate change, heat, and mortality in the tropical urban area of San Juan, Puerto Rico. Int. J. Biometeorol. 2018, 62, 699–707. [Google Scholar] [CrossRef]
  20. Tian, L.; Qiu, H.; Sun, S.; Lin, H. Emergency Cardiovascular Hospitalization Risk Attributable to Cold Temperatures in Hong Kong. Circ. Cardiovasc. Qual. Outcomes 2016, 9, 135–142. [Google Scholar] [CrossRef] [PubMed]
  21. Giang, P.N.; Dung, D.O.; Giang, K.B.; Vinh, H.H.; Rocklov, J. The effect of temperature on cardiovascular disease hospital admissions among elderly people in Thai Nguyen Province, Vietnam. Glob. Health Action 2014, 7, 59–65. [Google Scholar] [CrossRef] [PubMed] [Green Version]
  22. Ponjoan, A.; Blanch, J.; Alves-Cabratosa, L.; Marti-Lluch, R.; Comas-Cufi, M.; Parramon, D.; Del Mar Garcia-Gil, M.; Ramos, R.; Petersen, I. Effects of extreme temperatures on cardiovascular emergency hospitalizations in a Mediterranean region: A self-controlled case series study. Environ. Health 2017, 16, 32. [Google Scholar] [CrossRef] [PubMed] [Green Version]
  23. Plavcova, E.; Kysely, J. Effects of sudden air pressure changes on hospital admissions for cardiovascular diseases in Prague, 1994–2009. Int. J. Biometeorol. 2014, 58, 1327–1337. [Google Scholar] [CrossRef] [PubMed]
  24. Tsangari, H.; Paschalidou, A.K.; Kassomenos, A.P.; Vardoulakis, S.; Heaviside, C.; Georgiou, K.E.; Yamasaki, E.N. Extreme weather and air pollution effects on cardiovascular and respiratory hospital admissions in Cyprus. Sci. Total Environ. 2016, 542, 247–253. [Google Scholar] [CrossRef]
  25. Onozuka, D.; Hagihara, A. Within-summer variation in out-of-hospital cardiac arrest due to extremely long sunshine duration. Int. J. Cardiol. 2017, 231, 120–124. [Google Scholar] [CrossRef]
  26. Fang, X.; Fang, B.; Wang, C.F.; Xia, T.; Bottai, M.; Fang, F.; Cao, Y. Relationship between fine particulate matter, weather condition and daily non-accidental mortality in Shanghai, China: A Bayesian approach. PLoS ONE 2017, 12, e0187933. [Google Scholar] [CrossRef] [Green Version]
  27. Shanghai Bureau of Statistics. Shanghai Statistical Yearbook; China Statistics Press: Beijing, China, 2017.
  28. Liu, J.; Han, Y.; Tang, X.; Zhu, J.; Zhu, T. Estimating adult mortality attributable to PM2.5 exposure in China with assimilated PM2.5 concentrations based on a ground monitoring network. Sci. Total Environ. 2016, 568, 1253–1262. [Google Scholar] [CrossRef]
  29. Vanos, J.K.; Cakmak, S.; Bristow, C.; Brion, V.; Tremblay, N.; Martin, S.L.; Sheridan, S.S. Synoptic weather typing applied to air pollution mortality among the elderly in 10 Canadian cities. Environ. Res. 2013, 126, 66–75. [Google Scholar] [CrossRef] [Green Version]
  30. Ravindra, K.; Rattan, P.; Mor, S.; Aggarwal, A.N. Generalized additive models: Building evidence of air pollution, climate change and human health. Environ. Int. 2019, 132, 104987. [Google Scholar] [CrossRef]
  31. Thelen, B.; French, N.H.F.; Koziol, B.W.; Billmire, M.; Owen, R.C.; Johnson, J.; Ginsberg, M.; Loboda, T.; Wu, S.L. Modeling acute respiratory illness during the 2007 San Diego wildland fires using a coupled emissions-transport system and generalized additive modeling. Environ. Health 2013, 12, 94. [Google Scholar] [CrossRef] [Green Version]
  32. Dehghan, A.; Khanjani, N.; Bahrampour, A.; Goudarzi, G.; Yunesian, M. The relation between air pollution and respiratory deaths in Tehran, Iran- using generalized additive models. BMC Pulm. Med. 2018, 18, 49. [Google Scholar] [CrossRef] [PubMed]
  33. Dominici, F.; McDermott, A.; Zeger, S.L.; Samet, J.M. On the use of generalized additive models in time-series studies of air pollution and health. Am. J. Epidemiol. 2002, 156, 193–203. [Google Scholar] [CrossRef] [PubMed]
  34. Gasparrini, A.; Armstrong, B.; Kenward, M.G. Distributed lag non-linear models. Stat. Med. 2010, 29, 2224–2234. [Google Scholar] [CrossRef] [PubMed] [Green Version]
  35. Schwartz, J. Harvesting and long term exposure effects in the relation between air pollution and mortality. Am. J. Epidemiol. 2000, 151, 440–448. [Google Scholar] [CrossRef]
  36. World Health Organization. WHO Air Quality Guidelines for Particulate Matter, Ozone, Nitrogen Dioxide and Sulfur Dioxide: Global Update 2005: Summary of Risk Assessment; World Health Organization: Geneva, Switzerland, 2006. [Google Scholar]
  37. Lu, F.; Xu, D.; Cheng, Y.; Dong, S.; Guo, C.; Jiang, X.; Zheng, X. Systematic review and meta-analysis of the adverse health effects of ambient PM2.5 and PM10 pollution in the Chinese population. Environ. Res. 2015, 136, 196–204. [Google Scholar] [CrossRef]
  38. Achilleos, S.; Kioumourtzoglou, M.A.; Wu, C.D.; Schwartz, J.D.; Koutrakis, P.; Papatheodorou, S.I. Acute effects of fine particulate matter constituents on mortality: A systematic review and meta-regression analysis. Environ. Int. 2017, 109, 89–100. [Google Scholar] [CrossRef]
  39. Lee, H.; Honda, Y.; Hashizume, M.; Guo, Y.L.; Wu, C.F.; Kan, H.; Jung, K.; Lim, Y.H.; Yi, S.; Kim, H. Short-term exposure to fine and coarse particles and mortality: A multicity time-series study in East Asia. Environ. Pollut. 2015, 207, 43–51. [Google Scholar] [CrossRef]
  40. Guo, Y.S.; Ma, Y.; Ji, J.J.; Liu, N.; Zhou, G.H.; Fang, D.K.; Huang, G.W.; Lan, T.; Peng, C.Q.; Yu, S.Y. The relationship between extreme temperature and emergency incidences: A time series analysis in Shenzhen, China. Environ. Sci. Pollut. Res. 2018, 25, 36239–36255. [Google Scholar] [CrossRef]
  41. Vanos, J.K.; Hebbern, C.; Cakmak, S. Risk assessment for cardiovascular and respiratory mortality due to air pollution and synoptic meteorology in 10 Canadian cities. Environ. Pollut. 2014, 185, 322–332. [Google Scholar] [CrossRef] [Green Version]
  42. Chen, K.; Wolf, K.; Breitner, S.; Gasparrini, A.; Stafoggia, M.; Samoli, E.; Andersen, Z.J.; Bero-Bedada, G.; Bellander, T.; Hennig, F.; et al. Two-way effect modifications of air pollution and air temperature on total natural and cardiovascular mortality in eight European urban areas. Environ. Int. 2018, 116, 186–196. [Google Scholar] [CrossRef]
  43. Kim, J. Particulate Matter Mortality Rates and Their Modification by Spatial Synoptic Classification. Int. J. Environ. Res. Public Health 2019, 16, 1904. [Google Scholar] [CrossRef] [PubMed] [Green Version]
  44. Talbott, E.O.; Rager, J.R.; Benson, S.; Brink, L.A.; Bilonick, R.A.; Wu, C. A case-crossover analysis of the impact of PM2.5 on cardiovascular disease hospitalizations for selected CDC tracking states. Environ. Res. 2014, 134, 455–465. [Google Scholar] [CrossRef] [PubMed]
  45. Amsalu, E.; Wang, T.Q.; Li, H.B.; Liu, Y.; Wang, A.X.; Liu, X.T.; Tao, L.X.; Luo, Y.X.; Zhang, F.; Yang, X.H.; et al. Acute effects of fine particulate matter (PM2.5) on hospital admissions for cardiovascular disease in Beijing, China: A time-series study. Environ. Health 2019, 18, 70. [Google Scholar] [CrossRef] [PubMed] [Green Version]
  46. Seaton, A.; MacNee, W.; Donaldson, K.; Godden, D. Particulate air pollution and acute health effects. Lancet 1995, 345, 176–178. [Google Scholar] [CrossRef]
  47. Franchini, M.; Mannucci, P.M. Air pollution and cardiovascular disease. Thromb. Res. 2012, 129, 230–234. [Google Scholar] [CrossRef] [PubMed]
  48. Kan, H.D.; Wong, C.M.; Vichit-Vadakan, N.; Qian, Z.M.; Teams, P.P. Short-term association between sulfur dioxide and daily mortality: The Public Health and Air Pollution in Asia (PAPA) study. Environ. Res. 2010, 110, 258–264. [Google Scholar] [CrossRef] [Green Version]
  49. Lin, H.L.; Zhang, Y.H.; Liu, T.; Xiao, J.P.; Xu, Y.J.; Xu, X.J.; Qian, Z.M.; Tong, S.L.; Luo, Y.; Zeng, W.L.; et al. Mortality reduction following the air pollution control measures during the 2010 Asian Games. Atmos. Environ. 2014, 91, 24–31. [Google Scholar] [CrossRef]
  50. Sun, D.; Fang, J.; Sun, J.Q. Health-related benefits of air quality improvement from coal control in China: Evidence from the Jing-Jin-Ji region. Resour. Conserv. Recycl. 2018, 129, 416–423. [Google Scholar] [CrossRef]
  51. Cherrie, J.W.; Apsley, A.; Cowie, H.; Steinle, S.; Mueller, W.; Lin, C.; Horwell, C.J.; Sleeuwenhoek, A.; Loh, M. Effectiveness of face masks used to protect Beijing residents against particulate air pollution. Occup. Environ. Med. 2018, 75, 446–452. [Google Scholar] [CrossRef]
  52. Tong, H. Dietary and pharmacological intervention to mitigate the cardiopulmonary effects of air pollution toxicity. Biochim. Biophys. Acta 2016, 1860, 2891–2898. [Google Scholar] [CrossRef]
  53. Rainham, D.G.; Smoyer-Tomic, K.E.; Sheridan, S.C.; Burnett, R.T. Synoptic weather patterns and modification of the association between air pollution and human mortality. Int. J. Environ. Health Res. 2005, 15, 347–360. [Google Scholar] [CrossRef] [PubMed]
Figure 1. Time trends of daily ambient fine particulate matter (PM2.5) concentrations and cardiovascular disease (CVD) deaths.
Ijerph 17 01111 g001
Figure 2. (a) Fifteen-day lag patterns and (b) cumulative lag patterns of risk for PM2.5-associated CVD mortality. The x-axes are lag days, ranging from lag day 0 to lag day 15; the y-axes are risk ratio (RR) or cumulative RR with 95% confidence interval for daily CVD mortality per 10 µg/m3 increase in PM2.5 concentration.
Ijerph 17 01111 g002
Table 1. Associations of PM2.5, synoptic weather types (SWTs), and their interactions with daily cardiovascular mortality.
VariableRisk Ratio (RR) for Cardiovascular Mortality
Model without SO2, NO2Model with SO2, NO2
RR (95% CI)P-ValueRR (95% CI)P-Value
PM2.5 (per 10 μ g/m3)1.0126 (1.0040, 1.0212)0.0041.0121 (1.0027, 1.0215)0.011
SO2 1.0007 (0.9993, 1.0021)0.310
NO2 0.9998 (0.9990, 1.0005)0.544
Synoptic weather types
Hot dry (Ref)
Warm humid0.9945 (0.9359, 1.0567)0.8580.9971 (0.9378, 1.0603)0.927
Cold dry0.9894 (0.9191, 1.0651)0.7780.9861 (0.9149, 1.0628)0.714
Cool dry0.9954 (0.9308, 1.0645)0.8930.9978 (0.9327, 1.0674)0.948
Cool humid1.0369 (0.9666, 1.1123)0.3111.0378 (0.9675, 1.1133)0.300
Cold humid1.0138 (0.9438, 1.0891)0.7071.0157 (0.9451, 1.0914)0.672
Day of week
Sunday (Ref)
Monday1.0269 (0.9963, 1.0585)0.0851.0269 (0.9963, 1.0585)0.086
Tuesday1.0178 (0.9874, 1.0491)0.2541.0182 (0.9876, 1.0497)0.246
Wednesday1.0350 (1.0043, 1.0667)0.0251.0352 (1.0041, 1.0672)0.026
Thursday1.0139 (0.9835, 1.0453)0.3731.0143 (0.9837, 1.0458)0.363
Friday1.0058 (0.9756, 1.0369)0.7121.0065 (0.9761, 1.0378)0.681
Saturday1.0315 (1.0008, 1.0632)0.0441.0320 (1.0012, 1.0637)0.042
Interaction
PM2.5 × Hot dry (Ref)
PM2.5 × Warm humid0.9924 (0.9822, 1.0027)0.1490.9926 (0.9822, 1.0030)0.162
PM2.5 × Cold dry0.9853 (0.9761, 0.9946)0.0020.9852 (0.9758, 0.9946)0.002
PM2.5 × Cool dry0.9905 (0.9802, 1.0009)0.0740.9904 (0.9800, 1.0009)0.072
PM2.5 × Cool humid0.9889 (0.9762, 1.0019)0.0930.9893 (0.9764, 1.0022)0.104
PM2.5 × Cold humid0.9855 (0.9764, 0.9948)0.0020.9853 (0.9760, 0.9946)0.002
Ref, reference group; CI, confidence interval, Bold items, variables with statistical significance (P-value < 0.05).
Table 2. Risk ratio (95% confidence interval) of lag effects for single days and cumulative lag effects per 10 µg/m3 increase in PM2.5 concentration.
Lag DaySingle Day EffectCumulative Effect
Lag 01.0001 (0.9978, 1.0024)1.0001 (0.9978, 1.0024)
Lag 11.0005 (1.0000, 1.0029)1.0016 (0.9980, 1.0051)
Lag 21.0019 (1.0004, 1.0033)1.0035 (0.9990, 1.0080)
Lag 31.0017 (1.0003, 1.0032)1.0052 (0.9997, 1.0108)
Lag 41.0012 (0.9997, 1.0027)1.0065 (0.9998, 1.0132)
Lag 51.0006 (0.9990, 1.0021)1.0070 (0.9991, 1.0150)
Lag 61.0000 (0.9983, 1.0016)1.0070 (0.9978, 1.0164)
Lag 70.9995 (0.9978, 1.0013)1.0066 (0.9959, 1.0174)
Lag 80.9993 (0.9975, 1.0012)1.0059 (0.9937, 1.0182)
Lag 90.9994 (0.9978, 1.0012)1.0053 (0.9916, 1.0192)
Lag 100.9997 (0.9979, 1.0015)1.0050 (0.9898, 1.0204)
Lag 111.0002 (0.9983, 1.0020)1.0051 (0.9884, 1.0221)
Lag 121.0007 (0.9989, 1.0025)1.0058 (0.9877, 1.0243)
Lag 131.0011 (0.9993, 1.0029)1.0070 (0.9874, 1.0268)
Lag 141.0013 (0.9995, 1.0031)1.0082 (0.9873, 1.0296)
Lag 151.0008 (0.9983, 1.0033)1.0091 (0.9866, 1.0320)
Bold items, variables with statistical significance (P-value <0.05).

