Prenatal Ambient Particulate Matter Exposure and Longitudinal Weight Growth Trajectories in Early Childhood


 ,
,
Abstract
:1. Introduction
2. Materials and Methods
2.1. Study Population
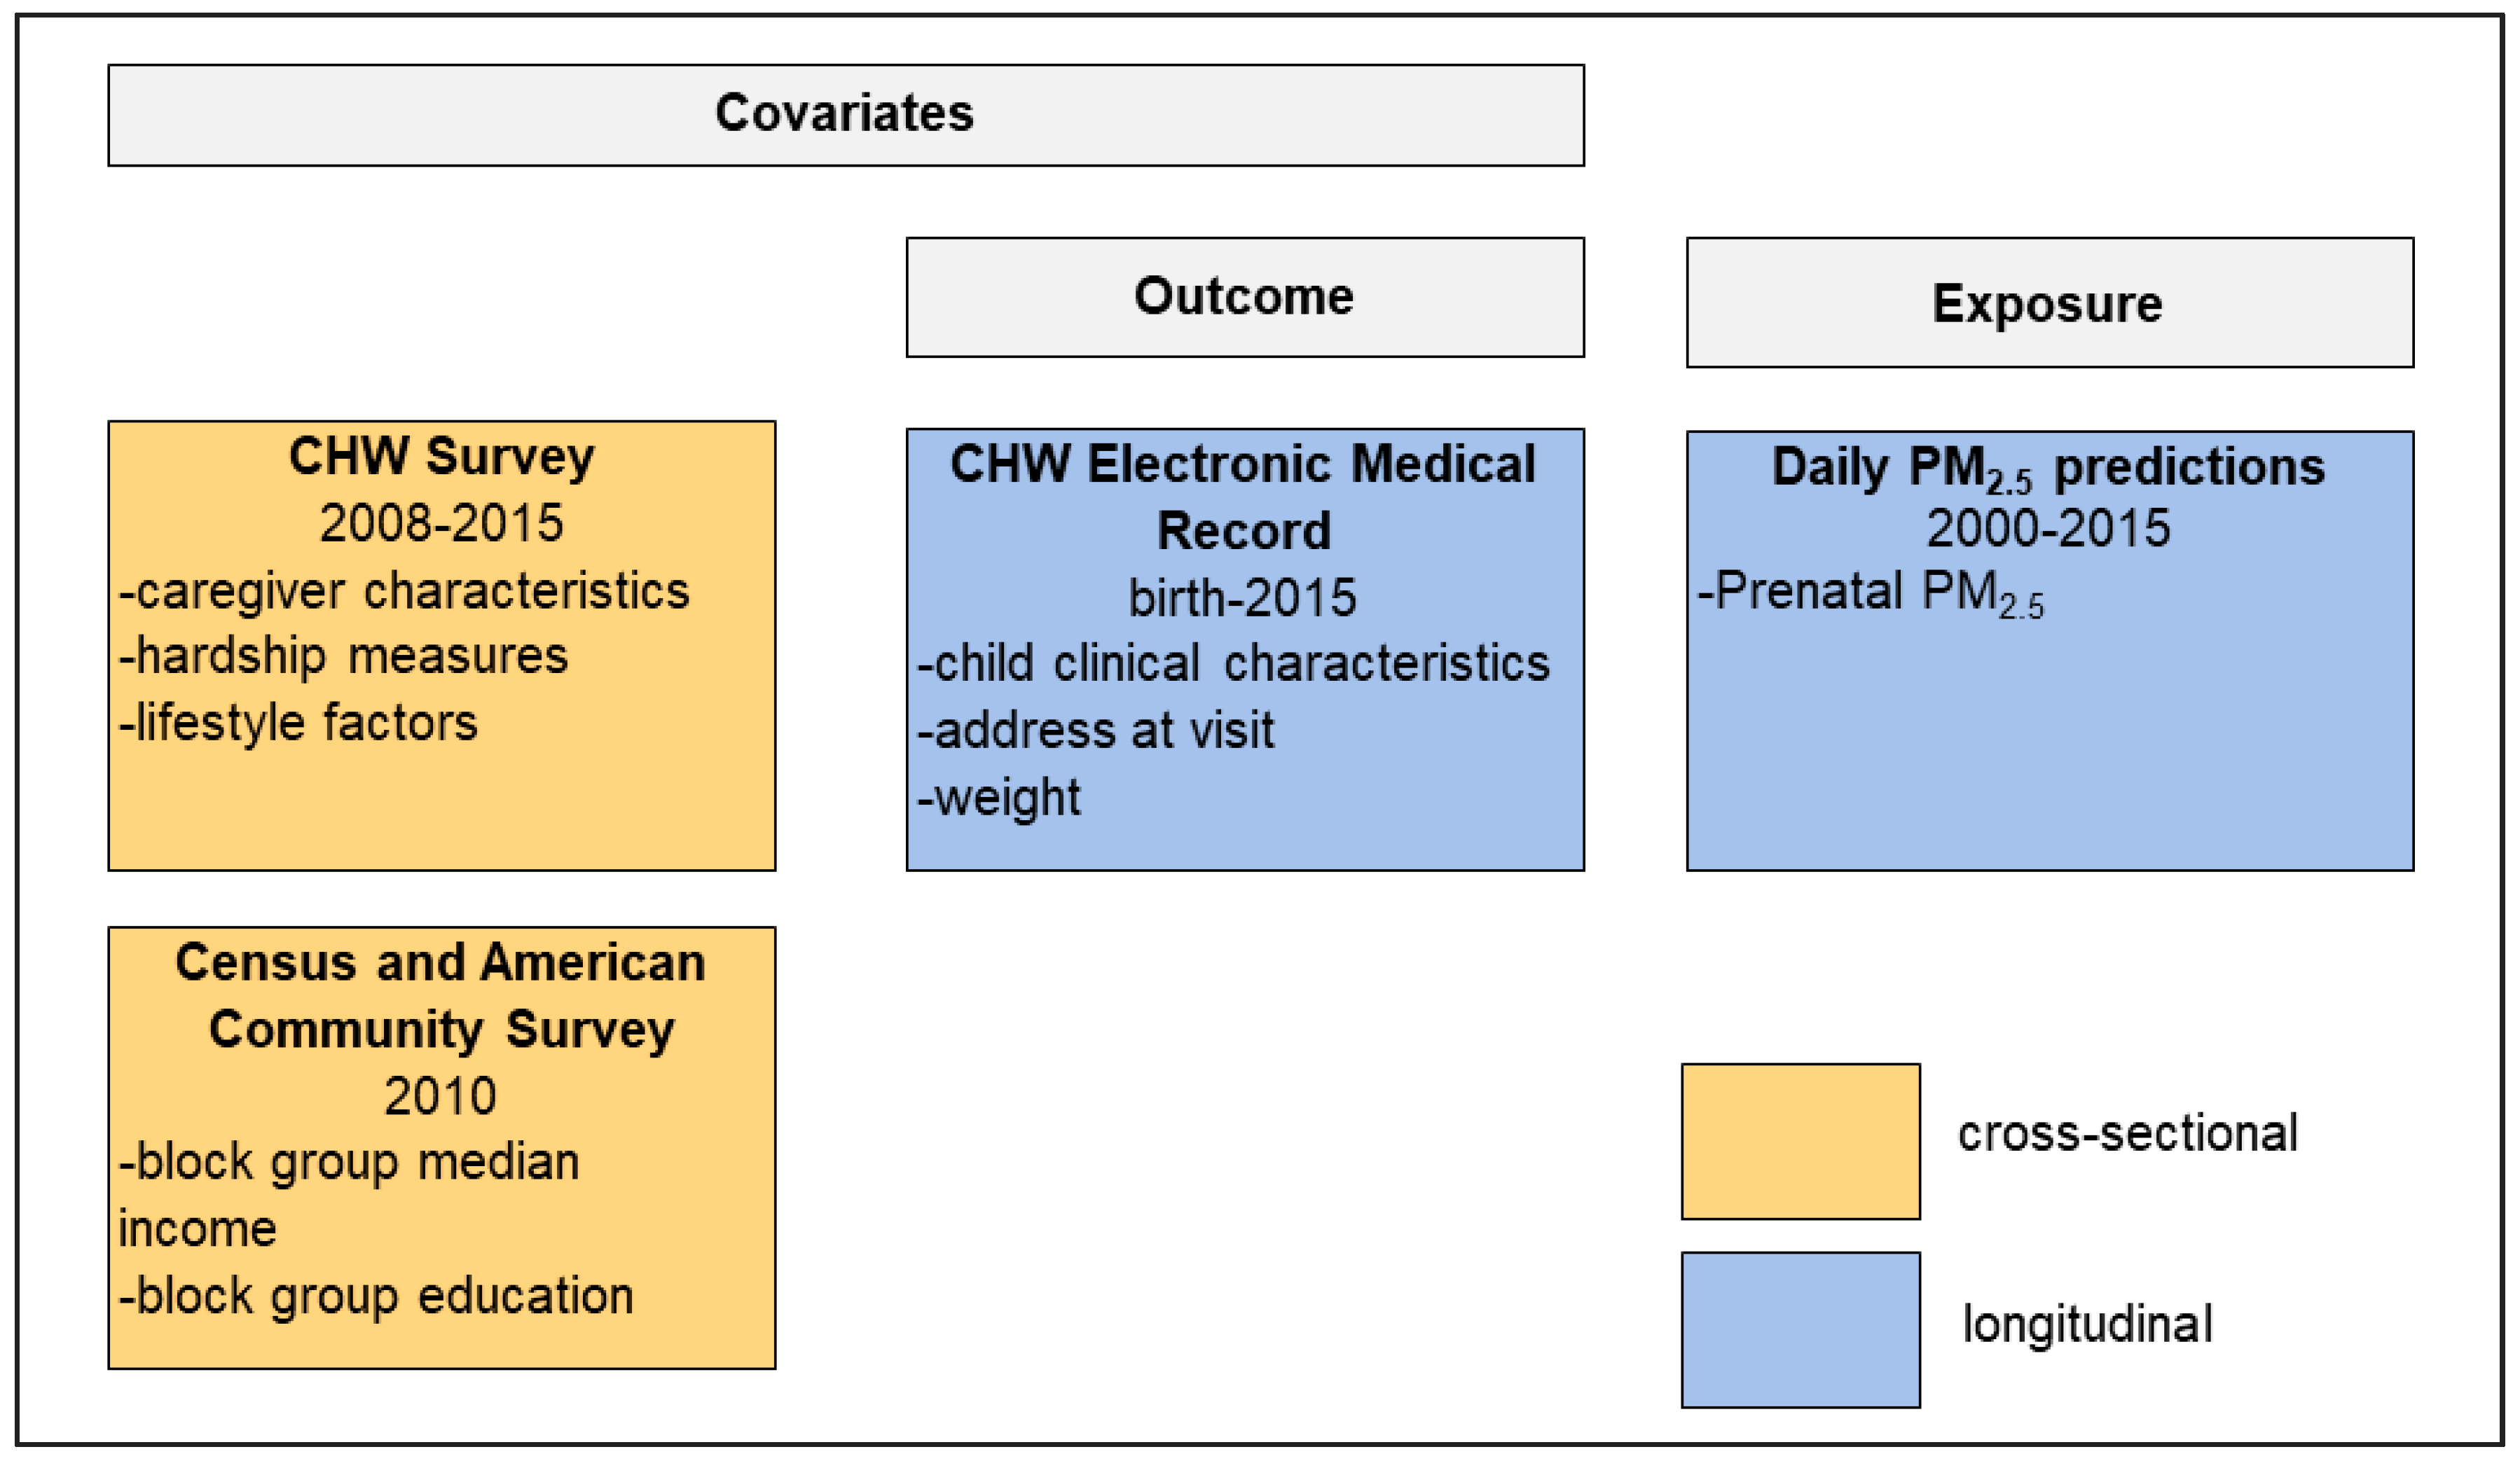
2.2. Linking EHR and CHW Survey Data
2.3. Weight Outcome Data and Analytical Sample Selection
2.4. Exposure Assessment
2.5. Covariates
2.6. Growth Trajectories Model
2.7. Sensitivity Analyses
3. Results
4. Discussion
5. Conclusions
Supplementary Materials
Author Contributions
Funding
Acknowledgments
Conflicts of Interest
References
- Baird, J.; Fisher, D.; Lucas, P.; Kleijnen, J.; Roberts, H.; Law, C. Being big or growing fast: Systematic review of size and growth in infancy and later obesity. BMJ 2005, 331, 929. [Google Scholar] [CrossRef] [PubMed] [Green Version]
- Stettler, N.; Zemel, B.S.; Kumanyika, S.; Stallings, V.A. Infant Weight Gain and Childhood Overweight Status in a Multicenter, Cohort Study. Pediatrics 2002, 109, 194–199. [Google Scholar] [CrossRef] [PubMed]
- Barker, D.J.P.; Osmond, C.; Forsén, T.J.; Kajantie, E.; Eriksson, J.G. Trajectories of growth among children who have coronary events as adults. N. Engl. J. Med. 2005, 353, 1802–1809. [Google Scholar] [CrossRef] [PubMed]
- Barker, D.; Eriksson, J.; Forsen, T.; Osmond, C. Fetal origins of adult disease: Strength of effects and biological basis. Int. J. Epidemiol. 2002, 31, 1235–1239. [Google Scholar] [CrossRef] [Green Version]
- Dennison, B.A.; Edmunds, L.S.; Stratton, H.H.; Pruzek, R.M. Rapid infant weight gain predicts childhood overweight. Obesity (Silver Spring) 2006, 14, 491–499. [Google Scholar] [CrossRef]
- Matthews, E.; Wei, J.; Cunningham, S. Relationship between prenatal growth, postnatal growth and childhood obesity: A review. Eur. J. Clin. Nutr. Adv. 2017, 1, 919–930. [Google Scholar] [CrossRef] [Green Version]
- Reilly, J.J.; Armstrong, J.; Dorosty, A.R.; Emmett, P.M.; Ness, A.; Rogers, I.; Steer, C.; Sherriff, A. Early life risk factors for obesity in childhood: Cohort study. Br. Med. J. 2005, 330, 1357. [Google Scholar] [CrossRef] [Green Version]
- The GBD 2015 Obesity Collaborators Health; Afshin, A.; Forouzanfar, M.H.; Reitsma, M.B.; Sur, P.; Estep, K.; Lee, A.; Marczak, L.; Mokdad, A.H.; Moradi-Lakeh, M.; et al. Effects of Overweight and Obesity in 195 Countries over 25 Years. N. Engl. J. Med. 2017, 377, 13–27. [Google Scholar] [CrossRef]
- Linabery, A.M.; Nahhas, R.W.; Johnson, W.; Choh, A.C.; Towne, B.; Odegaard, A.O.; Czerwinski, S.A.; Demerath, E.W. Stronger influence of maternal than paternal obesity on infant and early childhood body mass index: The Fels Longitudinal Study. Pediatr. Obes. 2013, 8, 159–169. [Google Scholar] [CrossRef] [Green Version]
- Parsons, T.J.; Power, C.; Manor, O. Fetal and early life growth and body mass index from birth to early adulthood in 1958 British cohort: Longitudinal study. BMJ 2001, 323, 1331–1335. [Google Scholar] [CrossRef] [Green Version]
- Giles, L.C.; Whitrow, M.J.; Davies, M.J.; Davies, C.E.; Rumbold, A.R.; Moore, V.M. Growth trajectories in early childhood, their relationship with antenatal and postnatal factors, and development of obesity by age 9 years: Results from an Australian birth cohort study. Int. J. Obes. 2015, 39, 1049–1056. [Google Scholar] [CrossRef] [PubMed]
- Gillman, M.W. Developmental Origins of Health and Disease. N. Engl. J. Med. 2005, 353, 1848–1850. [Google Scholar] [CrossRef] [PubMed] [Green Version]
- Hales, C.N.; Barker, D.J. The thrifty phenotype hypothesis. Br. Med. Bull. 2001, 60, 5–20. [Google Scholar] [CrossRef] [PubMed] [Green Version]
- Vaag, A.A.; Grunnet, L.G.; Arora, G.P.; Brøns, C. The thrifty phenotype hypothesis revisited. Diabetologia 2012, 55, 2085–2088. [Google Scholar] [CrossRef] [Green Version]
- Jerrett, M.; McConnell, R.; Wolch, J.; Chang, R.; Lam, C.; Dunton, G.; Gilliland, F.; Lurmann, F.; Islam, T.; Berhane, K. Traffic-related air pollution and obesity formation in children: A longitudinal, multilevel analysis. Environ. Health 2014, 13, 49. [Google Scholar] [CrossRef] [Green Version]
- Zheng, T.; Zhang, J.; Sommer, K.; Bassig, B.A.; Zhang, X.; Braun, J.; Xu, S.; Boyle, P.; Zhang, B.; Shi, K.; et al. Effects of environmental exposures on fetal and childhood growth trajectories. Ann. Glob. Health 2016, 82, 41–99. [Google Scholar] [CrossRef] [Green Version]
- Malmqvist, E.; Liew, Z.; Källén, K.; Rignell-Hydbom, A.; Rittner, R.; Rylander, L.; Ritz, B. Fetal growth and air pollution -A study on ultrasound and birth measures. Environ. Res. 2017, 152, 73–80. [Google Scholar] [CrossRef] [Green Version]
- Mao, G.; Nachman, R.M.; Sun, Q.; Zhang, X.; Koehler, K.; Chen, Z.; Hong, X.; Wang, G.; Caruso, D.; Zong, G.; et al. Individual and Joint Effects of Early-Life Ambient PM2.5 Exposure and Maternal Pre-Pregnancy Obesity on Childhood Overweight or Obesity. Environ. Health Perspect. 2016, 125, 067005. [Google Scholar] [CrossRef]
- Fleisch, A.F.; Rifas-Shiman, S.L.; Koutrakis, P.; Schwartz, J.D.; Kloog, I.; Melly, S.J.; Coull, B.A.; Zanobetti, A.; Gillman, M.W.; Gold, D.R.; et al. Prenatal Exposure to Traffic Pollution: Associations with Reduced Fetal Growth and Rapid Infant Weight Gain. Epidemiology 2015, 26, 43–50. [Google Scholar] [CrossRef]
- McConnell, R.; Shen, E.; Gilliland, F.D.; Jerrett, M.; Wolch, J.; Chih-Chieh, C.; Lurmann, F.; Berhane, K. A Longitudinal Cohort Study of Body Mass Index and Childhood Exposure to Secondhand Tobacco Smoke and Air Pollution: The Southern California Children’s Health Study. Environ. Health Perspect. 2015, 123, 360–366. [Google Scholar] [CrossRef] [Green Version]
- Fleisch, A.F.; Aris, I.M.; Rifas-Shiman, S.L.; Coull, B.A.; Luttmann-Gibson, H.; Koutrakis, P.; Schwartz, J.D.; Kloog, I.; Gold, D.R.; Oken, E. Prenatal Exposure to Traffic Pollution and Childhood Body Mass Index Trajectory. Front. Endocrinol. 2019, 9. [Google Scholar] [CrossRef] [PubMed] [Green Version]
- Kim, J.S.; Alderete, T.L.; Chen, Z.; Lurmann, F.; Rappaport, E.; Habre, R.; Berhane, K.; Gilliland, F.D. Longitudinal associations of in utero and early life near-roadway air pollution with trajectories of childhood body mass index. Environ. Health 2018, 17. [Google Scholar] [CrossRef] [PubMed] [Green Version]
- Cutts, D.B.; Meyers, A.F.; Black, M.M.; Casey, P.H.; Chilton, M.; Cook, J.T.; Geppert, J.; De Cuba, S.E.; Heeren, T.; Coleman, S.; et al. US housing insecurity and the health of very young children. Am. J. Public Health 2011, 101, 1508–1514. [Google Scholar] [CrossRef] [PubMed]
- Centers for Disease Control Growth Charts -WHO and CDC Child Growth Standards. Available online: https://www.cdc.gov/growthcharts/who_charts.htm#TheWHOGrowthCharts (accessed on 14 October 2017).
- MassGIS MassGIS Data -Master Address Data. Available online: http://www.mass.gov/anf/research-and-tech/it-serv-and-support/application-serv/office-of-geographic-information-massgis/datalayers/master-address-data.html (accessed on 23 September 2017).
- Kloog, I.; Chudnovsky, A.A.; Just, A.C.; Nordio, F.; Koutrakis, P.; Coull, B.A.; Lyapustin, A.; Wang, Y.; Schwartz, J. A new hybrid spatio-temporal model for estimating daily multi-year PM2.5 concentrations across northeastern USA using high resolution aerosol optical depth data. Atmos. Environ. 2014, 95, 581–590. [Google Scholar] [CrossRef] [PubMed] [Green Version]
- Frank, D.A.; Casey, P.H.; Black, M.M.; Rose-Jacobs, R.; Chilton, M.M.; Cutts, D.B.; March, E.; Heeren, T.; Coleman, S.; Ettinger de Cuba, S.; et al. Cumulative Hardship and Wellness of Low-Income, Young Children: Multisite Surveillance Study. Pediatrics 2010, 125, e1115–e1123. [Google Scholar] [CrossRef] [Green Version]
- Lakshmanan, A.; Chiu, Y.H.M.; Coull, B.A.; Just, A.C.; Maxwell, S.L.; Schwartz, J.; Gryparis, A.; Kloog, I.; Wright, R.J.; Wright, R.O. Associations between prenatal traffic-related air pollution exposure and birth weight: Modification by sex and maternal pre-pregnancy body mass index. Environ. Res. 2015, 137, 268–277. [Google Scholar] [CrossRef] [Green Version]
- Clougherty, J.E. A growing role for gender analysis in air pollution epidemiology. Environ. Health Perspect. 2010, 118, 167–176. [Google Scholar] [CrossRef] [Green Version]
- Fitzmaurice, G.M.; Laird, N.M.; Ware, J.H. Applied Longitudinal Analysis, 2nd ed.; Wiley: Hoboken, NJ, USA, 2011; ISBN 0470380276. [Google Scholar]
- Howe, L.D.; Tilling, K.; Matijasevich, A.; Petherick, E.S.; Santos, A.C.; Fairley, L.; Wright, J.; Santos, I.S.; Barros, A.J.; Martin, R.M.; et al. Linear spline multilevel models for summarising childhood growth trajectories: A guide to their application using examples from five birth cohorts. Stat. Methods Med. Res. 2016, 25, 1854–1874. [Google Scholar] [CrossRef] [Green Version]
- Patel, R.; Tilling, K.; Lawlor, D.A.; Howe, L.D.; Bogdanovich, N.; Matush, L.; Nicoli, E.; Kramer, M.S.; Martin, R.M. Socioeconomic differences in childhood length/height trajectories in a middle-income country: A cohort study. BMC Public Health 2014, 14, 932. [Google Scholar] [CrossRef] [Green Version]
- Tilling, K.; MacDonald-Wallis, C.; Lawlor, D.A.; Hughes, R.A.; Howe, L.D. Modelling childhood growth using fractional polynomials and linear splines. Ann. Nutr. Metab. 2014, 65, 129–138. [Google Scholar] [CrossRef]
- O’Keeffe, L.M.; Kearney, P.M.; Greene, R.A.; Zuccolo, L.; Tilling, K.; Lawlor, D.A.; Howe, L.D. Maternal alcohol use during pregnancy and offspring trajectories of height and weight: A prospective cohort study. Drug Alcohol Depend. 2015, 153, 323–329. [Google Scholar] [CrossRef] [PubMed]
- Chirwa, E.D.; Griffiths, P.L.; Maleta, K.; Norris, S.A.; Cameron, N. Multi-level modelling of longitudinal child growth data from the Birth-to-Twenty Cohort: A comparison of growth models. Ann. Hum. Biol. 2014, 41, 168–179. [Google Scholar] [CrossRef] [PubMed] [Green Version]
- Lourenço, B.H.; Villamor, E.; Augusto, R.A.; Cardoso, M.A. Determinants of linear growth from infancy to school-aged years: A population-based follow-up study in urban Amazonian children. BMC Public Health 2012, 12, 265. [Google Scholar] [CrossRef] [PubMed]
- Grajeda, L.M.; Ivanescu, A.; Saito, M.; Crainiceanu, C.; Jaganath, D.; Gilman, R.H.; Crabtree, J.E.; Kelleher, D.; Cabrera, L.; Cama, V.; et al. Modelling subject-specific childhood growth using linear mixed-effect models with cubic regression splines. Emerg. Themes Epidemiol. 2016, 13, 1. [Google Scholar] [CrossRef] [Green Version]
- Wood, S.N. Generalized Additive Models, 2nd ed.; Chapman and Hall/CRC: New York, NY, USA, 2017; ISBN 9781315370279. [Google Scholar]
- UNICEF; WHO. Low Birthweight: Country, Regional and Global Estimates; UNICEF: New York, NY, USA, 2004. [Google Scholar]
- Reddy, U.M.; Bettegowda, V.R.; Dias, T.; Yamada-Kushnir, T.; Ko, C.-W.; Willinger, M. Term pregnancy: A period of heterogeneous risk for infant mortality. Obstet. Gynecol. 2011, 117, 1279–1287. [Google Scholar] [CrossRef]
- Ogden, C.L.; Kuczmarski, R.J.; Flegal, K.M.; Mei, Z.; Guo, S.; Wei, R.; Grummer-Strawn, L.M.; Curtin, L.R.; Roche, A.F.; Johnson, C.L. Centers for Disease Control and Prevention 2000 growth charts for the United States: Improvements to the 1977 National Center for Health Statistics version. Pediatrics 2002, 109, 45–60. [Google Scholar] [CrossRef] [Green Version]
- Kannan, S.; Misra, D.P.; Dvonch, J.T.; Krishnakumar, A. Exposures to airborne particulate matter and adverse perinatal outcomes: A biologically plausible mechanistic framework for exploring potential effect modification by nutrition responses to PM exposures. Environ. Health Perspect. 2006, 114, 1636–1642. [Google Scholar] [CrossRef]
- Janssen, B.G.; Janssen, B.G.; Byun, H.; Gyselaers, W.; Lefebvre, W.; Andrea, A. Placental mitochondrial methylation and exposure to airborne particulate matter in the early life environment: An ENVIRONAGE birth cohort study to airborne particulate matter in the early life. Epigenetics 2016, 10, 536–544. [Google Scholar] [CrossRef] [Green Version]
- de melo, J.O.; Soto, S.F.; Katayama, I.A.; Wenceslau, C.F.; Pires, A.G.; Veras, M.M.; Furukawa, L.N.S.; de Castro, I.; Saldiva, P.H.N.; Heimann, J.C. Inhalation of fine particulate matter during pregnancy increased IL-4 cytokine levels in the fetal portion of the placenta. Toxicol. Lett. 2015, 232, 475–480. [Google Scholar] [CrossRef]
- Ghosh, R.; Rankin, J.; Pless-Mulloli, T.; Glinianaia, S. Does the effect of air pollution on pregnancy outcomes differ by gender? A systematic review. Environ. Res. 2007, 105, 400–408. [Google Scholar] [CrossRef]
- Ebisu, K.; Bell, M.L. Airborne PM2.5 chemical components and low birth weight in the northeastern and Mid-Atlantic regions of the United States. Environ. Health Perspect. 2012, 120, 1746–1752. [Google Scholar] [CrossRef] [PubMed] [Green Version]
- Jedrychowski, W.; Perera, F.; Mrozek-Budzyn, D.; Mroz, E.; Flak, E.; Spengler, J.D.; Edwards, S.; Jacek, R.; Kaim, I.; Skolicki, Z. Gender differences in fetal growth of newborns exposed prenatally to airborne fine particulate matter. Environ. Res. 2009, 109, 447–456. [Google Scholar] [CrossRef] [PubMed] [Green Version]
- Chiu, Y.H.; Hsu, H.H.; Wilson, A.; Coull, B.A.; Pendo, M.P.; Baccarelli, A.; Kloog, I.; Schwartz, J.; Wright, R.O.; Taveras, E.M.; et al. Prenatal particulate air pollution exposure and body composition in urban preschool children: Examining sensitive windows and sex-specific associations. Environ. Res. 2017, 158, 798–805. [Google Scholar] [CrossRef] [PubMed]
- Chen, M.; Wang, X.; Hu, Z.; Zhou, H.; Xu, Y.; Qiu, L.; Qin, X. Programming of mouse obesity by maternal exposure to concentrated ambient fine particles. Part. Fibre Toxicol. 2017, 1–13. [Google Scholar] [CrossRef] [PubMed] [Green Version]
- Calderón-Garcidueñas, L.; Torres-Jardón, R.; Kulesza, R.J.; Park, S.-B.; D’Angiulli, A. Air pollution and detrimental effects on children’s brain. The need for a multidisciplinary approach to the issue complexity and challenges. Front. Hum. Neurosci. 2014, 8, 613. [Google Scholar] [PubMed] [Green Version]
- Mauvais-Jarvis, F. Sex differences in metabolic homeostasis, diabetes, and obesity. Biol. Sex Differ. 2015, 6, 14. [Google Scholar] [CrossRef] [PubMed] [Green Version]
- Fleisch, A.F.; Luttmann-Gibson, H.; Perng, W.; Rifas-Shiman, S.L.; Coull, B.A.; Kloog, I.; Koutrakis, P.; Schwartz, J.D.; Zanobetti, A.; Mantzoros, C.S.; et al. Prenatal and early life exposure to traffic pollution and cardiometabolic health in childhood. Pediatr. Obes. 2016, 12, 48–57. [Google Scholar] [CrossRef] [Green Version]
- Rhee, J.; Patricia Fabian, M.; de Cuba, S.E.; Coleman, S.; Sandel, M.; Lane, K.J.; Sade, M.Y.; Hart, J.E.; Schwartz, J.; Kloog, I.; et al. Effects of maternal homelessness, supplemental nutrition programs, and prenatal PM2.5 on birthweight. Int. J. Environ. Res. Public Health 2019, 16, 4154. [Google Scholar] [CrossRef] [Green Version]
- Cunningham, S.A.; Datar, A.; Narayan, K.M.V.; Kramer, M.R. Entrenched obesity in childhood: Findings from a national cohort study. Ann. Epidemiol. 2017, 27, 435–441. [Google Scholar] [CrossRef]
- Suzuki, K.; Sato, M.; Zheng, W.; Shinohara, R.; Yokomichi, H.; Yamagata, Z. Childhood growth trajectories according to combinations of pregestational weight status and maternal smoking during pregnancy: A multilevel analysis. PLoS ONE 2015, 10, 1–12. [Google Scholar] [CrossRef] [Green Version]
- Jerrett, M.; McConnell, R.; Chang, C.C.R.; Wolch, J.; Reynolds, K.; Lurmann, F.; Gilliland, F.; Berhane, K. Automobile Traffic around the Home and Attained Body Mass Index: A Longitudinal Cohort Study of Children aged 10–18 Years. Prev. Med. 2010, 50, S50–S58. [Google Scholar] [CrossRef] [PubMed] [Green Version]
- Smith, N.; Coleman, K.J.; Lawrence, J.M.; Quinn, V.P.; Getahun, D.; Reynolds, K.; Chen, W.; Porter, A.H.; Jacobsen, S.J.; Koebnick, C. Body weight and height data in electronic medical records of children. Int. J. Pediatr. Obes. 2010, 5, 237–242. [Google Scholar] [CrossRef] [PubMed]
- Casey, J.A.; Schwartz, B.S.; Stewart, W.F.; Adler, N.E. Using Electronic Health Records for Population Health Research: A Review of Methods and Applications. Annu. Rev. Public Health 2016, 37, 61–81. [Google Scholar] [CrossRef] [PubMed] [Green Version]
- Braun, K.V.; Erler, N.S.; Kiefte-de Jong, J.C.; Jaddoe, V.W.V.; van den Hooven, E.H.; Franco, O.H.; Voortman, T. Dietary Intake of Protein in Early Childhood Is Associated with Growth Trajectories between 1 and 9 Years of Age. J. Nutr. 2016, 146, 2361–2367. [Google Scholar] [CrossRef]


| Child Characteristics | ||
|---|---|---|
| Males (n (%)) | Females (n (%)) | |
| Total | 2603 (100) | 2194 (100) |
| Birth weight (g) (% missing: 1.6 males, 1.1 females) | ||
| <2500 | 292 (11.4) | 289 (13.3) |
| >=2500 | 2269 (88.6) | 1881 (86.7) |
| Gestational age (% missing: 0.4 males, 0.4 females) | ||
| <37 weeks | 411 (15.9) | 309 (14.1) |
| >= 37 weeks | 2181 (84.1) | 1876 (85.9) |
| Breastfed During Pregnancy (% missing: 0.8 males, 0.6 females) | ||
| Yes | 1999 (77.4) | 1688 (77.4) |
| No | 584 (22.6) | 492 (22.6) |
| Cumulative hardship (% missing: 12.7 males, 11.6 females) a | ||
| 0 hardships | 806 (35.5) | 655 (33.8) |
| 1–3 hardships | 1288 (56.7) | 1121 (57.8) |
| >3 hardships | 179 (7.9) | 163 (8.4) |
| Number of overall visits (inpatient and outpatient) | ||
| mean ± SD | 14.8 ± 14.9 | 14.5 ± 14.1 |
| Block group median income ($) | ||
| mean ± SD | 43,792.4 ± 22,003.7 | 43,442.3 ± 22,424.0 |
| Self-reported caregiver characteristics | ||
| Marital status (% missing: 0.5 males, 0.4 females) | ||
| Married | 933 (36.0) | 782 (35.8) |
| Not married | 1657 (64.0) | 1403 (64.2) |
| Ethnicity (% missing: 1.2 males, 1.0 females) | ||
| Hispanic | 919 (35.7) | 766 (35.3) |
| Black, non-Hispanic | 1294 (50.3) | 1099 (50.6) |
| White, non-Hispanic | 222 (8.6) | 191 (8.8) |
| Other | 137 (5.3) | 116 (5.3) |
| Education (% missing: 0.5 males, 0.3 females) | ||
| Less than high school | 611 (23.6) | 524 (24.0) |
| High school graduate | 853 (33.0) | 723 (33.0) |
| Post-secondary | 1125 (43.5) | 941 (43.0) |
| Country of birth b (% missing: 0.8 males, 0.3 females) | ||
| U.S.-born | 1484 (57.5) | 1266 (57.9) |
| Not U.S.-born | 1099 (42.6) | 921 (42.1) |
| Smoked in last 5 years (% missing: 4.1 males, 2.9 females) | ||
| Yes | 618 (24.8) | 562 (26.4) |
| No | 1879 (75.3) | 1568 (73.6) |
| Age at child’s birth | ||
| Mean ± SD | 26.8 ± 6.3 | 27.0 ± 6.3 |
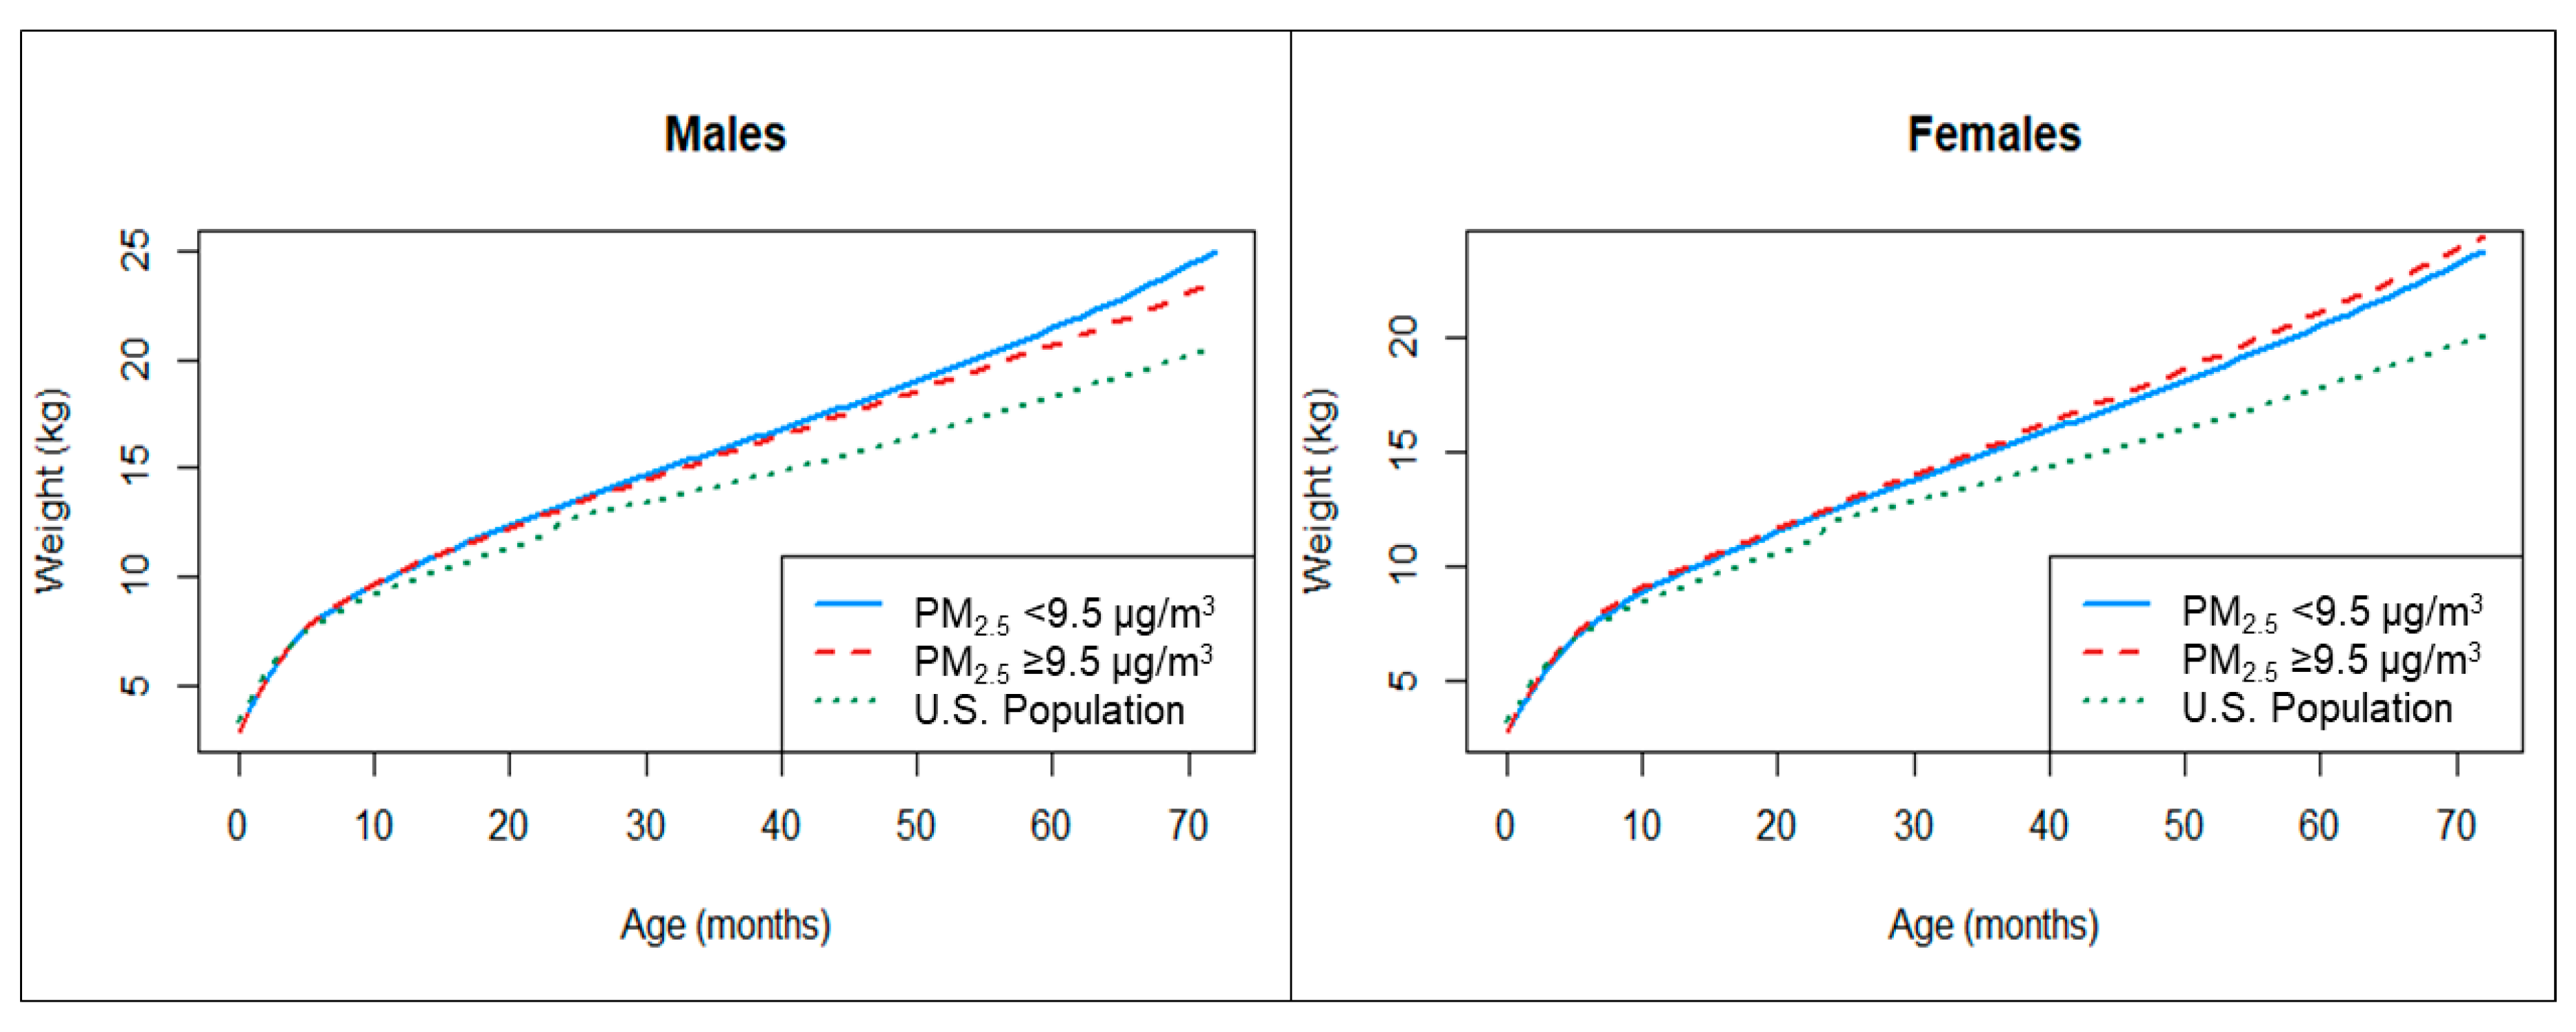
| Prenatal PM2.5 Group | Birth | 3 Months | 6 Months | 12 Months | 18 Months | 24 Months | 36 Months | 48 Months | 60 Months | 72 Months |
|---|---|---|---|---|---|---|---|---|---|---|
| Males (n = 2244; weight measurements = 32,405) | ||||||||||
| <9.5 µg/m3 a | 3.00 | 6.17 | 8.09 | 10.25 | 11.86 | 13.33 | 15.98 | 18.55 | 21.44 | 24.99 |
| (2.94, 3.06) | (6.11, 6.22) | (8.03, 8.15) | (10.17, 10.32) | (11.78, 11.96) | (13.22, 13.44) | (15.81, 16.14) | (18.34, 18.78) | (21.16, 21.72) | (24.62, 25.36) | |
| ≥9.5 µg/m3 a | 3.02 | 6.17 | 8.14 | 10.29 | 11.77 | 13.16 | 15.71 | 18.16 | 20.72 | 23.60 |
| (2.95, 3.09) | (6.11, 6.23) | (8.07, 8.21) | (10.21, 10.37) | (11.68, 11.87) | (13.04, 13.28) | (15.54, 15.88) | (17.94, 18.38) | (20.44, 21.00) | (23.25, 23.94) | |
| ∆ | −0.02 | 0.01 | −0.05 | −0.04 | 0.09 | 0.17 | 0.27 | 0.39 | 0.72 | 1.39 |
| p-value b | 0.70 | 0.99 | 0.30 | 0.41 | 0.17 | 0.04 | 0.02 | 0.01 | 0.0003 | <0.00001 |
| Females (n = 1931; weight measurements = 27,148) | ||||||||||
| <9.5 µg/m3 a | 2.95 | 5.58 | 7.36 | 9.52 | 11.05 | 12.48 | 15.11 | 17.71 | 20.52 | 23.79 |
| (2.88, 3.02) | (5.52, 5.64) | (7.30, 7.42) | (9.45, 9.60) | (10.96, 11.15) | (12.35, 12.60) | (14.93, 15.30) | (17.45, 17.97) | (20.19, 20.83) | (23.35, 24.23) | |
| ≥9.5 µg/m3 a | 2.98 | 5.71 | 7.55 | 9.70 | 11.21 | 12.64 | 15.41 | 18.18 | 21.13 | 24.42 |
| (2.91, 3.06) | (5.64, 5.78) | (7.48, 7.61) | (9.62, 9.79) | (11.11, 11.30) | (12.51, 12.76) | (15.22, 15.58) | (17.93, 18.41) | (20.83, 21.43) | (24.05, 24.81) | |
| ∆ | −0.03 | −0.13 | −0.19 | −0.19 | −0.15 | −0.16 | −0.29 | −0.47 | −0.61 | −0.64 |
| p-value b | 0.50 | 0.006 | 0.0001 | 0.001 | 0.03 | 0.07 | 0.03 | 0.01 | 0.01 | 0.03 |
© 2020 by the authors. Licensee MDPI, Basel, Switzerland. This article is an open access article distributed under the terms and conditions of the Creative Commons Attribution (CC BY) license (http://creativecommons.org/licenses/by/4.0/).
Share and Cite
Rosofsky, A.S.; Fabian, M.P.; Ettinger de Cuba, S.; Sandel, M.; Coleman, S.; Levy, J.I.; Coull, B.A.; Hart, J.E.; Zanobetti, A. Prenatal Ambient Particulate Matter Exposure and Longitudinal Weight Growth Trajectories in Early Childhood. Int. J. Environ. Res. Public Health 2020, 17, 1444. https://0-doi-org.brum.beds.ac.uk/10.3390/ijerph17041444
Rosofsky AS, Fabian MP, Ettinger de Cuba S, Sandel M, Coleman S, Levy JI, Coull BA, Hart JE, Zanobetti A. Prenatal Ambient Particulate Matter Exposure and Longitudinal Weight Growth Trajectories in Early Childhood. International Journal of Environmental Research and Public Health. 2020; 17(4):1444. https://0-doi-org.brum.beds.ac.uk/10.3390/ijerph17041444
Chicago/Turabian StyleRosofsky, Anna S., M. Patricia Fabian, Stephanie Ettinger de Cuba, Megan Sandel, Sharon Coleman, Jonathan I. Levy, Brent A. Coull, Jaime E. Hart, and Antonella Zanobetti. 2020. "Prenatal Ambient Particulate Matter Exposure and Longitudinal Weight Growth Trajectories in Early Childhood" International Journal of Environmental Research and Public Health 17, no. 4: 1444. https://0-doi-org.brum.beds.ac.uk/10.3390/ijerph17041444