Is Heart Rate a Confounding Factor for Photoplethysmography Markers? A Systematic Review

 , ,
, ,
Abstract
:1. Introduction
2. Materials and Methods
3. Results
4. Discussion
Study Limitations
5. Conclusions
Author Contributions
Funding
Acknowledgments
Conflicts of Interest
References
- Benjamin, E.J.; Muntner, P.; Alonso, A.; Bittencourt, M.S.; Callaway, C.W.; Carson, A.P.; Chamberlain, A.M.; Chang, A.R.; Cheng, S.; Das, S.R.; et al. On behalf of the American Heart Association Council on Epidemiology and Prevention Statistics Committee and Stroke Statistics Subcommittee. Heart disease and stroke statistics—2019 update: A report from the American Heart Association. Circulation 2019, 139, e56–e528. [Google Scholar] [CrossRef]
- Mahidin, M.U. Press Release—Statistics on Causes of Death, Malaysia. 2018; Department of Statistics Malaysia: Putrajaya, Malaysia, 2018.
- Tian, J.; Yuan, Y.; Shen, M.; Zhang, X.; He, M.; Guo, H.; Yang, H.; Wu, T. Association of resting heart rate and its change with incident cardiovascular events in the middle-aged and older Chinese. Sci. Rep. 2019, 9, 6556. [Google Scholar] [CrossRef] [PubMed] [Green Version]
- Boudoulas, H.; Rittgers, S.E.; Lewis, R.P.; Leier, C.V.; Weissler, A.M. Changes in diastolic time with various pharmacologic agents: Implication for myocardial perfusion. Circulation 1979, 60, 164–169. [Google Scholar] [CrossRef] [PubMed] [Green Version]
- Boudoulas, K.D.; Borer, J.S.; Boudoulas, H. Heart Rate, Life Expectancy and the Cardiovascular System: Therapeutic Considerations. Cardiology 2015, 132, 199–212. [Google Scholar] [CrossRef] [PubMed]
- Ferrari, R.; Fox, K. Heart rate reduction in coronary artery disease and heart failure. Nat. Rev. Cardiol. 2016, 13, 493. [Google Scholar] [CrossRef]
- Fox, K.; Borer, J.S.; Camm, A.J.; Danchin, N.; Ferrari, R.; Sendon, J.L.L.; Steg, P.G.; Tardif, J.C.; Tavazzi, L.; Heart rate Working Group; et al. Resting heart rate in cardiovascular disease. J. Am. Coll. Cardiol. 2007, 50, 823–830. [Google Scholar] [CrossRef] [Green Version]
- Custodis, F.; Schirmer, S.H.; Baumhakel, M.; Heusch, G.; Bohm, M.; Laufs, U. Vascular pathophysiology in response to increased heart rate. J. Am. Coll. Cardiol. 2010, 56, 1973–1983. [Google Scholar] [CrossRef] [PubMed] [Green Version]
- Palatini, P. Heart rate and the cardiometabolic risk. Curr. Hypertens. Rep. 2013, 15, 253–259. [Google Scholar] [CrossRef]
- Palatini, P. Elevated heart rate in cardiovascular diseases: A target for treatment? Prog. Cardiovasc. Dis. 2009, 52, 46–60. [Google Scholar] [CrossRef]
- Bassiouny, H.S.; Zarins, C.K.; Kadowaki, M.H.; Glagov, S. Hemodynamic stress and experimental aortoiliac atherosclerosis. J. Vasc. Surg. 1994, 19, 426–434. [Google Scholar] [CrossRef] [Green Version]
- Grassi, G.; Vailati, S.; Bertinieri, G.; Seravalle, G.; Stella, M.L.; Dell’Oro, R.; Mancia, G. Heart rate as marker of sympathetic activity. J. Hypertens. 1998, 16, 1635–1639. [Google Scholar] [CrossRef] [PubMed]
- Gopinathannair, R.; Martins, J.B. Predicting sudden cardiac death in healthy humans: Is there more to autonomic balance than we know? Heart Rhythm. 2008, 5, 306–307. [Google Scholar] [CrossRef] [PubMed]
- Goff, D.C.; Lloyd-Jones, D.M.; Bennett, G.; Coady, S.; D’agostino, R.B.; Gibbons, R.; Greenland, P.; Lackland, D.T.; Levy, D.; O’donnell, C.J.; et al. 2013 ACC/AHA guideline on the assessment of cardiovascular risk: A report of the American College of Cardiology/American Heart Association Task Force on practice guidelines. J. Am. Coll. Cardiol. 2014, 63, 2935–2959. [Google Scholar] [CrossRef] [PubMed] [Green Version]
- Palma, J.A.; Benarroch, E.E. Neural control of the heart: Recent concepts and clinical correlations. Neurology 2014, 83, 261–271. [Google Scholar] [CrossRef]
- Mancia, G.; Bousquet, P.; Elghozi, J.L.; Esler, M.; Grassi, G.; Julius, S.; Reid, J.; Van Zwieten, P.A. The sympathetic nervous system and the metabolic syndrome. J. Hypertens. 2007, 25, 909–920. [Google Scholar] [CrossRef]
- Shibao, C.; Gamboa, A.; Diedrich, A.; Ertl, A.C.; Chen, K.Y.; Byrne, D.W.; Farley, G.; Paranjape, S.Y.; Davis, S.N.; Biaggioni, I. Autonomic contribution to blood pressure and metabolism in obesity. Hypertension 2007, 49, 27–33. [Google Scholar] [CrossRef] [Green Version]
- Julius, S.; Gudbrandsson, T.; Jamerson, K.; Andersson, O. The interconnection between sympathetics, microcirculation, and insulin resistance in hypertension. Blood Press 1992, 1, 9–19. [Google Scholar] [CrossRef]
- Jamerson, K.A.; Julius, S.; Gudbrandsson, T.; Andersson, O.; Brant, D.O. Reflex sympathetic activation induces acute insulin resistance in the human forearm. Hypertension 1993, 21, 618–623. [Google Scholar] [CrossRef] [Green Version]
- Perin, P.C.; Maule, S.; Quadri, R. Sympathetic nervous system, diabetes, and hypertension. Clin. Exp. Hypertens. 2001, 23, 45–55. [Google Scholar] [CrossRef]
- Chen, X.J.; Barywani, S.B.; Hansson, P.O.; Thunström, E.Ö.; Rosengren, A.; Ergatoudes, C.; Mandalenakis, Z.; Caidahl, K.; Fu, M.L. Impact of changes in heart rate with age on all-cause death and cardiovascular events in 50-year-old men from the general population. Open Heart 2019, 6, e000856. [Google Scholar] [CrossRef]
- Muhajir, M.; Aminuddin, A.; Ugusman, A.; Salamt, N.; Asmawi, Z.; Zulkefli, A.F.; Azmi, M.F.; Chellappan, K.; Nordin, N.A.M.M. Evaluation of Finger Photoplethysmography Fitness Index on Young Women with Cardiovascular Disease Risk Factors. Sains Malays. 2018, 47, 2481–2489. [Google Scholar] [CrossRef]
- Chellappan, K. Photoplethysmogram Signal Variability and Repeatability Assessment. In Proceedings of the 2010 IEEE EMBS Conference on Biomedical Engineering & Sciences (IECBES 2010), Kuala Lumpur, Malaysia, 30 November–2 December 2010; pp. 281–284. [Google Scholar] [CrossRef]
- Elgendi, M.; Fletcher, R.; Liang, Y.; Howard, N.; Lovell, N.H.; Abbott, D.; Lim, K.; Ward, R. The use of photoplethysmography for assessing hypertension. NPJ Digit. Med. 2019, 2, 60. [Google Scholar] [CrossRef] [PubMed] [Green Version]
- Millasseau, S.C.; Kelly, R.P.; Ritter, J.M.; Chowienczyk, P.J. Determination of age-related increases in large artery stiffness by digital pulse contour analysis. Clin. Sci. 2002, 103, 371–377. [Google Scholar] [CrossRef] [Green Version]
- Alty, S.R.; Angarita-Jaimes, N.; Millasseau, S.C.; Chowienczyk, P.J. Predicting Arterial Stiffness from the Digital Volume Pulse Waveform. IEEE Trans. Biomed. Eng. 2007, 54, 2268–2275. [Google Scholar] [CrossRef] [PubMed]
- Salvi, P.; Magnani, E.; Valbusa, F.; Agnoletti, D.; Alecu, C.; Joly, L.; Benetos, A. Comparative study of methodologies for pulse wave velocity estimation. J. Hum. Hypertens. 2008, 22, 669–677. [Google Scholar] [CrossRef] [PubMed]
- Mac-Way, F.; Leboeuf, A.; Agharazii, M. Review Article: Arterial Stiffness and Dialysis Calcium Concentration. Int. J. Nephrol. 2011, 2011, 839793. [Google Scholar] [CrossRef] [PubMed] [Green Version]
- Brillante, D.G.; O’sullivan, A.J.; Howes, L.G. Arterial stiffness indices in healthy volunteers using non-invasive digital photoplethysmography. Blood Press. 2008, 17, 116–123. [Google Scholar] [CrossRef] [Green Version]
- Alaei-Shahmiri, F.; Zhao, Y.; Sherriff, J. Assessment of vascular function in individuals with hyperglycemia: A cross-sectional study of glucose—Induced changes in digital volume pulse. J. Diabetes Metab. Disord. 2015, 14, 23. [Google Scholar] [CrossRef] [Green Version]
- Elgendi, M. On the analysis of fingertip photoplethysmogram signals. Curr. Cardiol. Rev. 2012, 8, 14–25. [Google Scholar] [CrossRef]
- Imanaga, I.; Hara, H.; Koyanagi, S.; Tanaka, K. Correlation between Wave Components of the Second Derivative of Plethysmogram and Arterial Distensibility. Jpn. Heart J. 1998, 39, 775–784. [Google Scholar] [CrossRef] [Green Version]
- Matheus, A.S.d.M.; Pires, B.P.; Tibirica’, E.; Silva, A.T.K.; Gomes, M.B. Assessment of arterial stiffness in type 1 diabetes using digital pulse contour analysis: Is it a reliable method? Acta Diabetol. 2016, 53, 477–482. [Google Scholar] [CrossRef] [PubMed]
- Von Wowern, E.; Saldeen, P.; Olofsson, P. Arterial stiffness during controlled ovarian hyperstimulation and early pregnancy in women exposed to assisted reproduction. Hypertens. Pregnancy 2018. [Google Scholar] [CrossRef] [PubMed] [Green Version]
- Takazawa, K.; Tanaka, N.; Fujita, M.; Matsuoka, O.; Saiki, T.; Aikawa, M.; Tamura, S.; Ibukiyama, C. Assessment of vasoactive agents and vascular aging by the second derivative of photoplethysmogram waveform. Hypertension 1998, 32, 365–370. [Google Scholar] [CrossRef] [PubMed] [Green Version]
- Otsuka, T.; Kawada, T.; Katsumata, M.; Ibuki, C. Utility of second derivative of the finger photoplethysmogram for the estimation of the risk of coronary heart disease in the general population. Circ. J. 2006, 70, 304–310. [Google Scholar] [CrossRef] [PubMed] [Green Version]
- Baek, H.J.; Kim, J.S.; Kim, Y.S.; Lee, H.B.; Park, K.S. Second Derivative of Photoplethysmography for Estimating Vascular Aging. In Proceedings of the 6th International Special Topic Conference on Information Technology Applications in Biomedicine, Tokyo, Japan, 8–11 November 2007; pp. 70–72. [Google Scholar]
- Tabara, Y.; Igase, M.; Okada, Y.; Nagai, T.; Miki, T.; Ohyagi, Y.; Matsuda, F.; Kohara, K. Usefulness of the second derivative of the finger photoplethysmogram for assessment of end-organ damage: The J-SHIPP study. Hypertens. Res. 2016, 29, 552–556. [Google Scholar] [CrossRef]
- Elgendi, M.; Norton, I.; Brearley, M.; Abbott, D.; Schuurmans, D. Detection of a and b waves in the acceleration photoplethysmogram. Biomed. Eng. Online 2014, 13, 139. [Google Scholar] [CrossRef] [Green Version]
- Sharman, J.E.; Davies, J.E.; Jenkins, C.; Marwick, T.H. Augmentation Index, Left Ventricular Contractility and Wave Reflection. Hypertension 2009, 54, 1099–1105. [Google Scholar] [CrossRef] [Green Version]
- Wilkinson, I.B.; MacCallum, H.; Flint, L.; Cockcroft, J.R.; Newby, D.E.; Webb, D.J. The influence of heart rate on augmentation index and central arterial pressure in humans. J. Physiol. 2000, 525, 263–270. [Google Scholar] [CrossRef]
- Tan, I.; Butlin, M.; Liu, Y.Y.; Ng, K.; Avolio, A.P. Heart rate dependence of aortic pulse wave velocity at different arterial pressures in rats. Hypertension 2012, 60, 528–533. [Google Scholar] [CrossRef] [Green Version]
- Zanoli, L.; Lentini, P.; Granata, A.; Gaudio, A.; Fatuzzo, P.; Serafino, L.; Rastelli, S.; Fiore, V.; D’Anca, A.; Signorelli, S.S.; et al. A systematic review of arterial stiffness, wave reflection and air pollution. Mol. Med. Rep. 2017, 15, 3425–3429. [Google Scholar] [CrossRef]
- Ecobici, M.; Iliescu, E.L. Arterial Stiffness and Hypertension—Which Comes First? Maedica J. Clin. Med. 2017, 12, 184–190. [Google Scholar]
- Aminuddin, A.; Tan, I.; Butlin, M.; Avolio, A.P.; Kiat, H.; Barin, E.; Nordin, N.A.M.M.; Chellappan, K. Effect of increasing heart rate on finger photoplethysmography fitness index (PPGF) in subjects with implanted cardiac pacemakers. PLoS ONE 2018, 13, e0207301. [Google Scholar] [CrossRef] [PubMed]
- Ring, M.; Eriksson, M.J.; Fritz, T.; Nyberg, G.; Östenson, C.G.; Krook, A.; Zierath, J.R.; Caidahl, K. Influence of physical activity and gender on arterial function in type 2 diabetes, normal and impaired glucose tolerance. Diabetes Vasc. Dis. Res. 2015, 12, 315–324. [Google Scholar] [CrossRef] [PubMed] [Green Version]
- Brillante, D.G.; O’Sullivan, A.J.; Johnstone, M.T.; Howes, L.G. Predictors of inotropic and chronotropic effects of NG-monomethyl-L-arginine. Eur. J. Clin. Investig. 2009, 39, 273–279. [Google Scholar] [CrossRef] [PubMed]
- Wykretowicz, J.; Guzik, P.; Krauze, T.; Marciniak, R.; Komarnicki, M.; Piskorski, J.; Wysocki, H.; Wykretowicz, A. Fibrinogen and d-dimer in contrasting relation with measures of wave reflection and arterial stiffness. Scand. J. Clin. Lab. Investig. 2012, 72, 629–634. [Google Scholar] [CrossRef]
- Bahrain, A.K.; Ali, M.A.M.; Jaafar, R. The Significance Change of PPG Reflection Index in Left Ventricular Hypertrophy Risk Individual. Int. J. Sci. Eng. Res. 2014, 5, 712–717. [Google Scholar]
- Mikawa, T.; Hurtado, R. Development of the cardiac conduction system. Semin. Cell Dev. Biol. 2007, 18, 90–100. [Google Scholar] [CrossRef]
- Vincent, J.-L. Commentary: Understanding cardiac output. Crit. Care 2008, 12, 174. [Google Scholar] [CrossRef] [Green Version]
- Chen, J.-Y.; Tsai, W.-C.; Lin, C.-C.; Huang, Y.-Y.; Hsu, C.-H.; Liu, P.-Y.; Chen, J.-H. Stiffness index derived from digital volume pulse as a marker of target organ damage in untreated hypertension. Blood Press. 2005, 14, 233–237. [Google Scholar] [CrossRef]
- Millasseau, S.C.; Ritter, J.M.; Takazawa, K.; Chowienczyk, P.J. Contour analysis of the photoplethysmographic pulse measured at the finger. J. Hypertens. 2006, 24, 1449–1456. [Google Scholar] [CrossRef]
- DeLoach, S.S.; Townsend, R.R. Vascular Stiffness: Its Measurement and Significance for Epidemiologic and Outcome Studies. Clin. J. Am. Soc. Nephrol. 2008, 3, 184–192. [Google Scholar] [CrossRef] [PubMed] [Green Version]
- Sherwood, L. Human Physiology: From Cells to Systems, 9th ed.; Brooks/Cole, Cengage Learning: Belmont, CA, USA, 2016. [Google Scholar]
- Guyton, A.C.; Hall, J.E. Guyton and Hall: Textbook of Medical Physiology, 12th ed.; Saunders Elsevier: Philadelphia, PA, USA, 2011. [Google Scholar]
- Stanfield, C.L. Principles of Human Physiology, 5th ed.; Pearson Education, Inc.: San Francisco, CA, USA, 2013. [Google Scholar]


| No. | Vascular Markers | Description |
|---|---|---|
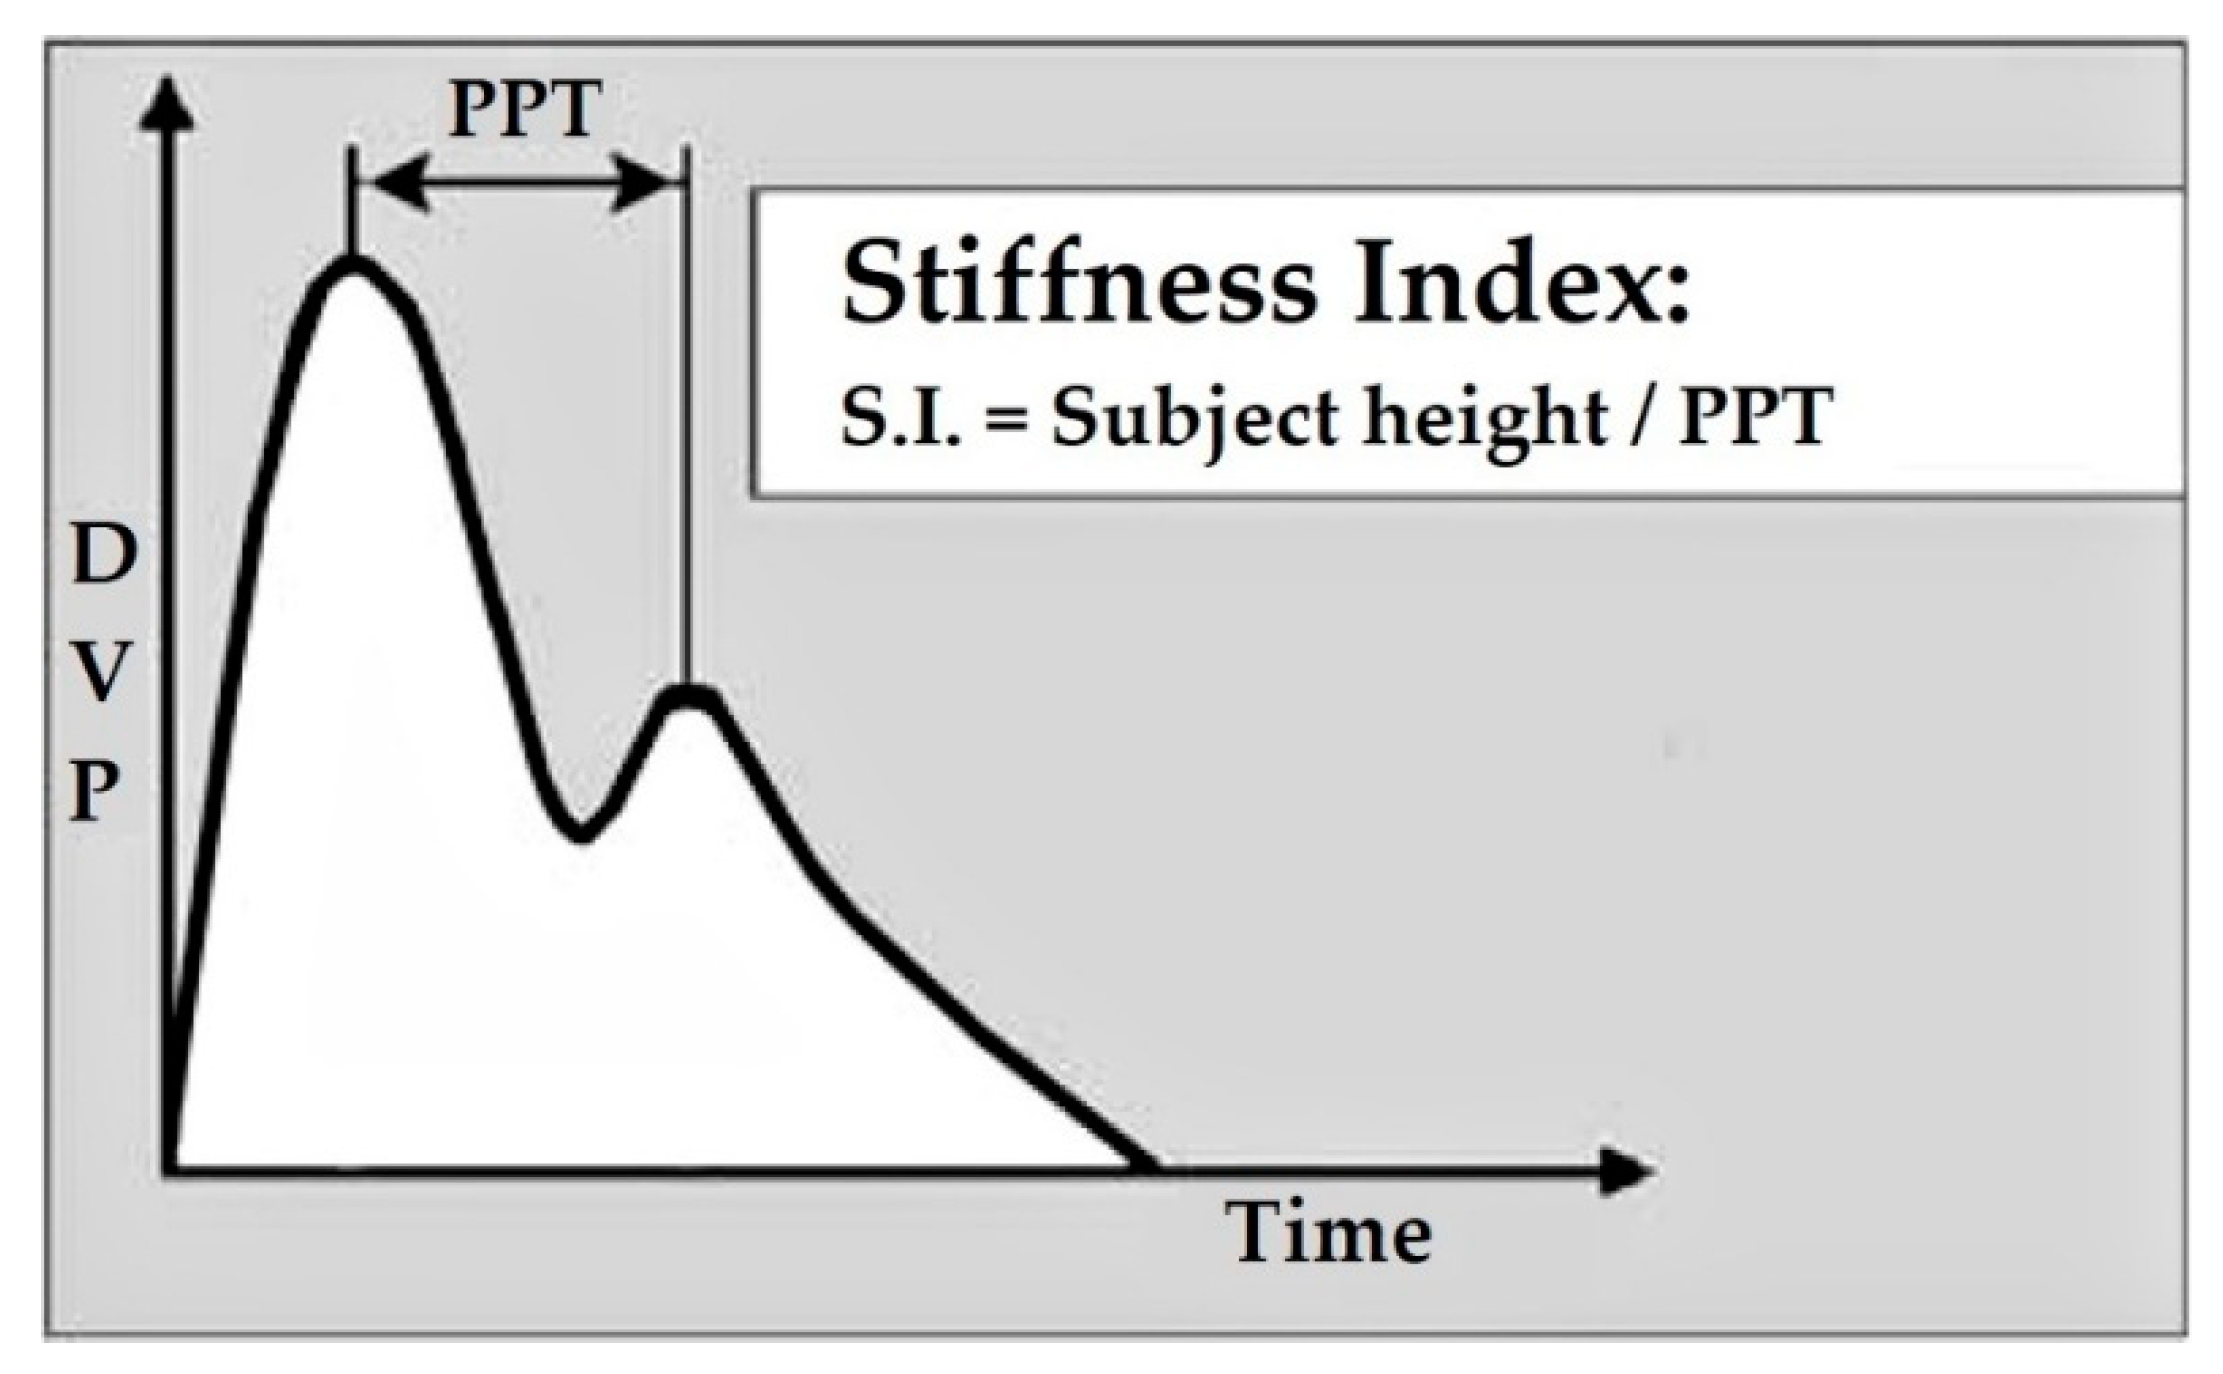
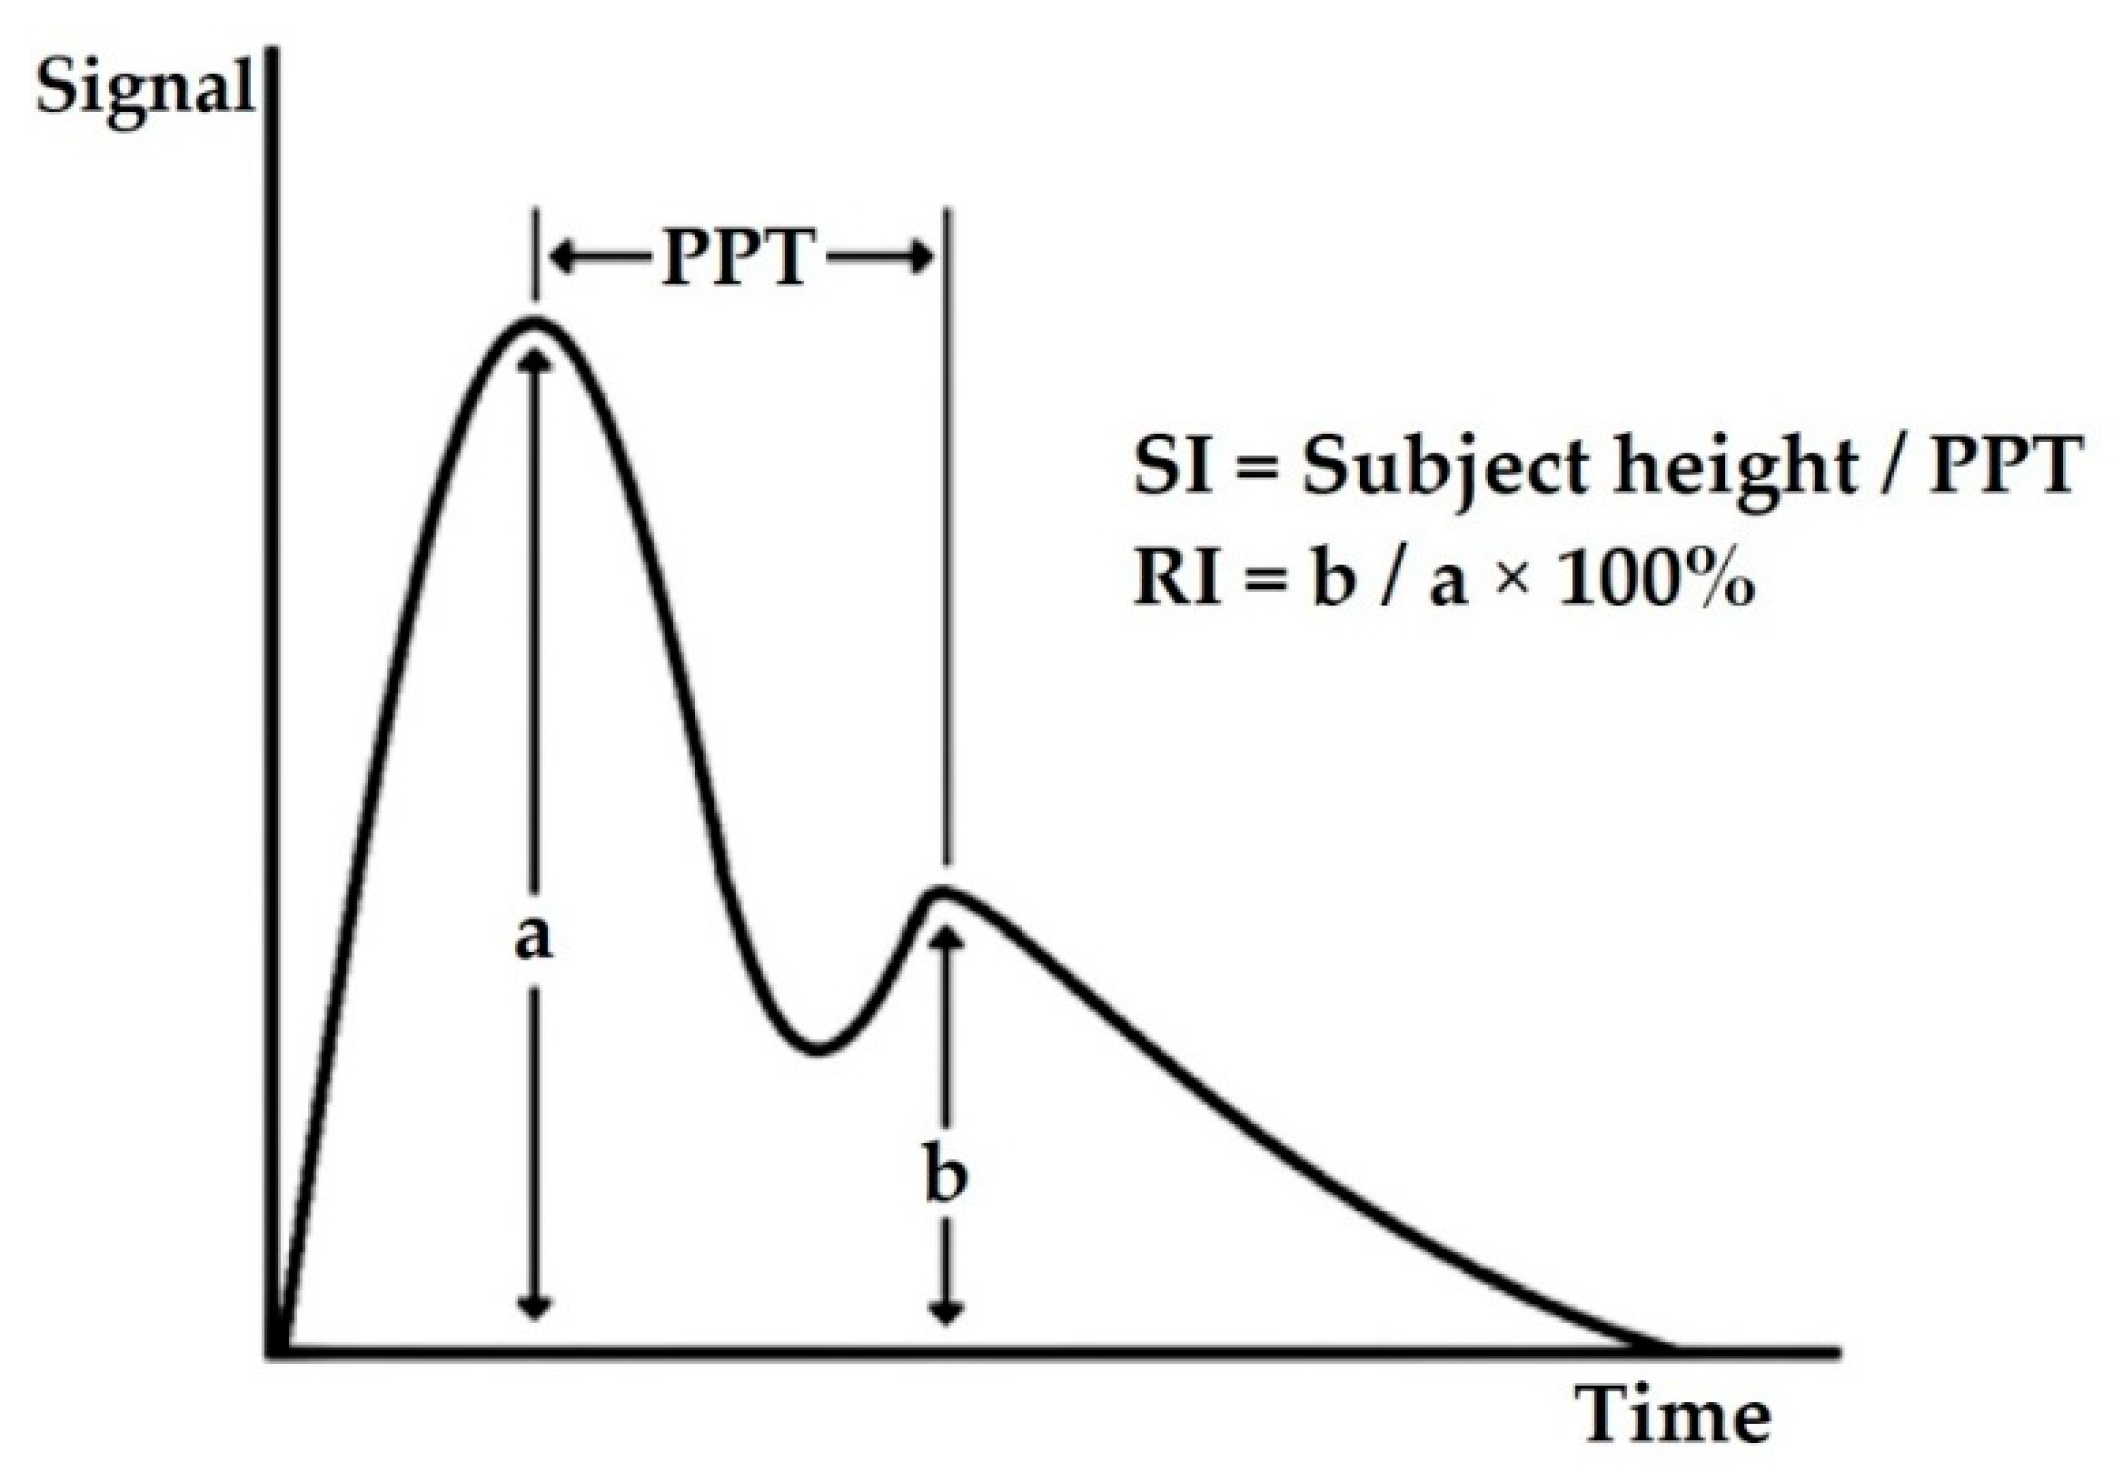
| 1. | Stiffness index (SI) | determines the stiffness level of large arteries [25] |
| 2. | Reflection index (RI) | measures the stiffness level of small to moderate arteries [29] |
| 3. | SDPPG-b/SDPPG-a ratio | high SDPPG-b/SDPPG-a ratio indicates an increase in cardiovascular risk or atherosclerosis [34] |
| 4. | SDPPG-d/SDPPG-a ratio | increasing SDPPG-d/SDPPG-a ratio represented reduction of arterial stiffness [35] |
| 5. | Aging index (AGI @ AI) | demonstrating the over-all vascular stiffness and it increases by age [34] |
| 6. | Revised aging index (RAGI) | a novel SDPPG index [38] |
| Reference | Population (n) | Mean Age (Year) Median (Interquartile Range) | Age Range (Year) | Male (%) | Instrument | Statistical Analysis | Association between HR and PPG Vascular Markers | ||
|---|---|---|---|---|---|---|---|---|---|
| SI | RI | SDPPG | |||||||
| [33] | Type 1 diabetes mellitus (T1DM) (57) & healthy (53) | T1DM 32 (24–43) Healthy 27 (22–23) | not mentioned | 43.6 | PCA2 pulse contour analyzer (PulseTrace PCA2, Micro Medical) | Pearson’s correlation coefficient | r = 0.06, p = 0.64 | r = −0.4, p < 0.001 | not measured |
| [34] | Women undergoing in vitro fertilization (IVF) (68) | 36 ± 5 36 (26–44) | Not mentioned | 0 | MeridianTM DPA photoplethysmograph (Salcor AB) | Kendal tau rank correlation analysis | not measured | not measured | b/a (Tau = −, p = 0.70) (not significant) d/a (Tau = −, p = 0.79) (not significant) AI (Tau = −, p = 0.68) (not significant) |
| [38] | Healthy (1613) | 65.3 ± 9.6 | Not mentioned | 39.6 | Finger photoplethysmograms (Arteto; U-Medica) | Multiple regression analysis | not measured | not measured | b/a (β = −0.200, p < 0.001) d/a (β = 0.143, p < 0.001) AGI (β = −0.057, p = 0.020) RAGI (β = −0.192, p < 0.001) |
| [46] | Normal glucose tolerance (121), Impaired glucose tolerance (33) and type 2 diabetes mellitus (47) | Men (60.8 ± 5.2) Women (58.9 ± 5.7) Men (62.6 ± 3.5) Women (59.0 ± 5.1) Men (61.4 ± 4.9) Women (61.4 ± 3.1) | 45–69 | 46.3 | Finger photoplethysmography (PulseTrace, Micro Medical/Care Fusion) | Spearman rank correlations | r = 0.07, p > 0.05 | r = −0.35, p < 0.001 | not measured |
| [47] | Normal glucose tolerance or insulin resistance (26) | 31 ± 10 | 18–60 | 38.5 | Digital Photoplethysmograph (Pulse Trace System, Micro Medical) | Univariate regression analysis | β = −0.30, p = 0.132 | β = −0.16, p = 0.438 | not measured |
| [48] | Healthy (91) | 54.1 ± 8.5 | Not mentioned | 38.5 | Photoplethysmographic finger probe (PulseTrace 2000, Micro Medical) | Multiple linear regression analyses | r2 = −0.06, p = 0.02 | not measured | not measured |
© 2020 by the authors. Licensee MDPI, Basel, Switzerland. This article is an open access article distributed under the terms and conditions of the Creative Commons Attribution (CC BY) license (http://creativecommons.org/licenses/by/4.0/).
Share and Cite
Md Lazin Md Lazim, M.R.; Aminuddin, A.; Chellappan, K.; Ugusman, A.; Hamid, A.A.; Wan Ahmad, W.A.N.; Mohamad, M.S.F. Is Heart Rate a Confounding Factor for Photoplethysmography Markers? A Systematic Review. Int. J. Environ. Res. Public Health 2020, 17, 2591. https://0-doi-org.brum.beds.ac.uk/10.3390/ijerph17072591
Md Lazin Md Lazim MR, Aminuddin A, Chellappan K, Ugusman A, Hamid AA, Wan Ahmad WAN, Mohamad MSF. Is Heart Rate a Confounding Factor for Photoplethysmography Markers? A Systematic Review. International Journal of Environmental Research and Public Health. 2020; 17(7):2591. https://0-doi-org.brum.beds.ac.uk/10.3390/ijerph17072591
Chicago/Turabian StyleMd Lazin Md Lazim, Md Rizman, Amilia Aminuddin, Kalaivani Chellappan, Azizah Ugusman, Adila A Hamid, Wan Amir Nizam Wan Ahmad, and Mohd Shawal Faizal Mohamad. 2020. "Is Heart Rate a Confounding Factor for Photoplethysmography Markers? A Systematic Review" International Journal of Environmental Research and Public Health 17, no. 7: 2591. https://0-doi-org.brum.beds.ac.uk/10.3390/ijerph17072591