Neurocognitive Inhibitory Control Ability Performance and Correlations with Biochemical Markers in Obese Women


Abstract
:1. Introduction
2. Materials and Methods
2.1. Ethical Approval
2.2. Participants
2.3. Experimental Procedure
2.4. Cognitive Task
2.4.1. Go/Nogo Task
2.4.2. Stroop Task
2.5. Whole and Regional Body Composition
2.6. ERP Recording and Analysis
2.7. Blood Sampling and Analysis
2.8. Data Processing and Statistical Analyses
3. Results
3.1. Demographic Data
3.2. Behavioral Performance
3.2.1. Go/Nogo Task
- Accuracy rate (AR)
- Reaction time (RT)
3.2.2. Stroop Task
- Accuracy Rate (AR)
- Reaction time (RT)
3.3. Electrophysiological Performance
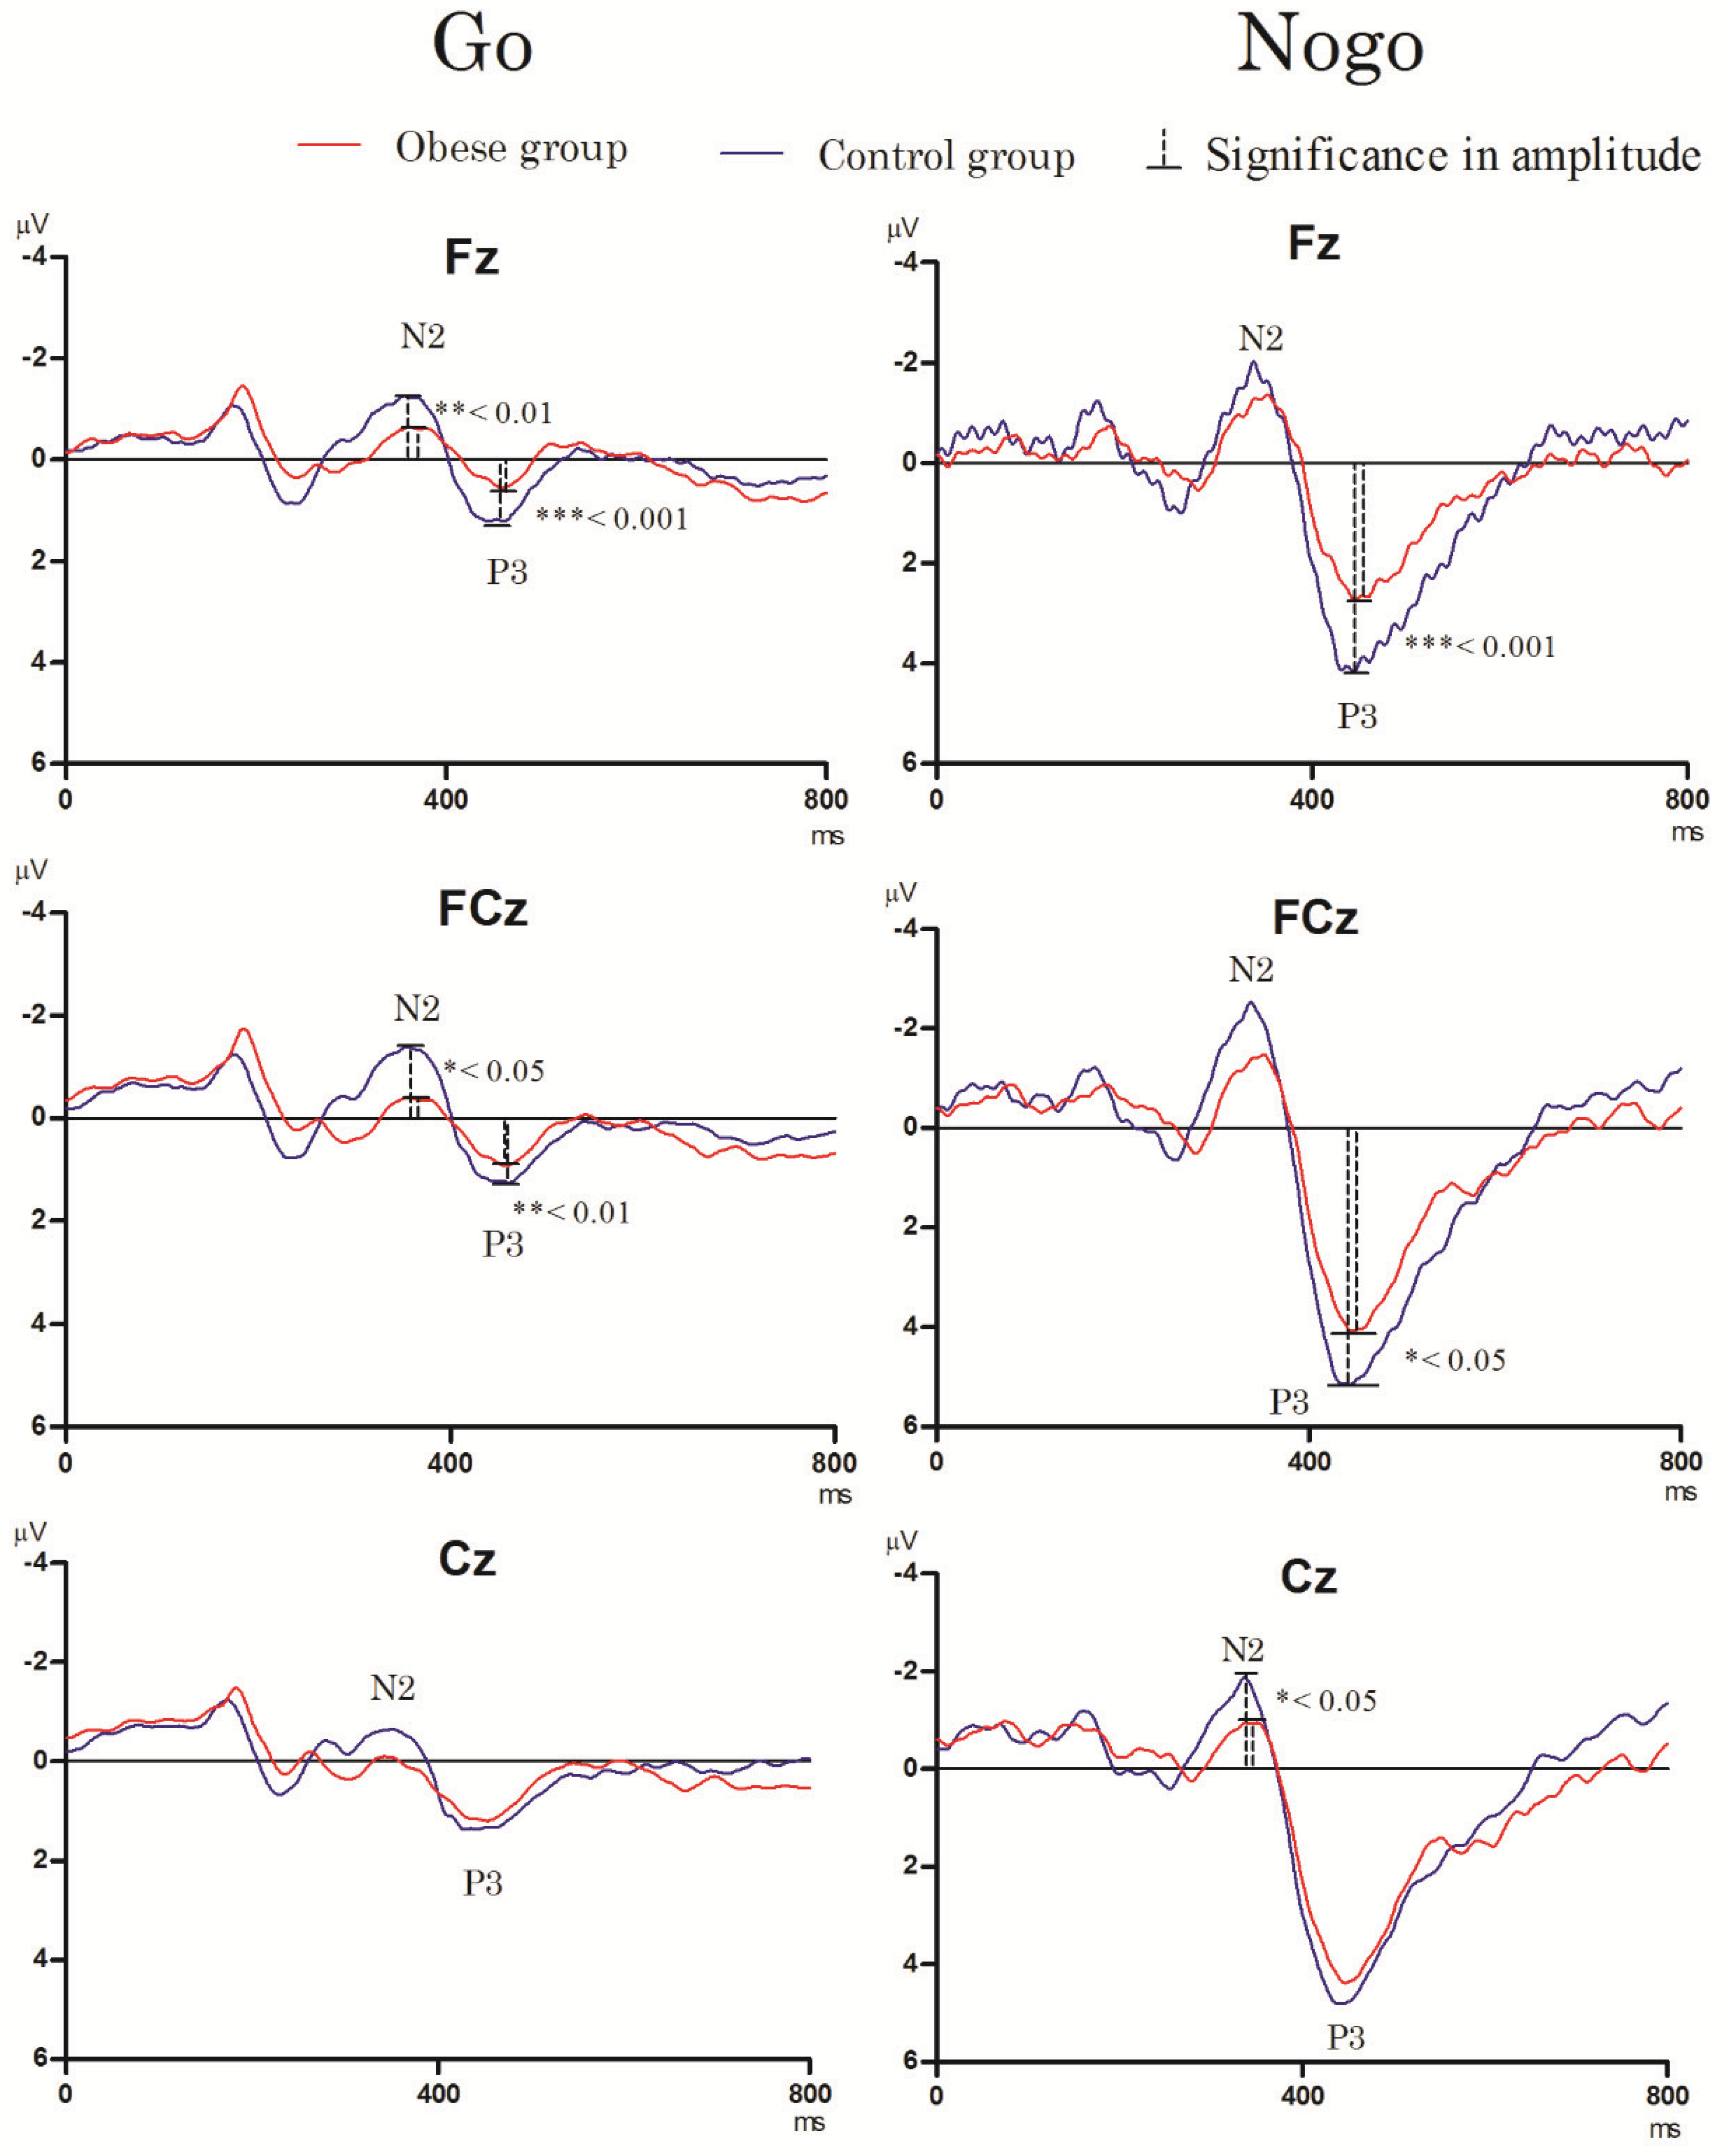
3.3.1. Go/Nogo Task
- N2 component
- P3 component
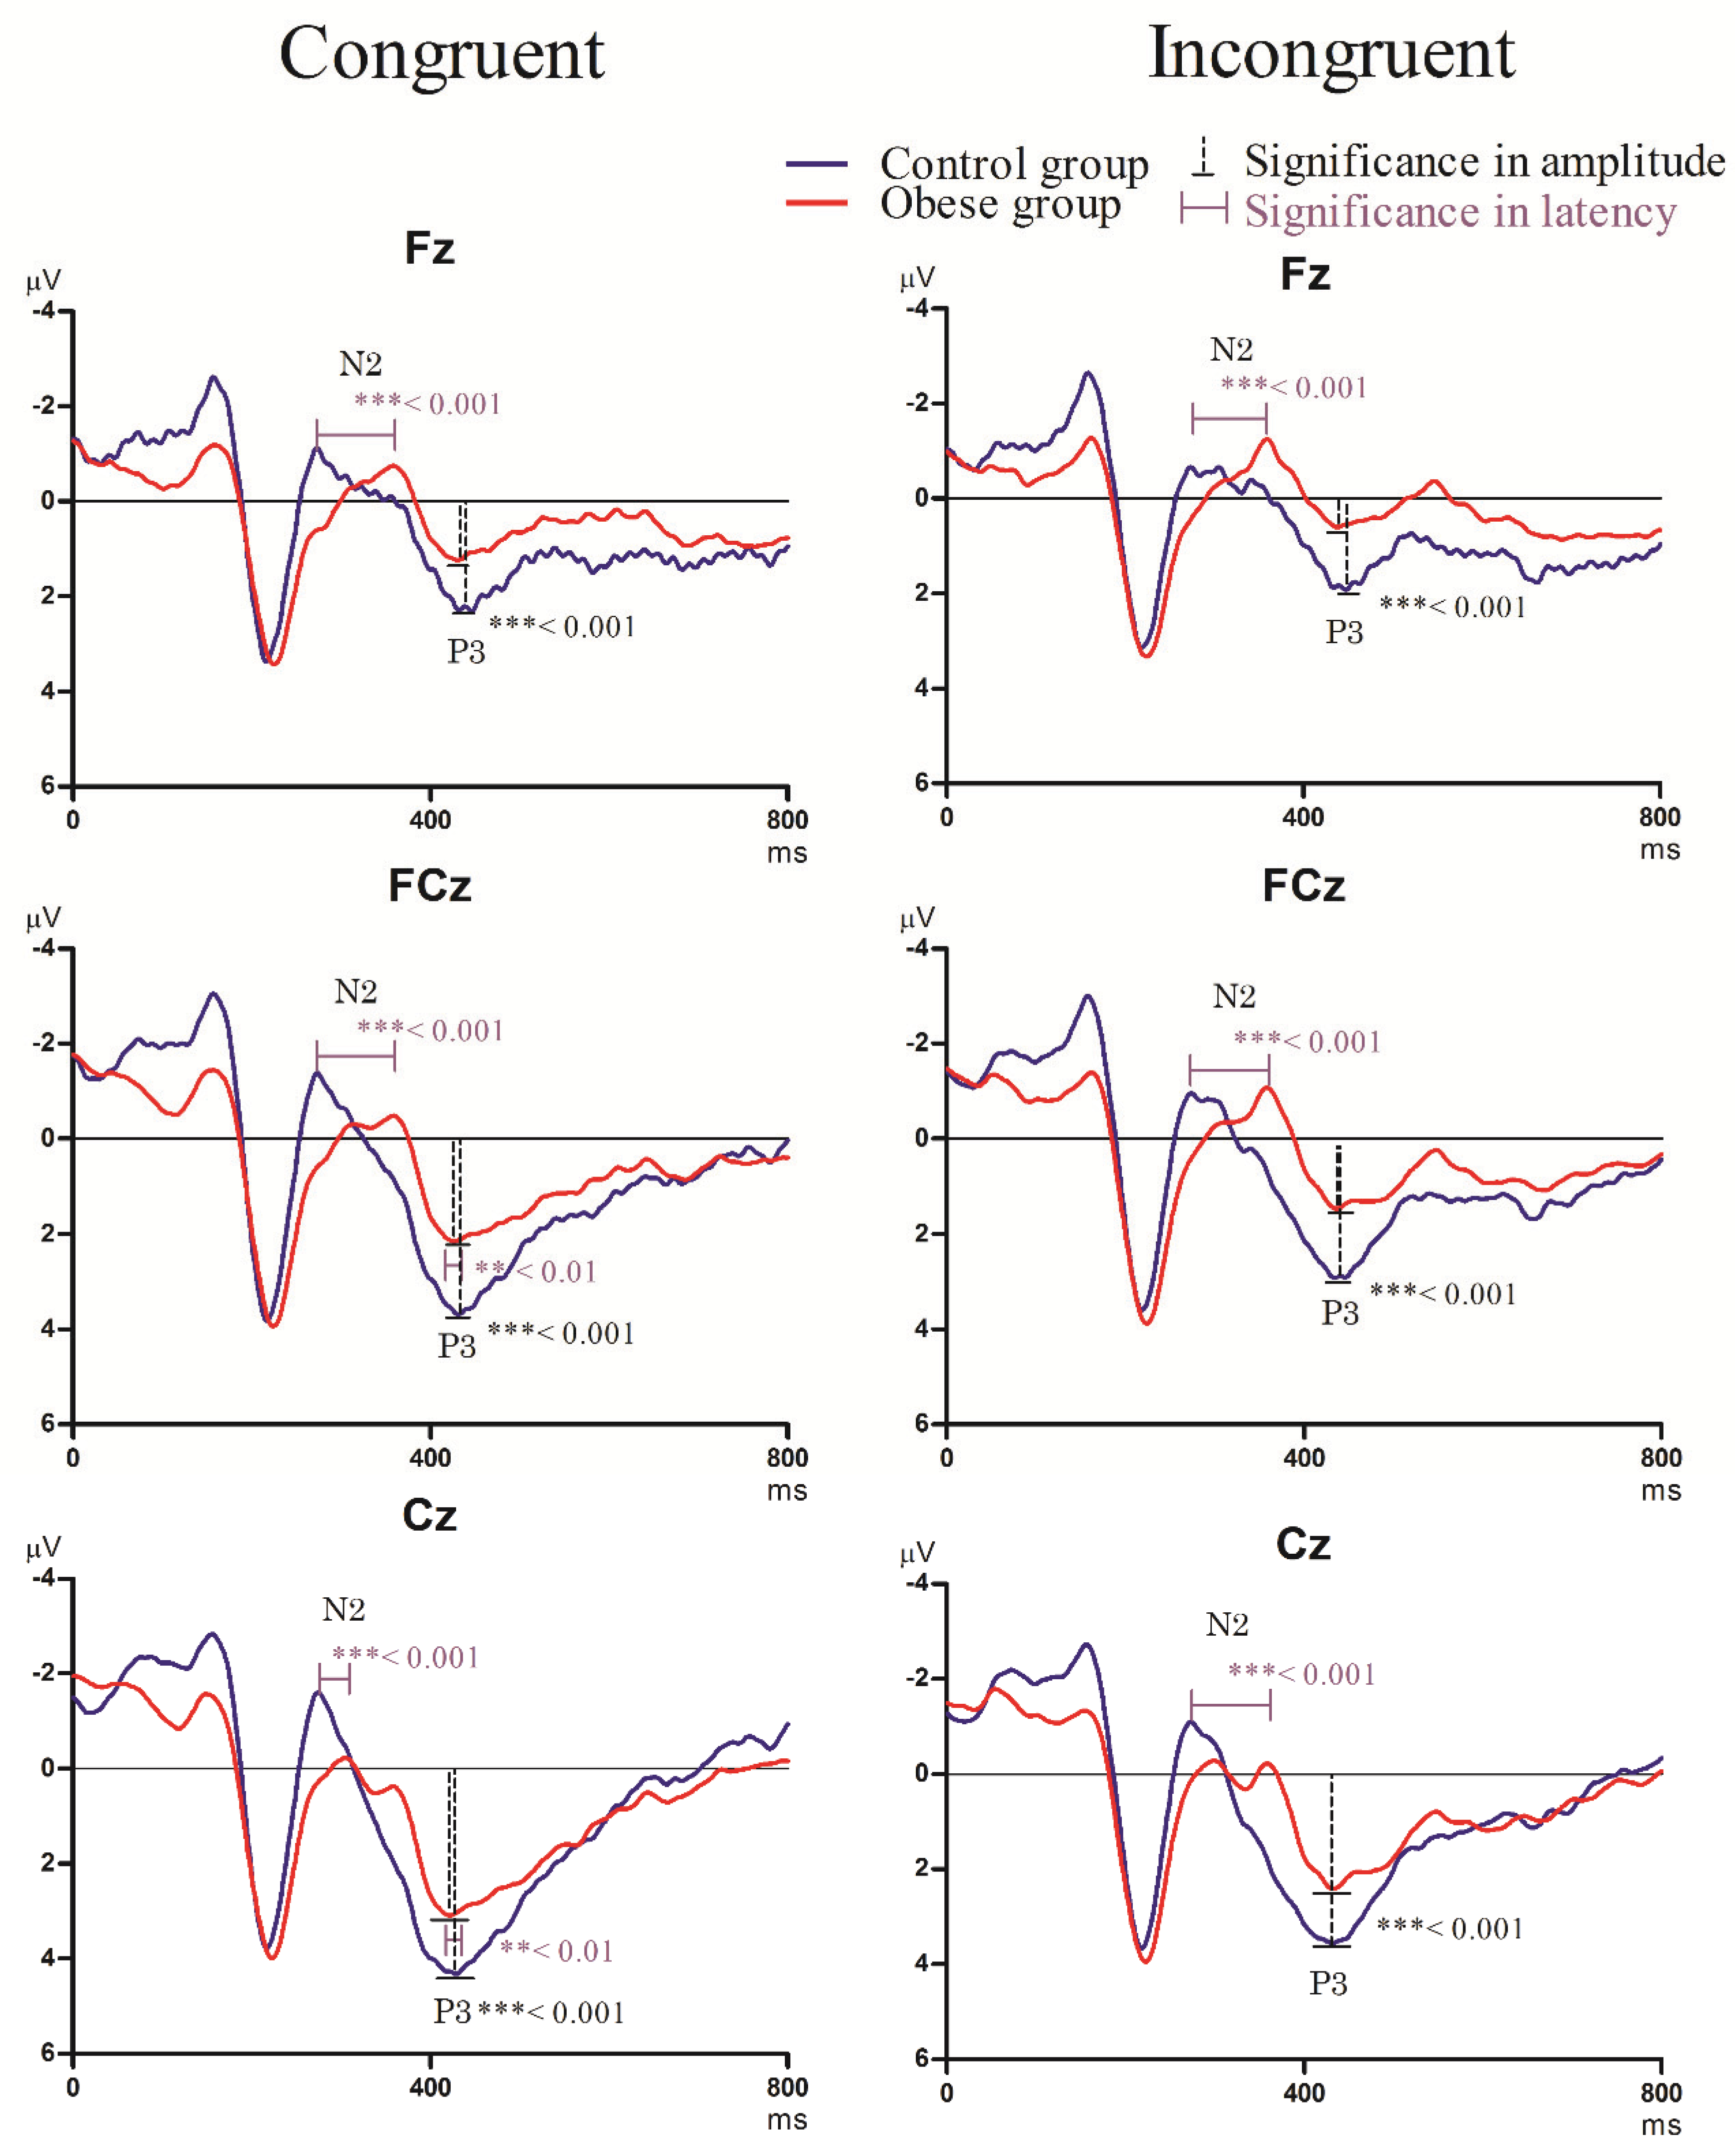
3.3.2. Stroop Task
- N2 component
- P3 component
3.4. Biochemical Indices
3.5. Correlations
3.5.1. Go/Nogo Task
3.5.2. Stroop Task
4. Discussion
4.1. Neurocognitive Performance
4.2. Molecular Biomarkers and Correlations with Neurocognitive Performance
4.3. Limitations
5. Conclusions
Supplementary Materials
Author Contributions
Funding
Acknowledgments
Conflicts of Interest
References
- Carnell, S.; Gibson, C.; Benson, L.; Ochner, C.N.; Geliebter, A. Neuroimaging and obesity: Current knowledge and future directions. Obes. Rev. 2012, 13, 43–56. [Google Scholar] [CrossRef] [PubMed]
- Berthoud, H.R. Metabolic and hedonic drives in the neural control of appetite: Who is the boss? Curr. Opin. Neurobiol. 2011, 21, 888–896. [Google Scholar] [CrossRef] [Green Version]
- He, Q.; Xiao, L.; Xue, G.; Wong, S.; Ames, S.L.; Schembre, S.M.; Bechara, A. Poor ability to resist tempting calorie rich food is linked to altered balance between neural systems involved in urge and self-control. Nutr. J. 2014, 13, 92. [Google Scholar] [CrossRef] [PubMed] [Green Version]
- Yang, Y.; Shields, G.S.; Guo, C.; Liu, Y. Executive function performance in obesity and overweight individuals: A meta-analysis and review. Neurosci. Biobehav. Rev. 2018, 84, 225–244. [Google Scholar] [CrossRef]
- Nigg, J.T. On inhibition/disinhibition in developmental psychopathology: Views from cognitive and personality psychology and a working inhibition taxonomy. Psychol. Bull. 2000, 126, 220–246. [Google Scholar] [CrossRef] [PubMed]
- Moffitt, T.E.; Arseneault, L.; Belsky, D.; Dickson, N.; Hancox, R.J.; Harrington, H.; Houts, R.; Poulton, R.; Roberts, B.W.; Ross, S.; et al. A gradient of childhood self-control predicts health, wealth, and public safety. Proc. Natl. Acad. Sci. USA 2011, 108, 2693–2698. [Google Scholar] [CrossRef] [PubMed] [Green Version]
- Smith, J.L.; Johnstone, S.J.; Barry, R.J. Movement-related potentials in the Go/NoGo task: The P3 reflects both cognitive and motor inhibition. Clin. Neurophysiol. 2008, 119, 704–714. [Google Scholar] [CrossRef] [PubMed]
- Hofmann, W.; Friese, M.; Roefs, A. Three ways to resist temptation: The independent contributions of executive attention, inhibitory control, and affect regulation to the impulse control of eating behavior. J. Exp. Soc. Psychol. 2009, 45, 431–435. [Google Scholar] [CrossRef] [Green Version]
- Hwang, K.; Velanova, K.; Luna, B. Strengthening of top-down frontal cognitive control networks underlying the development of inhibitory control: A functional magnetic resonance imaging effective connectivity study. J. Neurosci. 2010, 30, 15535–15545. [Google Scholar] [CrossRef] [Green Version]
- Appelhans, B.M. Neurobehavioral inhibition of reward-driven feeding: Implications for dieting and obesity. Obesity (Silver Spring) 2009, 17, 640–647. [Google Scholar] [CrossRef]
- Davis, C.; Levitan, R.D.; Smith, M.; Tweed, S.; Curtis, C. Associations among overeating, overweight, and attention deficit/hyperactivity disorder: A structural equation modelling approach. Eat. Behav. 2006, 7, 266–274. [Google Scholar] [CrossRef] [PubMed]
- Volkow, N.D.; Wang, G.J.; Telang, F.; Fowler, J.S.; Thanos, P.K.; Logan, J.; Alexoff, D.; Ding, Y.S.; Wong, C.; Ma, Y.; et al. Low dopamine striatal D2 receptors are associated with prefrontal metabolism in obese subjects: Possible contributing factors. Neuroimage 2008, 42, 1537–1543. [Google Scholar] [CrossRef] [PubMed] [Green Version]
- Garon, N.; Bryson, S.E.; Smith, I.M. Executive function in preschoolers: A review using an integrative framework. Psychol. Bull. 2008, 134, 31–60. [Google Scholar] [CrossRef] [PubMed] [Green Version]
- Rubia, K.; Smith, A.B.; Woolley, J.; Nosarti, C.; Heyman, I.; Taylor, E.; Brammer, M. Progressive increase of frontostriatal brain activation from childhood to adulthood during event-related tasks of cognitive control. Hum. Brain Mapp. 2006, 27, 973–993. [Google Scholar] [CrossRef] [PubMed]
- Chambers, C.D.; Bellgrove, M.A.; Gould, I.C.; English, T.; Garavan, H.; McNaught, E.; Kamke, M.; Mattingley, J.B. Dissociable mechanisms of cognitive control in prefrontal and premotor cortex. J. Neurophysiol. 2007, 98, 3638–3647. [Google Scholar] [CrossRef]
- Reyes, S.; Peirano, P.; Peigneux, P.; Lozoff, B.; Algarin, C. Inhibitory control in otherwise healthy overweight 10-year-old children. Int. J. Obes. (Lond.) 2015, 39, 1230–1235. [Google Scholar] [CrossRef] [Green Version]
- Bokura, H.; Yamaguchi, S.; Kobayashi, S. Electrophysiological correlates for response inhibition in a Go/NoGo task. Clin. Neurophysiol. 2001, 112, 2224–2232. [Google Scholar] [CrossRef]
- Falkenstein, M. Inhibition, conflict and the Nogo-N2. Clin. Neurophysiol. 2006, 117, 1638–1640. [Google Scholar] [CrossRef]
- Jonkman, L.M. The development of preparation, conflict monitoring and inhibition from early childhood to young adulthood: A Go/Nogo ERP study. Brain Res. 2006, 1097, 181–193. [Google Scholar] [CrossRef]
- Ridderinkhof, K.R.; Ullsperger, M.; Crone, E.A.; Nieuwenhuis, S. The role of the medial frontal cortex in cognitive control. Science 2004, 306, 443–447. [Google Scholar] [CrossRef]
- Watson, T.D.; Garvey, K.T. Neurocognitive correlates of processing food-related stimuli in a Go/No-go paradigm. Appetite 2013, 71, 40–47. [Google Scholar] [CrossRef] [PubMed]
- Bruin, K.J.; Wijers, A.A.; van Staveren, A.S. Response priming in a go/nogo task: Do we have to explain the go/nogo N2 effect in terms of response activation instead of inhibition? Clin. Neurophysiol. 2001, 112, 1660–1671. [Google Scholar] [CrossRef]
- Jonkman, L.M.; Lansbergen, M.; Stauder, J.E. Developmental differences in behavioral and event-related brain responses associated with response preparation and inhibition in a go/nogo task. Psychophysiology 2003, 40, 752–761. [Google Scholar] [CrossRef] [PubMed]
- Bauer, L.O.; Kaplan, R.F.; Hesselbrock, V.M. P300 and the stroop effect in overweight minority adolescents. Neuropsychobiology 2010, 61, 180–187. [Google Scholar] [CrossRef] [Green Version]
- Kamijo, K.; Pontifex, M.B.; Khan, N.A.; Raine, L.B.; Scudder, M.R.; Drollette, E.S.; Evans, E.M.; Castelli, D.M.; Hillman, C.H. The association of childhood obesity to neuroelectric indices of inhibition. Psychophysiology 2012, 49, 1361–1371. [Google Scholar] [CrossRef]
- Nijs, I.M.; Franken, I.H.; Muris, P. Food-related Stroop interference in obese and normal-weight individuals: Behavioral and electrophysiological indices. Eat. Behav. 2010, 11, 258–265. [Google Scholar] [CrossRef]
- Dixit, V.D. Adipose-immune interactions during obesity and caloric restriction: Reciprocal mechanisms regulating immunity and health span. J. Leukoc. Biol. 2008, 84, 882–892. [Google Scholar] [CrossRef]
- Rosenbaum, M.; Leibel, R.L. 20 years of leptin: Role of leptin in energy homeostasis in humans. J. Endocrinol. 2014, 223, T83–T96. [Google Scholar] [CrossRef]
- Johnston, J.M.; Hu, W.T.; Fardo, D.W.; Greco, S.J.; Perry, G.; Montine, T.J.; Trojanowski, J.Q.; Shaw, L.M.; Ashford, J.W.; Tezapsidis, N. Low plasma leptin in cognitively impaired ADNI subjects: Gender differences and diagnostic and therapeutic potential. Curr. Alzheimer Res. 2014, 11, 165–174. [Google Scholar] [CrossRef] [Green Version]
- Gustafson, D.R.; Mielke, M.M.; Keating, S.A.; Holman, S.; Minkoff, H.; Crystal, H.A. Leptin, adiponectin and cognition in middle-aged HIV-infected and uninfected women. The Brooklyn women’s interagency HIV study. J. Gerontol. Geriatr. Res. 2015, 4, 240. [Google Scholar] [CrossRef] [Green Version]
- Tsai, C.L.; Huang, T.H.; Tsai, M.C. Neurocognitive performances of visuospatial attention and the correlations with metabolic and inflammatory biomarkers in adults with obesity. Exp. Physiol. 2017, 102, 1683–1699. [Google Scholar] [CrossRef] [PubMed] [Green Version]
- Turer, A.T.; Khera, A.; Ayers, C.R.; Turer, C.B.; Grundy, S.M.; Vega, G.L.; Scherer, P.E. Adipose tissue mass and location affect circulating adiponectin levels. Diabetologia 2011, 54, 2515–2524. [Google Scholar] [CrossRef] [PubMed] [Green Version]
- Varady, K.A.; Tussing, L.; Bhutani, S.; Braunschweig, C.L. Degree of weight loss required to improve adipokine concentrations and decrease fat cell size in severely obese women. Metabolism 2009, 58, 1096–1101. [Google Scholar] [CrossRef] [PubMed]
- Wennberg, A.M.; Gustafson, D.; Hagen, C.E.; Roberts, R.O.; Knopman, D.; Jack, C.; Petersen, R.C.; Mielke, M.M. Serum adiponectin levels, neuroimaging, and cognition in the mayo clinic study of aging. J. Alzheimers Dis. 2016, 53, 573–581. [Google Scholar] [CrossRef] [Green Version]
- Fruhbeck, G.; Catalan, V.; Rodriguez, A.; Ramirez, B.; Becerril, S.; Salvador, J.; Colina, I.; Gomez-Ambrosi, J. Adiponectin-leptin ratio is a functional biomarker of adipose tissue inflammation. Nutrients 2019, 11, 454. [Google Scholar] [CrossRef] [Green Version]
- Tsai, C.L.; Chen, F.C.; Pan, C.Y.; Tseng, Y.T. The neurocognitive performance of visuospatial attention in children with obesity. Front. Psychol. 2016, 7, 1033. [Google Scholar] [CrossRef] [Green Version]
- Nigg, J.T. Annual research review: On the relations among self-regulation, self-control, executive functioning, effortful control, cognitive control, impulsivity, risk-taking, and inhibition for developmental psychopathology. J. Child Psychol. Psychiatry 2017, 58, 361–383. [Google Scholar] [CrossRef]
- Wen, C.P.; David Cheng, T.Y.; Tsai, S.P.; Chan, H.T.; Hsu, H.L.; Hsu, C.C.; Eriksen, M.P. Are Asians at greater mortality risks for being overweight than Caucasians? Redefining obesity for Asians. Public Health Nutr. 2009, 12, 497–506. [Google Scholar] [CrossRef] [Green Version]
- World Health Organization. The Asia-Pacific Perspective: Redefining Obesity and Its Treatment; Health Communications Australia: Sydney, Australia, 2000. [Google Scholar]
- Cohen, J.E. Statistical Power Analysis for the Behavioral Sciences; Lawrence Erlbaum Associates: Hillsdale, NJ, USA, 1988. [Google Scholar]
- Chapman, L.J.; Chapman, J.P. The measurement of handedness. Brain Cogn. 1987, 6, 175–183. [Google Scholar] [CrossRef]
- Beck, A.T.; Steer, R.A.; Brown, G.K. BDI-II: 2nd Edition Manual; The Psychological Corporation: San Antonio, TX, USA, 1996. [Google Scholar]
- Folstein, M.F.; Folstein, S.E.; McHugh, P.R. “Mini-mental state”. A practical method for grading the cognitive state of patients for the clinician. J. Psychiatr. Res. 1975, 12, 189–198. [Google Scholar] [CrossRef]
- Littel, M.; van den Berg, I.; Luijten, M.; van Rooij, A.J.; Keemink, L.; Franken, I.H. Error processing and response inhibition in excessive computer game players: An event-related potential study. Addict. Biol. 2012, 17, 934–947. [Google Scholar] [CrossRef]
- Brink, J.M.; McDowd, J.M. Aging and selective attention: An issue of complexity or multiple mechanisms? J. Gerontol. B Psychol. Sci. Soc. Sci. 1999, 54, P30–P33. [Google Scholar] [CrossRef] [PubMed] [Green Version]
- Gajewski, P.D.; Falkenstein, M. Long-term habitual physical activity is associated with lower distractibility in a Stroop interference task in aging: Behavioral and ERP evidence. Brain Cogn. 2015, 98, 87–101. [Google Scholar] [CrossRef] [PubMed]
- MacLeod, C.M. Half a century of research on the Stroop effect: An integrative review. Psychol. Bull. 1991, 109, 163–203. [Google Scholar] [CrossRef] [PubMed]
- Stroop, J.R. Studies of interference in serial verbal reactions. J. Exp. Psychol. 1935, 18, 643–662. [Google Scholar] [CrossRef]
- Qiu, C.; Winblad, B.; Fratiglioni, L. The age-dependent relation of blood pressure to cognitive function and dementia. Lancet Neurol. 2005, 4, 487–499. [Google Scholar] [CrossRef]
- Velanova, K.; Wheeler, M.E.; Luna, B. Maturational changes in anterior cingulate and frontoparietal recruitment support the development of error processing and inhibitory control. Cereb. Cortex 2008, 18, 2505–2522. [Google Scholar] [CrossRef] [Green Version]
- Polli, F.E.; Barton, J.J.; Cain, M.S.; Thakkar, K.N.; Rauch, S.L.; Manoach, D.S. Rostral and dorsal anterior cingulate cortex make dissociable contributions during antisaccade error commission. Proc. Natl. Acad. Sci. USA 2005, 102, 15700–15705. [Google Scholar] [CrossRef] [Green Version]
- Durston, S.; Thomas, K.M.; Worden, M.S.; Yang, Y.; Casey, B.J. The effect of preceding context on inhibition: An event-related fMRI study. Neuroimage 2002, 16, 449–453. [Google Scholar] [CrossRef] [PubMed] [Green Version]
- Padmanabhan, A.; Geier, C.F.; Ordaz, S.J.; Teslovich, T.; Luna, B. Developmental changes in brain function underlying the influence of reward processing on inhibitory control. Dev. Cogn. Neurosci. 2011, 1, 517–529. [Google Scholar] [CrossRef] [Green Version]
- Chen, S.; Jia, Y.; Woltering, S. Neural differences of inhibitory control between adolescents with obesity and their peers. Int. J. Obes. (Lond.) 2018, 42, 1753–1761. [Google Scholar] [CrossRef] [PubMed]
- Huttenlocher, P.R.; Dabholkar, A.S. Regional differences in synaptogenesis in human cerebral cortex. J. Comp. Neurol. 1997, 387, 167–178. [Google Scholar] [CrossRef]
- Pardo, J.V.; Pardo, P.J.; Janer, K.W.; Raichle, M.E. The anterior cingulate cortex mediates processing selection in the Stroop attentional conflict paradigm. Proc. Natl. Acad. Sci. USA 1990, 87, 256–259. [Google Scholar] [CrossRef] [PubMed] [Green Version]
- Pfefferbaum, A.; Mathalon, D.H.; Sullivan, E.V.; Rawles, J.M.; Zipursky, R.B.; Lim, K.O. A quantitative magnetic resonance imaging study of changes in brain morphology from infancy to late adulthood. Arch. Neurol. 1994, 51, 874–887. [Google Scholar] [CrossRef] [PubMed]
- Bekker, E.M.; Kenemans, J.L.; Verbaten, M.N. Source analysis of the N2 in a cued Go/NoGo task. Brain Res. Cogn. Brain Res. 2005, 22, 221–231. [Google Scholar] [CrossRef] [PubMed]
- Lowe, C.J.; Reichelt, A.C.; Hall, P.A. The prefrontal cortex and obesity: A health neuroscience perspective. Trends Cogn. Sci. 2019, 23, 349–361. [Google Scholar] [CrossRef] [PubMed] [Green Version]
- Band, G.P.; van Boxtel, G.J. Inhibitory motor control in stop paradigms: Review and reinterpretation of neural mechanisms. Acta Psychol. (Amst.) 1999, 101, 179–211. [Google Scholar] [CrossRef]
- Tascilar, M.E.; Turkkahraman, D.; Oz, O.; Yucel, M.; Taskesen, M.; Eker, I.; Abaci, A.; Dundaroz, R.; Ulas, U.H. P300 auditory event-related potentials in children with obesity: Is childhood obesity related to impairment in cognitive functions? Pediatr. Diabetes 2011, 12, 589–595. [Google Scholar] [CrossRef]
- Dimoska, A.; Johnstone, S.J.; Barry, R.J. The auditory-evoked N2 and P3 components in the stop-signal task: Indices of inhibition, response-conflict or error-detection? Brain Cogn. 2006, 62, 98–112. [Google Scholar] [CrossRef]
- Kok, A.; Ramautar, J.R.; De Ruiter, M.B.; Band, G.P.; Ridderinkhof, K.R. ERP components associated with successful and unsuccessful stopping in a stop-signal task. Psychophysiology 2004, 41, 9–20. [Google Scholar] [CrossRef]
- Berthoud, H.R.; Morrison, C. The brain, appetite, and obesity. Ann. Rev. Psychol. 2008, 59, 55–92. [Google Scholar] [CrossRef] [PubMed]
- Gleeson, M.; Bishop, N.C.; Stensel, D.J.; Lindley, M.R.; Mastana, S.S.; Nimmo, M.A. The anti-inflammatory effects of exercise: Mechanisms and implications for the prevention and treatment of disease. Nat. Rev. Immunol. 2011, 11, 607–615. [Google Scholar] [CrossRef] [PubMed]
- Ouchi, N.; Parker, J.L.; Lugus, J.J.; Walsh, K. Adipokines in inflammation and metabolic disease. Nat. Rev. Immunol. 2011, 11, 85–97. [Google Scholar] [CrossRef] [PubMed]
- Bluher, S.; Mantzoros, C.S. Leptin in humans: Lessons from translational research. Am. J. Clin. Nutr. 2009, 89, 991s–997s. [Google Scholar] [CrossRef] [Green Version]
- Harvey, J.; Shanley, L.J.; O’Malley, D.; Irving, A.J. Leptin: A potential cognitive enhancer? Biochem. Soc. Trans. 2005, 33 Pt 5, 1029–1032. [Google Scholar] [CrossRef] [Green Version]
- Cholerton, B.; Baker, L.D.; Craft, S. Insulin resistance and pathological brain ageing. Diabet. Med. 2011, 28, 1463–1475. [Google Scholar] [CrossRef] [PubMed]
- Erbayat-Altay, E.; Yamada, K.A.; Wong, M.; Thio, L.L. Increased severity of pentylenetetrazol induced seizures in leptin deficient ob/ob mice. Neurosci. Lett. 2008, 433, 82–86. [Google Scholar] [CrossRef]
- Zeki Al Hazzouri, A.; Stone, K.L.; Haan, M.N.; Yaffe, K. Leptin, mild cognitive impairment, and dementia among elderly women. J. Gerontol. A Biol. Sci. Med. Sci. 2013, 68, 175–180. [Google Scholar] [CrossRef]
- Gustafson, D.R.; Backman, K.; Lissner, L.; Carlsson, L.; Waern, M.; Ostling, S.; Guo, X.; Bengtsson, C.; Skoog, I. Leptin and dementia over 32 years-the prospective population study of women. Alzheimers Dement. 2012, 8, 272–277. [Google Scholar] [CrossRef]
- Oania, R.; McEvoy, L.K. Plasma leptin levels are not predictive of dementia in patients with mild cognitive impairment. Age Ageing 2015, 44, 53–58. [Google Scholar] [CrossRef] [Green Version]
- Warren, M.W.; Hynan, L.S.; Weiner, M.F. Leptin and cognition. Dement. Geriatr. Cogn. Disord. 2012, 33, 410–415. [Google Scholar] [CrossRef] [PubMed]
- Forny-Germano, L.; De Felice, F.G.; Vieira, M. The role of leptin and adiponectin in obesity-associated cognitive decline and Alzheimer’s disease. Front. Neurosci. 2018, 12, 1027. [Google Scholar] [CrossRef] [PubMed] [Green Version]
- Yamauchi, T.; Kamon, J.; Waki, H.; Terauchi, Y.; Kubota, N.; Hara, K.; Mori, Y.; Ide, T.; Murakami, K.; Tsuboyama-Kasaoka, N.; et al. The fat-derived hormone adiponectin reverses insulin resistance associated with both lipoatrophy and obesity. Nat. Med. 2001, 7, 941–946. [Google Scholar] [CrossRef] [PubMed]
- Fruhbeck, G.; Catalan, V.; Rodriguez, A.; Gomez-Ambrosi, J. Adiponectin-leptin ratio: A promising index to estimate adipose tissue dysfunction. Relation with obesity-associated cardiometabolic risk. Adipocyte 2018, 7, 57–62. [Google Scholar] [CrossRef]
- Biessels, G.J.; Reagan, L.P. Hippocampal insulin resistance and cognitive dysfunction. Nat. Rev. Neurosci. 2015, 16, 660–671. [Google Scholar] [CrossRef]
- Greenwood, C.E.; Winocur, G. High-fat diets, insulin resistance and declining cognitive function. Neurobiol. Aging 2005, 26 (Suppl. S1), 42–45. [Google Scholar] [CrossRef]
- Stranahan, A.M.; Norman, E.D.; Lee, K.; Cutler, R.G.; Telljohann, R.S.; Egan, J.M.; Mattson, M.P. Diet-induced insulin resistance impairs hippocampal synaptic plasticity and cognition in middle-aged rats. Hippocampus 2008, 18, 1085–1088. [Google Scholar] [CrossRef] [Green Version]
- Elias, M.F.; Elias, P.K.; Sullivan, L.M.; Wolf, P.A.; D’Agostino, R.B. Lower cognitive function in the presence of obesity and hypertension: The Framingham heart study. Int. J. Obes. Relat. Metab. Disord. 2003, 27, 260–268. [Google Scholar] [CrossRef] [Green Version]
- Hunma, S.; Ramuth, H.; Miles-Chan, J.L.; Schutz, Y.; Montani, J.P.; Joonas, N.; Dulloo, A.G. Do gender and ethnic differences in fasting leptin in Indians and Creoles of Mauritius persist beyond differences in adiposity? Int. J. Obes. (Lond.) 2018, 42, 280–283. [Google Scholar] [CrossRef]
- Thorand, B.; Baumert, J.; Döring, A.; Herder, C.; Kolb, H.; Rathmann, W.; Giani, G.; Koenig, W. Sex differences in the relation of body composition to markers of inflammation. Atherosclerosis 2006, 184, 216–224. [Google Scholar] [CrossRef]
- Thorand, B.; Baumert, J.; Kolb, H.; Meisinger, C.; Chambless, L.; Koenig, W.; Herder, C. Sex differences in the prediction of type 2 diabetes by inflammatory markers: results from the MONICA/KORA Augsburg case-cohort study, 1984–2002. Diabetes Care 2007, 30, 854–860. [Google Scholar] [CrossRef] [PubMed] [Green Version]
- Christen, T.; Trompet, S.; Noordam, R.; van Klinken, J.B.; van Dijk, K.W.; Lamb, H.J.; Cobbaert, C.M.; den Heijer, M.; Jazet, I.M.; Jukema, J.W.; et al. Sex differences in body fat distribution are related to sex differences in serum leptin and adiponectin. Peptides 2018, 107, 25–31. [Google Scholar] [CrossRef] [PubMed] [Green Version]
- Selthofer-Relatic, K.; Radic, R.; Stupin, A.; Sisljagic, V.; Bosnjak, I.; Bulj, N.; Selthofer, R.; Delic Brkljacic, D. Leptin/adiponectin ratio in overweight patients—Gender differences. Diabetes Vasc. Dis. Res. 2018, 15, 260–262. [Google Scholar]
- Medic, N.; Kochunov, P.; Ziauddeen, H.; Ersche, K.D.; Nathan, P.J.; Ronan, L.; Fletcher, P.C. BMI-related cortical morphometry changes are associated with altered white matter structure. Int. J. Obes. (Lond.) 2019, 43, 523–532. [Google Scholar] [CrossRef] [PubMed] [Green Version]
- Medic, N.; Ziauddeen, H.; Ersche, K.D.; Farooqi, I.S.; Bullmore, E.T.; Nathan, P.J.; Ronan, L.; Fletcher, P.C. Increased body mass index is associated with specific regional alterations in brain structure. Int. J. Obes. (Lond.) 2016, 40, 1177–1182. [Google Scholar] [CrossRef] [PubMed] [Green Version]
- Sharkey, R.J.; Karama, S.; Dagher, A. Overweight is not associated with cortical thickness alterations in children. Front. Neurosci. 2015, 9, 24. [Google Scholar] [CrossRef] [Green Version]
- Lange, J.J.; Wijers, A.A.; Mulder, L.J.; Mulder, G. Color selection and location selection in ERPs: Differences, similarities and neural specificity. Biol. Psychol. 1998, 48, 153–182. [Google Scholar] [CrossRef]
- Nakajima, Y.; Miyamoto, K.; Kikuchi, M. Estimation of neural generators of cognitive potential P300 by dipole tracing method. No To Shinkei 1994, 46, 1059–1065. [Google Scholar]
- Knight, R.T. Neural mechanisms of event-related potentials: Evidence from human lesion studies. In Event-Related Brain Potentials: Basic Issues and Applications; Oxford University Press: New York, NY, USA, 1990; pp. 3–18. [Google Scholar]
- Tsai, C.L.; Pan, C.Y.; Chen, F.C.; Huang, T.H.; Tsai, M.C.; Chuang, C.Y. Differences in neurocognitive performance and metabolic and inflammatory indices in male adults with obesity as a function of regular exercise. Exp. Physiol. 2019, 104, 1650–1660. [Google Scholar] [CrossRef]


| Characteristics | Control Group (n = 26) | Obese Group (n = 26) | t | p Value |
|---|---|---|---|---|
| Age (years) | 34.04 ± 5.66 | 34.44 ± 5.77 | −0.25 | 0.802 |
| Height (cm) | 161.06 ± 6.31 | 160.32 ± 5.39 | 0.45 | 0.653 |
| Weight (kg) * | 58.89 ± 4.49 | 75.80 ± 11.43 | −7.00 | <0.001 |
| BMI (kg/m2) * | 22.70 ± 1.13 | 29.41 ± 3.52 | −9.24 | <0.001 |
| SBP (mmHg) * | 106.46 ± 14.26 | 115.60 ± 12.46 | −2.43 | 0.019 |
| DBP (mmHg) * | 68.00 ± 9.43 | 76.56 ± 9.11 | −3.30 | 0.002 |
| Resting HR (bpm) | 72.23 ± 7.64 | 75.52 ± 7.01 | −1.60 | 0.116 |
| Education (years) | 16.38 ± 0.80 | 16.00 ± 1.41 | 1.20 | 0.236 |
| BDI-II | 11.08 ± 9.91 | 11.00 ± 8.46 | −0.74 | 0.460 |
| MMSE | 29.77 ± 0.43 | 29.92 ± 0.27 | −1.54 | 0.135 |
| PA energy expenditure (kcal/day) | 66.05 ± 11.97 | 64.42 ± 10.96 | 0.50 | 0.619 |
| Dietary (kcal/day) | 2023.1 ± 689.5 | 1882.26 ± 520.18 | 0.80 | 0.429 |
| Circumference | ||||
| Waist (cm) * | 75.55 ± 3.96 | 88.68 ± 9.91 | −6.26 | <0.001 |
| Abdominal (cm) * | 84.09 ± 6.12 | 96.90 ± 10.26 | −5.44 | <0.001 |
| Hip (cm) * | 98.99 ± 4.42 | 110.64 ± 7.02 | −7.12 | <0.001 |
| Percentage fat | ||||
| Whole body (%) * | 34.25 ± 3.89 | 39.30 ± 4.44 | −4.33 | <0.001 |
| Upper limbs (%) * | 13.53 ± 1.52 | 14.99 ± 1.66 | −3.28 | 0.002 |
| Trunk (%) | 44.44 ± 4.71 | 46.34 ± 5.60 | −1.32 | 0.194 |
| Lower limb (%) | 37.5 ± 5.79 | 35.46 ± 6.14 | 1.43 | 0.159 |
| Characteristics | Control Group (n = 26) | Obese Group (n = 26) |
|---|---|---|
| Go/Nogo task | ||
| AR Go (%) | 99.92 ± 0.23 | 99.90 ± 0.20 |
| AR Nogo (%) | 98.27 ± 2.53 | 98.40 ± 2.69 |
| RT Go (ms) | 479.44 ± 75.42 | 496.62 ± 72.41 |
| Stroop task | ||
| AR congruent (%) | 98.88 ± 1.66 | 99.12 ± 0.93 |
| AR incongruent (%) | 97.54 ± 3.08 | 97.04 ± 2.70 |
| RT congruent (ms) | 526.39 ± 64.45 | 521.20 ± 48.71 |
| RT incongruent (ms) | 569.94 ± 97.87 | 568.62 ± 81.21 |
© 2020 by the authors. Licensee MDPI, Basel, Switzerland. This article is an open access article distributed under the terms and conditions of the Creative Commons Attribution (CC BY) license (http://creativecommons.org/licenses/by/4.0/).
Share and Cite
Wen, H.-J.; Tsai, C.-L. Neurocognitive Inhibitory Control Ability Performance and Correlations with Biochemical Markers in Obese Women. Int. J. Environ. Res. Public Health 2020, 17, 2726. https://0-doi-org.brum.beds.ac.uk/10.3390/ijerph17082726
Wen H-J, Tsai C-L. Neurocognitive Inhibitory Control Ability Performance and Correlations with Biochemical Markers in Obese Women. International Journal of Environmental Research and Public Health. 2020; 17(8):2726. https://0-doi-org.brum.beds.ac.uk/10.3390/ijerph17082726
Chicago/Turabian StyleWen, Huei-Jhen, and Chia-Liang Tsai. 2020. "Neurocognitive Inhibitory Control Ability Performance and Correlations with Biochemical Markers in Obese Women" International Journal of Environmental Research and Public Health 17, no. 8: 2726. https://0-doi-org.brum.beds.ac.uk/10.3390/ijerph17082726