Article

Near-Road Traffic-Related Air Pollution: Resuspended PM2.5 from Highways and Arterials

by
Mohammad Hashem Askariyeh
1,*,
Madhusudhan Venugopal
2,
Haneen Khreis
3,
Andrew Birt
2 and
Josias Zietsman
3
1
Zachry Department of Civil and Environmental Engineering, College Station, TX 77843-3127, USA
2
Environment and Air Quality Division, Texas A&M Transportation Institute, College Station, TX 77843-3135, USA
3
Center for Advancing Research in Transportation Emissions, Energy, and Health (CARTEEH), Texas A&M Transportation Institute, College Station, TX 77843-3135, USA
*
Author to whom correspondence should be addressed.
Int. J. Environ. Res. Public Health 2020, 17(8), 2851; https://0-doi-org.brum.beds.ac.uk/10.3390/ijerph17082851
Submission received: 2 March 2020 / Revised: 15 April 2020 / Accepted: 17 April 2020 / Published: 21 April 2020

Abstract

:
Recent studies suggest that the transportation sector is a major contributor to fine particulate matter (PM2.5) in urban areas. A growing body of literature indicates PM2.5 exposure can lead to adverse health effects, and that PM2.5 concentrations are often elevated close to roadways. The transportation sector produces PM2.5 emissions from combustion, brake wear, tire wear, and resuspended dust. Traffic-related resuspended dust is particulate matter, previously deposited on the surface of roadways that becomes resuspended into the air by the movement of traffic. The objective of this study was to use regulatory guidelines to model the contribution of resuspended dust to near-road traffic-related PM2.5 concentrations. The U.S. Environmental Protection Agency (EPA) guidelines for quantitative hotspot analysis were used to predict traffic-related PM2.5 concentrations for a small network in Dallas, Texas. Results show that the inclusion of resuspended dust in the emission and dispersion modeling chain increases prediction of near-road PM2.5 concentrations by up to 74%. The results also suggest elevated PM2.5 concentrations near arterial roads. Our results are discussed in the context of human exposure to traffic-related air pollution.

1. Introduction

In recent years, there has been a focus on the adverse health effects of near-road long- and short-term exposure to traffic-related air pollutants [1,2,3,4,5,6]. Fine particulate matter (PM2.5) is a U.S. Environmental Protection Agency (EPA) regulated criteria air pollutant [7]. PM2.5 is emitted from different emission sources including the transportation sector, and studies have demonstrated elevated PM2.5 concentrations in near-road environments [8,9,10,11,12]. A growing body of literature shows associations between higher exposure to PM2.5, due to proximity of residential areas to major roadways and adverse health effects [13,14,15,16]. Approximately 11%–19% of the U.S. population live within a few hundred meters of major roads [15,17,18], which can affect more than 40 million people exposed to high levels of PM2.5 in the U.S. The global population exposed to elevated levels of PM2.5 is far greater. Hence, monitoring and modeling transportation-related PM2.5 emissions and their dispersion are important for understanding human exposure and health risks. For example, emission and dispersion modeling of PM2.5 is a requirement of regulatory quantitative analyses for federally supported new transportation projects in nonattainment and maintenance areas [19]. The PM2.5 emissions from the transportation sector result from tailpipe exhaust, brake wear, tire wear, and resuspended dust and are explained in the U.S. EPA-developed MOtor Vehicle Emission Simulator (MOVES) guidance and transportation conformity guidance for PM2.5 quantitative hotspot analysis [19,20]. The objective of this study was to use these regulatory guidelines to quantify the contribution of resuspended dust compared to other traffic-related PM2.5 concentrations from arterials and highways.
The tailpipe exhaust component of PM2.5 emissions has decreased considerably as different exhaust emission control measures have been deployed [21]. However, current non-exhaust emissions from road vehicles are unabated, making the contribution of resuspended road dust to traffic-related particulate matters even more significant [22,23]. An intensive mass and chemical measurement included study showed that the PM2.5 emission rate from resuspended dust is significant and can exceed the tailpipe contribution in Reno, Nevada [24]. Kundu et al. compared the composition of PM2.5 in rural and urban areas and concluded that unpaved roads can contribute to a significantly higher level of PM2.5 at five sampling sites in Iowa [25]. Amato et al. performed an extensive field measurement study and showed that a poor state of pavement can double the road dust loading [22]. While these studies showed the importance of including resuspended PM2.5 in air pollution studies, other studies did not conclude that resuspended dust is a significant source of PM2.5; rather, on-road emission sources were more significant [26].
In emission and dispersion modeling for regulatory purposes, a procedure including specific guidelines to estimate PM2.5 emissions from transportation and perform dispersion modeling should be followed [19]. In this procedure, the PM2.5 emissions from tailpipe exhaust, brake wear, tire wear, and resuspended dust emissions should also be modeled. The EPA’s MOVES2014a on-road model and current AP-42 paved road resuspended dust model are recommended to estimate PM2.5 emission rates (PM2.5 mass per time) as per the hotspot guidance [19,27,28]. While tailpipe exhaust (running, idling, and start), brake, and tire wear are estimated using EPA’s MOVES modeling tool [20], resuspended dust calculations utilize AP-42 factors which have gone through limited updates. MOVES is an emission model that uses a fine-scale modal-based approach to generate emission and energy consumption factors at different temporal geographical scales (national, county, and project) [20].
The emission factors obtained from the MOVES can be used with transportation activity to estimate total emissions from all roadway links. For project level emissions assessment, MOVES requires inputs from two broad categories: (a) site-specific traffic information, including traffic volumes, fleet composition, and vehicle activity at the roadway link level, and (b) local-specific inputs, including regional-level vehicle age distribution, meteorological variables, fuel characteristics, and parameters related to the inspection/maintenance (I/M) program. The modeled emission rates can then be used for dispersion modeling to consider the effect of meteorological variables and predict near-road PM2.5 concentrations. Air pollutant dispersion for regulatory purposes needs to be modeled using the American Meteorological Society/Environmental Protection Agency Regulatory Model (AERMOD) [19,29]. AERMOD is a Gaussian steady-state dispersion model that predicts the concentration of air pollutants emitted from characterized emission sources.
Many different studies conducted around the world have shown the effect of resuspended road dust on traffic-related PM2.5 emissions. However, the effect of using a network with and without road-dust on the dispersion models’ predictions of near-road PM2.5 concentrations is a less investigated area. In addition, the sensitivity of regulatory quantitative analysis to resuspended PM2.5 on highways and arterials has not been investigated. Previous studies have shown a nonlinear relationship between emission rates and near-road air pollutants concentrations over different time periods due to the effect of meteorological variables on dispersion mechanisms [30,31,32]. For instance, a constant emission rate yields different concentrations under different meteorological conditions over time [8]. However, the effects of a certain change in PM2.5 emissions due to the inclusion of resuspended road dust on near-road PM2.5 concentrations over different time periods have not been evaluated.
The objective of this study was to quantify the contribution of highways and arterials resuspended dust to the traffic-related PM2.5 emissions and near-road concentrations, following the U.S. EPA regulatory guidelines. As such, the increase in PM2.5 emission rates due to the inclusion of resuspended road dust in Fort Worth, Texas was investigated, following transportation conformity guidance for PM2.5 quantitative hotspot analysis. Additionally, the dispersion modeling was performed using a 2016 dataset of monitored meteorological variables to evaluate the sensitivity of predicted traffic-related PM2.5 concentrations in a near-road environment at different seasonal day time periods. This study quantifies the sensitivity of dispersion modeling to a significant increase in PM2.5 emission rates in a network due to the inclusion of resuspended PM2.5.

2. Materials and Methods

2.1. Theoretical Premise
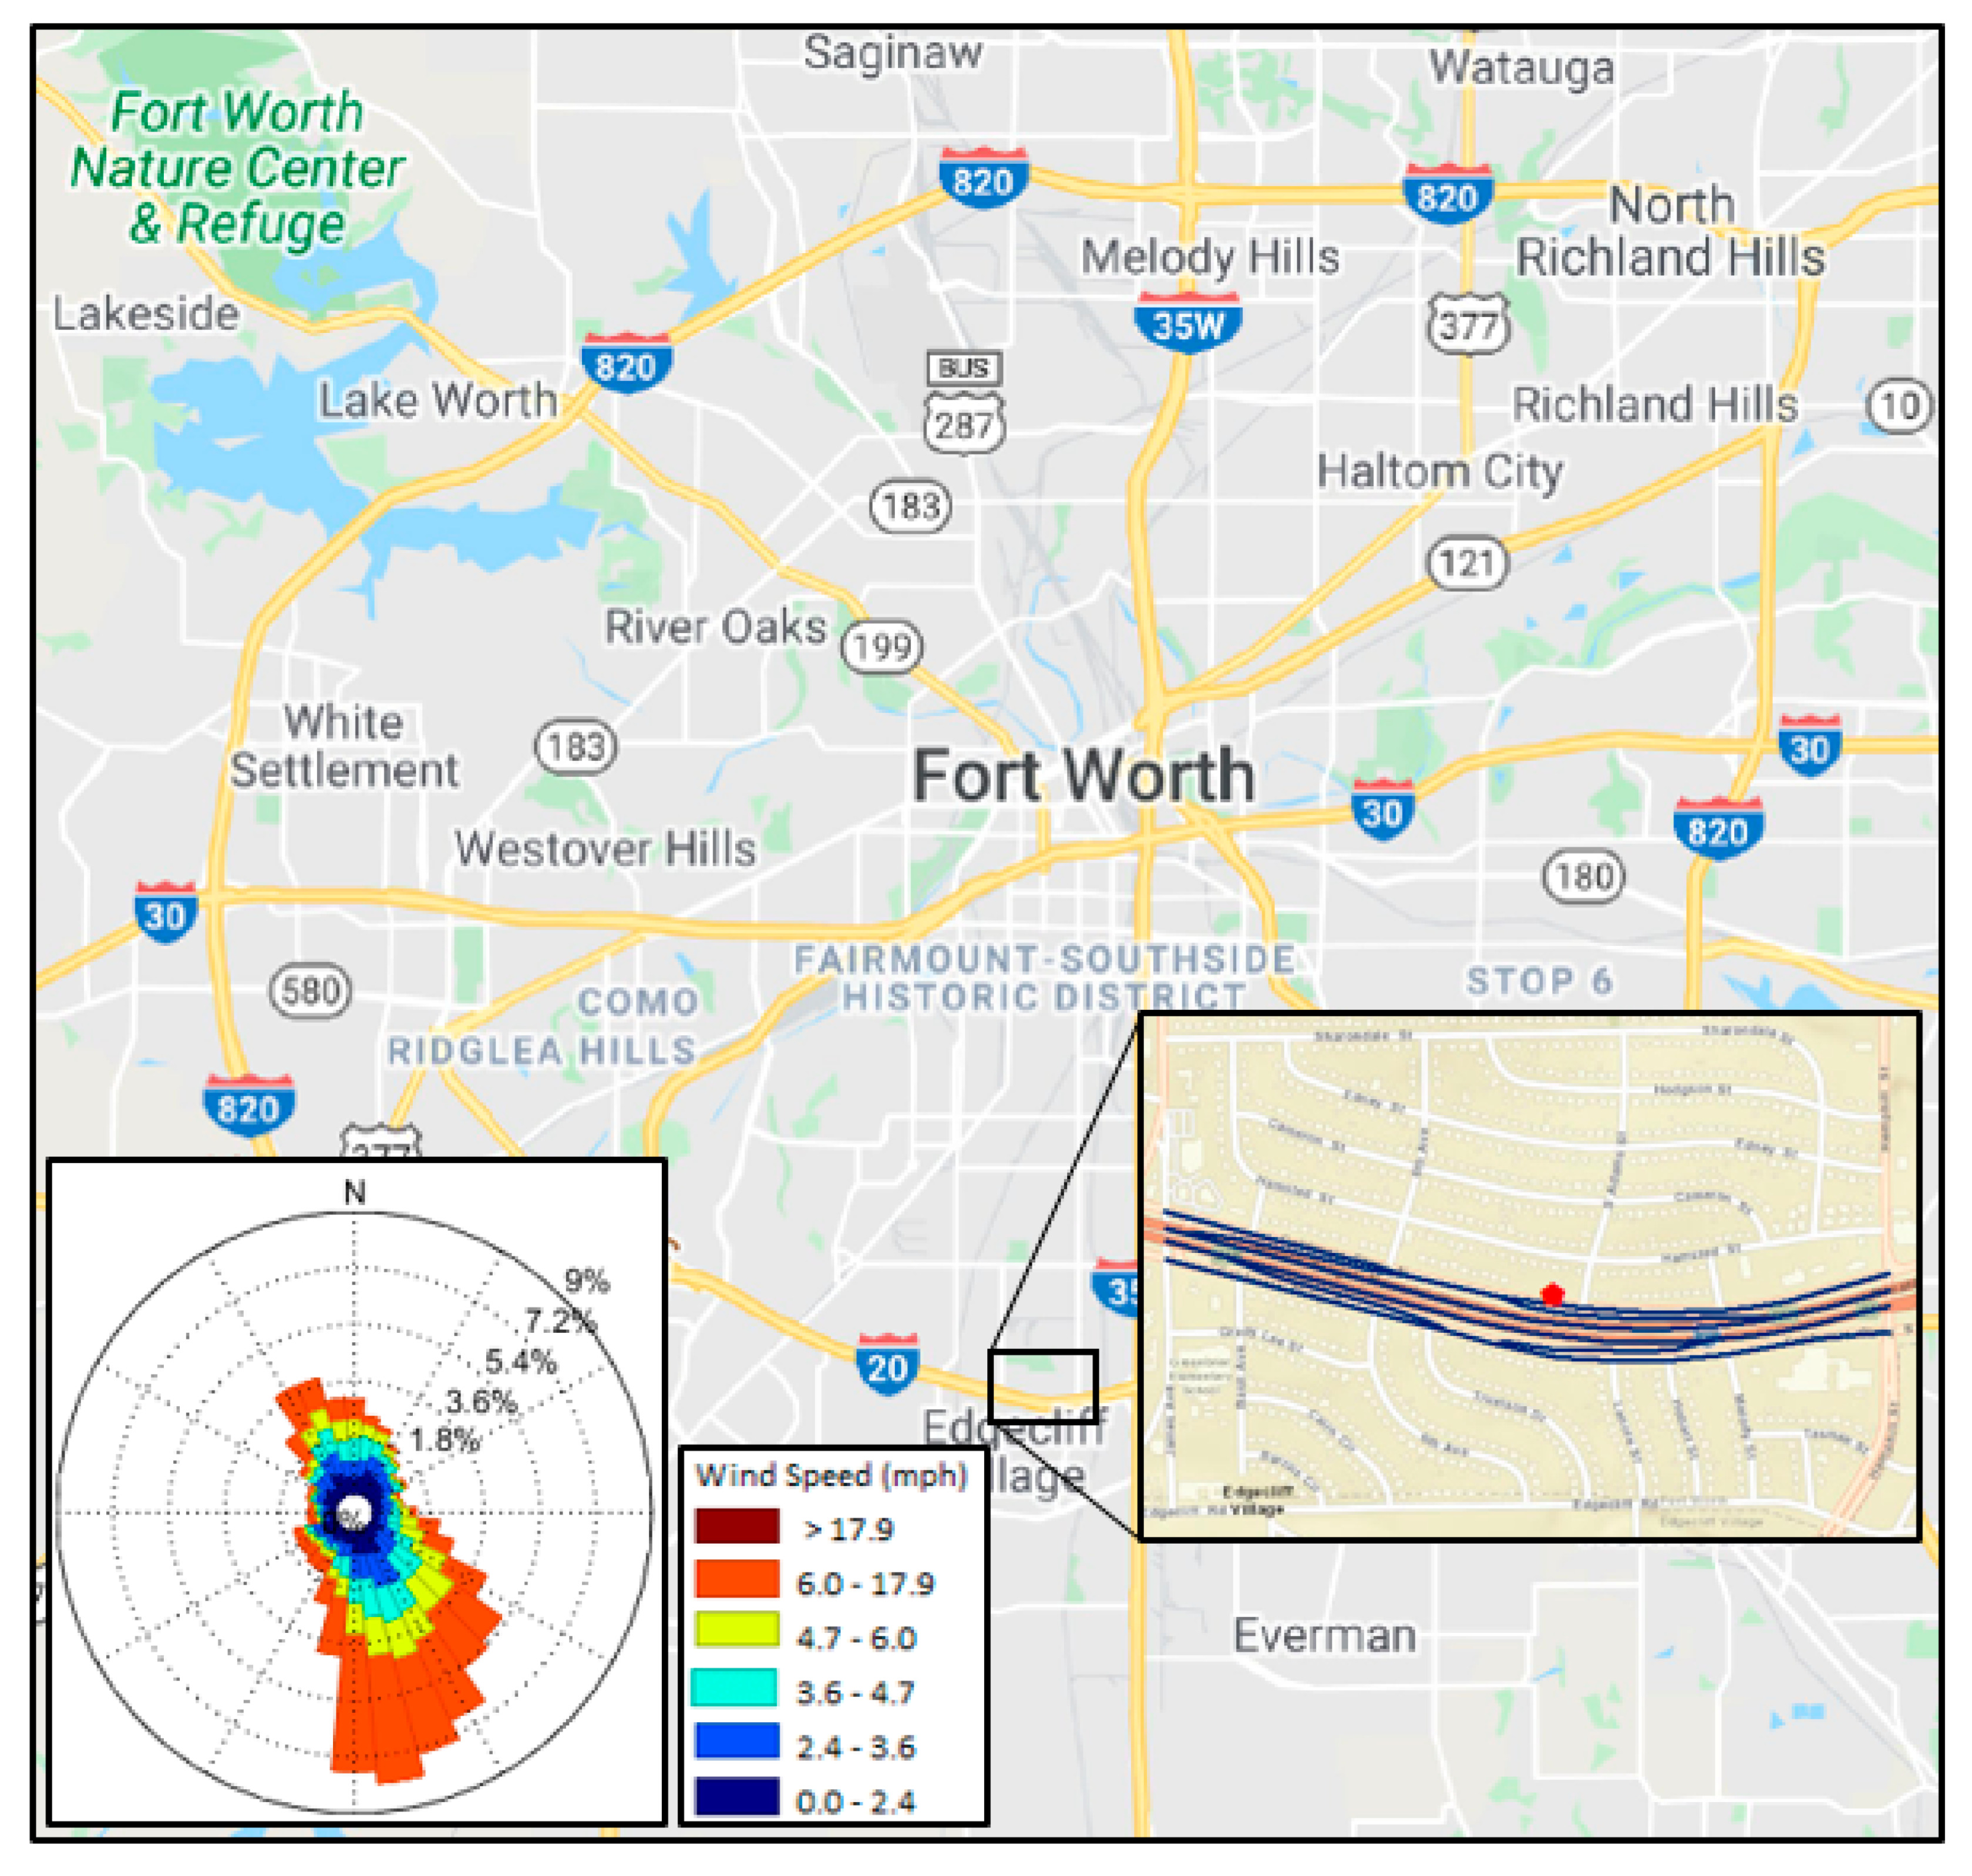
The road dust PM2.5 emission rate is a function of vehicle weight, road type (paved vs. unpaved), and meteorological variables (precipitation) which will be multiplied by traffic volume for resuspended dust emissions estimation. The PM2.5 emissions from tailpipe exhaust, brake wear and tire wear (exhaust and other) are functions of traffic speed, road type, fleet characteristics and mix, fuel quality, and meteorological variables in the respective county which will be multiplied by traffic volume for vehicular (exhaust, brake, and tire wear) emissions estimation [19]. Adding the resuspended PM2.5 emissions to the vehicular (exhaust, brake, and tire wear) PM2.5 emissions will be influenced by meteorological variables such as temperature, wind speed, and wind direction as a function of time when dispersion mechanisms occur [19,29]. In addition, adding the resuspended PM2.5 emission rate to various segments of a network with associated PM2.5 emission rates (due to vehicular sources with different characteristics and speeds) cannot be interpreted as a linear increase of the total PM2.5 emission rate in a network. Hence, it can be concluded that there is a nonlinear relationship between traffic-related emission rates and near-road traffic-related air pollutant concentrations over different time periods [12]. Changes in emission rates will not necessarily result in the same changes in concentrations. In this study, the traffic-related PM2.5 emissions (mass per time per area of roadway) and near-road traffic-related concentrations (mass per volume), were estimated for different time periods in 2016 for each of the four seasons, for two types of roadways (highways and arterials). Finally, the emission rates and predicted near-road concentrations were averaged over daily time periods for each season to compare the effects including or not including resuspended PM2.5 emissions. Through this procedure, the increment of near-road traffic-related PM2.5 concentrations including resuspended PM2.5 in traffic-related emissions was investigated.

2.2. Area of Study

In response to recent EPA requirements for near-road air pollution monitoring, the Texas Commission on Environmental Quality (TCEQ) has determined six locations near major highways to monitor air quality using the federal reference method (FRM) in Texas [33]. One of these is in Fort Worth, Texas, and this location was selected for emission, meteorological, and dispersion modeling in this study [34]. The near-road continuous air monitoring station (CAMS) 1053 is located 15 m away from the edge of I-20 in Tarrant County (EPA Site Number: 484391053, 1198 California North, TX 76115, USA), as shown in Figure 1. The highway and arterial segments within a 600 m radius (8) of this near-road point (Figure 1) were considered for dispersion modeling. The hourly wind speed, wind direction, and temperature monitored at this point (CAMS 1053) were used as the onsite meteorological data for data processing in the meteorological modeling.
The Dallas-Fort Worth (DFW) regional travel demand model (TDM) results were obtained from the North Central Texas Council of Governments and post-processed to estimate hourly traffic activity on each link for the target area. The modeled hourly traffic volume and speed were mapped into different daily time periods such as morning peak (6:00–9:00 a.m.), midday (9:00 a.m.–4:00 p.m.), evening peak (4:00–7:00 p.m.), and overnight (8:00 p.m.–6:00 a.m.) periods. The hour that corresponds to the maximum volume in each period was selected for the analysis. Traffic volume and speed were not adjusted for different seasons.

2.3. Emission Modeling Using MOVES

The PM2.5 emission factors due to all traffic-related sources other than resuspended dust (exhaust, brake, and tire wear) were modeled using MOVES for Tarrant County in 2016. MOVES requires information for vehicle types, ages, fuel types, and the emission parameters to estimate emission factors. To estimate composite emission factors for each link in the target network, the vehicle miles traveled (VMT) mix was obtained for two road types: highways and arterials.
The VMT mix indicates the contribution of each vehicle type to the total VMT. The VMT mixes were estimated using a previously developed method and expanded to produce the four daily time period estimates for four months [35,36]. The four daily time periods included morning peak, midday, evening peak, and overnight. The four months were January, April, July, and October and represent emissions in winter, spring, summer, and fall, respectively. Composite emission factors were estimated using MOVES emission factors for different vehicle types and VMT mix for two road types (arterials and highways) based on Equation (1) [35], in which i represents vehicle types.
C o m p o s i t e   E F = i E m i s s i o n   F a c t o r s × V M T   m i x  

2.4. Resuspended Dust Emission Estimation

No unpaved road emissions factor analyses were performed because there were no unpaved roads in the target network. Resuspended dust emission factors from paved roads (i.e., TDM and intra-zonal links) were developed according to Equation (2) from the AP-42 section 13.2.1 [28].
E = k   ( s L 0.91 ) ( W 1.02 ) ( 1 P 4 N )
where k is the particulate size multiplier (g/VMT); sL is the road surface silt loading (g/m2); W is the average vehicle weight (tons); P is the number of wet days (≥0.01 inches of rain) (days); N is the number of days in the period (days).
The input parameters to estimate resuspended PM2.5 emissions are the PM2.5 particle size multiplier, a factor indicating road surface silt loading, the average weight of fleet, days with 0.01 inches or more precipitation (wet days) for the seasonal period, and number of days in the seasonal averaging period. The number of wet days for the seasonal periods of Tarrant County (37, 28, 29, and 13 days for spring, summer, fall, and winter, respectively) was obtained from the Community Collaborative Rain, Hail and Snow Network database [37]. The PM2.5 particle size multiplier (k = 0.25 g/VMT) and road surface silt loading (sL) for arterials (0.062 g/m2) and highways (0.003 g/m2) from the referenced EPA AP-42 guidance were used [28]. The average vehicle weight values were estimated using the current Tarrant County VMT mix and respective MOVES vehicle types weights. Since control programs (i.e., street sweeping) affect the road surface silt loading and controlled silt loading values are not available, no control programs were included in the development of the resuspended PM2.5 emissions factors for this analysis.

2.5. Dispersion Modeling Using AERMOD

Dispersion modeling requires an input set including meteorological variables and emission source characteristics. The meteorological inputs were obtained from running a meteorological preprocessor developed by the EPA for regulatory dispersion modeling, AERMET [38]. The onsite data including wind speed, wind direction, and temperature obtained from hourly near-road monitoring (CAMS 1053) were incorporated with upper air data and surface air data for 2016. Surface characteristics including albedo, Bowen ratio, and also surface air and upper air representative station name for Tarrant County were obtained from TCEQ meteorological database for air dispersion modeling [39]. The surface air data of Dallas Fort Worth Airport (Station ID: 3927) was obtained from the National Oceanic Atmospheric Administration (NOAA) surface air database [40] and upper air data of Fort Worth (Station ID: 3990) was obtained from NOAA Radiosonde Database [41]. AERMET was run including these raw input sets to model meteorological variables in hourly time resolution for target near-road environments in 2016.
To model the target network as the emission source in AERMOD, the network highways and arterials were split into smaller segments (to represent the curvature of the roads) and were defined as the area sources of PM2.5 emissions. The PM2.5 quantitative hotspot analyses were used to define the details of area sources of emissions [19]. The release height and initial vertical dispersion coefficient were estimated based on the EPA’s guidance for each of the four daily time periods for arterial and highway segments (approximately 1.4 m and 1.3 m, respectively). The PM2.5 concentrations were modeled for one receptor located at 15 m from the edge of the highway (32.66° N, –97.34° W, elevation: 214.9 m) and 4 m from ground-level representing the near-road environment.

3. Results and Discussion

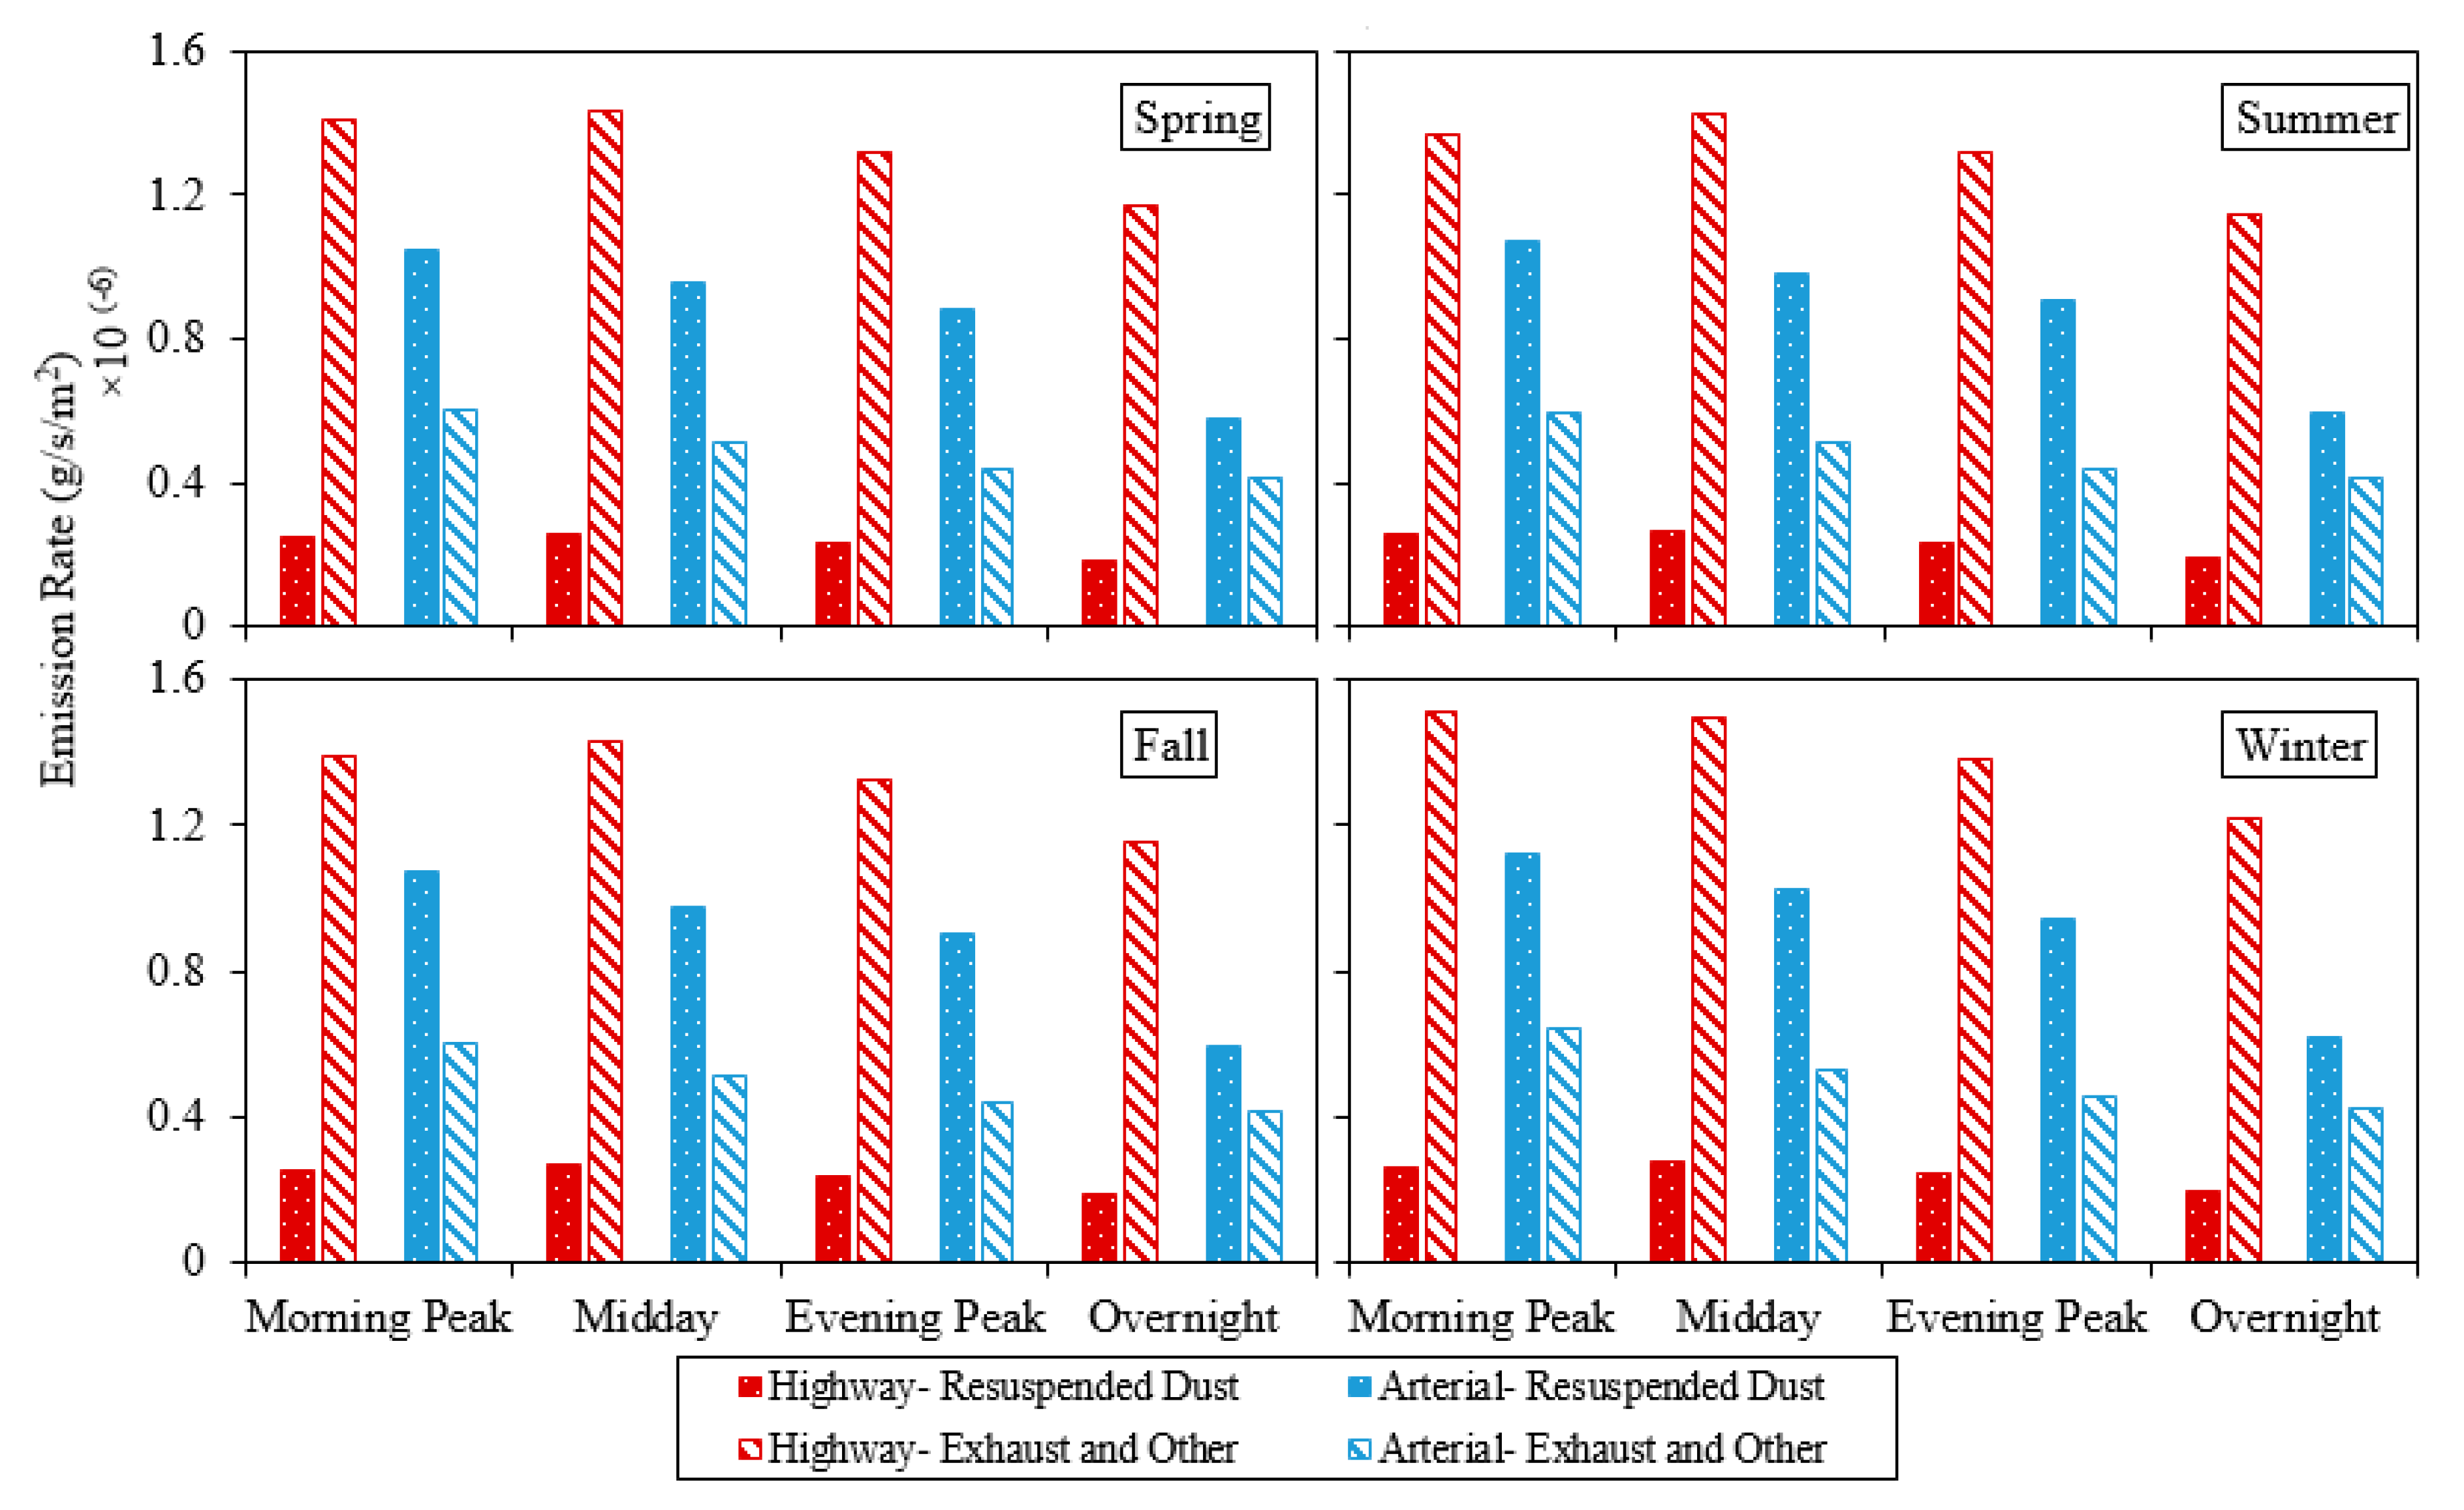
3.1. Traffic-Related PM2.5 Emission Rates on Highways and Arterials

The PM2.5 emission rates due to resuspended dust and also exhaust emissions as averaged over four time periods of the day are shown for highways and arterials for four seasons in Figure 2. The predicted PM2.5 resuspended emissions are greater than exhaust, brake, and tire wear combined at arterials emphasizing the need to include resuspended dust in emission modeling when in close proximity to arterials. However, the resuspended PM2.5 emissions are significantly lower than exhaust, brake, and tire wear combined at highways which can be explained by the higher quality of highway pavement leading to smaller factors used in highway resuspended PM2.5 emission estimation.
The road surface silt loading (sL) plays a determinant role in the prediction of resuspended PM2.5 emissions from highways and arterials (0.003 and 0.062 g/m2, respectively, according to AP-42). Results do not show significant changes in emission rates between morning peak, midday, and evening peak, but a considerable decrease during nighttime due to the lower predicted traffic activity.
To investigate the PM2.5 emission rate increments due to inclusion of resuspended dust, the ratio of resuspended PM2.5 to the exhaust, brake, and tire wear emissions was calculated for highways and arterials in different seasonal and daily time periods (Table 1). The increments are consistently higher than 100% for arterials. For arterials, results also show that the increment is highest during evening peak followed by midday, morning peak, and overnight, respectively, which shows the importance of considering resuspended dust in PM2.5 emission estimation in the same order. Among different daily time periods for highway emissions, the increment is highest for midday, followed by morning peak, evening peak, and overnight, respectively. As far as seasonal variation, the increment is highest for summer, followed by fall, winter, and spring, respectively. The overall evaluation of modeled emission rates shows that the increase in average PM2.5, due to the inclusion of resuspended dust emissions, will vary from 15.7% to 18.7%, and 138.9% to 207.6% for highways and arterials in Fort Worth, Texas, respectively.

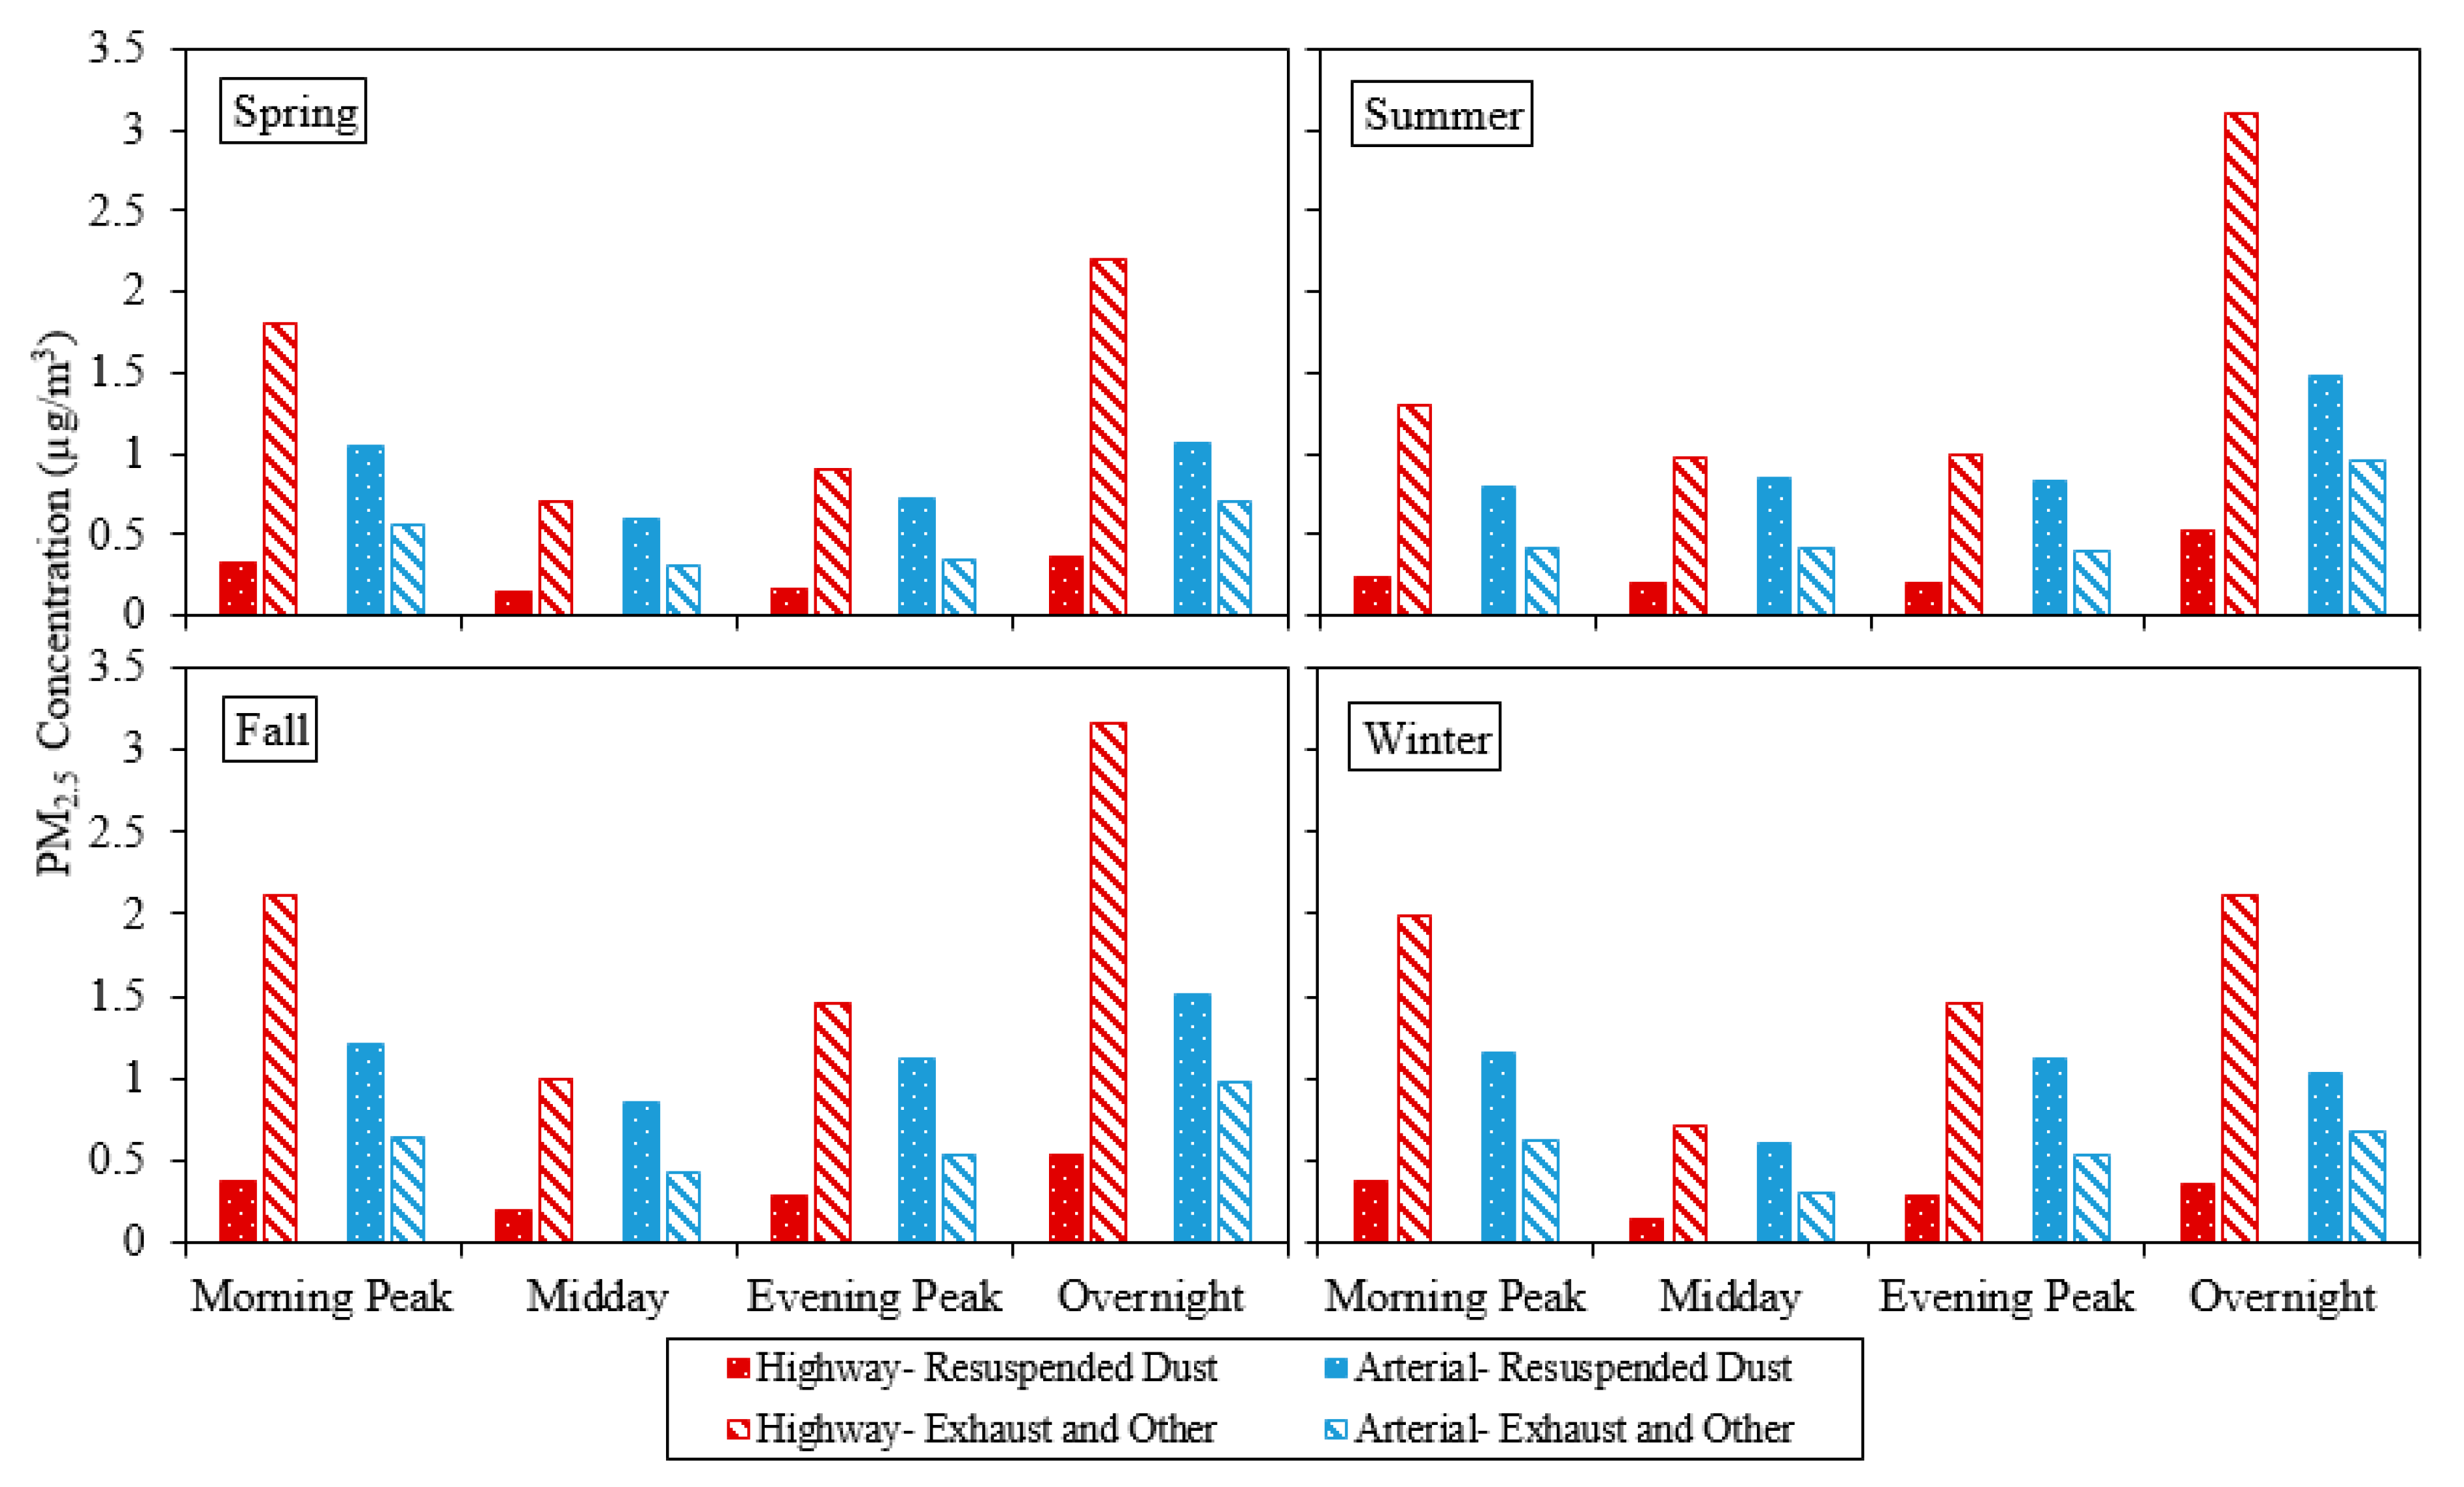
3.2. Traffic-Related PM2.5 Concentrations from Highways and Arterials

The PM2.5 emission rates were applied to the study network with a focus on highways and arterials to predict the average PM2.5 concentrations in four daily time periods of each season during 2016, as shown in Figure 3. In line with the emission results discussed above, the comparison of modeled concentrations shows a lower contribution of resuspended dust from highways and higher contribution from arterials when compared with exhaust, brake, and tire wear emissions. However, modeled PM2.5 concentrations resulting from traffic activity in highways and arterials show significant variation across the different daily time periods and the four seasons. This variation in PM2.5 concentrations is a result of various meteorological variables in different time periods caused by nonlinearity between traffic-related emissions and near-road concentrations over time, which cannot be detected by investigating daily and seasonal emission rates (Figure 2). The overnight traffic-related PM2.5 concentrations are typically highest, followed by those of morning peak, evening peak, and midday, respectively (Figure 3). The higher overnight near-road traffic-related PM2.5 is consistent with previous literature based on field [30] and modeling studies [8]. Previous research suggested that this trend may be due to the more stable/restrictive atmospheric boundary layer conditions during the night [42].

3.3. Overall Traffic-Related PM2.5 Concentrations

The near-road environment is located at different distances from various segments (highway and arterial with corresponding traffic count and speed), which comprise the whole target network and influence associated near-road traffic-related air pollution. The influence of different segments of the network on the target near-road environment depends on the geometry of the network and near-road environment, which will be combined with meteorological variables’ effect on emissions. This effect is the other source of nonlinearity between traffic-related emissions and near-road concentrations in dispersion modeling. Table 2 shows the increase in average near-road PM2.5 concentrations due to inclusion of resuspended dust emissions and dispersion modeling in different time periods and seasons.
The results show that adding resuspended PM2.5 emissions to the whole network (highways and arterials) yields significant increases (between 49% and 74.3%) in near-road traffic-related PM2.5 concentrations. The variation between different seasons is minimal. However, the increases are highest for midday and evening peak, followed by morning peak and overnight periods, respectively. The increments shown in Table 2 are different to those presented in Table 1 due to the nonlinearity of near-road traffic-related emission and concentration relationship due to the effect of meteorological variables and network geometry.

4. Conclusions and Recommendations

Resuspended dust is underinvestigated in the literature and is the component of traffic-related emissions which cannot be controlled by new technologies or new vehicle emission standards. Further, with the expected widespread introduction of electric vehicles (especially in cities), the relative importance of non-regulated, non-tailpipe emissions is becoming large. In the present study, the PM2.5 emission rates due to resuspended dust and exhaust, brake, and tire wear were modeled for two road types (highway and arterial), four time periods of the day, and four seasons in 2016, using EPA regulatory guidelines and tools. The increase in traffic-related PM2.5 emission and near-road concentrations due to inclusion of resuspended dust in estimations was evaluated and compared in different daily and seasonal time periods for a near-road environment in Tarrant County, Fort Worth, Texas. The estimated increase in traffic-related PM2.5 emissions was not proportional to the estimated near-road traffic-related PM2.5 concentrations at the different time periods. The nonlinearity between emission rates and concentrations due to the effect of meteorological variables and geometry of the network with unevenly scattered traffic-related emission rates (due to different link traffic speeds) was evident.
Increases in PM2.5 emission rates due to resuspended dust inclusion were considerably higher than the sum of tailpipe exhaust, brake wear, and tire wear emissions on arterials. The PM2.5 emission rate increments on arterials ranged between 139% and 208%, while they were lower on highways and ranged between 16% and 19%. The comparison of emission rates showed the importance of the inclusion of resuspended PM2.5, particularly when dealing with traffic-related PM2.5 in a near-road environment surrounded by arterials. These are areas where human exposure can be more important than areas near highways, as people tend to live, work, and congregate near many arterials. All PM2.5 emission rates overnight were lower than those modeled for three other daily periods during the year (which is expected due to the lower traffic counts), while modeled PM2.5 concentrations were highest overnight. The overall increase in near-road traffic-related PM2.5 concentrations for the whole network varied between 49% and 74%, an important percentage from an exposure and health point of view. A similar study using monitored hourly vehicle classification, traffic counts and speeds, and also near-road speciation data would be more reliable and useful for evaluation of regulatory guidelines in resuspended dust emission estimation and the exposure and health effect scenarios. In addition, the explained nonlinearity can be quantified using a monitored dataset and would be helpful to have a better understanding of influential variables and parameters in dispersion modeling. The study utilized AP-42 resuspended dust PM2.5 factors which has a rating of D [28] for application, this shows further studies are required to corroborate or update the existing AP-42 resuspended dust PM2.5 factors.

Author Contributions

The authors confirm contribution to the paper as follows: conceptualization, M.H.A.; methodology, M.H.A. and M.V.; modeling, analysis and interpretation of results, M.H.A.; writing—original draft preparation, M.H.A. and M.V.; writing—review and editing, M.H.A., H.K., A.B., J.Z. All authors have read and agreed to the published version of the manuscript.

Funding

This research received no external funding.

Conflicts of Interest

The authors declare no conflict of interest.

References

  1. Khreis, H.; Warsow, K.M.; Verlinghieri, E.; Guzman, A.; Pellecuer, L.; Ferreira, A.; Jones, I.; Heinen, E.; Rojas-Rueda, D.; Mueller, N.; et al. The health impacts of traffic-related exposures in urban areas: Understanding real effects, underlying driving forces and co-producing future directions. J. Transp. Health 2016, 3, 249–267. [Google Scholar] [CrossRef]
  2. Weinmayr, G.; Romeo, E.; de Sario, M.; Weiland, S.; Forastiere, F. Short-term effects of PM10 and NO2 on respiratory health among children with asthma or asthma-like symptoms: A systematic review and meta-analysis. Environ Health Perspect. 2010, 118, 449–457. [Google Scholar] [CrossRef] [PubMed] [Green Version]
  3. Zamora, M.L.; Pulczinski, J.C.; Johnson, N.; Garcia-Hernandez, R.; Rule, A.; Carrillo, G.; Zietsman, J.; Sandragorsian, B.; Vallamsundar, S.; Askariyeh, M.H.; et al. Maternal exposure to PM2.5 in south Texas, a pilot study. Sci. Total Environ. 2018, 628–629, 1497–1507. [Google Scholar] [CrossRef] [PubMed]
  4. Sohrabi, S.; Zietsman, J.; Khreis, H. Burden of Disease Assessment of Ambient Air Pollution and Premature Mortality in Urban Areas: The Role of Socioeconomic Status and Transportation. Int. J. Environ. Res. Public Health 2020, 17, 1166. [Google Scholar] [CrossRef] [Green Version]
  5. Sharifi, F.; Sohrabi, S.; Farzaneh, R.; Khreis, H. Active Transportation and Self-Impression of Health: Evidence from 2017 National Household Travel Survey Data. J. Transp. Health 2019, 14, 100786. [Google Scholar] [CrossRef]
  6. Sohrabi, S.; Khreis, H. Transportation and Public Health: A Burden of Disease Analysis of Transportation Noise. J. Transp. Health 2019, 14, 100686. [Google Scholar] [CrossRef]
  7. U.S. EPA. NAAQS Table. Criteria Air Pollutants. 2016. Available online: https://www.epa.gov/criteria-air-pollutants/naaqs-table (accessed on 15 February 2018).
  8. Askariyeh, M.H.; Vallamsundar, S.; Farzaneh, R. Investigating the Impact of Meteorological Conditions on Near-Road Pollutant Dispersion between Daytime and Nighttime Periods. Transp. Res. Rec. 2018, 2672, 99–110. [Google Scholar] [CrossRef]
  9. Baldauf, R.; Thoma, E.; Hays, M.; Shores, R.; Kinsey, J.; Gullett, B.; Kimbrough, S.; Isakov, V.; Long, T.; Snow, R.; et al. Traffic and Meteorological Impacts on Near-Road Air Quality: Summary of Methods and Trends from the Raleigh Near-Road Study. J. Air Waste Manag. Assoc. 2008, 58, 865–878. [Google Scholar] [CrossRef]
  10. Askariyeh, M.H.; Vallamsundar, S.; Zietsman, J.; Ramani, T. Assessment of Traffic-Related Air Pollution: Case Study of Pregnant Women in South Texas. Int. J. Environ. Res. Public Health 2019, 16, 2433. [Google Scholar] [CrossRef] [Green Version]
  11. Askariyeh, M.H.; Zietsman, J.; Autenrieth, R. Traffic Contribution to PM2.5 Increment in the Near-Road Environment. Atmos. Environ. 2020, 224, 117113. [Google Scholar] [CrossRef]
  12. Chen, S.; Broday, D.M. Re-framing the Gaussian dispersion model as a nonlinear regression scheme for retrospective air quality assessment at a high spatial and temporal resolution. Environ. Model. Softw. 2020, 125, 104620. [Google Scholar] [CrossRef]
  13. Kioumourtzoglou, M.-A.; Schwartz, J.D.; Weisskopf, M.G.; Melly, S.J.; Wang, Y.; Dominici, F.; Zanobetti, A. Long-term PM2.5 Exposure and Neurological Hospital Admissions in the Northeastern United States. Environ. Health Perspect. 2016, 124, 23–29. [Google Scholar] [CrossRef] [PubMed] [Green Version]
  14. Girguis, M.S.; Strickland, M.J.; Hu, X.; Liu, Y.; Bartell, S.M.; Vieira, V.M. Maternal Exposure to Traffic-Related Air Pollution and Birth Defects in Massachusetts. Environ. Res. 2016, 146, 1–9. [Google Scholar] [CrossRef] [PubMed] [Green Version]
  15. Weinstock, L.; Watkins, N.; Wayland, R.; Baldauf, R. EPA’s Emerging Near-Road Ambient Monitoring Network: A Progress Report. EM Magazine. Available online: http://pubs.awma.org/gsearch/em/2013/7/weinstock.pdf (accessed on 20 March 2020).
  16. Vallamsundar, S.; Askariyeh, M.; Zietsman, J.; Ramani, T.; Johnson, N.; Pulczinski, J.C.; Koehler, K. Maternal Exposure to Traffic-Related Air Pollution Across Different Microenvironments. J. Transp. Health 2016, 3, S72. [Google Scholar] [CrossRef]
  17. Brugge, D.; Durant, J.; Rioux, C. Near-highway pollutants in motor vehicle exhaust: A review of epidemiologic evidence of cardiac and pulmonary health risks. Environ. Health 2007, 6, 23. [Google Scholar] [CrossRef] [Green Version]
  18. Rowangould, G.M. A census of the US near-roadway population: Public health and environmental justice considerations. Transp. Res. Part D Transp. Environ. 2013, 25, 59–67. [Google Scholar] [CrossRef]
  19. U.S. EPA. Transportation Conformity Guidance for Quantitative Hot-Spot Analyses in PM2.5 and PM10 Nonattainment and Maintenance Areas, Office of Transportation and Air Quality. EPA-420-B-15-084. 2015. Available online: https://www3.epa.gov/ttn/naaqs/aqmguide/collection/cp2/20101201_otaq_epa-420_b-10-040_transport_conform_hot-spot_analysis_appx.pdf (accessed on 2 March 2018).
  20. U.S. EPA. MOVES2014a User Guide. Office of Transportation and Air Quality. 2015. Available online: https://nepis.epa.gov/Exe/ZyPDF.cgi?Dockey=P100NNCY.txt (accessed on 15 March 2018).
  21. U.S. EPA. Control of Air Pollution from Motor Vehicles: Tier3 Motor Vehicle Emission and Fuel Standards Final Rule. 2014. Available online: https://www.epa.gov/regulations-emissions-vehicles-and-engines/final-rule-control-air-pollution-motor-vehicles-tier-3 (accessed on 20 February 2018).
  22. Amato, F.; Favez, O.; Pandolfi, M.; Alastuey, A.; Querol, X.; Moukhtar, S.; Bruge, B.; Verlhac, S.; Orza, J.A.G.; Bonnaire, N.; et al. Traffic induced particle resuspension in Paris: Emission factors and source contributions. Atmos. Environ. 2016, 129, 114–124. [Google Scholar] [CrossRef]
  23. Thorpe, A.; Harrison, R.M. Sources and properties of non-exhaust particulate matter from road traffic: A review. Sci. Total Environ. 2008, 400, 270–282. [Google Scholar] [CrossRef]
  24. Abu-Allaban, M.; Gillies, J.A.; Gertler, A.W.; Clayton, R.; Proffitt, D. Tailpipe, resuspended road dust, and brake-wear emission factors from on-road vehicles. Atmos. Environ. 2003, 37, 5283–5293. [Google Scholar] [CrossRef]
  25. Kundu, S.; Stone, E.A. Composition and sources of fine particulate matter across urban and rural sites in the Midwestern United States. Environmental science. Process. Impacts 2014, 16, 1360–1370. [Google Scholar] [CrossRef] [Green Version]
  26. ADOT. Air Quality Regional Conformity Analysis: Nogales PM2.5–PM10 Nonattainment Areas. Arizona Department of Transportation (ADOT) Project No. 189 SC 000 H8045 01L. 2017. Available online: https://www.azdot.gov/docs/default-source/environmental-planning-library/h8045_nogales_finalairqualityconformityanalysis.pdf?sfvrsn=2 (accessed on 10 April 2018).
  27. U.S. EPA. Using MOVES2014 in Project-Level Carbon Monoxide Analyses. 2015. Available online: https://nepis.epa.gov/Exe/ZyPdf.cgi?Dockey=P100M2FB.pdf (accessed on 15 March 2018).
  28. U.S. EPA. AP-42: Section 13.2.1 Paved Roads. Available online: https://www3.epa.gov/ttnchie1/ap42/ch13/final/c13s0201.pdf (accessed on 20 March 2018).
  29. U.S. EPA. User’s Guide for the AMS/EPA Regulatory Model (AERMOD). Office of Air Quality Planning and Standards: Research Triangle Park, NC. EPA-454/B-19-027. 2019. Available online: https://www3.epa.gov/ttn/scram/models/aermod/aermod_userguide.pdf (accessed on 20 March 2020).
  30. Zhu, Y.; Kuhn, T.; Mayo, P.; Hinds, W. Comparison of Daytime and Nighttime Concentration Profiles and Size Distributions of Ultrafine Particles near a Major Highway. Environ. Sci. Technol. 2006, 40, 2531–2536. [Google Scholar] [CrossRef] [PubMed]
  31. Ginzburg, H.; Liu, X.; Baker, M.; Shreeve, R.; Jayanty, R.; Campbell, D.; Zielinska, B. Monitoring study of the near-road PM2.5 concentrations in Maryland. J. Air Waste Manag. Assoc. 2015, 65, 1062–1071. [Google Scholar] [CrossRef] [PubMed] [Green Version]
  32. Zhao, S.; Yu, Y.; Yin, D.; He, J.; Liu, N.; Qu, J.; Xiao, J. Annual and diurnal variations of gaseous and particulate pollutants in 31 provincial capital cities based on in situ air quality monitoring data from China National Environmental Monitoring Center. Environ. Int. 2016, 86, 92–106. [Google Scholar] [CrossRef] [PubMed]
  33. Code of Federal Register. Title 40CFR Part 58, Appendix D, Section 4.3.2. 2017. Available online: https://www.ecfr.gov/cgi-bin/retrieveECFR?gp=&r=PART&n=40y6.0.1.1.6 (accessed on 20 April 2018).
  34. U.S. EPA. Ambient Monitoring Technology Information Center (AMTIC). 2019. Available online: https://www3.epa.gov/ttnamti1/nearroad.html (accessed on 20 March 2020).
  35. Texas A&M Transportation Institute. Update of On-Road Inventory Development Methodologies for MOVES2014. 2014. Available online: ftp://amdaftp.tceq.texas.gov/pub/EI/onroad/mvs14_utilities/MOVES2014_Utilities_Report_Final_December_2014.pdf (accessed on 10 May 2018).
  36. Texas A&M Transportation Institute. Methodologies for Conversion of Data Sets for MOVES Model Compatibility. 2013. [Google Scholar]
  37. CoCoRaHS. Community Collaborative Rain, Hail and Snow Network: Daily Precipitation Reports. 2017. Available online: https://www.cocorahs.org/ViewData/ListDailyPrecipReports.aspx (accessed on 25 March 2018).
  38. U.S. EPA. User’s Guide for the AERMOD Meteorological Preprocessor (AERMET). EPA-454/B-16-010. 2016. Available online: https://www3.epa.gov/ttn/scram/7thconf/aermod/aermet_userguide.pdf (accessed on 10 March 2018).
  39. TCEQ. Meteorological Data for Air Dispersion Modeling. 2017. Available online: https://www.tceq.texas.gov/permitting/air/nav/datasets.html (accessed on 16 May 2018).
  40. NOAA. Surface Air Database. 2018. Available online: ftp://ftp.ncdc.noaa.gov/pub/data/noaa (accessed on 16 May 2018).
  41. NOAA. NOAA/ESRL Radiosonde Database. 2018. Available online: https://ruc.noaa.gov/raobs/ (accessed on 16 May 2018).
  42. Sathaye, N.; Harley, R.; Madanat, S. Unintended environmental impacts of nighttime freight logistics activities. Transp. Res. Part A Policy Pract. 2010, 44, 642–659. [Google Scholar] [CrossRef] [Green Version]
Figure 1. Study area (I-20: Ronald Reagan Memorial Highway shown by navy lines), near-road environment (shown by red mark) and corresponding wind rose based on monitored values in Fort Worth, Texas.
Ijerph 17 02851 g001
Figure 2. Predicted fine particulate matter (PM2.5) emission rates.
Ijerph 17 02851 g002
Figure 3. Predicted PM2.5 concentrations.
Ijerph 17 02851 g003
Table 1. Predicted PM2.5 emission increment due to inclusion of resuspended dust.
Time PeriodHighwayArterial
SpringSummerFallWinterSpringSummerFallWinter
Morning Peak17.4%18.4%18.1%17.5%172.7%181.3%178.4%175.6%
Midday18.1%18.7%18.6%18.6%187.4%193.0%192.2%193.1%
Evening Peak17.3%17.8%17.8%17.8%202.1%207.6%206.8%207.3%
Overnight15.7%16.4%16.2%16.2%138.9%144.1%142.9%144.8%
Table 2. Overall hourly average PM2.5 concentrations increment due to considering resuspended dust compared with those of a network without resuspended dust.
Time PeriodSpringSummerFallWinter
Morning Peak58.5%60.2%57.8%58.3%
Midday73.1%73.8%74.3%73.3%
Evening Peak72.2%74.4%71.1%70.2%
Overnight49.6%49.4%49.5%49.8%

