Validation of the Copenhagen Psychosocial Questionnaire Version III and Establishment of Benchmarks for Psychosocial Risk Management in Sweden


Abstract
:1. Introduction
A Need for Benchmarks for Use at Workplaces
2. Materials and Methods
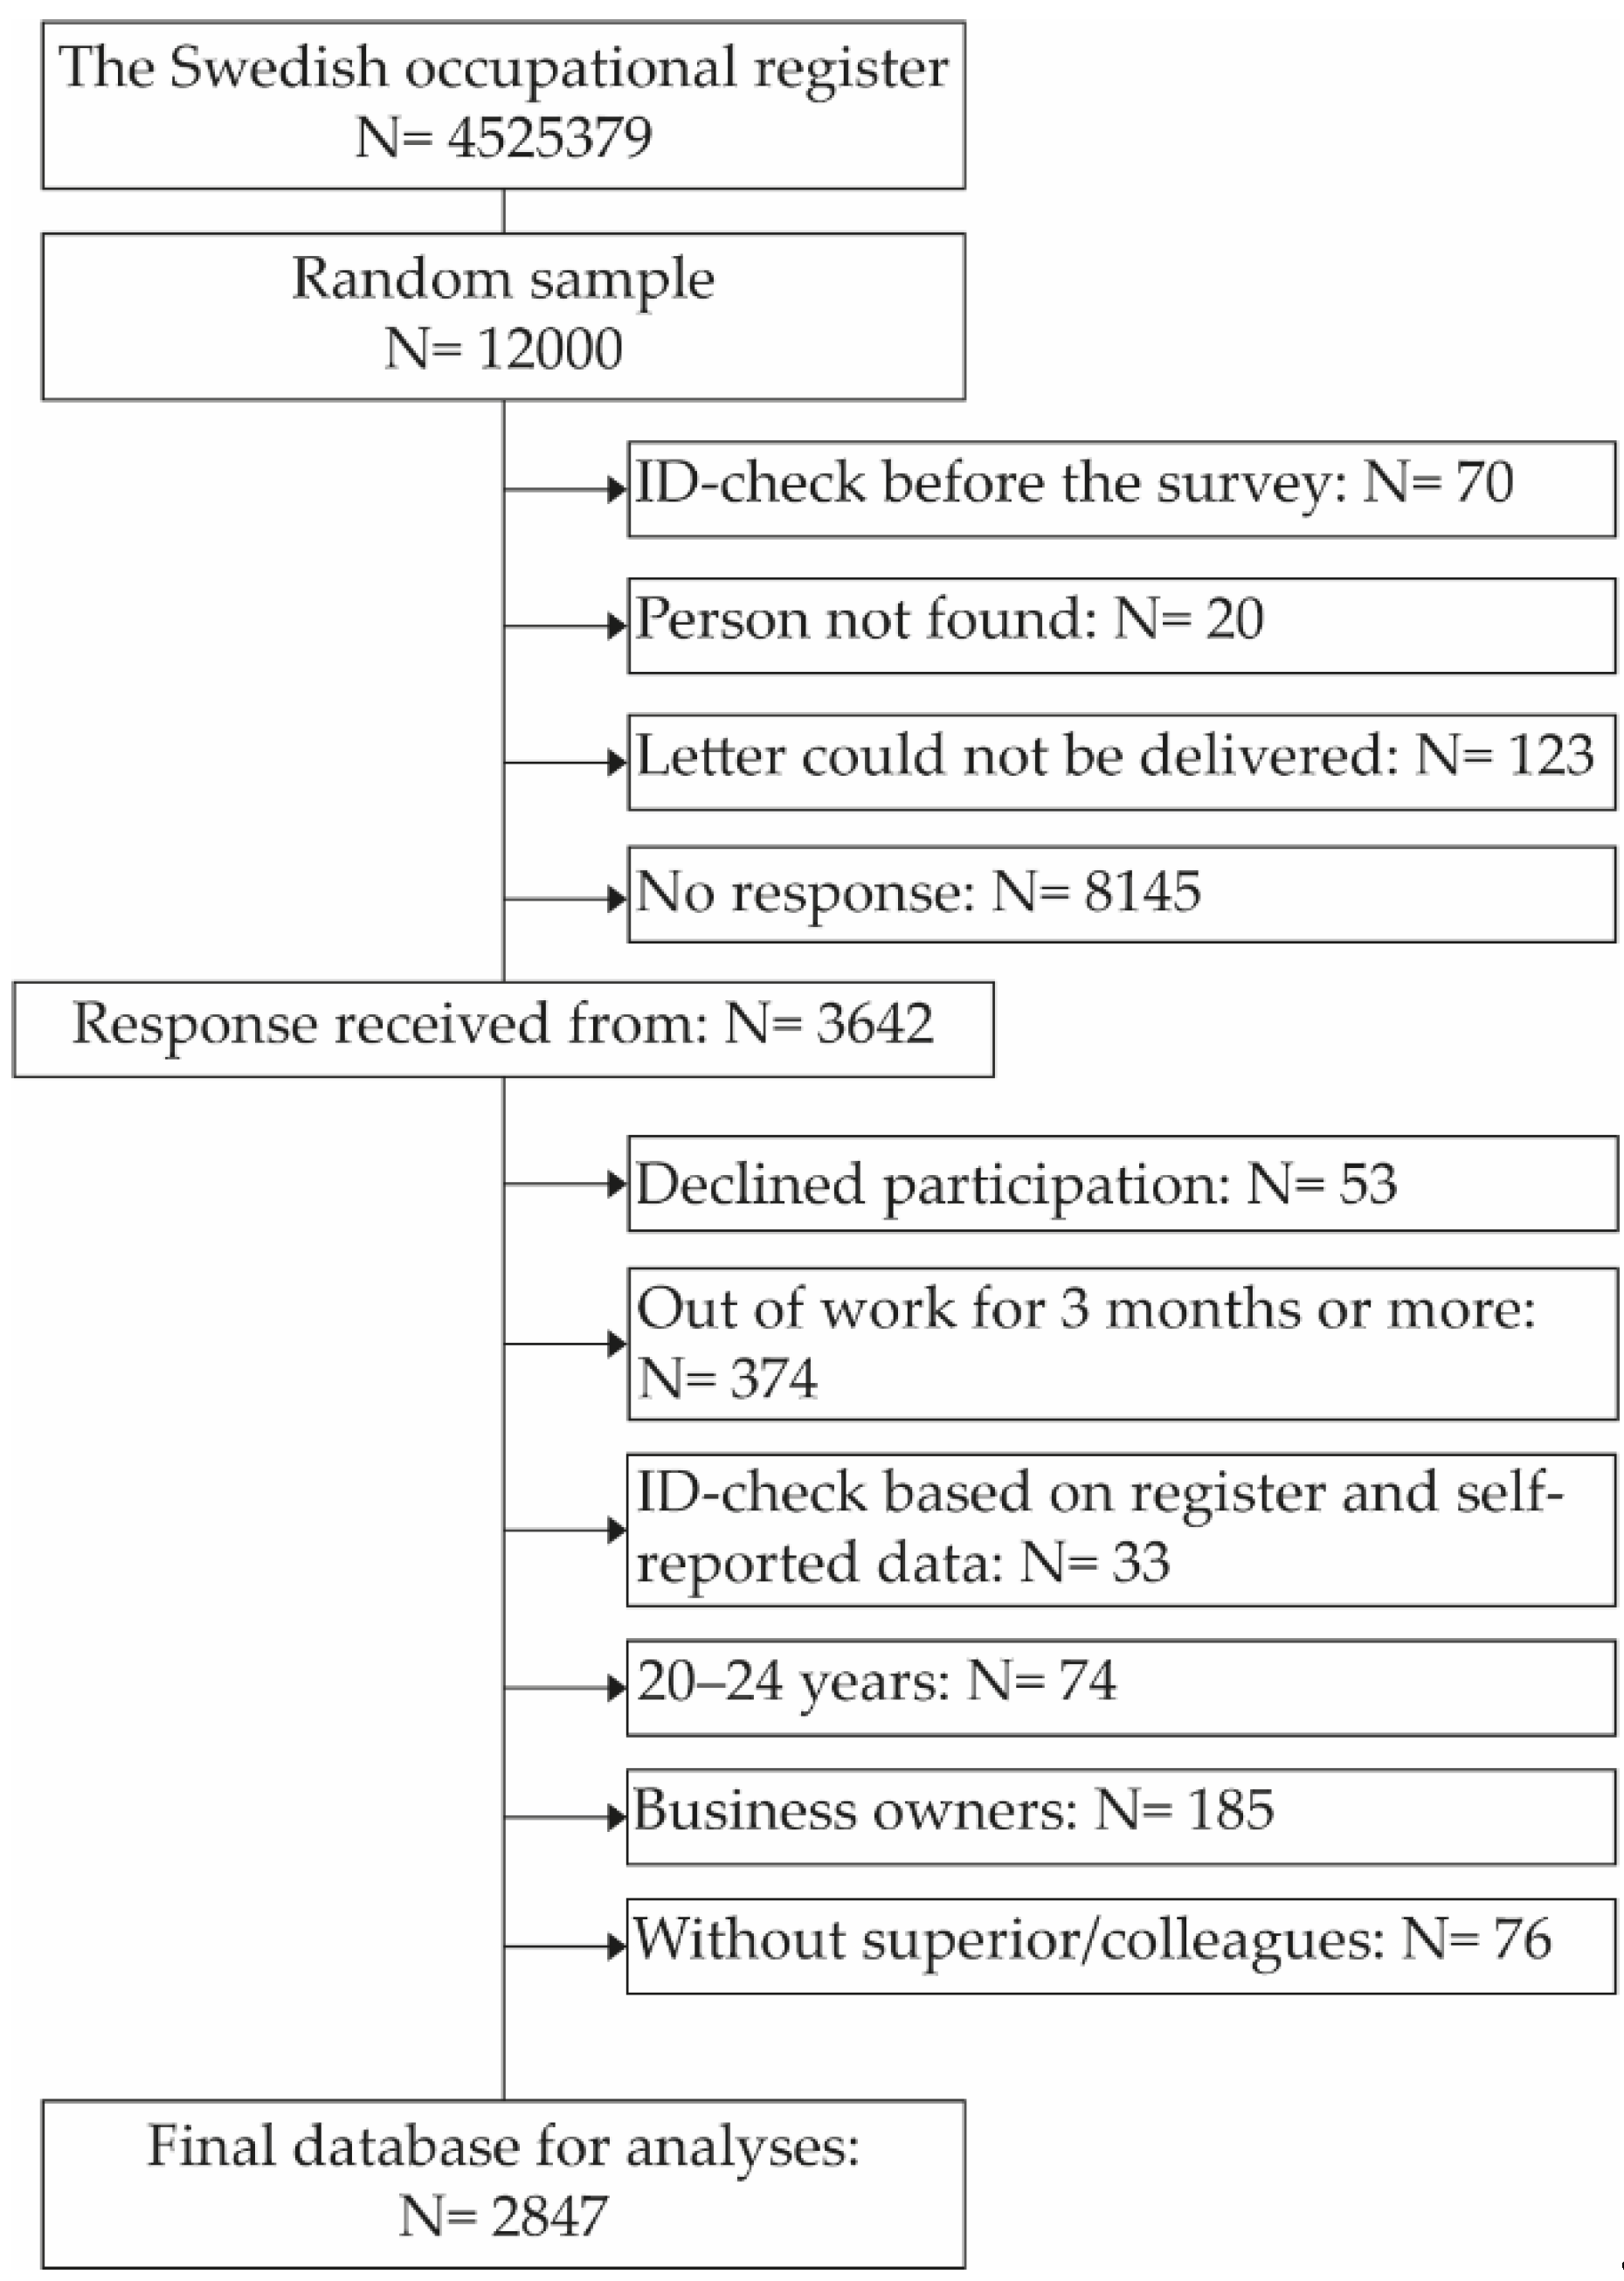
2.1. Random Sample
2.2. Workplace Sample
2.3. Variables
2.4. The National Swedish Standard Version of COPSOQ III
2.5. Analyses
2.6. Ethics
3. Results
4. Discussion
4.1. Reliability and Scale Characteristics at Individual Level Based on the National Survey
4.2. Reliability and Validity of COPSOQ III for Use at Workplaces and for Multilevel Research Design
4.3. Strengths and Limitations
5. Conclusions
Supplementary Materials
Author Contributions
Funding
Acknowledgments
Conflicts of Interest
Appendix A

| ISCO-08 Major Occupational Groups | N | Women | Private Sector | Public Sector | Fixed Employment | Age (Years) | Income Level (Swedish Kronor Per Year before Income Tax) | Relational Work | Non-Managerial Position | ||
|---|---|---|---|---|---|---|---|---|---|---|---|
| % | % | % | % | Mean | SD | Mean | SD | % | % | ||
| 0. Armed Forces Occupations | 5 | ||||||||||
| 1. Managers | 222 | 45.5 | 53.9 | 40.1 | 98.6 | 50.0 | 8.3 | 677,430 | 315,167 | 81.0 | 11.7 |
| 2. Professionals | 987 | 65.2 | 33.0 | 62.9 | 95.8 | 47.1 | 10.7 | 457,505 | 191,216 | 84.6 | 67.7 |
| 3. Technicians and Associate Professionals | 421 | 43.5 | 60.7 | 32.2 | 98.1 | 46.6 | 10.6 | 442,773 | 160,008 | 83.0 | 69.8 |
| 4. Clerical Support Workers | 220 | 70.9 | 56.9 | 33.5 | 94.0 | 47.7 | 10.5 | 334,546 | 104,186 | 70.8 | 78.5 |
| 5. Services and Support Workers | 482 | 77.2 | 34.6 | 61.1 | 86.9 | 48.7 | 11.8 | 292,795 | 89,345 | 96.0 | 77.8 |
| 6. Skilled Agricultural, Forestry and Fishery Workers | 20 | 45.0 | 55.0 | 30.0 | 75.0 | 47.7 | 12.5 | 265,315 | 82,340 | 45.0 | 75.0 |
| 7. Craft and Related Trades Workers | 168 | 7.7 | 86.6 | 11.0 | 97.0 | 47.1 | 10.7 | 387,394 | 102,623 | 72.7 | 75.6 |
| 8. Plant and Machine Operators and Assemblers | 152 | 17.8 | 86.3 | 8.2 | 93.8 | 49.8 | 10.4 | 373,195 | 111,118 | 50.3 | 78.9 |
| 9. Elementary Occupations | 88 | 64.8 | 44.0 | 42.9 | 87.4 | 49.3 | 11.0 | 262,938 | 77,095 | 78.4 | 77.3 |
| Not classified | 82 | ||||||||||
Appendix B
| The Swedish Standard COPSOQ III. | No. of Items | Correspondence with the International COPSOQ III | Correspondence with the Existing Swedish COPSOQ II |
|---|---|---|---|
| Quantitative demands | 3 | Equal to MIDDLE | 1 item shorter |
| Work pace | 2 | Equal to MIDDLE | 1 item shorter |
| Emotional demands | 3 | Equal to MIDDLE | 1 item shorter, 1 item changed wording |
| Influence | 4 | 1 MIDDLE item replaced by 1 LONG item | No changes |
| Possibilities for development | 3 | Equal to MIDDLE | 1 item shorter |
| Variation of work | 1 | 1 out of 2 LONG items | No changes |
| Meaning of work | 1 | Equal to CORE | 2 items shorter |
| Predictability | 2 | Equal to MIDDLE | No changes |
| Recognition | 2 | 1 CORE item supplemented by 1 LONG item | 1 item shorter, dimension name changed |
| Role clarity | 3 | Equal to MIDDLE | Dimension name changed |
| Role conflicts | 3 | 2 CORE items supplemented by 1 MIDDLE item on illegitimate tasks | 1 item shorter |
| Quality of leadership | 3 | Equal to MIDDLE | 1 item shorter, dimension name changed |
| Social support from supervisor | 2 | Equal to MIDDLE | 1 item shorter |
| Social support from colleagues | 2 | Equal to MIDDLE | 1 item shorter |
| Sense of community at work | 3 | Equal to LONG | No changes |
| Commitment to the workplace | 3 | 3 out of 5 LONG items | 1 item replaced; dimension name changed |
| Work engagement | 3 | Equal to LONG | New dimension |
| Job insecurity | 3 | Equal to LONG | New dimension |
| Insecurity over working conditions | 2 | 1 CORE item supplemented by 1 LONG item | New dimension |
| Quality of work | 2 | Equal to LONG | New dimension |
| Job satisfaction | 4 | 4 out of 5 LONG items (1 MIDDLE item excluded) | No changes |
| Work life conflict | 3 | 2 CORE items supplemented by 1 LONG item | 1 item shorter, 1 item replaced, response options changed |
| Horizontal trust | 1 | Equal to MIDDLE | 2 items shorter, dimension name changed |
| Vertical trust | 3 | Equal to MIDDLE | 1 item shorter, 2 items changed wording, dimension name changed |
| Organizational justice | 3 | 2 CORE items supplemented by 1 LONG item | 1 item shorter, 2 items changed wording, dimension name changed |
| Self-rated health | 1 | Equal to CORE | No changes |
| Stress | 3 | Equal to LONG | 1 item shorter |
| Burnout SE | 3 | 3 out of 4 LONG version items | 1 item shorter |
| Threats of violence | 1 (2) | Equal to LONG | No changes |
| Physical violence | 1 (2) | Equal to LONG | No changes |
| Bullying | 1 (2) | Equal to LONG | No changes |
| Sexual harassment | 1 (2) | Equal to LONG | No changes |
| Cyber Bullying | 1 (2) | Equal to LONG | New dimension |
References
- Dollard, M.; Skinner, N.; Tuckey, M.R.; Bailey, T. National surveillance of psychosocial risk factors in the workplace: An international overview. Work Stress 2007, 21, 1–29. [Google Scholar] [CrossRef]
- Leka, S.; Cox, T. Psychosocial risk management at the workplace level. In Occupational Health Psychology; Leka, S., Houdmont, J., Eds.; Wiley–Blackwell: West Sussex, UK, 2010; pp. 124–156. [Google Scholar]
- Leka, S.; van Wassenhove, W.; Jain, A. Is psychosocial risk prevention possible? Deconstructing common presumptions. Saf. Sci. 2015, 71, 61–67. [Google Scholar] [CrossRef]
- Weiler, A. Working Conditions Surveys—A Comparative Analysis; European Foundation for the Improvement of Living and Working Conditions: Dublin, Ireland, 2007. [Google Scholar]
- Burr, H.; Berthelsen, H.; Moncada, S.; Nübling, M.; Dupret, E.; Demiral, Y.; Oudyk, J.; Kristensen, T.S.; Llorens, C.; Navarro, A.; et al. The third version of the Copenhagen Psychosocial Questionnaire. Saf. Health Work 2019, 10, 482–503. [Google Scholar] [CrossRef] [PubMed]
- Kristensen, T.S.; Hannerz, H.; Høgh, A.; Borg, V. The Copenhagen Psychosocial Questionnaire—A tool for the assessment and improvement of the psychosocial work environment. Scand. J. Work Environ. Health 2005, 31, 438–449. [Google Scholar] [CrossRef] [Green Version]
- Pejtersen, J.H.; Kristensen, T.S.; Borg, V.; Bjorner, J. The second version of the Copenhagen Psychosocial Questionnaire. Scand. J. Pub. Health 2010, 38, 8–24. [Google Scholar] [CrossRef]
- Berthelsen, H.; Westerlund, H.; Kristensen, T.S. COPSOQ II—En Uppdatering och Språklig Validering av den Svenska Versionen av en Enkät för Kartläggning av den Psykosociala Arbetsmiljön på Arbetsplatser (COPSOQ II—An Update and Linguistic Validation of the Swedish Version of a Survey for the Monitoring of the Psychosocial Work Environment at Workplaces); Report No. 326; Stress Research Institute, Stockholm University: Stockholm, Sweden, 2014; Available online: https://www.stressforskning.su.se/polopoly_fs/1.233343.1429705740!/menu/standard/file/rapport%20326.pdf (accessed on 27 April 2020).
- Berthelsen, H.; Lönnblad, A.; Hakanen, J.; Kristensen, T.S.; Axtelius, B.; Bjørner, J.B.; Westerlund, H. Cognitive interviewing used in the development and validation of Copenhagen Psychosocial Questionnaire in Sweden. In Conference Paper Presented at the Nordic Work Life Conference Threats and Possibilities Facing Nordic Working Life—Stream 26 Methodological Challenges for Working Life and Labour Market Studies; Gothenburg University: Gothenburg, Sweden, 2014; pp. 232–233. Available online: https://mau.diva-portal.org/smash/get/diva2:1420205/FULLTEXT01.pdf (accessed on 27 April 2020).
- Berthelsen, H.; Hakanen, J.; Kristensen, T.; Lönnblad, A.; Westerlund, H. A qualitative study on the content validity of the social capital scales in the Copenhagen Psychosocial Questionnaire (COPSOQ II). Scand. J. Work Org. Psychol. 2016, 1, 5. [Google Scholar] [CrossRef] [Green Version]
- Berthelsen, H.; Hakanen, J.J.; Westerlund, H. Copenhagen Psychosocial Questionnaire—A validation study using the job demand-resources model. PLoS ONE 2018, 13, e0196450. [Google Scholar] [CrossRef] [PubMed] [Green Version]
- Wentz, K.; Gyllensten, K.; Sluiter, J.K.; Hagberg, M. Need for recovery in relation to effort from work and health in four occupations. Int. Arch. Occup. Environ. Health 2019, 92, 243–259. [Google Scholar] [CrossRef] [Green Version]
- Geisler, M.; Berthelsen, H.; Muhonen, T. Retaining social workers: The role of quality of work and psychosocial safety climate for work engagement, job satisfaction, and organizational commitment. Hum. Serv. Organ. Manag. Leadersh. Gov. 2019, 43, 1–15. [Google Scholar] [CrossRef] [Green Version]
- Muhonen, T.; Jönsson, S.; Bäckström, M. Consequences of cyberbullying behaviour in Working Life: The mediating roles of social support and social organisational climate. Int. J. Workplace Health Manag. 2017, 10, 376–390. [Google Scholar] [CrossRef] [Green Version]
- Anskär, E.; Lindberg, M.; Falk, M.; Andersson, A. Legitimacy of work tasks, psychosocial work environment, and time utilization among primary care staff in Sweden. Scand. J. Prim. Health Care 2019, 37, 476–483. [Google Scholar] [CrossRef] [PubMed] [Green Version]
- Berthelsen, H.; Muhonen, T.; Toivanen, S. What happens to the physical and psychosocial work environment when activity-based offices are introduced into academia? J. Corp. Real Estate 2018, 20, 230–243. [Google Scholar] [CrossRef]
- Geisler, M.; Berthelsen, H.; Hakanen, J.J. No job demand is an Island-Interaction effects between emotional demands and other types of job demands. Front. Psychol. 2019, 10, 873. [Google Scholar] [CrossRef] [PubMed]
- Holm, K.; Torkelson, E.; Bäckström, M. Models of workplace incivility: The relationships to instigated incivility and negative outcomes. Bioed. Res. Int. 2015, 2015, 920239. [Google Scholar] [CrossRef] [Green Version]
- Melin, M.; Lager, E.; Lindfors, P. High-Flying Risks—Variations in Working Conditions, Health, and Safety Behaviors Among Commercial Airline PILOTS in Relation to Safety Climate; Arbete och Hälsa; Scientific Serial No. 2018,52; Unit for Occupational and Environmental Medicine, University of Gothenburg: Gothernburg, Sweden, 2018; Available online: https://gupea.ub.gu.se/bitstream/2077/55085/4/gupea_2077_55085_4.pdf (accessed on 27 April 2020).
- Anskär, E.; Lindberg, M.; Falk, M.; Andersson, A. Time utilization and perceived psychosocial work environment among staff in Swedish primary care settings. BMC Health Serv. Res. 2018, 18, 166. [Google Scholar] [CrossRef]
- Nyqvist, E.; Arnrup, K.; Berthelsen, H. Belastningssymtom och sviktande arbetsförmåga—En utmaning för tandvården (Strain symptoms and work ability—A challenge for the public dental health service). Tandläkartidningen 2016, 14, 54–61. [Google Scholar]
- Berthelsen, H.; Westerlund, H.; Hakanen, J.J.; Kristensen, T.S. It is not just about occupation, but also about where you work. Commun. Dent. Oral Epidemiol. 2017, 45, 372–379. [Google Scholar] [CrossRef] [Green Version]
- Berthelsen, H.; Conway, P.M.; Clausen, T. Is organizational justice climate at the workplace associated with individual-level quality of care and organizational affective commitment? A multi-level, cross-sectional study on dentistry in Sweden. Int. Arch. Occup. Environ. Health 2018, 91, 237–245. [Google Scholar] [CrossRef] [Green Version]
- Björk, L.; Glise, K.; Pousette, A.; Bertilsson, M.; Holmgren, K. Involving the employer to enhance return to work among patients with stress-related mental disorders—Study protocol of a cluster randomized controlled trial in Swedish primary health care. BMC Pub. Health 2018, 18, 838. [Google Scholar] [CrossRef] [Green Version]
- Brämberg, E.B.; Holmgren, K.; Bültmann, U.; Gyllensten, H.; Hagberg, J.; Sandman, L.; Bergström, G. Increasing return-to-work among people on sick leave due to common mental disorders: Design of a cluster-randomized controlled trial of a problem-solving intervention versus care-as-usual conducted in the Swedish primary health care system (PROSA). BMC Pub. Health 2018, 18, 889. [Google Scholar] [CrossRef]
- Haapakangas, A.; Hallman, D.M.; Mathiassen, S.E.; Jahncke, H. The effects of moving into an activity-based office on communication, social relations and work demands–A controlled intervention with repeated follow-up. J. Environ. Psychol. 2019, 66, 101341. [Google Scholar] [CrossRef]
- Kaltenbrunner, M.; Bengtsson, L.; Mathiassen, S.E.; Högberg, H.; Engström, M. Staff perception of Lean, care-giving, thriving and exhaustion: A longitudinal study in primary care. BMC Health Serv. Res. 2019, 19, 652. [Google Scholar] [CrossRef] [PubMed]
- Richter, A.; von Thiele Schwarz, U.; Lornudd, C.; Lundmark, R.; Mosson, R.; Hasson, H. iLead—A transformational leadership intervention to train healthcare managers’ implementation leadership. Implement. Sci. 2015, 11, 108. [Google Scholar] [CrossRef] [PubMed] [Green Version]
- Boström, M.; Björklund, C.; Bergström, G.; Nybergh, L.; Schäfer Elinder, L.; Stigmar, K.; Wåhlin, C.; Jensen, I.; Kwak, L. Health and work environment among female and male Swedish elementary school teachers—A cross-sectional study. Int. J. Environ. Health Res. 2020, 17, 227. [Google Scholar] [CrossRef] [PubMed] [Green Version]
- Şahan, C.; Baydur, H.; Demiral, Y. A novel version of Copenhagen Psychosocial Questionnaire-3: Turkish validation study. Arch. Environ. Occ. Health 2018, 74, 297–309. [Google Scholar] [CrossRef] [PubMed]
- Ramkissoon, A.; Smith, P.; Oudyk, J. Dissecting the effect of workplace exposures on workers’ rating of psychological health and safety. Am. J. Ind. Med. 2019, 62, 412–421. [Google Scholar] [CrossRef] [PubMed]
- Berthelsen, H.; Westerlund, H.; Pejtersen, J.H.; Hadzibajramovic, E. Construct validity of a global scale for workplace social capital based on COPSOQ III. PLoS ONE 2019, 14, e0221893. [Google Scholar] [CrossRef] [Green Version]
- Bliese, P.D.; Jex, S.M. Incorporating multiple levels of analysis into occupational stress research. Work Stress 1999, 13, 1–6. [Google Scholar] [CrossRef]
- Moncada, S.; Utzet, M.; Molinero, E.; Llorens, C.; Moreno, N.; Galtes, A.; Navarro, A. The Copenhagen Psychosocial Questionnaire II (COPSOQ II) in Spain—A tool for psychosocial risk assessment at the workplace. Am. J. Ind. Med. 2014, 57, 97–107. [Google Scholar] [CrossRef]
- Bliese, P.D.; Maltarich, M.A.; Hendricks, J.L.; Hofmann, D.A.; Adler, A.B. Improving the measurement of group-level constructs by optimizing between-group differentiation. J. Appl. Psychol. 2019, 104, 293–302. [Google Scholar] [CrossRef]
- Eisinga, R.; Te Grotenhuis, M.; Pelzer, B. The reliability of a two-item scale: Pearson, Cronbach, or Spearman-Brown? Int. J. Pub. Health 2013, 58, 637–642. [Google Scholar] [CrossRef] [PubMed]
- Terwee, C.B.; Bot, S.D.; de Boer, M.R.; van der Windt, D.A.; Knol, D.L.; Dekker, J.; Bouter, L.M.; de Vet, H.C. Quality criteria were proposed for measurement properties of health status questionnaires. J. Clin. Epidemiol. 2007, 60, 34–42. [Google Scholar] [CrossRef] [PubMed] [Green Version]
- Cohen, J. Statistical Power Analysis for the Behavioral Sciences, 2nd ed.; Routledge: Hillsdale, NJ, USA, 1988. [Google Scholar]
- Pejtersen, J.H.; Bjorner, J.B.; Hasle, P. Determining minimally important score differences in scales of the Copenhagen Psychosocial Questionnaire. Scand. J. Pub. Health 2010, 38, 33–41. [Google Scholar] [CrossRef] [PubMed]
- Bliese, P.D. Group size, ICC values, and group-level correlations: A simulation. Organ. Res. Methods 1998, 1, 355–373. [Google Scholar] [CrossRef]
- Bliese, P.D. Within-group agreement, non-independence, and reliability: Implications for data aggregation and analysis. In Multilevel Theory, Research, and Methods in Organizations; Klein, K.J., Kozlowski, S.W., Eds.; Jossey-Bass: San Francisco, CA, USA, 2000; pp. 349–381. [Google Scholar]
- LeBreton, J.M.; Senter, J.L. Answers to 20 questions about interrater reliability and interrater agreement. Org. Res. Met. 2008, 11, 815–852. [Google Scholar] [CrossRef]
- Koo, T.K.; Li, M.Y. A guideline of selecting and reporting intraclass correlation coefficients for reliability research. J. Chiropr. Med. 2016, 15, 155–163. [Google Scholar] [CrossRef] [PubMed] [Green Version]
- Eurofound. Sixth European Working Conditions Survey—Overview Report; Publications Office of the European Union: Luxembourg, 2017; Available online: https://www.eurofound.europa.eu/publications/report/2016/working-conditions/sixth-european-working-conditions-survey-overview-report (accessed on 27 April 2020).
- World Bank. Employment in services (% of Total Employment) (Modeled ILO Estimate); World Bank: Washington, DC, USA, 2019; Available online: https://data.worldbank.org/indicator/SL.SRV.EMPL.ZS (accessed on 18 December 2019).
- Lämsä, T. Leadership styles and decision-making in Finnish and Swedish organizations. Rev. Int. Comp. Manag. 2010, 11, 139–149. [Google Scholar]
- Kristensen, T.S. A questionnaire is more than a questionnaire. Scand. J. Pub. Health 2010, 38, 149–155. [Google Scholar] [CrossRef] [Green Version]
- Nübling, M.; Vomstein, M.; Haug, A.; Lincke, H. Können psychosoziale Arbeitsbelastungen in einer job-exposure-matrix abgeschätzt werden? Das Gesundheitswesen 2017, 79, V231. [Google Scholar]
- Nübling, M.; Vomstein, M.; Haug, A.; Lincke, H.-J. Sind referenzdaten der COPSOQ-datenbank für eine JEM zu psychosozialen Arbeitsfaktoren geeignet? Zentralblatt für Arbeitsmedizin Arbeitsschutz und Ergonomie 2017, 67, 151–154. [Google Scholar] [CrossRef] [Green Version]
- Huang, F.L. Multilevel modeling myths. Sch. Psychol. Q. 2018, 33, 492. [Google Scholar] [CrossRef] [PubMed]
- Probst, T.M.; Jiang, L. European flexicurity policies: Multilevel effects on employee psychosocial reactions to job insecurity. Saf. Sci. 2017, 100, 83–90. [Google Scholar] [CrossRef]
- Ostroff, C. Comparing correlations based on individual-level and aggregated data. J. Appl. Psychol. 1993, 78, 569. [Google Scholar] [CrossRef]
- Judge, T.A.; Erez, A.; Thoresen, C.J. Why negative affectivity (and self-deception) should be included in job stress research: Bathing the baby with the bath water. J. Org. Behav. 2000, 21, 101–111. [Google Scholar] [CrossRef]
- Dollard, M.; Dorman, C.; Idris, M. Psychosocial Safety Climate: A New Work Stress Theory; Springer: Amsterdam, The Netherlands, 2019. [Google Scholar]
- Dollard, M.F.; Bakker, A.B. Psychosocial Safety Climate as a precursor to conducive work environments, psychological health problems, and employee engagement. J. Occ. Org. Psychol. 2010, 83, 579–599. [Google Scholar] [CrossRef] [Green Version]
- Potter, R.; O’Keeffe, V.; Leka, S.; Webber, M.; Dollard, M. Analytical review of the Australian policy context for work-related psychological health and psychosocial risks. Saf. Sci. 2019, 111, 37–48. [Google Scholar] [CrossRef]

| Dimension | Group | % of Sample |
|---|---|---|
| Sex | Men | 43.9 |
| Women | 56.1 | |
| Age, mean (SD) | 47.7 (10.8) years | |
| Age distribution | 25–39 years | 25.1 |
| 40–54 years | 42.9 | |
| 55–65 years | 32.0 | |
| Occupational group | 0. Armed Forces Occupations | 0.20 |
| 1. Managers | 7.80 | |
| 2. Professionals | 34.7 | |
| 3. Technicians and Associate Professionals | 14.8 | |
| 4. Clerical Support Workers | 7.70 | |
| 5. Services and Support Workers | 16.9 | |
| 6. Skilled Agricultural. Forestry and Fishery Workers | 0.70 | |
| 7. Craft and Related Trades Workers | 5.90 | |
| 8. Plant and Machine Operators and Assemblers | 5.30 | |
| 9. Elementary Occupations | 3.10 | |
| Not classified | 2.90 | |
| Educational level | Primary education | 5.10 |
| Secondary education | 45.5 | |
| Tertiary education | 49.5 | |
| Income level | Up to 300,000 Sek | 25.9 |
| 300,001–400,000 Sek | 31.6 | |
| More than 400,000 Sek | 42.5 | |
| Region of birth | A Scandinavian country | 90.8 |
| Other countries | 9.20 | |
| Sector | Private | 47.1 |
| Public | 44.7 | |
| Other | 5.60 | |
| Not stated | 2.60 | |
| Weekly work hours | <21 | 3.90 |
| 21–30 | 5.40 | |
| 31–40 | 55.1 | |
| 41–50 | 30.7 | |
| >50 | 2.80 | |
| not stated | 2.10 | |
| Work situation | Have direct contact with patients. customers, clients, pupils etc. at work | 81.1 |
| Non-managerial position | 66.8 | |
| Normal work time | Day hours between 6–18 o’clock | 78.5 |
| Size of local workplace (span of nearest leader) | <5 people | 14.3 |
| 5–10 people | 22.4 | |
| 11–20 people | 25.1 | |
| 21–40 people | 22.5 | |
| 41–60 people | 6.90 | |
| >60 people | 5.20 | |
| Do not know/not stated | 3.60 |
| Population Benchmarks | Scale Characteristics | |||||||
|---|---|---|---|---|---|---|---|---|
| Dimension and Abbreviation | Mean | SD | No. of Items | Reliability Coefficient 1 | Floor % | Ceiling % | Scale Missing % | |
| Quantitative Demands | QD | 40.9 | 22.1 | 3 | 0.85 | 4.9 | 1.1 | 1.2 |
| Work Pace | WP | 59.9 | 20.5 | 2 | 0.70 | 0.6 | 4.9 | 0.9 |
| Emotional Demands | ED | 46.8 | 25.5 | 3 | 0.86 | 3.9 | 1.5 | 1.1 |
| Influence | IN | 50.2 | 20.1 | 4 | 0.75 | 0.9 | 0.6 | 1.1 |
| Possibilities for Development | PD | 70.4 | 20.0 | 3 | 0.75 | 0.4 | 10.1 | 0.4 |
| Variation of Work | VA | 68.0 | 22.5 | 1 | 1.9 | 16.7 | 1.1 | |
| Meaning of Work | MW | 78.3 | 22.4 | 1 | 0.9 | 40.6 | 1.6 | |
| Predictability | PR | 60.2 | 21.3 | 2 | 0.73 | 1.5 | 5.3 | 1.1 |
| Recognition | RE | 65.6 | 23.3 | 2 | 0.74 | 2.0 | 11.2 | 1.1 |
| Role Clarity | CL | 78.1 | 16.7 | 3 | 0.78 | 0.0 | 16.1 | 0.2 |
| Role Conflicts | CO | 42.2 | 19.6 | 3 | 0.71 | 2.0 | 0.5 | 0.6 |
| (incl. illegitimate tasks) | ||||||||
| Quality of Leadership | QL | 54.1 | 24.8 | 3 | 0.87 | 4.6 | 4.8 | 0.9 |
| Social Support from Supervisor | SS | 75.3 | 24.5 | 2 | 0.88 | 1.8 | 30.3 | 0.4 |
| Social Support from Colleagues | SC | 80.2 | 19.6 | 2 | 0.81 | 0.4 | 32.5 | 0.4 |
| Sense of Community at Work | SW | 79.9 | 15.0 | 3 | 0.78 | 0.1 | 17.7 | 0.4 |
| Commitment to the Workplace | CW | 64.7 | 24.5 | 3 | 0.83 | 1.1 | 9.8 | 1.2 |
| Work Engagement | WE | 69.4 | 19.2 | 3 | 0.84 | 0.4 | 5.4 | 0.9 |
| Job Insecurity | JI | 20.2 | 20.9 | 3 | 0.75 | 34.8 | 0.4 | 1.1 |
| Insecurity over Working Conditions | IW | 24.9 | 23.2 | 2 | 0.77 | 28.1 | 1.4 | 1.1 |
| Quality of Work | QW | 68.2 | 18.6 | 2 | 0.69 | 0.6 | 6.6 | 0.4 |
| Job Satisfaction | JS | 64.4 | 20.2 | 4 | 0.84 | 0.7 | 5.2 | 0.8 |
| Work Life Conflict | WF | 39.7 | 25.7 | 3 | 0.90 | 9.5 | 3.6 | 0.6 |
| Horizontal Trust | TE | 71.3 | 20.1 | 1 | 1.2 | 17.6 | 1.4 | |
| Vertical Trust | TM | 69.3 | 19.0 | 3 | 0.77 | 0.4 | 7.0 | 0.9 |
| Organizational Justice | JU | 59.7 | 20.2 | 3 | 0.78 | 0.8 | 3.5 | 0.9 |
| Self-Rated Health | GH | 61.3 | 23.9 | 1 | 2.6 | 12.8 | 1.0 | |
| Stress | ST | 36.0 | 24.2 | 3 | 0.86 | 11.2 | 1.3 | 1.2 |
| Burnout | BO | 36.2 | 24.7 | 3 | 0.88 | 10.2 | 1.4 | 1.0 |
| Threats of Violence | TV | 10.5% | 1 | 1.1 | ||||
| Physical Violence | PV | 5.3% | 1 | 1.4 | ||||
| Bullying | BU | 10.3% | 1 | 1.4 | ||||
| Sexual Harassment | SH | 6.0% | 1 | 1.2 | ||||
| Cyber Bullying | HSM | 2.7% | 1 | 1.2 | ||||
| Dimension 2 | Sex | Work Sector | Kind of Work | |||||||||
|---|---|---|---|---|---|---|---|---|---|---|---|---|
| Men (n = 1250) | Women (n = 1597) | p | Cohen’s d | Private Sector (n = 1341) | Public Sector (n = 1271) | p | Cohen’s d | White Collar (n = 1630) | Blue Collar (n = 428) | p | Cohen’s d | |
| QD | 41.2 | 43.2 | * | 0.1 | 40.6 | 44.3 | ** | 0.2 | 47.7 | 33.0 | ** | 0.7 |
| WP | 57.8 | 60.9 | ** | 0.2 | 59.7 | 59.6 | 0.0 | 60.1 | 58.0 | 0.1 | ||
| ED | 39.4 | 54.1 | ** | 0.6 | 38.5 | 57.1 | ** | 0.8 | 49.9 | 33.2 | ** | 0.7 |
| IN | 53.9 | 48.6 | ** | 0.3 | 52.4 | 49.2 | ** | 0.2 | 54.6 | 46.1 | ** | 0.5 |
| PD | 70.2 | 71.7 | * | 0.1 | 70.0 | 72.5 | ** | 0.1 | 75.4 | 62.6 | ** | 0.7 |
| VA | 67.7 | 71.3 | ** | 0.2 | 67.9 | 71.8 | ** | 0.2 | 74.1 | 59.6 | ** | 0.7 |
| MW | 76.0 | 82.2 | ** | 0.3 | 74.5 | 84.9 | ** | 0.5 | 81.8 | 70.5 | ** | 0.6 |
| PR | 60.3 | 60.9 | 0.0 | 60.4 | 61.2 | 0.0 | 61.6 | 58.0 | * | 0.2 | ||
| RE | 66.9 | 64.9 | * | 0.1 | 66.6 | 65.0 | 0.1 | 67.8 | 62.5 | ** | 0.2 | |
| CL | 76.8 | 78.9 | ** | 0.1 | 77.7 | 78.7 | 0.1 | 76.5 | 79.6 | ** | 0.2 | |
| CO | 42.5 | 41.3 | 0.1 | 40.1 | 43.9 | ** | 0.2 | 43.0 | 39.8 | * | 0.2 | |
| QL | 54.0 | 54.1 | 0.0 | 54.3 | 53.8 | 0.0 | 54.9 | 51.6 | * | 0.1 | ||
| SS | 75.2 | 75.0 | 0.0 | 76.6 | 73.3 | ** | 0.1 | 75.8 | 72.1 | * | 0.2 | |
| SC | 79.2 | 81.3 | * | 0.1 | 79.9 | 81.0 | 0.1 | 81.4 | 77.0 | ** | 0.2 | |
| SW | 80.1 | 80.0 | 0.0 | 81.1 | 79.1 | ** | 0.1 | 80.6 | 79.1 | 0.1 | ||
| CW | 65.6 | 65.2 | 0.0 | 65.8 | 65.0 | 0.0 | 66.9 | 62.4 | ** | 0.2 | ||
| WE | 68.3 | 71.9 | ** | 0.2 | 69.0 | 71.5 | ** | 0.1 | 71.8 | 65.0 | ** | 0.4 |
| JI | 20.3 | 17.8 | ** | 0.1 | 21.7 | 14.9 | ** | 0.3 | 15.2 | 26.3 | ** | 0.6 |
| IW | 23.9 | 24.5 | 0.0 | 23.8 | 24.7 | 0.0 | 22.6 | 26.2 | * | 0.2 | ||
| QW | 68.5 | 67.4 | 0.1 | 69.4 | 66.2 | ** | 0.2 | 67.6 | 69.9 | * | 0.1 | |
| JS | 65.3 | 64.8 | 0.0 | 65.8 | 64.5 | 0.1 | 67.2 | 61.6 | ** | 0.3 | ||
| WF | 37.5 | 41.7 | ** | 0.2 | 38.2 | 41.6 | ** | 0.1 | 42.0 | 35.9 | ** | 0.2 |
| TE | 72.5 | 70.7 | * | 0.1 | 72.3 | 70.5 | * | 0.1 | 73.5 | 68.3 | ** | 0.3 |
| TM | 68.5 | 70.2 | * | 0.1 | 69.9 | 69.3 | 0.0 | 70.6 | 66.5 | ** | 0.2 | |
| JU | 60.6 | 58.5 | * | 0.1 | 61.0 | 57.8 | ** | 0.2 | 60.6 | 57.9 | * | 0.1 |
| GH | 63.2 | 60.6 | * | 0.1 | 63.3 | 60.2 | ** | 0.1 | 63.9 | 58.2 | ** | 0.2 |
| ST | 32.6 | 37.7 | ** | 0.2 | 33.9 | 36.9 | * | 0.1 | 36.8 | 31.7 | ** | 0.2 |
| BO | 31.2 | 38.1 | ** | 0.3 | 32.9 | 37.4 | ** | 0.2 | 34.4 | 33.9 | 0.0 | |
| TV | 8.1% | 12.5% | ** | 5.3% | 16.4% | ** | 9.6% | 6.9% | ||||
| PV | 2.7% | 7.5% | ** | 1.7% | 9.4% | ** | 4.2% | 1.4% | * | |||
| BU | 8.4% | 11.8% | * | 9.1% | 11.4% | * | 9.0% | 10.1% | ||||
| SH | 2.4% | 6.8% | ** | 4.5% | 5.1% | 4.2% | 4.0% | |||||
| HSM | 2.8% | 2.8% | 1.7% | 3.8% | ** | 3.3% | 1.4% | * | ||||
| Dimension 1 | ISCO 1 Managers | ISCO 2 Professionals | ISCO 3 Technicians and Associate Professionals | ISCO 4 Clerical Support Workers | ISCO 5 Services and Support Workers | ISCO 7 Craft and Related Trades Workers | ISCO 8 Plant and Machine Operators and Assemblers | ISCO 9 Elementary Occupations | ||||||||||||||||
|---|---|---|---|---|---|---|---|---|---|---|---|---|---|---|---|---|---|---|---|---|---|---|---|---|
| Mean | SD | RC | Mean | SD | RC | Mean | SD | RC | Mean | SD | RC | Mean | SD | RC | Mean | SD | RC | Mean | SD | RC | Mean | SD | RC | |
| QD | 51.5 | 19.8 | 0.86 | 48.5 | 20.0 | 0.82 | 43.8 | 20.4 | 0.84 | 39.7 | 21.6 | 0.83 | 34.5 | 22.1 | 0.85 | 36.0 | 20.3 | 0.83 | 32.0 | 19.6 | 0.82 | 27.8 | 20.2 | 0.80 |
| WP | 63.3 | 18.0 | 0.68 | 60.5 | 18.7 | 0.70 | 57.6 | 18.7 | 0.71 | 57.1 | 20.3 | 0.72 | 60.0 | 21.9 | 0.76 | 58.1 | 18.4 | 0.62 | 59.0 | 21.5 | 0.74 | 58.6 | 23.2 | 0.46 |
| ED | 53.7 | 20.6 | 0.82 | 53.1 | 25.5 | 0.87 | 40.3 | 23.1 | 0.82 | 37.4 | 24.2 | 0.85 | 59.5 | 22.8 | 0.82 | 31.4 | 18.4 | 0.78 | 34.7 | 21.0 | 0.77 | 34.4 | 22.5 | 0.72 |
| IN | 62.1 | 17.0 | 0.74 | 53.8 | 17.5 | 0.73 | 52.8 | 17.6 | 0.71 | 43.7 | 20.2 | 0.77 | 45.2 | 20.1 | 0.73 | 49.5 | 18.8 | 0.72 | 41.0 | 22.4 | 0.83 | 45.8 | 21.6 | 0.75 |
| PD | 79.3 | 15.7 | 0.72 | 76.3 | 17.1 | 0.73 | 71.1 | 18.1 | 0.74 | 62.8 | 21.9 | 0.77 | 67.4 | 19.1 | 0.72 | 66.2 | 19.2 | 0.69 | 58.5 | 22.4 | 0.74 | 61.4 | 21.5 | 0.72 |
| VA | 79.4 | 15.3 | 74.8 | 18.0 | 69.9 | 18.6 | - | 62.3 | 23.3 | - | 67.0 | 22.8 | - | 66.7 | 20.9 | - | 53.9 | 27.5 | - | 54.7 | 27.3 | - | ||
| MW | 83.3 | 16.0 | 83.6 | 18.9 | 76.9 | 19.7 | - | 72.7 | 25.1 | - | 83.5 | 20.2 | - | 71.2 | 23.5 | - | 67.7 | 24.7 | - | 72.7 | 25.0 | - | ||
| PR | 68.4 | 19.1 | 0.66 | 60.8 | 19.8 | 0.72 | 60.0 | 20.0 | 0.70 | 58.4 | 20.4 | 0.69 | 61.3 | 21.2 | 0.76 | 56.2 | 20.4 | 0.75 | 57.1 | 24.0 | 0.81 | 62.1 | 23.8 | 0.73 |
| RE | 73.2 | 19.2 | 0.68 | 66.9 | 21.6 | 0.70 | 66.9 | 22.1 | 0.73 | 62.1 | 23.8 | 0.79 | 63.3 | 24.4 | 0.77 | 62.9 | 22.4 | 0.69 | 60.6 | 25.5 | 0.78 | 63.1 | 24.7 | 0.66 |
| CL | 78.7 | 15.2 | 0.77 | 76.0 | 17.0 | 0.79 | 76.4 | 17.3 | 0.81 | 77.4 | 16.1 | 0.74 | 82.8 | 14.3 | 0.76 | 77.3 | 16.6 | 0.79 | 80.7 | 14.3 | 0.64 | 81.9 | 17.3 | 0.77 |
| CO | 41.9 | 16.2 | 0.61 | 43.9 | 19.1 | 0.71 | 41.3 | 19.1 | 0.72 | 37.4 | 18.5 | 0.65 | 42.1 | 20.0 | 0.70 | 40.7 | 17.5 | 0.65 | 40.6 | 22.9 | 0.82 | 37.7 | 21.2 | 0.64 |
| QL | 57.7 | 22.1 | 0.84 | 54.3 | 22.9 | 0.84 | 55.0 | 25.2 | 0.87 | 52.4 | 26.1 | 0.88 | 54.0 | 25.9 | 0.90 | 48.7 | 24.3 | 0.86 | 50.4 | 25.7 | 0.87 | 58.1 | 24.9 | 0.88 |
| SS | 77.7 | 20.9 | 0.81 | 75.2 | 23.5 | 0.88 | 76.0 | 24.6 | 0.89 | 76.7 | 23.5 | 0.85 | 75.1 | 24.9 | 0.89 | 71.4 | 25.5 | 0.82 | 70.3 | 27.7 | 0.89 | 73.3 | 27.0 | 0.95 |
| SC | 79.6 | 9.9.2 | 0.76 | 81.8 | 18.3 | 0.82 | 81.6 | 18.0 | 0.79 | 78.4 | 19.5 | 0.79 | 80.8 | 19.1 | 0.83 | 79.5 | 18.2 | 0.81 | 74.5 | 23.3 | 0.83 | 75.9 | 22.9 | 0.81 |
| SW | 82.3 | 12.8 | 0.76 | 80.1 | 14.0 | 0.76 | 81.1 | 14.5 | 0.79 | 78.3 | 16.0 | 0.80 | 79.7 | 15.2 | 0.80 | 80.3 | 13.0 | 0.74 | 76.3 | 17.8 | 0.83 | 81.2 | 16.4 | 0.77 |
| CW | 73.3 | 22.1 | 0.85 | 65.7 | 22.9 | 0.82 | 66.5 | 23.8 | 0.83 | 62.8 | 25.7 | 0.84 | 63.7 | 25.4 | 0.83 | 62.8 | 21.8 | 0.76 | 60.8 | 24.7 | 0.82 | 62.2 | 25.4 | 0.81 |
| WE | 75.2 | 16.6 | 0.86 | 71.8 | 16.8 | 0.82 | 69.9 | 18.0 | 0.85 | 67.0 | 20.1 | 0.82 | 71.4 | 18.7 | 0.84 | 64.3 | 19.7 | 0.85 | 64.1 | 21.7 | 0.85 | 66.5 | 21.4 | 0.87 |
| JI | 17.2 | 18.6 | 0.79 | 12.7 | 16.7 | 0.73 | 20.0 | 19.7 | 0.71 | 27.3 | 21.5 | 0.73 | 20.8 | 22.4 | 0.73 | 21.0 | 20.0 | 0.71 | 29.3 | 24.0 | 0.76 | 31.5 | 24.4 | 0.74 |
| IW | 19.8 | 21.5 | 0.85 | 22.6 | 21.5 | 0.75 | 24.0 | 22.9 | 0.80 | 25.5 | 22.6 | 0.78 | 27.5 | 24.1 | 0.71 | 22.4 | 21.4 | 0.81 | 29.8 | 26.3 | 0.82 | 29.7 | 26.6 | 0.81 |
| QW | 70.1 | 14.9 | 0.64 | 66.6 | 17.5 | 0.68 | 68.5 | 18.4 | 0.72 | 66.6 | 19.5 | 0.74 | 67.2 | 19.3 | 0.69 | 69.0 | 16.6 | 0.74 | 69.5 | 18.9 | 0.64 | 71.6 | 19.3 | 0.63 |
| JS | 72.7 | 18.0 | 0.84 | 66.6 | 18.9 | 0.81 | 65.6 | 19.0 | 0.84 | 62.0 | 20.2 | 0.85 | 61.8 | 20.6 | 0.86 | 62.9 | 17.1 | 0.83 | 60.4 | 21.2 | 0.91 | 60.4 | 21.1 | 0.88 |
| WF | 44.5 | 24.7 | 0.92 | 43.7 | 24.9 | 0.90 | 36.7 | 23.8 | 0.90 | 36.5 | 24.6 | 0.90 | 38.3 | 27.4 | 0.91 | 35.3 | 23.7 | 0.88 | 39.7 | 27.0 | 0.90 | 32.0 | 25.7 | 0.89 |
| TE | 72.3 | 18.0 | - | 73.3 | 17.7 | - | 74.4 | 18.9 | - | 67.0 | 20.9 | - | 69.2 | 20.4 | - | 68.9 | 19.2 | - | 67.0 | 24.5 | - | 70.1 | 20.7 | - |
| TM | 74.8 | 14.7 | 0.74 | 70.2 | 18.0 | 0.77 | 69.4 | 19.0 | 0.81 | 67.5 | 18.5 | 0.77 | 69.0 | 18.5 | 0.72 | 63.9 | 18.8 | 0.74 | 65.8 | 20.6 | 0.79 | 70.5 | 19.1 | 0.64 |
| JU | 67.5 | 15.3 | 0.74 | 59.3 | 17.8 | 0.74 | 60.1 | 19.1 | 0.79 | 55.1 | 21.1 | 0.79 | 58.5 | 21.4 | 0.79 | 55.8 | 20.0 | 0.78 | 57.7 | 22.9 | 0.84 | 60.2 | 22.6 | 0.78 |
| GH | 67.4 | 22.1 | - | 62.3 | 22.9 | - | 65.7 | 23.0 | - | 59.5 | 24.4 | - | 57.5 | 24.6 | - | 59.5 | 23.0 | - | 56.4 | 25.1 | - | 59.8 | 25.5 | - |
| ST | 36.8 | 20.9 | 0.81 | 38.3 | 24.0 | 0.87 | 33.2 | 24.4 | 0.87 | 35.0 | 23.7 | 0.86 | 34.8 | 25.4 | 0.87 | 31.4 | 22.6 | 0.84 | 32.0 | 24.3 | 0.87 | 33.3 | 24.6 | 0.81 |
| BO | 29.5 | 20.3 | 0.83 | 37.0 | 23.4 | 0.87 | 30.7 | 23.7 | 0.87 | 35.1 | 25.0 | 0.89 | 39.1 | 26.2 | 0.90 | 31.6 | 22.4 | 0.85 | 34.9 | 25.9 | 0.91 | 36.9 | 26.0 | 0.88 |
| TV | 8.2% | 10.5% | 8.2% | 8.2% | 18.9% | 2.4% | 11.3% | 8.1% | ||||||||||||||||
| PV | 2.3% | 5.0% | 3.4% | 2.3% | 15.2% | 0.0% | 2.0% | 3.6% | ||||||||||||||||
| BU | 5.0% | 9.6% | 9.6% | 14.2% | 12.5% | 9.6% | 8.8% | 14.5% | ||||||||||||||||
| SH | 1.4% | 4.6% | 4.8% | 2.3% | 9.3% | 3.0% | 3.3% | 8.2% | ||||||||||||||||
| HSM | 6.4% | 3.5% | 1.2% | 4.1% | 2.1% | 1.2% | 1.3% | 2.4% | ||||||||||||||||
| Dimension 1 | QD | WP | ED | IN | PD | VA | MW | PR | RE | CL | CO | QL | SS | SC | SW | CW | WE | JI | IW | QW | JS | WF | TE | TM | JU | GH | ST | BO |
|---|---|---|---|---|---|---|---|---|---|---|---|---|---|---|---|---|---|---|---|---|---|---|---|---|---|---|---|---|
| QD | 1.00 | |||||||||||||||||||||||||||
| WP | 0.40 | 1.00 | ||||||||||||||||||||||||||
| ED | 0.29 | 0.32 | 1.00 | |||||||||||||||||||||||||
| IN | −0.03 | −0.11 | −0.09 | 1.00 | ||||||||||||||||||||||||
| PD | 0.06 | 0.02 | 0.05 | 0.51 | 1.00 | |||||||||||||||||||||||
| VA | 0.13 | 0.02 | 0.12 | 0.37 | 0.50 | 1.00 | ||||||||||||||||||||||
| MW | −0.02 | 0.03 | 0.21 | 0.27 | 0.50 | 0.36 | 1.00 | |||||||||||||||||||||
| PR | −0.21 | −0.15 | −0.13 | 0.39 | 0.43 | 0.20 | 0.34 | 1.00 | ||||||||||||||||||||
| RE | −0.19 | −0.15 | −0.16 | 0.48 | 0.49 | 0.27 | 0.35 | 0.67 | 1.00 | |||||||||||||||||||
| CL | -0.26 | 0.04 | −0.01 | 0.18 | 0.32 | 0.10 | 0.41 | 0.46 | 0.38 | 1.00 | ||||||||||||||||||
| CO | 0.41 | 0.30 | 0.36 | −0.22 | −0.20 | −0.10 | −0.22 | −0.44 | −0.41 | −0.32 | 1.00 | |||||||||||||||||
| QL | −0.18 | −0.12 | −0.12 | 0.35 | 0.42 | 0.20 | 0.29 | 0.62 | 0.64 | 0.35 | −0.38 | 1.00 | ||||||||||||||||
| SS | −0.19 | −0.15 | −0.17 | 0.38 | 0.41 | 0.20 | 0.25 | 0.55 | 0.62 | 0.35 | −0.36 | 0.67 | 1.00 | |||||||||||||||
| SC | −0.15 | −0.15 | −0.10 | 0.32 | 0.39 | 0.23 | 0.29 | 0.40 | 0.43 | 0.31 | −0.29 | 0.38 | 0.58 | 1.00 | ||||||||||||||
| SW | −0.18 | −0.09 | −0.16 | 0.36 | 0.39 | 0.22 | 0.28 | 0.45 | 0.51 | 0.37 | −0.33 | 0.42 | 0.48 | 0.62 | 1.00 | |||||||||||||
| CW | −0.24 | −0.19 | −0.17 | 0.46 | 0.54 | 0.32 | 0.47 | 0.65 | 0.72 | 0.41 | −0.50 | 0.62 | 0.56 | 0.46 | 0.54 | 1.00 | ||||||||||||
| WE | −0.05 | 0.07 | 0.10 | 0.36 | 0.54 | 0.35 | 0.55 | 0.43 | 0.44 | 0.39 | −0.27 | 0.39 | 0.31 | 0.28 | 0.37 | 0.58 | 1.00 | |||||||||||
| JI | −0.01 | 0.03 | −0.09 | −0.18 | −0.32 | −0.26 | −0.28 | −0.20 | −0.26 | −0.17 | 0.12 | −0.15 | −0.17 | −0.23 | −0.22 | −0.27 | −0.21 | 1.00 | ||||||||||
| IW | 0.17 | 0.12 | 0.15 | −0.28 | −0.31 | −0.21 | −0.24 | −0.38 | −0.42 | −0.27 | 0.33 | −0.29 | −0.31 | −0.26 | −0.31 | −0.41 | −0.26 | 0.55 | 1.00 | |||||||||
| QW | −0.34 | −0.20 | −0.23 | 0.36 | 0.41 | 0.19 | 0.35 | 0.58 | 0.57 | 0.45 | −0.49 | 0.54 | 0.49 | 0.41 | 0.49 | 0.67 | 0.43 | −0.16 | −0.33 | 1.00 | ||||||||
| JS | −0.16 | −0.14 | −0.13 | 0.48 | 0.63 | 0.37 | 0.45 | 0.57 | 0.63 | 0.38 | −0.43 | 0.55 | 0.49 | 0.43 | 0.48 | 0.73 | 0.56 | −0.30 | −0.41 | 0.59 | 1.00 | |||||||
| WF | 0.49 | 0.42 | 0.36 | −0.21 | −0.15 | −0.05 | −0.14 | −0.37 | −0.39 | −0.27 | 0.45 | −0.32 | −0.34 | −0.32 | −0.34 | −0.48 | −0.22 | 0.17 | 0.36 | −0.43 | −0.38 | 1.00 | ||||||
| TE | −0.13 | −0.13 | −0.15 | 0.25 | 0.27 | 0.17 | 0.23 | 0.32 | 0.41 | 0.24 | −0.28 | 0.34 | 0.33 | 0.45 | 0.51 | 0.41 | 0.22 | −0.20 | −0.25 | 0.42 | 0.35 | −0.26 | 1.00 | |||||
| TM | −0.18 | −0.15 | −0.15 | 0.38 | 0.43 | 0.24 | 0.35 | 0.61 | 0.65 | 0.40 | −0.44 | 0.60 | 0.57 | 0.46 | 0.52 | 0.64 | 0.40 | −0.24 | −0.39 | 0.61 | 0.58 | −0.35 | 0.53 | 1.00 | ||||
| JU | −0.22 | −0.18 | −0.18 | 0.45 | 0.46 | 0.23 | 0.32 | 0.65 | 0.74 | 0.38 | −0.42 | 0.71 | 0.60 | 0.45 | 0.51 | 0.68 | 0.41 | −0.18 | −0.36 | 0.64 | 0.62 | −0.38 | 0.48 | 0.76 | 1.00 | |||
| GH | −0.13 | −0.11 | −0.15 | 0.22 | 0.25 | 0.15 | 0.17 | 0.26 | 0.29 | 0.17 | −0.20 | 0.23 | 0.21 | 0.23 | 0.29 | 0.32 | 0.30 | −0.18 | −0.25 | 0.27 | 0.35 | −0.35 | 0.23 | 0.24 | 0.27 | 1.00 | ||
| ST | 0.40 | 0.34 | 0.33 | −0.22 | −0.18 | −0.10 | −0.16 | −0.35 | −0.38 | −0.26 | 0.43 | −0.32 | −0.31 | −0.31 | −0.35 | −0.48 | −0.27 | 0.17 | 0.32 | −0.41 | −0.38 | 0.66 | −0.26 | −0.33 | −0.37 | −0.41 | 1.00 | |
| BO | 0.34 | 0.30 | 0.34 | −0.29 | −0.26 | −0.17 | −0.20 | −0.39 | −0.42 | −0.25 | 0.44 | −0.34 | −0.33 | −0.31 | −0.35 | −0.51 | −0.34 | 0.21 | 0.37 | −0.42 | −0.46 | 0.66 | −0.26 | −0.35 | −0.40 | −0.50 | 0.79 | 1.00 |
| Dimension 1 | QD | WP | ED | IN | PD | VA | MW | PR | RE | CL | CO | QL | SS | SC | SW | CW | WE | JI | IW | QW | JS | WF | TE | TM | JU | GH | ST | BO |
|---|---|---|---|---|---|---|---|---|---|---|---|---|---|---|---|---|---|---|---|---|---|---|---|---|---|---|---|---|
| QD | 0.48 | 0.37 | −0.12 | −0.10 | 0.01 | −0.09 | −0.28 | −0.21 | −0.27 | 0.40 | −0.23 | −0.23 | −0.19 | −0.18 | −0.28 | −0.12 | 0.01 | 0.21 | −0.31 | −0.28 | 0.43 | −0.10 | −0.22 | −0.27 | −0.24 | 0.41 | 0.39 | |
| WP | 0.53 | 0.34 | −0.21 | −0.12 | −0.06 | −0.09 | −0.26 | −0.23 | −0.11 | 0.38 | −0.20 | −0.21 | −0.15 | −0.12 | −0.29 | −0.01 | −0.03 | 0.17 | −0.22 | −0.25 | 0.38 | −0.09 | −0.25 | −0.27 | −0.13 | 0.37 | 0.34 | |
| ED | 0.46 | 0.30 | −0.04 | −0.01 | 0.09 | 0.02 | −0.20 | −0.16 | −0.15 | 0.34 | −0.19 | −0.16 | −0.14 | −0.16 | −0.23 | −0.01 | −0.05 | 0.19 | −0.20 | −0.20 | 0.37 | −0.13 | −0.20 | −0.24 | −0.22 | 0.37 | 0.37 | |
| IN | 0.08 | −0.37 | 0.04 | 0.60 | 0.49 | 0.45 | 0.46 | 0.54 | 0.23 | −0.33 | 0.48 | 0.44 | 0.40 | 0.39 | 0.54 | 0.38 | −0.22 | −0.34 | 0.34 | 0.53 | −0.27 | 0.30 | 0.48 | 0.53 | 0.26 | −0.29 | −0.32 | |
| PD | 0.31 | −0.11 | 0.25 | 0.78 | 0.55 | 0.61 | 0.50 | 0.58 | 0.30 | −0.35 | 0.52 | 0.46 | 0.44 | 0.44 | 0.60 | 0.53 | −0.26 | −0.35 | 0.42 | 0.68 | −0.28 | 0.38 | 0.52 | 0.54 | 0.28 | −0.33 | −0.34 | |
| VA | 0.37 | −0.19 | 0.39 | 0.70 | 0.73 | 0.48 | 0.24 | 0.35 | 0.11 | −0.21 | 0.29 | 0.27 | 0.27 | 0.30 | 0.39 | 0.40 | −0.20 | −0.20 | 0.26 | 0.41 | −0.11 | 0.26 | 0.32 | 0.31 | 0.19 | −0.21 | −0.23 | |
| MW | 0.15 | −0.21 | 0.49 | 0.64 | 0.74 | 0.75 | 0.38 | 0.46 | 0.37 | −0.35 | 0.38 | 0.35 | 0.37 | 0.36 | 0.49 | 0.59 | −0.24 | −0.24 | 0.39 | 0.55 | −0.24 | 0.29 | 0.41 | 0.40 | 0.26 | −0.30 | −0.31 | |
| PR | −0.17 | −0.42 | −0.22 | 0.56 | 0.49 | 0.22 | 0.40 | 0.71 | 0.48 | −0.51 | 0.66 | 0.59 | 0.37 | 0.40 | 0.65 | 0.35 | −0.17 | −0.41 | 0.52 | 0.62 | −0.38 | 0.32 | 0.69 | 0.70 | 0.27 | −0.40 | −0.40 | |
| RE | −0.08 | −0.35 | −0.03 | 0.79 | 0.69 | 0.48 | 0.60 | 0.80 | 0.41 | −0.45 | 0.67 | 0.65 | 0.48 | 0.48 | 0.72 | 0.44 | −0.26 | −0.44 | 0.51 | 0.67 | −0.37 | 0.41 | 0.73 | 0.78 | 0.33 | −0.41 | −0.42 | |
| CL | −0.40 | −0.06 | 0.04 | −0.06 | −0.12 | −0.17 | 0.14 | 0.43 | 0.23 | −0.35 | 0.41 | 0.37 | 0.31 | 0.34 | 0.38 | 0.31 | −0.16 | −0.31 | 0.44 | 0.43 | −0.30 | 0.19 | 0.37 | 0.41 | 0.20 | −0.30 | −0.27 | |
| CO | 0.39 | 0.57 | 0.35 | −0.54 | −0.44 | −0.27 | −0.38 | −0.75 | −0.64 | −0.23 | −0.45 | −0.42 | −0.29 | −0.31 | −0.52 | −0.34 | 0.12 | 0.35 | −0.44 | −0.52 | 0.46 | −0.25 | −0.49 | −0.49 | −0.27 | 0.44 | 0.43 | |
| QL | −0.12 | −0.33 | −0.10 | 0.58 | 0.60 | 0.29 | 0.38 | 0.79 | 0.72 | 0.23 | −0.64 | 0.79 | 0.41 | 0.39 | 0.63 | 0.36 | −0.13 | −0.38 | 0.48 | 0.60 | −0.30 | 0.35 | 0.65 | 0.71 | 0.28 | −0.35 | −0.37 | |
| SS | −0.19 | −0.38 | −0.08 | 0.55 | 0.54 | 0.24 | 0.48 | 0.86 | 0.76 | 0.37 | −0.72 | 0.86 | 0.45 | 0.41 | 0.59 | 0.35 | −0.13 | −0.37 | 0.45 | 0.57 | −0.31 | 0.33 | 0.63 | 0.66 | 0.28 | −0.35 | −0.36 | |
| SC | 0.13 | −0.13 | 0.07 | 0.68 | 0.55 | 0.46 | 0.45 | 0.40 | 0.60 | 0.10 | −0.29 | 0.43 | 0.45 | 0.66 | 0.46 | 0.36 | −0.20 | −0.27 | 0.39 | 0.45 | −0.30 | 0.50 | 0.38 | 0.46 | 0.27 | −0.32 | −0.29 | |
| SW | 0.01 | −0.18 | −0.07 | 0.60 | 0.44 | 0.48 | 0.33 | 0.30 | 0.49 | −0.06 | −0.26 | 0.42 | 0.37 | 0.75 | 0.51 | 0.36 | −0.25 | −0.28 | 0.44 | 0.48 | −0.26 | 0.52 | 0.40 | 0.47 | 0.29 | −0.36 | −0.33 | |
| CW | −0.09 | −0.36 | −0.13 | 0.75 | 0.68 | 0.52 | 0.51 | 0.82 | 0.85 | 0.26 | −0.69 | 0.81 | 0.77 | 0.58 | 0.59 | 0.50 | −0.21 | −0.41 | 0.54 | 0.76 | −0.43 | 0.40 | 0.69 | 0.71 | 0.34 | −0.49 | −0.51 | |
| WE | 0.10 | −0.11 | 0.36 | 0.52 | 0.61 | 0.64 | 0.83 | 0.30 | 0.49 | 0.18 | −0.33 | 0.35 | 0.42 | 0.49 | 0.39 | 0.46 | −0.11 | −0.21 | 0.34 | 0.55 | −0.32 | 0.24 | 0.39 | 0.38 | 0.34 | −0.37 | −0.41 | |
| JI | −0.53 | −0.44 | −0.34 | −0.38 | −0.48 | −0.48 | −0.38 | −0.01 | −0.31 | 0.03 | −0.20 | 0.04 | 0.08 | −0.43 | −0.34 | −0.24 | −0.31 | 0.55 | −0.14 | −0.23 | 0.16 | −0.23 | −0.22 | −0.19 | −0.25 | 0.20 | 0.22 | |
| IW | 0.01 | 0.01 | 0.29 | −0.52 | −0.42 | −0.21 | −0.17 | −0.49 | −0.56 | −0.26 | 0.41 | −0.33 | −0.33 | −0.46 | −0.36 | −0.61 | −0.10 | 0.56 | −0.32 | −0.44 | 0.31 | −0.26 | −0.46 | −0.43 | −0.27 | 0.39 | 0.38 | |
| QW | −0.17 | −0.29 | −0.08 | 0.64 | 0.54 | 0.42 | 0.49 | 0.73 | 0.79 | 0.44 | −0.70 | 0.64 | 0.71 | 0.67 | 0.55 | 0.79 | 0.44 | −0.28 | −0.60 | 0.56 | −0.35 | 0.38 | 0.55 | 0.55 | 0.31 | −0.40 | −0.38 | |
| JS | −0.13 | −0.37 | −0.11 | 0.64 | 0.64 | 0.49 | 0.55 | 0.81 | 0.74 | 0.30 | −0.76 | 0.68 | 0.77 | 0.41 | 0.44 | 0.87 | 0.42 | −0.14 | −0.60 | 0.75 | −0.48 | 0.39 | 0.65 | 0.66 | 0.41 | −0.52 | −0.53 | |
| WF | 0.31 | 0.41 | 0.51 | −0.42 | −0.21 | −0.03 | −0.14 | −0.50 | −0.49 | −0.03 | 0.59 | −0.33 | −0.55 | −0.34 | −0.32 | −0.46 | −0.24 | 0.00 | 0.44 | −0.48 | −0.65 | −0.20 | −0.37 | −0.40 | −0.43 | 0.66 | 0.63 | |
| TE | 0.22 | −0.12 | 0.00 | 0.65 | 0.59 | 0.52 | 0.35 | 0.26 | 0.53 | −0.17 | −0.24 | 0.34 | 0.31 | 0.72 | 0.78 | 0.58 | 0.23 | −0.48 | −0.46 | 0.55 | 0.45 | −0.23 | 0.43 | 0.49 | 0.25 | −0.27 | −0.27 | |
| TM | −0.17 | −0.37 | −0.16 | 0.66 | 0.60 | 0.35 | 0.49 | 0.89 | 0.90 | 0.33 | −0.74 | 0.76 | 0.83 | 0.44 | 0.36 | 0.85 | 0.35 | −0.19 | −0.60 | 0.75 | 0.85 | −0.57 | 0.42 | 0.81 | 0.30 | −0.40 | −0.41 | |
| JU | −0.15 | −0.36 | −0.17 | 0.79 | 0.65 | 0.41 | 0.49 | 0.81 | 0.94 | 0.26 | −0.69 | 0.79 | 0.78 | 0.66 | 0.54 | 0.90 | 0.44 | −0.27 | −0.62 | 0.84 | 0.76 | −0.52 | 0.56 | 0.89 | 0.33 | −0.43 | −0.44 | |
| GH | −0.17 | 0.04 | −0.29 | 0.24 | 0.19 | 0.11 | 0.21 | 0.32 | 0.38 | 0.23 | −0.33 | 0.24 | 0.34 | 0.24 | 0.32 | 0.41 | 0.48 | −0.25 | −0.56 | 0.39 | 0.47 | −0.54 | 0.17 | 0.45 | 0.39 | −0.52 | −0.57 | |
| ST | 0.30 | 0.41 | 0.40 | −0.36 | −0.28 | −0.24 | −0.28 | −0.56 | −0.58 | −0.10 | 0.62 | −0.46 | −0.57 | −0.31 | −0.48 | −0.62 | −0.08 | −0.06 | 0.45 | −0.55 | −0.67 | 0.77 | −0.36 | −0.64 | −0.58 | −0.54 | 0.81 | |
| BO | 0.21 | 0.39 | 0.41 | −0.51 | −0.40 | −0.37 | −0.30 | −0.57 | −0.63 | −0.03 | 0.62 | −0.56 | −0.53 | −0.29 | −0.46 | −0.72 | −0.28 | 0.06 | 0.55 | −0.50 | −0.69 | 0.61 | −0.37 | −0.70 | −0.64 | −0.60 | 0.83 |
| Dimension 1 | Aggregation to ISCO-Major Occupational Group | Aggregation to Workplace Level | ||||||||
|---|---|---|---|---|---|---|---|---|---|---|
| National Survey | Workplace Surveys | |||||||||
| ICC(1) 2 | ICC(2) 3 | ICC(1) 2 | ICC(2) 3 | Mean | SD | Min | Max | Range | Difference to Benchmark 4 | |
| QD | 0.11 | 0.98 | 0.11 | 0.82 | 43.3 | 9.3 | 19.6 | 60.7 | 41.2 | 2.4 |
| WP | 0.00 | 0.62 | 0.13 | 0.85 | 58.6 | 9.0 | 37.5 | 78.1 | 40.6 | −1.3 |
| ED | 0.15 | 0.98 | 0.28 | 0.93 | 45.7 | 14.0 | 22.0 | 80.2 | 58.2 | −1.1 |
| IN | 0.09 | 0.97 | 0.12 | 0.82 | 47.0 | 7.3 | 30.6 | 60.9 | 30.3 | −3.2 |
| PD | 0.11 | 0.98 | 0.12 | 0.83 | 63.1 | 9.1 | 39.5 | 78.1 | 38.6 | −7.3 |
| VA | 0.11 | 0.98 | 0.16 | 0.88 | 67.9 | 11.5 | 31.6 | 85.2 | 53.6 | −0.1 |
| MW | 0.07 | 0.96 | 0.14 | 0.85 | 78.6 | 8.8 | 52.4 | 90.6 | 38.3 | 0.3 |
| PR | 0.02 | 0.85 | 0.14 | 0.85 | 55.2 | 9.3 | 35.2 | 68.8 | 33.5 | −5.0 |
| RE | 0.02 | 0.86 | 0.09 | 0.79 | 60.1 | 8.6 | 41.3 | 77.4 | 36.2 | −5.5 |
| CL | 0.03 | 0.90 | 0.06 | 0.69 | 70.6 | 7.0 | 39.6 | 85.8 | 46.3 | −7.5 |
| CO | 0.01 | 0.75 | 0.10 | 0.80 | 40.7 | 7.7 | 29.2 | 60.2 | 31.1 | −1.5 |
| QL | 0.01 | 0.66 | 0.13 | 0.83 | 57.0 | 11.0 | 32.6 | 79.4 | 46.8 | 2.9 |
| SS | 0.00 | 0.51 | 0.10 | 0.80 | 76.8 | 9.9 | 57.4 | 93.8 | 36.4 | 1.5 |
| SC | 0.01 | 0.76 | 0.05 | 0.63 | 77.4 | 7.2 | 56.3 | 89.2 | 33.0 | −2.8 |
| SW | 0.01 | 0.67 | 0.07 | 0.73 | 77.5 | 6.7 | 56.7 | 88.6 | 32.0 | −2.4 |
| CW | 0.01 | 0.82 | 0.17 | 0.86 | 61.0 | 12.4 | 33.9 | 87.5 | 53.6 | −3.7 |
| WE | 0.03 | 0.90 | 0.05 | 0.63 | 70.7 | 6.5 | 58.3 | 81.7 | 23.3 | 1.3 |
| JI | 0.08 | 0.97 | 0.12 | 0.82 | 19.9 | 8.5 | 3.8 | 40.1 | 36.3 | −0.3 |
| IW | 0.01 | 0.82 | 0.06 | 0.70 | 25.5 | 8.3 | 10.6 | 45.0 | 34.4 | 0.6 |
| QW | 0.00 | 0.56 | 0.09 | 0.78 | 66.7 | 9.8 | 37.5 | 87.5 | 50.0 | −1.5 |
| JS | 0.03 | 0.91 | 0.10 | 0.81 | 64.6 | 7.4 | 43.3 | 77.6 | 34.4 | 0.2 |
| WF | 0.02 | 0.90 | 0.06 | 0.69 | 36.1 | 9.0 | 17.6 | 50.6 | 33.0 | −3.6 |
| TE | 0.02 | 0.86 | 0.15 | 0.86 | 68.1 | 10.5 | 37.5 | 87.5 | 50.0 | −3.2 |
| TM | 0.02 | 0.85 | 0.25 | 0.92 | 66.6 | 11.3 | 43.1 | 88.1 | 45.0 | −2.7 |
| JU | 0.02 | 0.88 | 0.19 | 0.89 | 56.0 | 10.7 | 32.5 | 75.2 | 42.7 | −3.7 |
| GH | 0.02 | 0.87 | 0.02 | 0.39 | 57.1 | 5.9 | 45.2 | 68.0 | 22.8 | −4.2 |
| ST | 0.01 | 0.74 | 0.05 | 0.65 | 33.0 | 7.7 | 15.8 | 51.5 | 35.7 | −3.0 |
| BO | 0.02 | 0.86 | 0.05 | 0.66 | 34.6 | 16.7 | 49.0 | 32.3 | −1.6 | |
© 2020 by the authors. Licensee MDPI, Basel, Switzerland. This article is an open access article distributed under the terms and conditions of the Creative Commons Attribution (CC BY) license (http://creativecommons.org/licenses/by/4.0/).
Share and Cite
Berthelsen, H.; Westerlund, H.; Bergström, G.; Burr, H. Validation of the Copenhagen Psychosocial Questionnaire Version III and Establishment of Benchmarks for Psychosocial Risk Management in Sweden. Int. J. Environ. Res. Public Health 2020, 17, 3179. https://0-doi-org.brum.beds.ac.uk/10.3390/ijerph17093179
Berthelsen H, Westerlund H, Bergström G, Burr H. Validation of the Copenhagen Psychosocial Questionnaire Version III and Establishment of Benchmarks for Psychosocial Risk Management in Sweden. International Journal of Environmental Research and Public Health. 2020; 17(9):3179. https://0-doi-org.brum.beds.ac.uk/10.3390/ijerph17093179
Chicago/Turabian StyleBerthelsen, Hanne, Hugo Westerlund, Gunnar Bergström, and Hermann Burr. 2020. "Validation of the Copenhagen Psychosocial Questionnaire Version III and Establishment of Benchmarks for Psychosocial Risk Management in Sweden" International Journal of Environmental Research and Public Health 17, no. 9: 3179. https://0-doi-org.brum.beds.ac.uk/10.3390/ijerph17093179