Article

Prevalence of Multimorbidity among Asian Indian, Chinese, and Non-Hispanic White Adults in the United States

1
Department of Pharmaceutical Systems and Policy, West Virginia University School of Pharmacy, Morgantown, WV 26506, USA
2
Department of Social & Behavioral Sciences, West Virginia University School of Public Health, Morgantown, WV 26506, USA
3
Public Health Training Center, West Virginia University School of Public Health, Morgantown, WV 26506, USA
*
Author to whom correspondence should be addressed.
Int. J. Environ. Res. Public Health 2020, 17(9), 3336; https://0-doi-org.brum.beds.ac.uk/10.3390/ijerph17093336
Submission received: 1 April 2020 / Revised: 4 May 2020 / Accepted: 8 May 2020 / Published: 11 May 2020

Abstract

:
Asian Americans are the fastest-growing minority group in the United States, yet little is known about their multimorbidity. This study examined the association of Asian Indians, Chinese and non-Hispanic whites (NHWs) to multimorbidity, defined as the concurrent presence of two or more chronic conditions in the same individual. We used a cross-sectional design with data from the National Health Interview Survey (2012–2017) of Asian Indians, Chinese, and NHWs (N = 132,666). Logistic regressions were used to examine the adjusted association of race/ethnicity to multimorbidity. There were 1.9% Asian Indians, 1.8% Chinese, and 96.3% NHWs. In unadjusted analyses (p < 0.001), 17.1% Asian Indians, 17.9% Chinese, and 39.0% NHWs had multimorbidity. Among the dyads, high cholesterol and hypertension were the most common combination of chronic conditions among Asian Indians (32.4%), Chinese (41.0%), and NHWs (20.6%). Asian Indians (AOR = 0.73, 95% CI = (0.61, 0.89)) and Chinese (AOR = 0.63, 95% CI = (0.53, 0.75)) were less likely to have multimorbidity compared to NHWs, after controlling for age, sex, and other risk factors. However, Asian Indians and Chinese were more likely to have high cholesterol and hypertension, risk factors for diabetes and heart disease.

1. Introduction

The co-occurrence of multiple health conditions in the same individual, also known as multimorbidity, has become a priority for global health [1]. Original articles, systematic reviews, and meta-analyses [2] have documented the prevalence of multimorbidity in both young and older adults and reported substantial adverse clinical, humanistic, and economic burden. The global burden of multimorbidity is well-established [3]. Multimorbidity is significantly associated with lower worker productivity [4], higher risk of polypharmacy [5,6], impaired functioning [7], frailty [8], poor quality of life [9], substantial higher healthcare use [10,11,12], increased healthcare costs [13,14], and increased risk of death [15]. A systematic review has concluded that multimorbidity is highly prevalent [16]. In addition, the prevalence of multimorbidity is growing [17]. Epidemiologic data suggest differences in multimorbidity prevalence rates by age, sex, race, and socioeconomic status [18,19,20,21,22]. Older adults, racial minorities, and those with low socioeconomic status are at high risk for multimorbidity [23,24,25].
Notably, a handful of studies have reported differences in multimorbidity prevalence among racial and Asian ethnic minorities (e.g., Asian Indians and Chinese). A systematic review of multimorbidity and outcomes in South Asians concluded that the prevalence of multimorbidity is poorly understood in South Asian ethnic groups [26]. A few studies in this area have provided mixed results for the association of race/ethnicity to multimorbidity. For example, in Singapore, both Chinese and Asian Indians had higher risks of multimorbidity compared to the native population (Malayans) [27]. In the United States (U.S.), using Hawaii Medicare data, Lim et al. reported that racial minorities (Asians/Pacific Islanders, Hispanics, and Others) had significantly higher prevalence rates of multimorbidity compared to non-Hispanic whites (NHWs) [24]. However, among the residents of Olmsted County, Minnesota, Asians had a lower prevalence of physical multimorbidity (12.7% vs. 26.7%) and physical and mental health multimorbidity (3.2% vs. 8.6%) compared to whites [28,29]. These studies have limitations because Asian Americans that represent many heterogeneous subgroups were combined [30]. In 2016, a data brief reported by Bloom and Black [31] looked at the health status among Asian subgroups. They found that Asian Indian (16.9%) and Chinese adults (11.3%) were less likely than all U.S. adults (24.1%) to have multimorbidity. However, they did not examine risk factors associated with multimorbidity other than age. Thus, questions remain regarding Asian ethnic disparities in multimorbidity prevalence rates.
Specifically for Asian populations living in the U.S., a focus on multimorbidity is overdue and necessary for several reasons: the Asian population has increased substantially during the past twenty years in the United States, from less than 2% of the total population prior to 2000 to nearly 7% as of 2018 [32,33,34]. Among them, Chinese and Asian Indians are the two largest subgroups. This tremendous growth, as well as lack of adequate knowledge of their physical and mental health, presents challenges for healthcare professionals, policymakers, and others.
Asian Americans are a heterogeneous group with differing levels of education, household income, and language ability. According to the American Community Survey, 74.6% of Asian Indians had a bachelor’s degree or higher, while only 57.2% of the Chinese did the same. The median household income is $116,793 for Asian Indians and $81,487 for Chinese. A smaller amount (17.3%) of Asian Indians speak English less than “very well” compared to 36.9% of Chinese [35]. Researchers and advocacy groups have emphasized the importance of collecting and reporting data by specific Asian subgroups [30,36,37]. Acknowledging this importance, as of 2010, Section 4302 of the Affordable Care Act [38] requires that all health surveys sponsored by the Department of Health and Human Services (DHHS) include standardized information on race/ethnicity at a granular level among the Asian sub-population [39].
However, Asian subgroups are still frequently combined with Pacific Islanders [40,41], or into a single Asian category [29,42], masking heterogeneity among the subgroups [43]. Other studies that have explored the prevalence of multimorbidity in Asians subgroups either had small sample sizes [37] or were restricted to specific geographic areas [28,29], limiting the generalizability of the results. Hence, using a representative sample to understand the patterns of health by specific Asian ethnic subgroups (e.g., Asian Indians and Chinese) is needed.
We did not include other racial/ethnic groups such as Hispanic or Latinos and African Americans because many studies have compared multimorbidity prevalence among Hispanics and NHWs and African Americans and NHWs [44,45,46,47]. These studies reported that Non-Hispanic Blacks had greater odds of multimorbidity compared to NHWs after adjusting for other risk factors. However, Hispanic adults and Non-Hispanics of other races were less likely to have multimorbidity when compared to NHWs. To avoid repeated work, we did not include Hispanic Americans or African Americans in our study.
Therefore, the purpose of this study was to estimate the prevalence of multimorbidity among Asian Indians, Chinese, and NHWs and examine adjusted associations of race/ethnicity to multimorbidity after controlling for specific characteristics that are known to be associated with multimorbidity.

2. Materials and Methods

2.1. Study Design

We used a cross-sectional design with data on adults from the following racial/ethnic groups: Asian Indians, Chinese, and NHWs.

2.2. Data Source

We used data from the National Health Interview Survey (NHIS). NHIS is an annual cross-sectional survey of a nationally representative sample of noninstitutionalized civilian households and members of the households. It has been conducted continuously since 1957 [48]. The NHIS collects information on a comprehensive list of health topics, including chronic conditions, health status, healthcare services, and health behaviors and their distribution by demographic, socioeconomic, and access to care characteristics through personal household interviews [48]. Since 1992, the NHIS has collected disaggregated data on Asians. Furthermore, in the 2006 survey year, the NHIS implemented oversampling of Asian households for the first time [49]. As of 2011, NHIS followed the policy guidelines from the DHHS to standardize the collection of race/ethnicity data at a granular level among the Asian sub-population [39].
In this study, we combined information from the family core, the sample adult core, and the person files using established National Center for Health Statistics guidelines for combining NHIS data [50]. To ensure adequate Asian Indian and Chinese sample sizes, we combined 2012–2017 annual files for pooled analyses of the NHIS. The data is de-identified and open to the public [51]. This study was not considered human subjects research.

2.3. Analytical Sample

We restricted the study sample to adults (age ≥ 18 years) and the following racial/ethnic groups: Asian Indians, Chinese, and NHWs. We only included adults who participated in the sample adult core (N = 132,694) and excluded adults who had missing data for multimorbidity (N = 28). We pooled multiple years of NHIS (2012–2017) to ensure an adequate sample size for the Asian Indian and Chinese subgroups. The final sample size was 132,666. When weighted to the U.S. population, the sample represented 1.9% Asian Indians, 1.8% Chinese, and 96.3% NHWs.

2.4. Measures

2.4.1. Dependent Variable: Presence of Multimorbidity

Although there is a consensus that multimorbidity is the co-existence of multiple health conditions in the same individual, there is no uniform definition of multimorbidity [52]. In our study, we defined multimorbidity as the presence of two or more chronic conditions from the following 10 chronic physical conditions: arthritis, asthma, cancer, chronic obstructive pulmonary disease (COPD), chronic kidney disease, diabetes, high cholesterol, hypertension, heart disease, and stroke. We selected these conditions based on the DHHS strategic framework for program, policy, and research [53]. These conditions were derived from affirmative responses to questions that asked a respondent whether he/she has (1) EVER been told by a doctor or other health professional that she/he had the chronic condition, (2) or during the past 12 months, been told by a doctor or other health professional that she/he had the chronic condition.

2.4.2. Key Independent Variable: Race/Ethnicity—Asian Indians, Chinese, and NHWs

Race/Ethnicity was categorized based on an individual’s response to questions that asked the respondent (1) whether he/she was Hispanic, Latino/a, or Spanish origin, and (2) what his/her race was. Individuals responded both “not of Hispanic, Latino/a, or Spanish origin” and “White” were categorized as NHWs. For Asian subgroups, there were four subcategories available in NHIS public-use data files: Asian Indian, Chinese, Filipino, and other Asian. In this study, we included individuals who self-identified as Asian Indians or Chinese.

2.4.3. Other Independent Variables

The selection of other independent variables was guided by adapted determinants of health models [54,55,56,57,58]. The independent variables included: biological characteristics (age and sex), socioeconomic status (education, employment, poverty status measured by the percentage of household income to the federal poverty line (FPL)), and access to care (presence of health insurance and doctor’s office visits in the past 12 months). Age was categorized into four groups: 18–39 years, 40–49 years, 50–64 years, and ≥65 years. Education was categorized as less than high school, high school (or equivalent), some college, and college (bachelor’s degree or higher). Employment status was categorized as employed (with a job or business) and not employed (not working at a job or business, looking for work, or working at a family owned business with no pay), based on an individual’s response to the question that asked the respondent what he/she was doing last week.
We also included marital status and depressive symptoms as independent variables because existing literature has shown that those two variables are associated with chronic diseases [59,60]. Marital status was defined as married (married or living with partner), never married, and separated/widowed/divorced. Depressive symptoms were measured based on an individual’s response to a question that asked for the frequency of feeling so sad that nothing cheers her/him up in the past 30 days. Individuals who reported all of the time, most of the time or some of the time, were categorized as having depressive symptoms, while individuals reported a little of the time or none of the time were categorized as having no depressive symptoms.
As many chronic conditions share similar behavioral risk factors (smoking, alcohol use, obesity, and physical inactivity), we also included behavioral factors. Smoking and alcohol use were categorized into three groups: former user, current user, and never used. Physical activity was measured by self-reported frequency of vigorous activity and was categorized as daily, weekly, and physically inactive (monthly/yearly/never/unable). Obesity was measured by Body Mass Index (BMI), which was calculated from self-reported height and weight and adjusted for the Asian population. In NHW, overweight was defined as a BMI between 25 to 30 kg/m2 and obese BMI 30 kg/m2 or greater. In Asian Indian and Chinese, overweight was defined as a BMI between 23.0 to <25 kg/m2, and obesity BMI 25 kg/m2 or greater, as recommended by the World Health Organization guidelines [61]. Given the unique Asian American immigration experience, one additional variable was included in the regression analysis: born outside the United States. As historical immigration streams placed Asian Indians and Chinese in specific regions of the U.S. [62], we also adjusted for the region (Northeast, South, Midwest, and West) of the U.S. The interview year was included to control for potential confounding.

2.5. Statistical Analysis

As NHIS involves a complex, multistage probability sample that incorporates stratification and clustering, we used survey procedures in the analyses. Sampling weights were constructed by dividing the existing person file weights by 6, as 6 years of data were combined [63,64]. Significant differences in individual characteristics among racial/ethnic groups and multimorbidity were tested with Rao-Scott chi-square tests. Multivariate logistic regressions were used to examine the associations of Asian Indians/Chinese/NHWs to multimorbidity after adjusting for sex, age, education, employment, poverty status, marital status, access to care, obesity, smoking, alcohol use, physical activity, depressive symptoms, region, foreign-born status and NHIS year. Differences in multimorbidity between Asian Indians and Chinese were also assessed using the unadjusted and fully adjusted model.
Results from logistic regressions were reported in terms of unadjusted (UORs) and adjusted odds ratios (AORs) and associated 95% confidence intervals (CIs). As multimorbidity is known to increase with age, the results were stratified by age (≥65 years vs. <65 years). Sixty-five years was selected as the age cutoff because of the availability of national health insurance (i.e., Medicare) for all eligible individuals aged 65 years or older.

3. Results

In our sample, 51.5% were female, 22.2% were 65 years or older; 42.9% had high income (FPL > 400%), and 35.6% had college education. The majority of individuals had health insurance (91.2%). Some behavioral risk factors reported by the participants were obese (28.0%), current smokers (17.2%), and physical inactivity (54.2%). These data are not shown in a table.

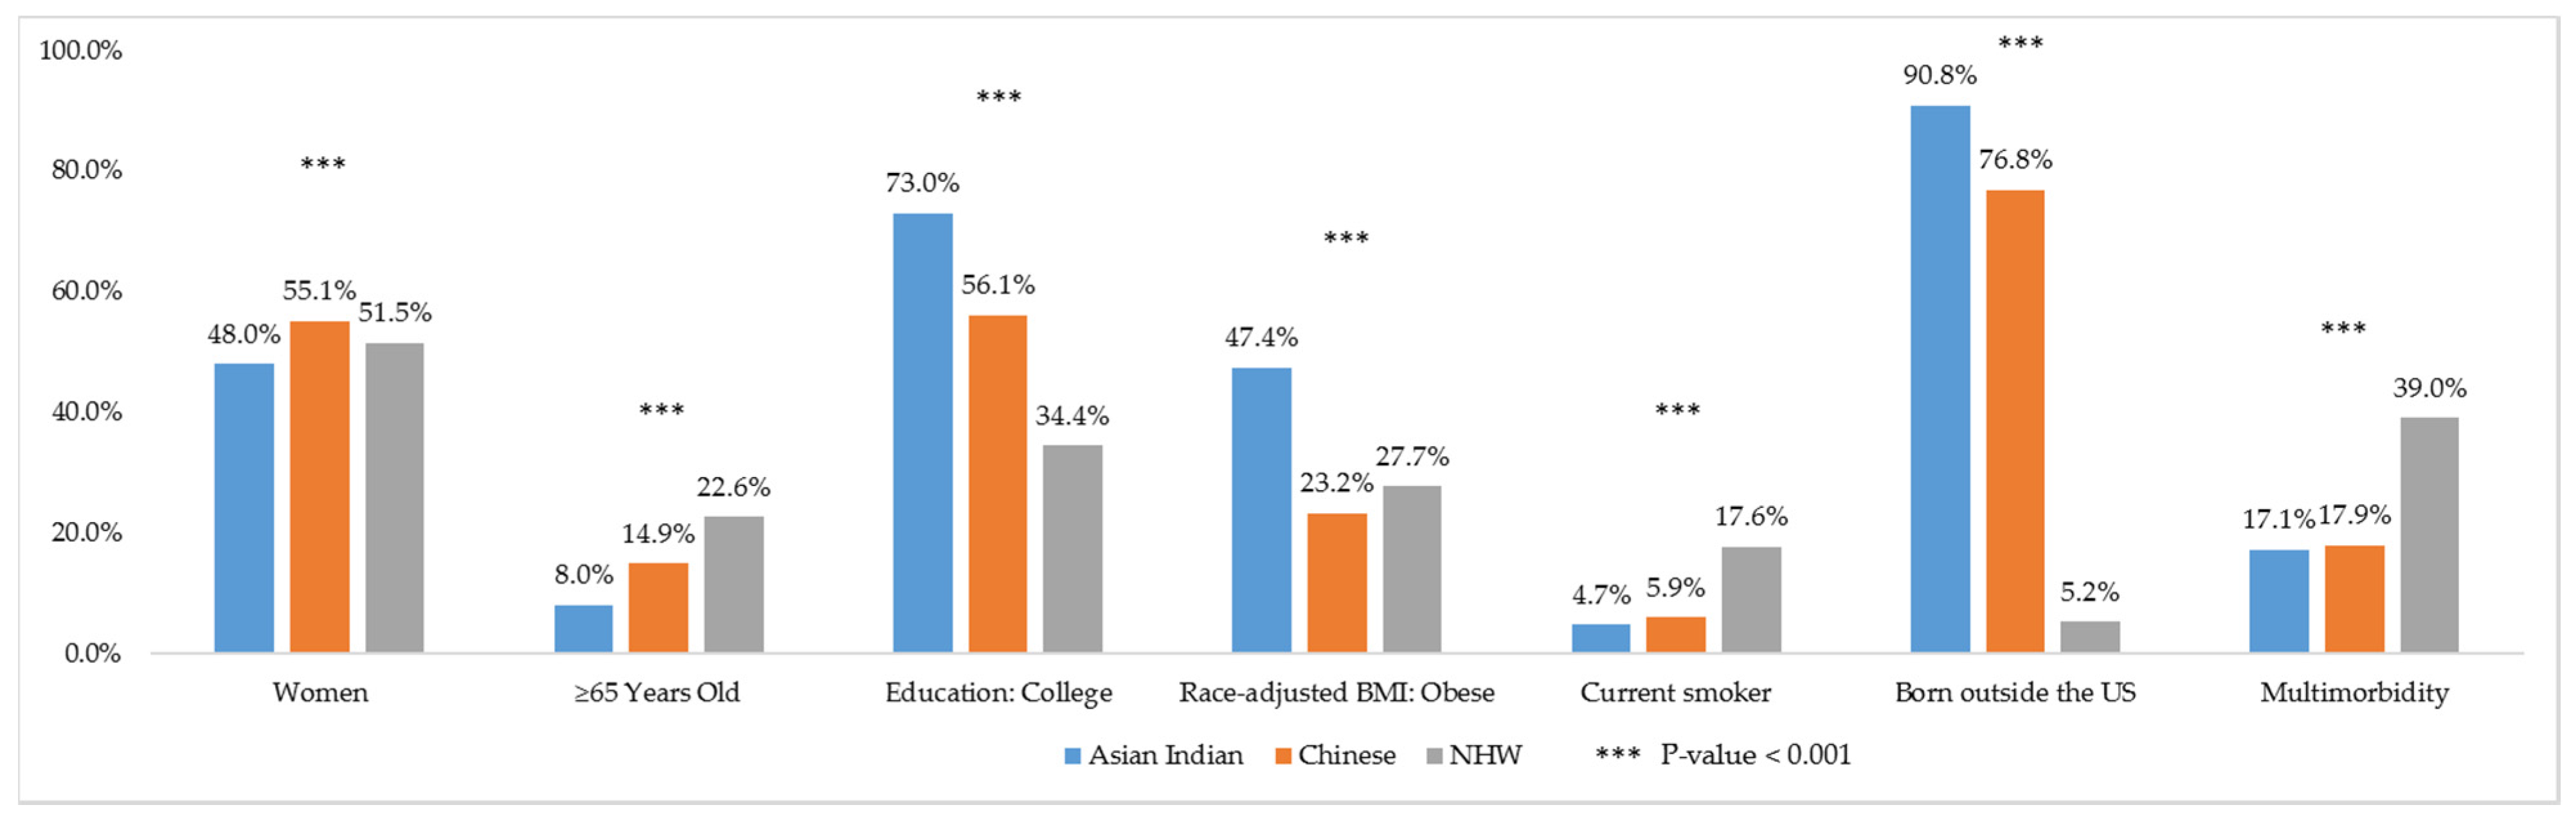
3.1. Description of Characteristics among Asian Indians, Chinese, and NHWs

Selected characteristics among Asian Indians, Chinese, and NHWs are presented in Figure 1. There were statistically significant differences in all characteristics except health insurance coverage across the three groups (Table 1). In terms of biological characteristics, NHW had the highest percentage (22.6%) of older individuals (age > 65 years) followed by Chinese (14.9%) and Asian Indians (8.0%). For socioeconomic status, Asian Indians had the highest percentage of college education (73.0%), followed by Chinese (56.1%) and NHWs (34.4%). For behavioral risk factors, NHWs had the highest rates of current smoking (17.6%) and alcohol use (69.5%). Asian Indians had the lowest rates of current smoking (4.7%), alcohol use (43.8%), and physical inactivity (50.4%). Yet, Asian Indians had the highest rates of obesity (47.4%). Geographically, higher numbers of Asian Indians resided in the South and Western regions, while the Chinese largely resided in the Northeastern and Western U.S.

3.2. Prevalence of Multimorbidity among Asian Indians, Chinese, and NHWs

Unweighted numbers and weighted percentages of multimorbidity by individual characteristics, including racial/ethnic groups, are presented in Table 2. Overall, 38.2% had multimorbidity. A lower percent of Asian Indians (17.1%) and Chinese (17.9%) had multimorbidity compared to NHWs (39.0%). Unadjusted logistic regressions revealed that Asian Indians (UOR = 0.32, 95% CI = (0.27, 0.38)) and Chinese (UOR = 0.34, 95% CI = (0.30, 0.39)) were less likely to have multimorbidity compared to NHWs (Table 3).

3.3. Chronic Condition Combinations among Asian Indians, Chinese, and NHWs

Among those with two chronic conditions (dyads), high cholesterol & hypertension was the most common combination across Asian Indians (32.4%), Chinese (41.0%) and NHWs (20.6%). Arthritis & hypertension was the second most common combination among Asian Indians (13.6%), Chinese (11.0%), and NHWs (13.6%). The third most common combination differed across the racial/ethnic groups with diabetes & high cholesterol in Asian Indians (10.1%), asthma & high cholesterol in Chinese (8.6%) and arthritis & high cholesterol in NHWs (10.9%).
Among three chronic conditions (triads), both Asian Indians and Chinese shared the same top three combinations: diabetes & high cholesterol & hypertension (30.4%, 21.9%), arthritis & high cholesterol & hypertension (16.7%, 20.0%), and heart disease & high cholesterol & hypertension (10.3%, 10.1%). In NHWs, arthritis & high cholesterol & hypertension was the most common combination (18.9%), followed by heart disease & high cholesterol & hypertension (8.0%). Diabetes & high cholesterol & hypertension (6.9%), which was the most common triad among Asian Indians and Chinese, ranked third in NHWs.

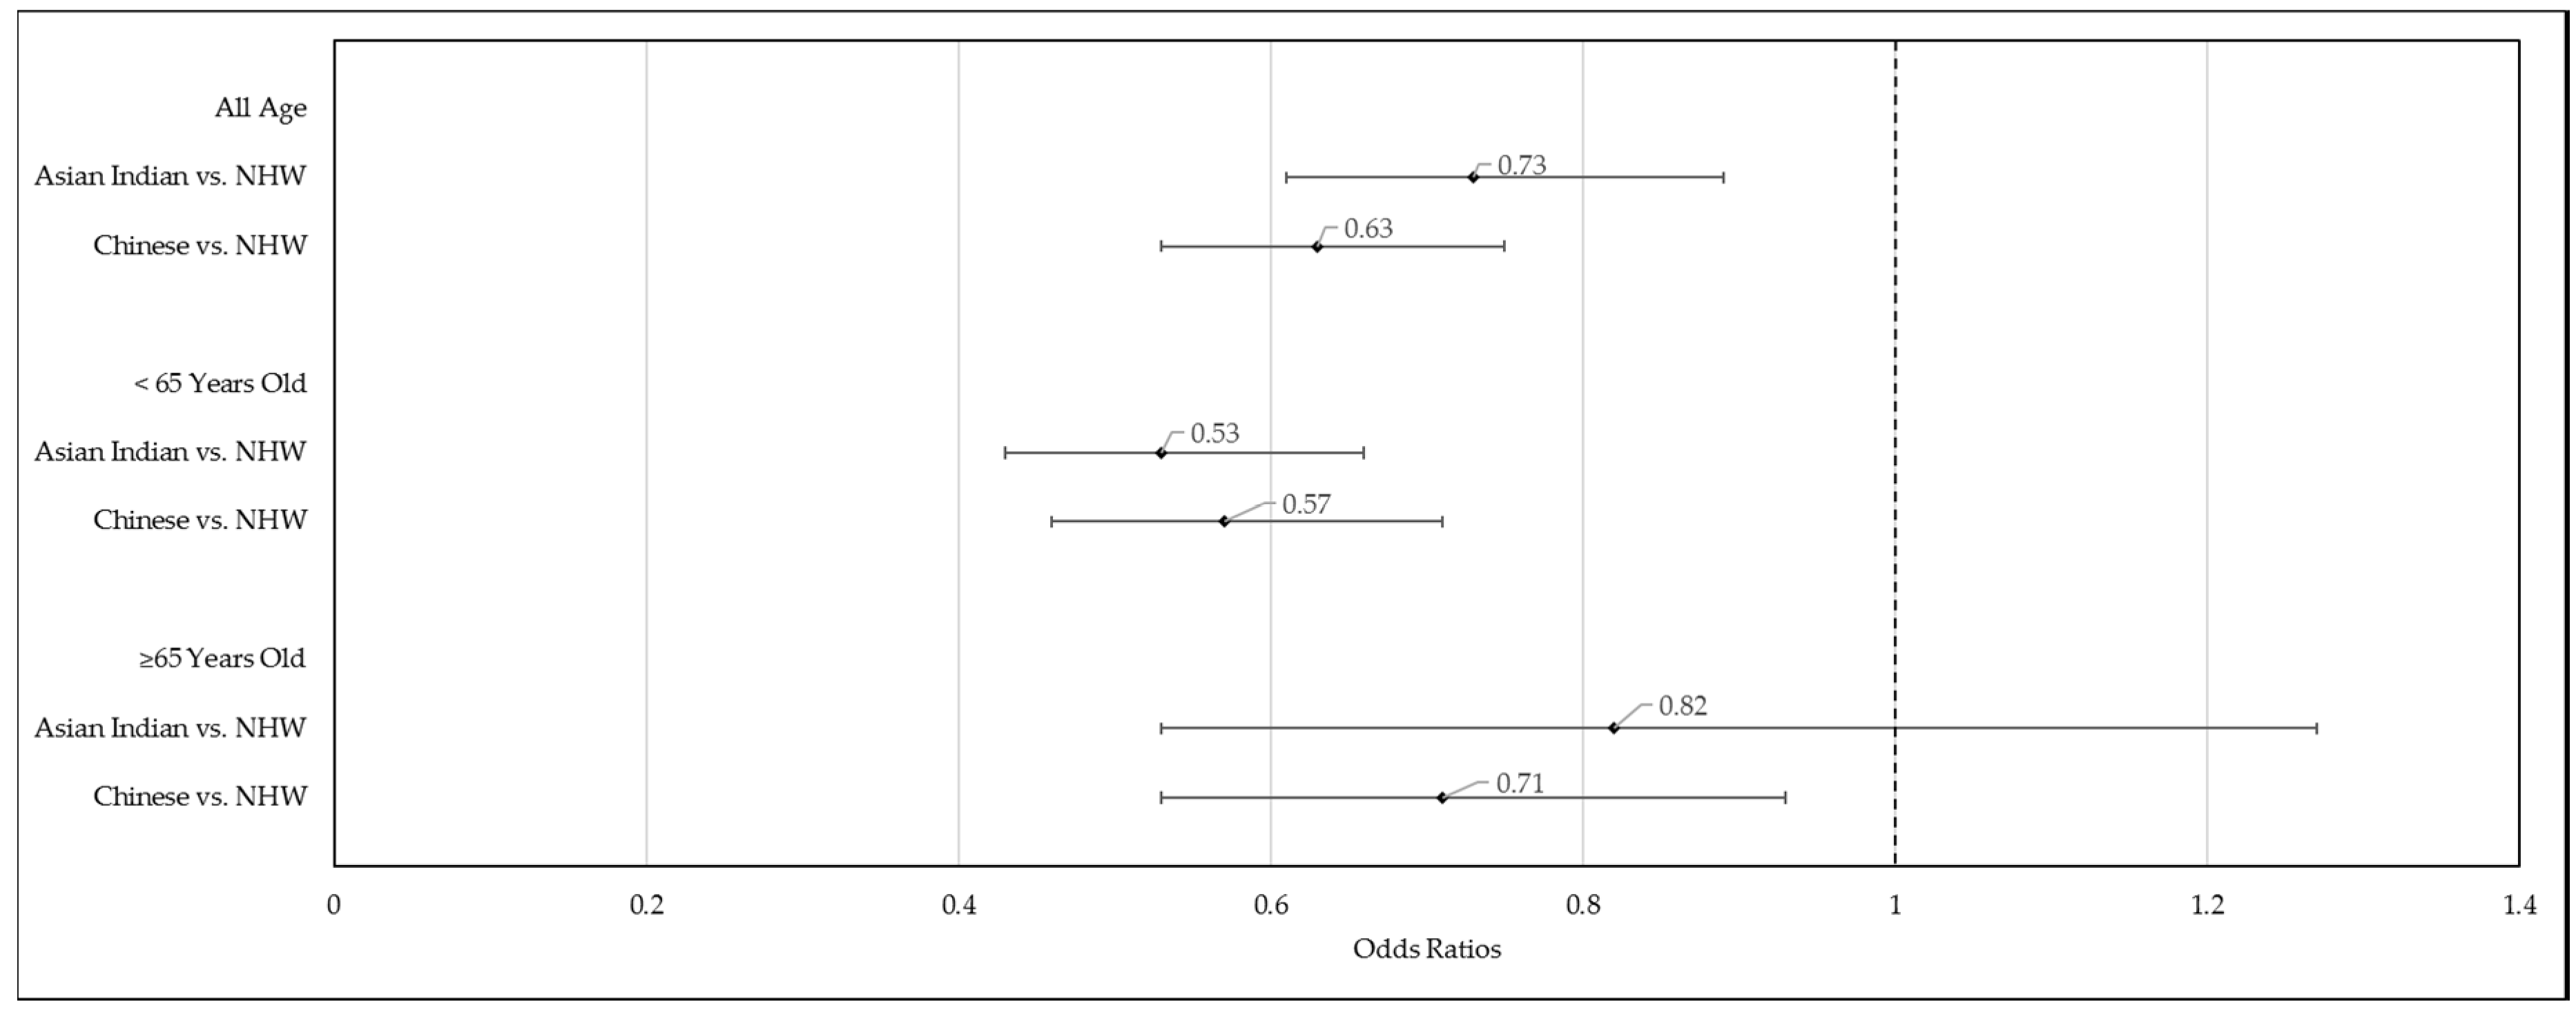
3.4. Adjusted Associations of Race/Ethnicity to Multimorbidity

When adjusted for age and sex, Asian Indians (AOR = 0.50, 95% CI = (0.42, 0.59)) and Chinese (AOR = 0.36, 95% CI = (0.32, 0.42) continued to show lower likelihood of having multimorbidity than NHWs (Table 3). In the fully adjusted regression model, that controlled for age, sex, marital status, education, employment, poverty status, access to care, race-adjusted BMI, physical activity, smoking, alcohol use, depressive symptoms, region, foreign-born status and NHIS year, Asian Indians (AOR = 0.73, 95% CI = (0.61, 0.89)) and Chinese (AOR = 0.63, 95% CI = (0.53, 0.75)) were less likely to have multimorbidity than NHWs. It has to be noted that in these regressions, missing indicators were included for variables with missing data (education, poverty status, marital status, employment, health insurance, doctor’s office visit, race-adjusted BMI, physical activity, smoking, alcohol use, depressive symptoms, and foreign-born status).
We observed that women (AOR = 0.81, 95% CI = (0.78, 0.85)) and individuals who were born outside the US (AOR = 0.70, 95% CI = (0.64, 0.76)) were less likely to have multimorbidity compared to men and individuals who were born in the U.S. Older adults (all subgroups aged 40 years or older), those who were not employed (AOR = 1.50, 95% CI = (1.43, 1.56)), without college education (all subgroups), with household income <100% FPL (AOR = 1.38, 95% CI = (1.28, 1.49)) or 100–200% FPL (AOR = 1.21, 95% CI = (1.13, 1.30)), with overweight (AOR = 1.70, 95% CI = (1.62, 1.78)) or obesity (AOR = 3.07, 95% CI = (2.92, 3.23)), those who reported physical inactivity (AOR = 1.25, 95% = (1.15, 1.35)), current smokers (AOR = 1.44, 95% CI = (1.37, 1.52)), and those who visited the doctor’s office (all subgroups) were more likely to report multimorbidity compared to the reference groups (18–39 years, employed, college education, FPL ≥ 400%, normal/underweight BMI, daily physical activity, non-smokers, and no visit to the doctor’s office). We also observed that those with self-reported depressive symptoms (all of the time, most of the time or some of the time) were more likely to have multimorbidity (AOR = 1.64, 95% CI = (1.54, 1.74)) compared to those reporting no symptoms (a little of the time or none of the time).
When stratified by age (≥65 years vs. <65 years), Asian Indians and Chinese were less likely to have multimorbidity compared to NHWs (Figure 2). Among the younger age group (<65 years), the AORs for Asian Indians and Chinese were 0.53 (95% CI = (0.43, 0.66)) and 0.57 (95% CI = (0.46, 0.71)) respectively. Among the older age group (≥65 years), the AORs for Asian Indians and Chinese were 0.82 (95% CI = (0.53, 1.27)) and 0.71 (95% CI = (0.53, 0.93)), respectively. The odds ratio for Asian Indians was no longer significant (p-value = 0.370) among the older age group.

3.5. Asian Indians and Chinese—Comparison of Multimorbidity

Our study found similar prevalence rates of multimorbidity among Asian Indians (17.1%) and Chinese (17.9%). Compared to Chinese, Asian Indians had a lower percentage of current smokers, alcohol use, and being physically inactive. Yet, Asian Indians were found to have a higher prevalence of high cholesterol and diabetes. Among those with two conditions, 41.0% of the Chinese had a combination of high cholesterol and hypertension, compared to 32.4% of Asian Indians. The unadjusted model and the fully adjusted model showed no significant differences in multimorbidity between Asian Indians and Chinese (UOR = 0.94, 95% CI = (0.77, 1.16); AOR = 1.17, 95% CI = (0.92, 1.48); reference = Chinese). This result is not shown in a table.

4. Discussion

This is the first study to thoroughly investigate multimorbidity in Asian Indians and Chinese in the US, the two largest Asian subgroups, using a national representative data. Our study findings provide new information that even after controlling for all the relevant factors, including foreign-born status, multimorbidity among Asian Indians and Chinese were lower compared to NHWs. Existing studies have used a single disease framework and documented a high prevalence of diabetes among Asian Americans [65], specifically among Asian Indians [66]. Our study extended published literature by examining multimorbidity as well as combinations of conditions. Our study findings suggest that public health programs, research, and practice need to consider epidemiologic characteristics, including race/ethnicity, to reduce the risk of multimorbidity and in its management.
Our findings are consistent with the lower prevalence rates of multimorbidity observed in other published studies that have combined all Asians into one group. For example, Machlin and Soni [67] estimated that Asians had 16.2% of treated prevalence for multimorbidity compared to 28.5% in NHWs, using the 2009 Medical Expenditure Panel Survey data. St Sauver et al. [42] reported that the standardized incidence of multimorbidity was lower in Asians (men 29.5%, women 34.9%) compared to Whites (men 36.0%, women 39.4%).
One could attribute favorable socioeconomic status and the healthy immigrant effect [68] to low rates of multimorbidity among Asian Indians and Chinese. In our study, Asian Indians and Chinese had higher levels of education and income compared to NHWs. A systematic review of 24 studies suggests that high levels of education and income are associated with a lower likelihood of multimorbidity [69]. However, this may be less of a factor among older adults. In our study, among older adults (age ≥ 65 years), the AORs of multimorbidity for Asian Indians and Chinese were 0.82 and 0.71, respectively, compared to the AORs among young Asian Indians and Chinese (0.53 and 0.57). This may be due to the convergence in natives’ health vs. immigrants’ health with years since immigration due to acculturation [70].
Furthermore, individuals from Asian cultures also tend to have different healthcare use rates. It is not a cultural norm to receive routine checkups and regular preventive care [71]. Additionally, language is a major barrier for Asian Americans seeking care, especially for many elders and recent migrants [71]. The language barrier and cultural attitudes about healthcare may lead to underreporting of their chronic condition until the problem becomes imminent. This could result in an underestimation of multimorbidity prevalence in Asian Indian and Chinese. Furthermore, Asian Indian and Chinese may have a healthier dietary habit and lower fast-food intake [72,73] that have contributed to their lower multimorbidity rates.
In our study, 17.1% of Asian Indians and 17.4% of Chinses had multimorbidity. Yet, the reported lower rates among Asian Indians and Chinese might not reflect the holistic picture of health status in these two groups. A study using the 2009 Nationwide Inpatient Sample (NIS) found that Asian/Pacific Islanders had the highest mortality compared to other races/ethnicities, regardless of the number of chronic conditions [41]. As there is well-established literature that multimorbidity can lead to poor health outcomes including high mortality, hospitalizations, poor quality of life, and increased costs, future research needs to explore the effect of multimorbidity among Asian Indians and Chinese on these prior health outcomes, as well as mediating and moderating factors of such negative outcomes.
Furthermore, we did not find any significant differences in multimorbidity between Asian Indians and Chinese. The two groups also share some specific combinations of chronic conditions (high cholesterol & hypertension, and high cholesterol & hypertension & diabetes), that had a higher prevalence among them compared to NHW. Both high cholesterol and hypertension are risk factors for diabetes and heart disease. While the high prevalence of diabetes and heart disease among Asian Indians is well established [74,75,76], a significantly lower risk for coronary heart disease was found for Chinese compared to NHWs [77]. Moreover, a study examining functional limitations among middle-aged and older adults reported that Asian Indians had higher odds for functional limitations compared to Chinese [78]. Future studies need to explore whether the association of multimorbidity to health outcomes remain similar among the two groups and identify specific factors that may affect the health outcomes of the two groups differentially. Programs and policies targeted towards multimorbidity may need to consider specific combinations of chronic conditions and their outcomes in addition to a global definition of multimorbidity.
Our results showed that 39.0% of NHW adults had multimorbidity, higher than other published studies that used the NHIS data [31,44,45,79]. The discrepancy may be caused by differences in the study period, age composition, and the selection of chronic conditions. For example, the study period of Ward and Schiller 2013 [45] was from 2001 to 2010. Another study, Johnson-Lawrence et al. 2017 [44], was restricted to individuals aged 30–64 years old. Both studies and Bloom and Black 2016 [31] did not include high cholesterol as a chronic condition when defining multimorbidity. Our study included 9 of the 20 proposed DHHS conditions, excluded hepatitis, and included high cholesterol. The expanded selection of chronic conditions may have resulted in a higher percentage of multimorbidity than the rates reported in previous studies.
The results presented here are tempered by several caveats, and they must be considered in the interpretation of our findings. First, multimorbidity was generated by self-reported health conditions in the NHIS. Thus, the prevalence of health conditions may be overestimated or underestimated. This limitation is inherent in the NHIS as all information is obtained through self-report. The multimorbidity measure has further limitations. Although it is a standard approach that has been used in other studies of multimorbidity [45,80,81,82], this dichotomized variable does not account for the severity, complexity, or duration of the chronic conditions studied. Second, independent variables were limited to the variables available in NHIS. We included factors that were known to be risk factors of multimorbidity. Other factors, such as diet, which may also affect the risk of multimorbidity, were not included in the multivariate model. Third, the cross-sectional nature of our study precludes us from making any causal inferences. Without the information on temporal relationship, we could not infer causality on the observed association between risk factors and the prevalence of multimorbidity. Nonetheless, our study contributed to the nascent literature on multimorbidity among Asian subgroups by using a nationally represented Asian Indians, Chinese, and NHWs in the US. In our analyses, we controlled for a host of covariates not considered in previous studies of race/ethnicity with multimorbidity, including doctor’s office visit, region and foreign-born status. In addition, we stratified the results by age group, which allowed us to test for the independent associations of these variables with multimorbidity among elderly and non-elderly groups. Moreover, in 2012–2017 NHIS data, Asian persons were oversampled to allow for better estimation of the health characteristics of these populations [83,84,85,86,87,88]. By pooling six years of NHIS data, we were able to raise the sample size and further increase the precision of our study while ensuring validity (i.e., representativeness) in measuring multimorbidity among the entire population of Asian Indians, Chinese and NHWs in the U.S.

5. Conclusions

We observed that Asian Indians and Chinese had lower prevalence rates of multimorbidity compared to NHWs after accounting for age, sex, socioeconomic characteristics, and health behaviors. Yet, Asian Indians and Chinese were more likely to have specific combinations of high cholesterol and hypertension, risk factors for heart disease and diabetes. Future studies on types of multimorbidity and their associated health outcomes, especially those related to cardiovascular clusters among Asian subgroups, are warranted.

Author Contributions

Conceptualization, U.S. and R.M.; methodology, U.S., R.M. and Y.Z.; software, U.S. and Y.Z.; validation, Y.Z. and U.S.; formal analysis, Y.Z.; investigation, Y.Z., R.M. and U.S.; resources, U.S.; data curation, U.S. and Y.Z.; writing—original draft preparation, Y.Z.; writing—review and editing, Y.Z., R.M. and U.S.; visualization, Y.Z.; supervision, U.S. All authors have read and agreed to the published version of the manuscript.

Funding

This research received no external funding.

Conflicts of Interest

The authors declare no conflict of interest.

References

  1. MacMahon, S.; Calverley, P.; Chaturvedi, N.; Chen, Z.; Corner, L.; Davies, M.; Ezzati, M.; Guthrie, B.; Hanson, K.; Jha, V.; et al. Multimorbidity: A Priority for Global Health Research; The Academy of Medical Sciences: London, UK, 2018. [Google Scholar]
  2. Publications on Multimorbidity. Available online: https://www.usherbrooke.ca/crmcspl/fileadmin/sites/crmcspl/documents/Publications_on_multimorbidity_01.pdf (accessed on 26 April 2020).
  3. Hajat, C.; Stein, E. The global burden of multiple chronic conditions: A narrative review. Prev. Med. Rep. 2018, 12, 284–293. [Google Scholar] [CrossRef] [PubMed]
  4. Cabral, G.G.; Dantas, A.C.; Barbosa, I.R.; Jerez-Roig, J.; Souza, D.L.B. Multimorbidity and Its Impact on Workers: A Review of Longitudinal Studies. Saf. Health Work 2019, 10, 393–399. [Google Scholar] [CrossRef] [PubMed]
  5. Feng, X.; Tan, X.; Riley, B.; Zheng, T.; Bias, T.; Sambamoorthi, U. Polypharmacy and Multimorbidity among Medicaid Enrollees: A Multistate Analysis. Popul. Health Manag. 2018, 21, 123–129. [Google Scholar] [CrossRef] [PubMed]
  6. Menditto, E.; Miguel, A.G.; Juste, A.M.; Plou, B.P.; Pascual-Salcedo, M.A.; Orlando, V.; Rubio, F.G.; Torres, A.P. Patterns of multimorbidity and polypharmacy in young and adult population: Systematic associations among chronic diseases and drugs using factor analysis. PLoS ONE 2019, 14, e0210701. [Google Scholar] [CrossRef] [Green Version]
  7. Calderón-Larrañaga, A.; Vetrano, D.L.; Ferrucci, L.; Mercer, S.W.; Marengoni, A.; Onder, G.; Eriksdotter, M.; Fratiglioni, L. Multimorbidity and functional impairment–bidirectional interplay, synergistic effects and common pathways. J. Intern. Med. 2019, 285, 255–271. [Google Scholar] [CrossRef] [Green Version]
  8. Vetrano, D.L.; Palmer, K.; Marengoni, A.; Marzetti, E.; Lattanzio, F.; Roller-Wirnsberger, R.; Lopez Samaniego, L.; Rodríguez-Mañas, L.; Bernabei, R.; Onder, G. Frailty and Multimorbidity: A Systematic Review and Meta-analysis. J. Gerontol. Ser. A 2019, 74, 659–666. [Google Scholar] [CrossRef] [Green Version]
  9. Makovski, T.T.; Schmitz, S.; Zeegers, M.P.; Stranges, S.; van den Akker, M. Multimorbidity and quality of life: Systematic literature review and meta-analysis. Ageing Res. Rev. 2019, 53, 100903. [Google Scholar] [CrossRef]
  10. Marengoni, A.; Angleman, S.; Melis, R.; Mangialasche, F.; Karp, A.; Garmen, A.; Meinow, B.; Fratiglioni, L. Aging with multimorbidity: A systematic review of the literature. Ageing Res. Rev. 2011, 10, 430–439. [Google Scholar] [CrossRef]
  11. Bähler, C.; Huber, C.A.; Brüngger, B.; Reich, O. Multimorbidity, health care utilization and costs in an elderly community-dwelling population: A claims data based observational study. BMC Health Serv. Res. 2015, 15, 23. [Google Scholar] [CrossRef] [Green Version]
  12. Palladino, R.; Lee, J.T.; Ashworth, M.; Triassi, M.; Millett, C. Associations between multimorbidity, healthcare utilisation and health status: Evidence from 16 European countries. Age Ageing 2016, 45, 431–435. [Google Scholar] [CrossRef] [Green Version]
  13. Wang, L.; Si, L.; Cocker, F.; Palmer, A.J.; Sanderson, K. A Systematic Review of Cost-of-Illness Studies of Multimorbidity. Appl. Health Econ. Health Policy 2018, 16, 15–29. [Google Scholar] [CrossRef] [PubMed]
  14. Zulman, D.M.; Chee, C.P.; Wagner, T.H.; Yoon, J.; Cohen, D.M.; Holmes, T.H.; Ritchie, C.; Asch, S.M. Multimorbidity and healthcare utilisation among high-cost patients in the US Veterans Affairs Health Care System. BMJ Open 2015, 5, e007771. [Google Scholar] [CrossRef] [Green Version]
  15. Nunes, B.P.; Flores, T.R.; Mielke, G.I.; Thumé, E.; Facchini, L.A. Multimorbidity and mortality in older adults: A systematic review and meta-analysis. Arch. Gerontol. Geriatr. 2016, 67, 130–138. [Google Scholar] [CrossRef] [PubMed]
  16. Nguyen, H.; Manolova, G.; Daskalopoulou, C.; Vitoratou, S.; Prince, M.; Prina, A.M. Prevalence of multimorbidity in community settings: A systematic review and meta-analysis of observational studies. J. Comorbidity 2019, 9, 2235042X1987093. [Google Scholar] [CrossRef] [PubMed]
  17. Van Oostrom, S.H.; Gijsen, R.; Stirbu, I.; Korevaar, J.C.; Schellevis, F.G.; Picavet, H.S.J.; Hoeymans, N. Time Trends in Prevalence of Chronic Diseases and Multimorbidity Not Only due to Aging: Data from General Practices and Health Surveys. PLoS ONE 2016, 11, e0160264. [Google Scholar] [CrossRef] [Green Version]
  18. Shadmi, E. Disparities in Multiple Chronic Conditions within Populations. J. Comorbidity 2013, 3, 45–50. [Google Scholar] [CrossRef]
  19. Boutayeb, A.; Boutayeb, S.; Boutayeb, W. Multi-morbidity of non communicable diseases and equity in WHO Eastern Mediterranean countries. Int. J. Equity Health 2013, 12, 60. [Google Scholar] [CrossRef] [Green Version]
  20. Ofori-Asenso, R.; Chin, K.L.; Curtis, A.J.; Zomer, E.; Zoungas, S.; Liew, D. Recent Patterns of Multimorbidity Among Older Adults in High-Income Countries. Popul. Health Manag. 2019, 22, 127–137. [Google Scholar] [CrossRef]
  21. Pengpid, S.; Peltzer, K. Multimorbidity in chronic conditions: Public primary care patients in four greater mekong countries. Int. J. Environ. Res. Public Health 2017, 14, 1019. [Google Scholar] [CrossRef] [Green Version]
  22. Agborsangaya, C.B.; Lau, D.; Lahtinen, M.; Cooke, T.; Johnson, J.A. Multimorbidity prevalence and patterns across socioeconomic determinants: A cross-sectional survey. BMC Public Health 2012, 12, 201. [Google Scholar] [CrossRef] [Green Version]
  23. Afshar, S.; Roderick, P.J.; Kowal, P.; Dimitrov, B.D.; Hill, A.G. Multimorbidity and the inequalities of global ageing: A cross-sectional study of 28 countries using the World Health Surveys. BMC Public Health 2015, 15, 776. [Google Scholar] [CrossRef] [PubMed] [Green Version]
  24. Lim, E.; Gandhi, K.; Davis, J.; Chen, J.J. Prevalence of Chronic Conditions and Multimorbidities in a Geographically Defined Geriatric Population With Diverse Races and Ethnicities. J. Aging Health 2018, 30, 421–444. [Google Scholar] [CrossRef] [PubMed] [Green Version]
  25. Garin, N.; Koyanagi, A.; Chatterji, S.; Tyrovolas, S.; Olaya, B.; Leonardi, M.; Lara, E.; Koskinen, S.; Tobiasz-Adamczyk, B.; Ayuso-Mateos, J.L.; et al. Global Multimorbidity Patterns: A Cross-Sectional, Population-Based, Multi-Country Study. J. Gerontol. Ser. A Biol. Sci. Med. Sci. 2016, 71, 205–214. [Google Scholar] [CrossRef] [PubMed] [Green Version]
  26. Pati, S.; Swain, S.; Hussain, M.A.; Van Den Akker, M.; Metsemakers, J.; Knottnerus, J.A.; Salisbury, C. Prevalence and outcomes of multimorbidity in South Asia: A systematic review. BMJ Open 2015, 5, e007235. [Google Scholar] [CrossRef] [Green Version]
  27. Low, L.L.; Kwan, Y.H.; Ko, M.S.M.; Yeam, C.T.; Lee, V.S.Y.; Tan, W.B.; Thumboo, J. Epidemiologic Characteristics of Multimorbidity and Sociodemographic Factors Associated With Multimorbidity in a Rapidly Aging Asian Country. JAMA Netw. Open 2019, 2, e1915245. [Google Scholar] [CrossRef] [Green Version]
  28. Bobo, W.V.; Yawn, B.P.; St Sauver, J.L.; Grossardt, B.R.; Boyd, C.M.; Rocca, W.A. Prevalence of Combined Somatic and Mental Health Multimorbidity: Patterns by Age, Sex, and Race/Ethnicity. J. Gerontol. Ser. A Biol. Sci. Med. Sci. 2016, 71, 1483–1491. [Google Scholar] [CrossRef] [Green Version]
  29. Rocca, W.A.; Boyd, C.M.; Grossardt, B.R.; Bobo, W.V.; Finney Rutten, L.J.; Roger, V.L.; Ebbert, J.O.; Therneau, T.M.; Yawn, B.P.; St. Sauver, J.L. Prevalence of Multimorbidity in a Geographically Defined American Population. Mayo Clin. Proc. 2014, 89, 1336–1349. [Google Scholar] [CrossRef] [Green Version]
  30. Holland, A.T.; Palaniappan, L.P. Problems With the Collection and Interpretation of Asian-American Health Data: Omission, Aggregation, and Extrapolation. Ann. Epidemiol. 2012, 22, 397–405. [Google Scholar] [CrossRef] [Green Version]
  31. Bloom, B.; Black, L.I. Health of Non-Hispanic Asian Adults: United States, 2010–2014. NCHS Data Brief 2016, 247, 1–8. [Google Scholar]
  32. Hoeffel, E.M.; Rastogi, S.; Kim, M.O.; Shahid, H. The Asian Population: 2010; U.S. Department of Commerce, Economics and Statistics Administration, U.S. Census Bureau: Washington, DC, USA, 2012.
  33. Ortman, J.M.; Velkoff, V.A.; Hogan, H. An Aging Nation: The Older Population in the United States; United States Census Bureau, Economics and Statistics Administration, U.S. Department of Commerce: Suitland, MD, USA, 2014.
  34. U.S. Census Bureau. U.S. Census Bureau 2018 American Community Survey 1-Year Estimates Data Profiles; Table DP05 ACS Demographic and Housing Estimates; U.S. Census Bureau: Hutland Sutherland, MD, USA, 2018.
  35. U.S. Census Bureau. U.S. Census Bureau 2018 ACS 1-Year Estimates Selected Population Profiles; Table S0201 Selected Population Profile in the United States; U.S. Census Bureau: Hutland Sutherland, MD, USA, 2018.
  36. Ro, M.J.; Yee, A.K. Out of the shadows: Asian Americans, Native Hawaiians, and Pacific Islanders. Am. J. Public Health 2010, 100, 776–778. [Google Scholar] [CrossRef]
  37. Islam, N.S.; Khan, S.; Kwon, S.; Jang, D.; Ro, M.; Trinh-Shevrin, C. Methodological issues in the collection, analysis, and reporting of granular data in Asian American populations: Historical challenges and potential solutions. J. Health Care Poor Underserved 2010, 21, 1354–1381. [Google Scholar] [PubMed]
  38. Protection, P.; Act, A.C. Patient Protection and Affordable Care Act. Public Law 2010, 111, 759–762. [Google Scholar]
  39. U.S. Department of Health and Human Services. US Department of Health and Human Services Implementation Guidance on Data Collection Standards for Race, Ethnicity, Sex, Primary Language, and Disability Status; U.S. Department of Health and Human Services: Washington, DC, USA, 2010.
  40. Lochner, K.A.; Cox, C.S. Prevalence of Multiple Chronic Conditions among Medicare Beneficiaries, United States, 2010. Prev. Chronic Dis. 2013, 10, 120137. [Google Scholar] [CrossRef] [PubMed] [Green Version]
  41. Steiner, C.A.; Friedman, B. Hospital Utilization, Costs, and Mortality for Adults With Multiple Chronic Conditions, Nationwide Inpatient Sample, 2009. Prev. Chronic Dis. 2013, 10, 120292. [Google Scholar] [CrossRef] [PubMed] [Green Version]
  42. St Sauver, J.L.; Boyd, C.M.; Grossardt, B.R.; Bobo, W.V.; Rutten, L.J.F.; Roger, V.L.; Ebbert, J.O.; Therneau, T.M.; Yawn, B.P.; Rocca, W.A. Risk of developing multimorbidity across all ages in an historical cohort study: Differences by sex and ethnicity. BMJ Open 2015, 5, e006413. [Google Scholar] [CrossRef] [Green Version]
  43. Gordon, N.P.; Lin, T.Y.; Rau, J.; Lo, J.C. Aggregation of Asian-American subgroups masks meaningful differences in health and health risks among Asian ethnicities: An electronic health record based cohort study. BMC Public Health 2019, 19, 1551. [Google Scholar] [CrossRef] [Green Version]
  44. Johnson-Lawrence, V.; Zajacova, A.; Sneed, R. Education, race/ethnicity, and multimorbidity among adults aged 30–64 in the National Health Interview Survey. SSM Popul. Health 2017, 3, 366–372. [Google Scholar] [CrossRef]
  45. Ward, B.W.; Schiller, J.S. Prevalence of multiple chronic conditions among US adults: Estimates from the national health interview survey, 2010. Prev. Chronic Dis. 2013, 10, E65. [Google Scholar] [CrossRef] [Green Version]
  46. Quiñones, A.R.; Botoseneanu, A.; Markwardt, S.; Nagel, C.L.; Newsom, J.T.; Dorr, D.A.; Allore, H.G. Racial/ethnic differences in multimorbidity development and chronic disease accumulation for middle-aged adults. PLoS ONE 2019, 14, e0218462. [Google Scholar] [CrossRef] [Green Version]
  47. Quiñones, A.R.; Liang, J.; Bennett, J.M.; Xu, X.; Ye, W. How does the trajectory of multimorbidity vary across black, white, and mexican americans in middle and old age? J. Gerontol. Ser. B Psychol. Sci. Soc. Sci. 2011, 66, 739–749. [Google Scholar] [CrossRef]
  48. Centers for Disease Control and Prevention NHIS—About the National Health Interview Survey. Available online: https://www.cdc.gov/nchs/nhis/about_nhis.htm (accessed on 16 December 2019).
  49. Centers for Disease Control and Prevention NHIS—Race and Hispanic Origin—Historical Context. Available online: https://www.cdc.gov/nchs/nhis/rhoi/rhoi_history.htm (accessed on 16 December 2019).
  50. Parsons, V.L.; Moriarity, C.; Jonas, K.; Moore, T.F.; Davis, K.E.; Tompkins, L. Design and estimation for the national health interview survey, 2006–2015. Vital Heal. Stat. 2014, 2, 1–53. [Google Scholar]
  51. Centers for Disease Control and Prevention NHIS—Data, Questionnaires and Related Documentation. Available online: https://www.cdc.gov/nchs/nhis/data-questionnaires-documentation.htm (accessed on 13 March 2020).
  52. Johnston, M.C.; Crilly, M.; Black, C.; Prescott, G.J.; Mercer, S.W. Defining and measuring multimorbidity: A systematic review of systematic reviews. Eur. J. Public Health 2019, 29, 182–189. [Google Scholar] [CrossRef] [PubMed]
  53. Goodman, R.A.; Posner, S.F.; Huang, E.S.; Parekh, A.K.; Koh, H.K. Defining and Measuring Chronic Conditions: Imperatives for Research, Policy, Program, and Practice. Prev. Chronic Dis. 2013, 10, 120239. [Google Scholar] [CrossRef] [Green Version]
  54. Antonovsky, A. Social class, life expectancy and overall mortality. Milbank Mem. Fund Q. 1967, 5, 31–73. [Google Scholar] [CrossRef]
  55. Adler, N.E.; Boyce, T.; Chesney, M.A.; Cohen, S.; Folkman, S.; Kahn, R.L.; Syme, S.L. Socioeconomic Status and Health: The Challenge of the Gradient. Am. Psychol. 1994, 49, 15. [Google Scholar] [CrossRef] [PubMed]
  56. House, J.S.; Lepkowski, J.M.; Kinney, A.M.; Mero, R.P.; Kessler, R.C.; Herzog, A.R. The social stratification of aging and health. J. Health Soc. Behav. 1994, 35, 213–234. [Google Scholar] [CrossRef]
  57. Preston, S.H.; Kitagawa, E.M.; Hauser, P.M. Differential Mortality in the United States: A Study in Socioeconomic Epidemiology. J. Am. Stat. Assoc. 1974, 69, 574. [Google Scholar] [CrossRef]
  58. Marmot, M. Social determinants of health inequalities. Lancet 2005, 365, 1099–1104. [Google Scholar] [CrossRef] [Green Version]
  59. Schwandt, H.M.; Coresh, J.; Hindin, M.J. Marital status, hypertension, coronary heart disease, diabetes, and death among African American women and men: Incidence and prevalence in the atherosclerosis risk in communities (ARIC) study participants. J. Fam. Issues 2010, 31, 1211–1229. [Google Scholar] [CrossRef]
  60. Birk, J.L.; Kronish, I.M.; Moise, N.; Falzon, L.; Yoon, S.; Davidson, K.W. Depression and multimorbidity: Considering temporal characteristics of the associations between depression and multiple chronic diseases. Health Psychol. 2019, 38, 802. [Google Scholar] [CrossRef]
  61. World Health Organization. Regional Office for the Western Pacific The Asia-Pacific Perspective: Redefining Obesity and Its Treatment; Health Communications Australia: Sydney, Australia, 2000. [Google Scholar]
  62. Lopez, G.; Ruiz, N.G.; Patten, E. Key facts about Asian Americans. Available online: https://www.pewresearch.org/fact-tank/2017/09/08/key-facts-about-asian-americans/ (accessed on 8 December 2019).
  63. Centers for Disease Control and Prevention. Variance Estimation and Other Analytic Issues, NHIS 2016–2017; Centers for Disease Control and Prevention: Atlanta, GA, USA, 2018.
  64. Centers for Disease Control and Prevention. Variance Estimation and Other Analytic Issues, NHIS 2006–2015; Centers for Disease Control and Prevention: Atlanta, GA, USA, 2016.
  65. Lee, J.W.R.; Brancati, F.L.; Yeh, H.C. Trends in the prevalence of type 2 diabetes in Asians versus whites: Results from the United States National Health Interview Survey, 1997–2008. Diabetes Care 2011, 34, 353–357. [Google Scholar] [CrossRef] [PubMed] [Green Version]
  66. Misra, R.; Patel, T.; Kotha, P.; Raji, A.; Ganda, O.; Banerji, M.A.; Shah, V.; Vijay, K.; Mudaliar, S.; Iyer, D.; et al. Prevalence of diabetes, metabolic syndrome, and cardiovascular risk factors in US Asian Indians: Results from a national study. J. Diabetes Complicat. 2010, 24, 145–153. [Google Scholar] [CrossRef] [PubMed]
  67. Machlin, S.R.; Soni, A. Health care expenditures for adults with multiple treated chronic conditions: Estimates from the medical expenditure panel survey, 2009. Prev. Chronic Dis. 2013, 10, E63. [Google Scholar] [CrossRef] [PubMed] [Green Version]
  68. Hamilton, T.G. The healthy immigrant (migrant) effect: In search of a better native-born comparison group. Soc. Sci. Res. 2015, 54, 353–365. [Google Scholar] [CrossRef] [PubMed] [Green Version]
  69. Pathirana, T.I.; Jackson, C.A. Socioeconomic status and multimorbidity: A systematic review and meta-analysis. Aust. N. Z. J. Public Health 2018, 42, 186–194. [Google Scholar] [CrossRef] [PubMed]
  70. Commodore-Mensah, Y.; Ukonu, N.; Obisesan, O.; Aboagye, J.K.; Agyemang, C.; Reilly, C.M.; Dunbar, S.B.; Okosun, I.S. Length of Residence in the United States is Associated With a Higher Prevalence of Cardiometabolic Risk Factors in Immigrants: A Contemporary Analysis of the National Health Interview Survey. J. Am. Heart Assoc. 2016, 5, e004059. [Google Scholar] [CrossRef] [Green Version]
  71. Lee, S.; Martinez, G.; Ma, G.X.; Hsu, C.E.; Robinson, E.S.; Bawa, J.; Juon, H.S. Barriers to health care access in 13 Asian American communities. Am. J. Health Behav. 2010, 34, 21–30. [Google Scholar] [CrossRef]
  72. Becerra, M.B.; Herring, P.; Marshak, H.H.; Banta, J.E. Generational differences in fast food intake among South-Asian Americans: Results from a population-based survey. Prev. Chronic Dis. 2014, 11, E211. [Google Scholar] [CrossRef] [Green Version]
  73. Unger, J.B.; Reynolds, K.; Shakib, S.; Spruijt-Metz, D.; Sun, P.; Johnson, C.A. Acculturation, physical activity, and fast-food consumption among asian-american and hispanic adolescents. J. Community Health 2004, 29, 467–481. [Google Scholar] [CrossRef]
  74. O’Keefe, E.L.; DiNicolantonio, J.J.; Patil, H.; Helzberg, J.H.; Lavie, C.J. Lifestyle Choices Fuel Epidemics of Diabetes and Cardiovascular Disease Among Asian Indians. Prog. Cardiovasc. Dis. 2016, 58, 505–513. [Google Scholar] [CrossRef] [Green Version]
  75. Ardeshna, D.R.; Bob-Manuel, T.; Nanda, A.; Sharma, A.; Skelton IV, W.P.; Skelton, M.; Khouzam, R.N. Asian-Indians: A review of coronary artery disease in this understudied cohort in the United States. Ann. Transl. Med. 2018, 6, 12. [Google Scholar] [CrossRef] [PubMed] [Green Version]
  76. Misra, R. Immigrant Asian Indians in the U.S.: A Population at Risk for Diabetes and Cardiovascular Disease. Health Educ. 2009, 41, 19–28. [Google Scholar]
  77. Holland, A.T.; Wong, E.C.; Lauderdale, D.S.; Palaniappan, L.P. Spectrum of Cardiovascular Diseases in Asian-American Racial/Ethnic Subgroups. Ann. Epidemiol. 2011, 21, 608–614. [Google Scholar] [CrossRef] [PubMed] [Green Version]
  78. Sharma, A. A National Profile of Functional Limitations Among Asian Indians, Chinese, and Filipinos. J. Gerontol. Ser. B 2020, 75, 1021–1029. [Google Scholar] [CrossRef] [PubMed] [Green Version]
  79. Goodman, R.A.; Ling, S.M.; Briss, P.A.; Parrish, R.G.; Salive, M.E.; Finke, B.S. Multimorbidity Patterns in the United States: Implications for Research and Clinical Practice. J. Gerontol. Ser. A Biol. Sci. Med. Sci. 2016, 71, 215–220. [Google Scholar] [CrossRef] [PubMed] [Green Version]
  80. Aminisani, N.; Stephens, C.; Allen, J.; Alpass, F.; Shamshirgaran, S.M. Socio-demographic and lifestyle factors associated with multimorbidity in New Zealand. Epidemiol. Health 2020, 42, e2020001. [Google Scholar] [CrossRef]
  81. Nagel, G.; Peter, R.; Braig, S.; Hermann, S.; Rohrmann, S.; Linseisen, J. The impact of education on risk factors and the occurrence of multimorbidity in the EPIC-Heidelberg cohort. BMC Public Health 2008, 8, 384. [Google Scholar] [CrossRef] [PubMed] [Green Version]
  82. Schiøtz, M.L.; Stockmarr, A.; Høst, D.; Glümer, C.; Frølich, A. Social disparities in the prevalence of multimorbidity—A register-based population study. BMC Public Health 2017, 17, 422. [Google Scholar] [CrossRef] [Green Version]
  83. National Center for Health Statistics. National Center for Health Statistics 2012 National Health Interview Survey (NHIS) Public Use Data Release: NHIS Survey Description; National Center for Health Statistics: Hayesville, MD, USA, 2013.
  84. National Center for Health Statistics. National Center for Health Statistics 2013 National Health Interview Survey (NHIS) Public Use Data Release: Survey Description; National Center for Health Statistics: Hayesville, MD, USA, 2014.
  85. National Center for Health Statistics. National Center for Health Statistics 2014 National Health Interview Survey (NHIS) Public Use Data Release: Survey Description; National Center for Health Statistics: Hayesville, MD, USA, 2015.
  86. National Center for Health Statistics. National Center for Health Statistics 2015 National Health Interview Survey (NHIS) Public Use Data Release: Survey Description; National Center for Health Statistics: Hayesville, MD, USA, 2016.
  87. National Center for Health Statistic. National Center for Health Statistics 2016 National Health Interview Survey (NHIS) Public Use Data Release: Survey Description; National Center for Health Statistics: Hayesville, MD, USA, 2017.
  88. National Center for Health Statistic. National Center for Health Statistics 2017 National Health Interview Survey (NHIS) Public Use Data Release: Survey Description; National Center for Health Statistics: Hayesville, MD, USA, 2018.
Figure 1. Selected sample characteristics in weighted % among Asian Indian, Chinese, and Non-Hispanic White adults (age ≥ 18 years). National Health Interview Survey, 2012–2017.
Ijerph 17 03336 g001
Figure 2. Adjusted Odds Ratios (AOR) and 95% Confidence Intervals (CI) of racial/ethnic categories from logistic regression on multimorbidity among Asian Indian, Chinese, Non-Hispanic White (NHW) adults (age ≥ 18 years) stratified by age group (<65 years vs. ≥65 years). National Health Interview Survey, 2012–2017.
Ijerph 17 03336 g002
Table 1. Unweighted N and weighted % of characteristics among Asian Indians, Chinese and Non-Hispanic White (NHW) adults (age ≥ 18 years). National Health Interview Survey, 2012–2017.
ALLAsian IndianChineseNHWp-Value
NWt%NWt%NWt%
2297100.02403100.0127,966100.0
Multimorbidity <0.001
No (0–1 chronic conditions)194682.9194182.173,36861.0
Yes (2–3 chronic conditions)27814.137214.936,36026.8
Yes (4+ chronic conditions)733.0903.018,23812.2
Age in Years <0.001
18–39137653.5110742.137,96033.5
40–4942121.042921.718,48916.1
50–6431717.544821.335,42627.8
≥651838.041914.936,09122.6
Poverty Status <0.001
<100% FPL2538.248415.513,8018.4
100%–<200% FPL24410.031112.320,10213.7
200%–<400% FPL41919.645818.834,92826.9
≥400% FPL119354.391742.948,65542.7
Employment <0.001
Employed159968.5138160.772,42860.0
Not employed69631.4102139.355,47640.0
Health Insurance 0.177
Insured210291.6218091.7116,62491.2
Not insured1888.12047.610,9898.5
Marital Status <0.001
Married156477.3126364.167,21763.5
Separated/widowed/divorced1665.53229.035,66717.9
Never married56417.281226.724,81818.5
Doctor’s Office Visit <0.001
No visit53021.156621.218,30714.7
1 visit57626.353324.721,23417.1
2–3 visits62028.363126.933,99526.9
4 and more visits52822.463125.752,42239.7
Alcohol Use <0.001
Abstained109449.499041.118,67514.8
Former drinker1125.31716.920,37814.3
Current drinker106143.8121851.087,15969.5
Physical Activity <0.001
Daily1606.91124.887797.0
Weekly98341.392536.445,76937.6
Monthly/yearly/never/unable112950.4134157.971,95354.2
Depressive Symptoms 0.018
All/most/some of the time2098.92199.213,4779.8
A little/none of the time200686.9210888.0111,03487.4
Region <0.001
Northeast51224.758728.523,15119.0
Midwest40217.126510.033,98927.5
South75332.037415.040,67133.7
West63026.2117746.530,15519.7
NHIS Year 0.003
201240413.344914.120,83816.6
201341514.645816.220,79516.6
201440016.045616.523,05216.7
201541717.642016.821,07216.7
201635120.032917.323,37016.7
201731018.529119.118,83916.7
Based on 132,666 adult (age ≥ 18 years) NHIS participants from pooled cross-sectional data for years from 2012 through 2017, belonging to the racial/ethnic groups (Asian Indian, Chinese, and NHW) and did not have missing data on multimorbidity. Statistically significant differences by racial/ethnic groups were tested with Rao-Scott chi-square tests. Numbers may not add to total due to missing data in education, poverty status, employment, health insurance, marital status, doctor’s office visit, race-adjusted BMI, smoking, alcohol use, physical activity, and depressive symptoms.
Table 2. Unweighted N and weighted % of Multimorbidity among Asian Indian, Chinese, Non-Hispanic White (NHW) adults (age ≥ 18 years). National Health Interview Survey, 2012–2017.
ALLMultimorbidityNo Multimorbidityp-Value
NWt%NWt%
55,411100%77,255100%
Sex 0.001
Women30,83138.840,83861.2
Men24,58037.736,41762.3
Age in Years <0.001
18–39435210.436,09189.6
40–49538427.513,95572.5
50–6418,38149.917,81050.1
≥6527,29474.3939925.7
Race/Ethnicity <0.001
Asian Indian35117.1194682.9
Chinese46217.9194182.1
NHW54,59839.073,36861.0
Education <0.001
Less than high school667651.1484748.9
High school15,59343.616,94156.4
Some college17,43038.124,74961.9
College15,55131.630,50568.4
Poverty Status <0.001
<100% FPL598338.7855561.3
100%–<200% FPL10,08844.110,56955.9
200%–<400% FPL15,21738.820,58861.2
≥400% FPL19,12135.231,64464.8
Employment <0.001
Employed20,66626.254,74273.8
Not employed34,73056.422,46343.6
Health Insurance <0.001
Insured52,62439.768,28260.3
Not insured271222.8866977.2
Marital Status <0.001
Married28,12839.041,91661.0
Separated/widowed/divorced21,65558.314,50041.7
Never married552816.820,66683.2
Doctor’s Office Visit <0.001
No visit274013.016,66387.0
1 visit539621.116,94778.9
2–3 visits14,11336.321,13363.7
4 and more visits32,25356.821,32843.2
Race-adjusted BMI < 0.001
Underweight/normal14,22926.133,13973.9
Overweight18,72639.824,77260.2
Obese20,41651.616,76248.4
Smoking <0.001
Never smoked25,91231.847,30868.2
Former smoker19,73753.115,61246.9
Current smoker949637.613,97462.4
Alcohol Use <0.001
Abstained896836.811,79163.2
Former drinker12,56157.9810042.1
Current drinker33,18534.656,25365.4
Physical Activity <0.001
Daily290629.2614570.8
Weekly13,23026.234,44773.8
Monthly/yearly/never/unable38,70047.835,72352.2
Depressive Symptoms <0.001
All/most/some of the time802554.2588045.8
A little/none of the time45,89536.569,25363.5
Region <0.001
Northeast10,38538.013,86562.0
Midwest14,41638.020,24062.0
South18,15540.123,64359.9
West12,45535.619,50764.4
Foreign-Born Status <0.001
Born in the U.S.52,65439.370,29860.7
Born outside the U.S.274126.5689973.5
NHIS Year <0.001
2012871637.712,97562.3
2013837736.013,29164.0
201410,00438.513,90461.5
2015925738.512,65261.5
201610,47839.313,57260.7
2017857939.410,86160.6
Based on 132,666 adult (age ≥ 18 years) NHIS participants from pooled cross-sectional data for years from 2012 through 2017, belonging to the racial/ethnic groups (Asian Indian, Chinese, and NHW) and did not have missing data on multimorbidity. Statistically significant differences by multimorbidity were tested with Rao-Scott chi-square tests. Numbers may not add to total due to missing data in education, poverty status, employment, health insurance, marital status, doctor’s office visit, race-adjusted BMI, smoking, alcohol use, physical activity, depressive symptoms, and foreign-born status.
Table 3. Unadjusted Odds Ratios (UOR) and Adjusted Odds Ratios (AOR) and 95% Confidence Intervals (CI) of racial/ethnic categories from logistic regression on multimorbidity among Asian Indian, Chinese, and Non-Hispanic White (NHW) adults (age ≥ 18 years). National Health Interview Survey, 2012–2017.
Logistic Regression ModelUOR95% CIp-Value
Model 1—Unadjusted
Racial/Ethnic Categories
Asian Indian0.32(0.27, 0.38)<0.001
Chinese0.34(0.30, 0.39)<0.001
NHW (Ref)
AOR95% CIp-value
Model 2—adjusted for sex and age
Racial/Ethnic Categories
Asian Indian0.50(0.42, 0.59)<0.001
Chinese0.36(0.32, 0.42)<0.001
NHW (Ref)
Model 3—adjusted for sex, age, education, poverty status, employment status, marital status, health insurance, doctor’s office visit, race-adjusted BMI, physical activity, smoking and alcohol use, depressive symptoms, region, foreign-born status and NHIS year
Racial/Ethnic Categories
Asian Indian0.73(0.61, 0.89)0.001
Chinese0.63(0.53, 0.75)<0.001
NHW (Ref)
Based on 132,666 adult (age ≥ 18 years) NHIS participants from pooled cross-sectional data for years from 2012 through 2017, belonging to the racial/ethnic groups (Asian Indian, Chinese, and NHW) and did not have missing data on multimorbidity.

