Using Ecosystem Service Flows to Inform Ecological Compensation: Theory & Application


Abstract
:
1. Introduction
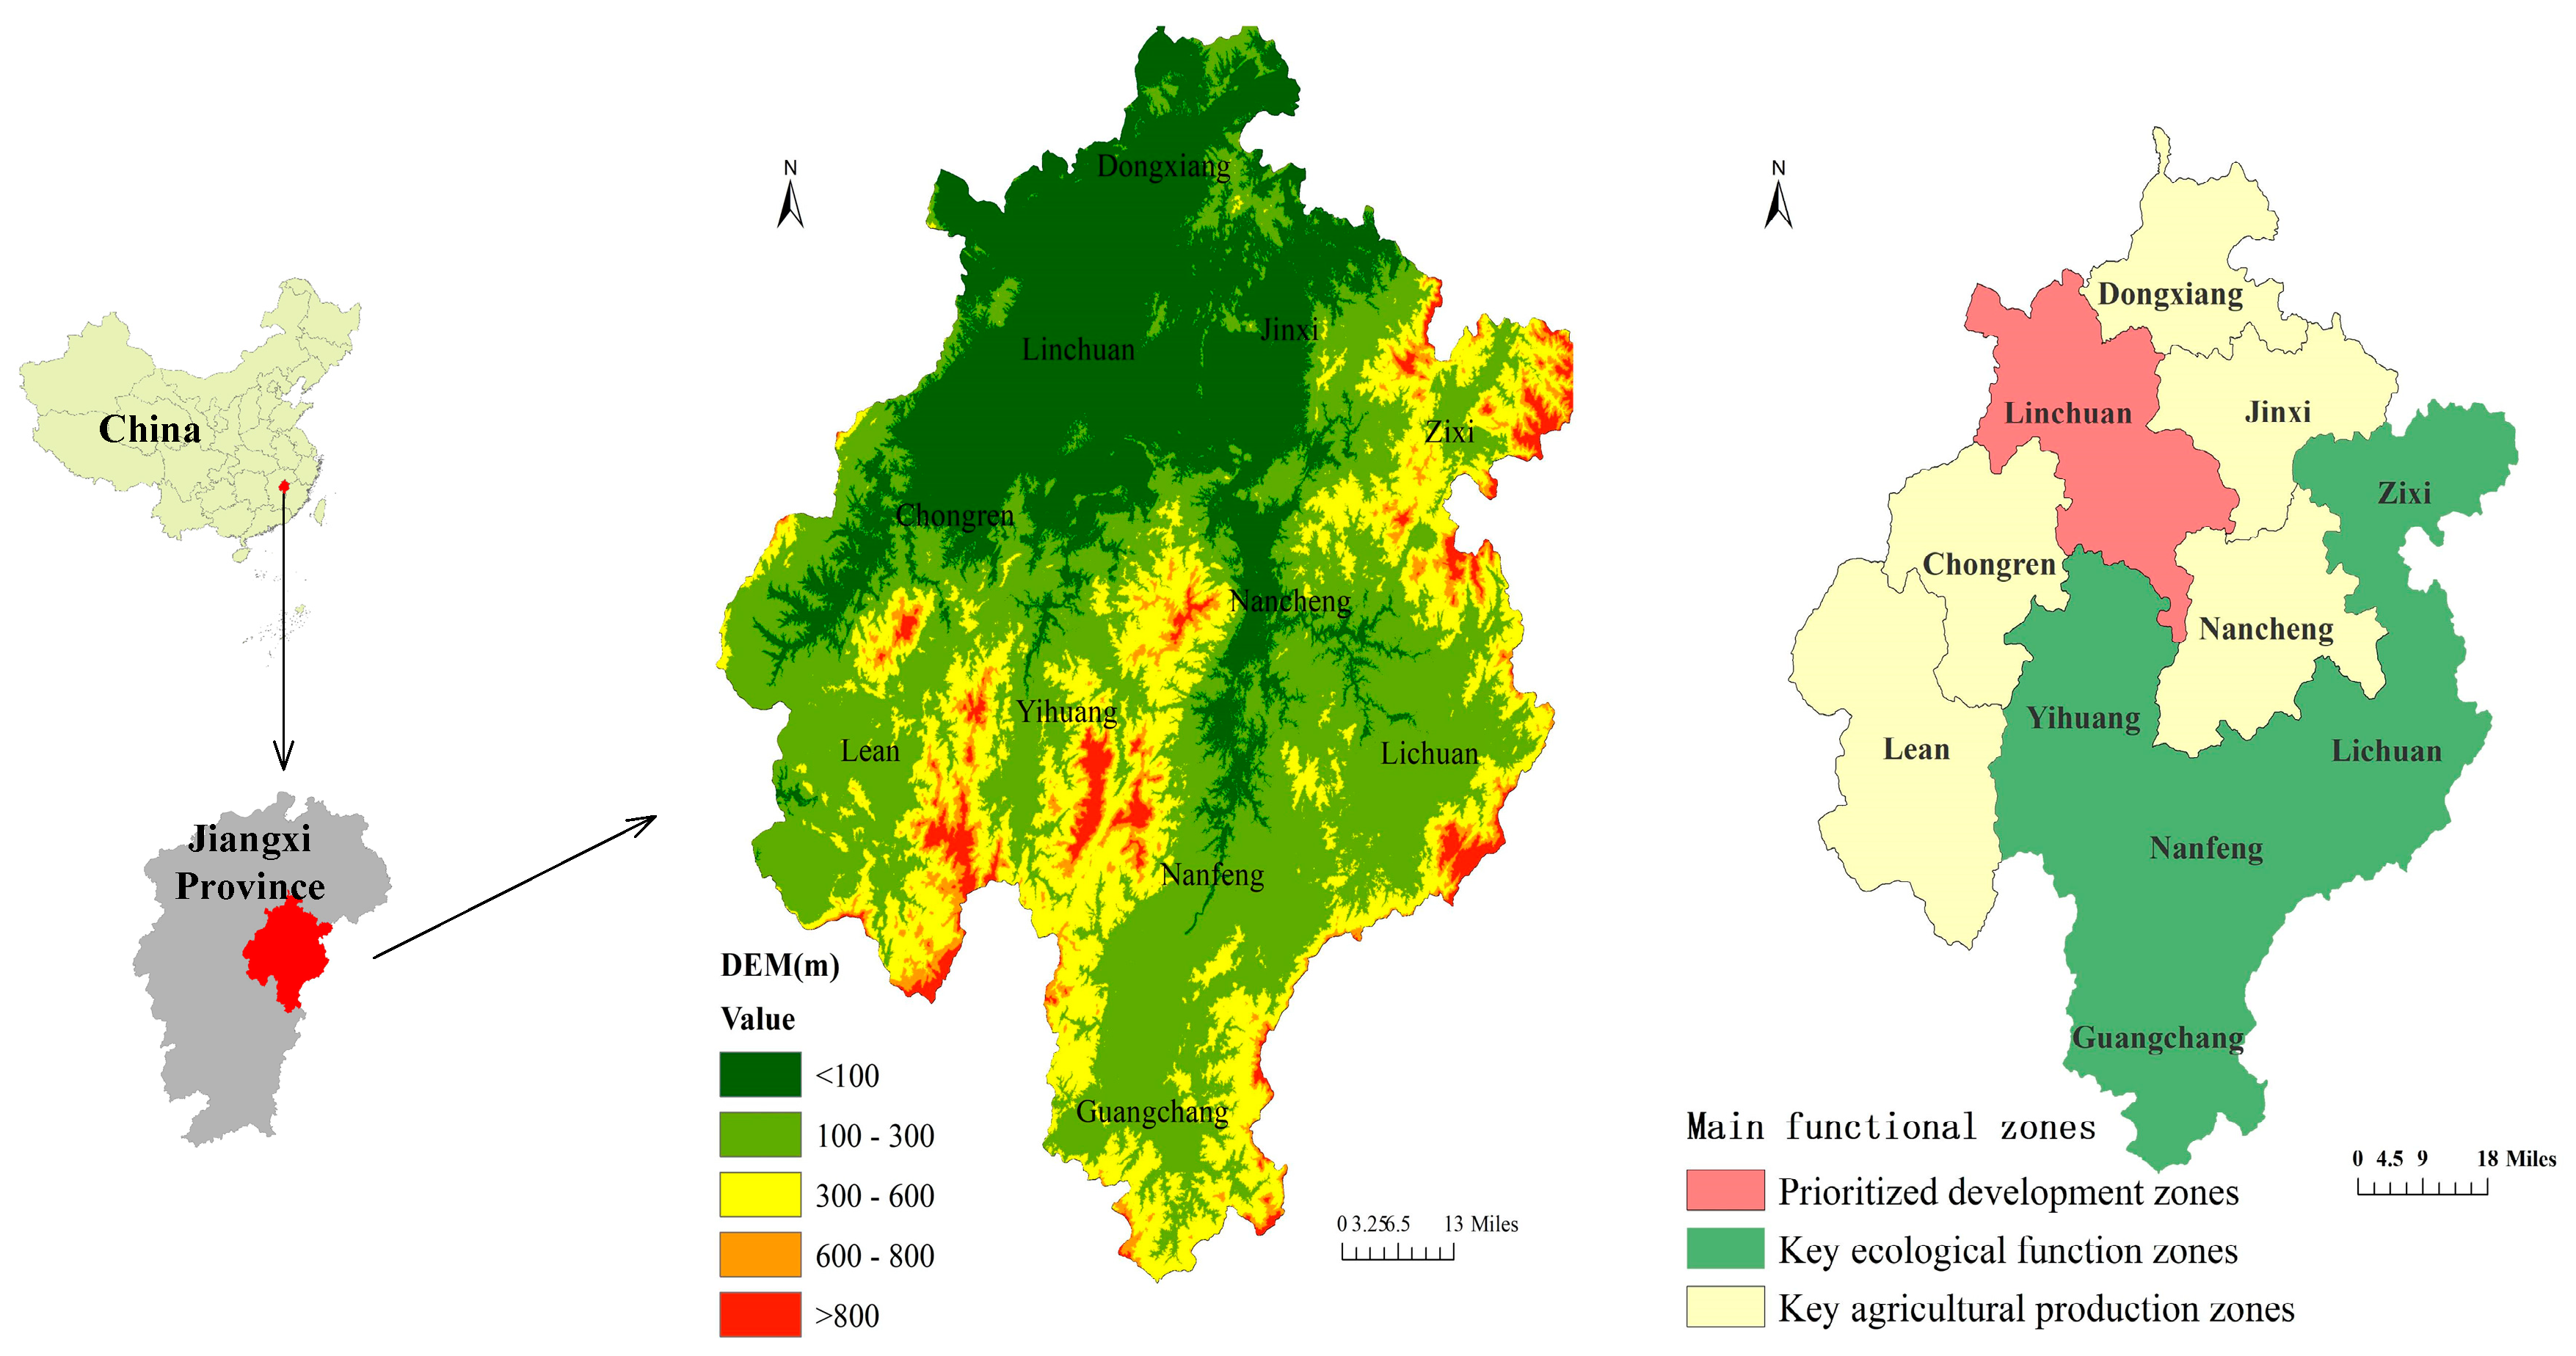
2. Study Area
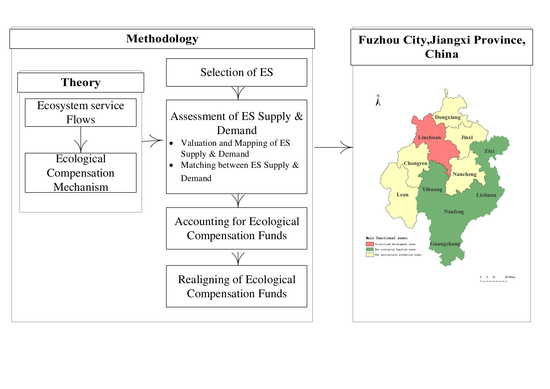
3. Materials and Methods
3.1. The Selection of ES
3.2. Data Sources
3.3. Assessment of Ecological Compensation Funds
3.3.1. Valuation and Mapping of ES Supply and Demand
Water Conservation
Soil Retention
3.3.2. The Matching between ES Supply and Demand
Water Conservation
Soil Retention
3.3.3. Accounting for Ecological Compensation Funds
Water Conservation
Soil Retention
3.3.4. Realigning of Ecological Compensation Funds
4. Results
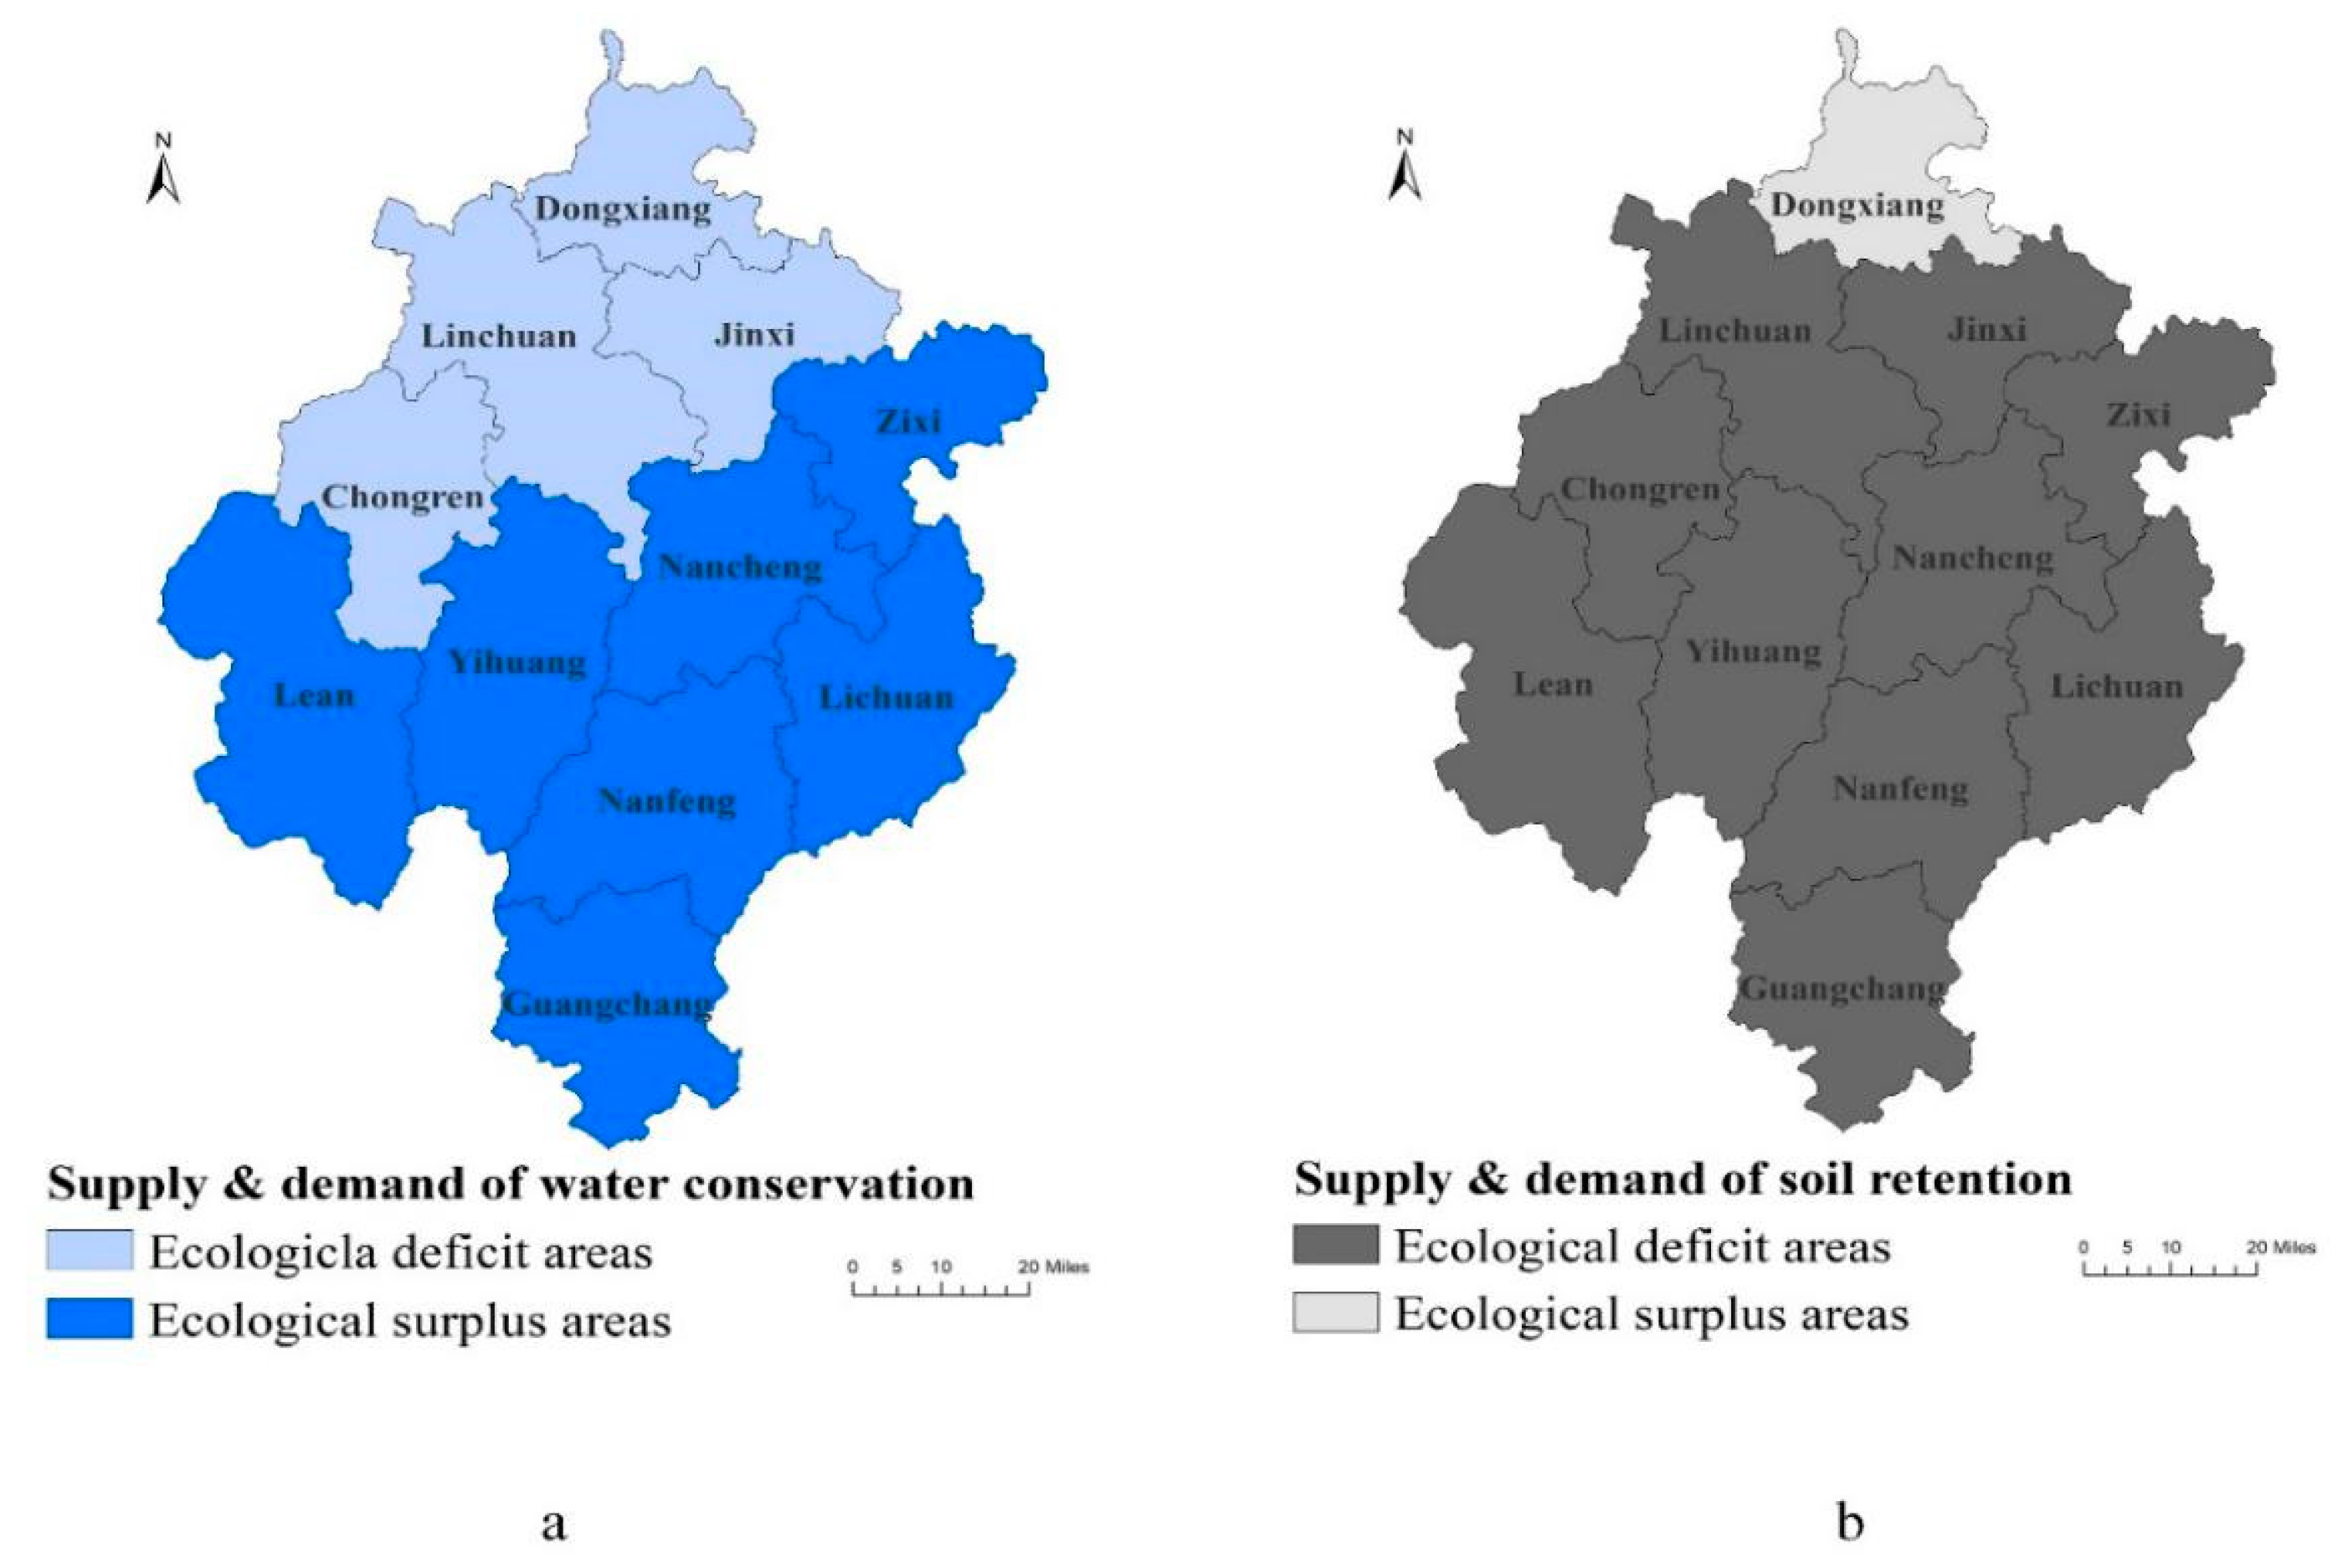
4.1. Water Conservation
4.2. Soil Retention
4.3. Realigning of Ecological Compensation Funds
5. Discussion
5.1. The Practical Needs for Ecological Compensation Standards Based on Ecosystem Service Flows
5.2. Addressing Double-Trade-offs Between ES, Social Development, and Ecosystem Protection
5.3. The Legitimacy of Ecological Compensation Policy
5.4. The Limitations
6. Conclusions
Author Contributions
Funding
Acknowledgments
Conflicts of Interest
References
- Fisher, B.; Turner, R.K.; Morling, P. Defining and classifying ecosystem services for decision making. Ecol. Econ. 2009, 68, 643–653. [Google Scholar] [CrossRef] [Green Version]
- Braat, L.C.; de Groot, R. The ecosystem services agenda: Bridging the worlds of natural science and economics, conservation and development, and public and private policy. Ecosyst. Serv. 2012, 1, 4–15. [Google Scholar] [CrossRef] [Green Version]
- Millennium Ecosystem Assessment. Ecosystems and Human Well-Being: Biodiversity Synthesis; World Resources Institute: Washington, DC, USA, 2005. [Google Scholar]
- Wang, L.; Zheng, H.; Wen, Z.; Liu, L.; Robinson, B.E.; Li, R.; Li, C.; Kong, L. Ecosystem service synergies/trade-offs informing the supply-demand match of ecosystem services: Framework and application. Ecosyst. Serv. 2019, 37, 100939. [Google Scholar] [CrossRef]
- Engel, S.; Pagiola, S.; Wunder, S. Designing payments for environmental services in theory and practice: An overview of the issues. Ecol. Econ. 2008, 65, 663–674. [Google Scholar] [CrossRef]
- Adhikari, B.; Boag, G. Designing payments for ecosystem services schemes: Some considerations. Curr. Opin. Env. Sust. 2013, 5, 72–77. [Google Scholar] [CrossRef]
- Yu, H.; Xie, W.; Yang, L.; Du, A.; Almeida, C.M.V.B.; Wang, Y. From payments for ecosystem services to eco-compensation: Conceptual change or paradigm shift? Sci. Total Environ. 2020, 700, 134627. [Google Scholar] [CrossRef]
- Burkhard, B.; Kandziora, M.; Hou, Y.; Müller, F. Ecosystem Service Potentials, Flows and Demands—Concepts for Spatial Localisation, Indication and Quantification. Landsc. Online 2014, 34, 1–32. [Google Scholar] [CrossRef]
- Costanza, R.; D’Arge, R.; Groot, R.D.; Farber, S.; Grasso, M.; Hannon, B.; Limburg, K.; Naeem, S.; O’Neill, R.V.; Paruelo, J. The value of the world’s ecosystem services and natural capital. World Environ. 1999, 387, 3–15. [Google Scholar]
- Daily, G.C.; Kareiva, P.M.; Polasky, S.; Ricketts, T.H.; Tallis, H. Mainstreaming Natural Capital into Decisions: Theory and Practice of Mapping Ecosystem Services; Oxford University Press: Oxford, UK, 2011. [Google Scholar]
- Ouyang, Z.; Zheng, H.; Xiao, Y.; Polasky, S.; Liu, J.; Xu, W.; Wang, Q.; Zhang, L.; Xiao, Y.; Rao, E. Improvements in ecosystem services from investments in natural capital. Science 2016, 352, 1455. [Google Scholar] [CrossRef]
- Ouyang, Z.; Zhu, C.; Yang, G.; Xu, W.; Zheng, H.; Zhang, Y.; Xiao, Y. Gross ecosystem product: Concept, accounting framework and case study. Acta Ecol. Sin. 2013, 33, 6747–6761. [Google Scholar] [CrossRef]
- Chen, H. Land use trade-offs associated with protected areas in China: Current state, existing evaluation methods, and future application of ecosystem service valuation. Sci. Total Environ. 2019, 711, 134688. [Google Scholar] [CrossRef] [PubMed]
- Mandle, L.A.; Ouyang, Z.; Daily, G.C.; Salzman, J.E. Green Growth That Works: Natural Capital Policy and Finance Mechanisms from Around the World; Island Press: Washington, DC, USA, 2019. [Google Scholar]
- Banerjee, S.; Secchi, S.; Fargione, J.; Polasky, S.; Kraft, S. How to sell ecosystem services: A guide for designing new markets. Front. Ecol. Environ. 2013, 11, 297–304. [Google Scholar] [CrossRef] [Green Version]
- Gao, X.; Lin, Y.; Xu, W.; Ouyang, Z. Research progress on the value realization of ecological products. Acta Ecol. Sin. 2020, 40, 24–33. [Google Scholar]
- Jack, B.K.; Kousky, C.; Sims, K.R.E. Designing payments for ecosystem services: Lessons from previous experience with incentive-based mechanisms. Proc. Natl. Acad. Sci. USA 2008, 105, 9465–9470. [Google Scholar] [CrossRef] [PubMed] [Green Version]
- Kong, L.; Zheng, H.; Rao, E.; Xiao, Y.; Ouyang, Z.; Li, C. Evaluating indirect and direct effects of eco-restoration policy on soil conservation service in Yangtze River Basin. Sci. Total Environ. 2018, 631, 887–894. [Google Scholar] [CrossRef] [PubMed]
- Sone, J.S.; Gesualdo, G.C.; Zamboni, P.A.P.; Vieira, N.O.M.; Mattos, T.S.; Carvalho, G.A.; Rodrigues, D.B.B.; Sobrinho, T.A.; Oliveira, P.T.S. Water provisioning improvement through payment for ecosystem services. Sci. Total Environ. 2019, 655, 1197–1206. [Google Scholar] [CrossRef]
- Ouyang, Z.; Zheng, H.; Yue, P. Establishment of ecological compensation mechanisms in China: Perspectives and strategies. Acta Ecol. Sin. 2013, 33, 686–692. [Google Scholar] [CrossRef] [Green Version]
- Zhou, Y.; Zhou, J.; Liu, H.; Xia, M. Study on eco-compensation standard for adjacent administrative districts based on the maximum entropy production. J. Clean. Prod. 2019, 221, 644–655. [Google Scholar] [CrossRef]
- Wunder, S. Payments for Environmental Services: Some Nuts and Bolts. Practitioner 2005, 239, 1–4. [Google Scholar]
- Li, X.; Miao, H.; Zheng, H.; Ouyang, Z. Main methods for setting ecological compensation standard and their application. Acta Ecol. Sin. 2009, 29, 4875–4883. [Google Scholar]
- Song, B.; Zhang, Y.; Zhang, L.; Zhang, F. A top-down framework for cross-regional payments for ecosystem services. J. Clean. Prod. 2018, 182, 238–245. [Google Scholar] [CrossRef]
- Serna-Chavez, H.M.; Schulp, C.J.E.; Bodegom, P.M.V.; Bouten, W.; Verburg, P.H.; Davidson, M.D. A quantitative framework for assessing spatial flows of ecosystem services. Ecol. Indic. 2014, 39, 24–33. [Google Scholar] [CrossRef] [Green Version]
- Crossman, N.D.; Burkhard, B.; Nedkov, S.; Willemen, L.; Petz, K.; Palomo, I.; Drakou, E.G.; Martín-Lopez, B.; McPhearson, T.; Boyanova, K. A blueprint for mapping and modelling ecosystem services. Ecosyst. Serv. 2013, 4, 4–14. [Google Scholar] [CrossRef]
- Egoh, B.; Drakou, E.G.; Dunbar, M.B.; Maes, J.; Willemen, L. Indicators for Mapping Ecosystem Services: A Review; European Commission, Joint Research Centre (JRC): Brussels, Belgium, 2012. [Google Scholar]
- Xu, J.; Xiao, Y.; Xie, G.; Wang, Y.; Jiang, Y. Computing payments for wind erosion prevention service incorporating ecosystem services flow and regional disparity in Yanchi County. Sci. Total Environ. 2019, 674, 563–579. [Google Scholar] [CrossRef] [PubMed]
- Fuzhou Water Conservancy Bureau. Fuzhou Water Resources Bulletin; Fuzhou Water Conservancy Bureau: Fuzhou, China, 2016; pp. 1–41.
- People’s Government of Jiangxi Province. Main Function Zone Planning of Jiangxi Province. Available online: http://www.jiangxi.gov.cn/bmgkxx/sfzggw/fzgh/fzgh/201309/P020130927595782503847.pdf (accessed on 11 May 2020).
- Fuzhou Statistics Bureau. Fuzhou Statistical Yearbook; China Statistics Press: Beijing, China, 2016. [Google Scholar]
- Mehring, M.; Ott, E.; Hummel, D. Ecosystem services supply and demand assessment: Why social-ecological dynamics matter. Ecosyst. Serv. 2018, 30, 124–125. [Google Scholar] [CrossRef]
- Costanza, R. Ecosystem Services: Multiple Classification Systems Are Needed. Biol. Conserv. 2008, 141, 350–352. [Google Scholar] [CrossRef]
- Potschin-Young, M.; Haines-Young, R.; Görg, C.; Heink, U.; Jax, K.; Schleyer, C. Understanding the role of conceptual frameworks: Reading the ecosystem service cascade. Ecosyst. Serv. 2018, 29, 428–440. [Google Scholar] [CrossRef]
- Randall, A. The problem of market failure. Nat. Resour. J. 1983, 23, 131–148. [Google Scholar]
- O’Higgins, T.; Nogueira, A.A.; Lillebø, A.I. A simple spatial typology for assessment of complex coastal ecosystem services across multiple scales. Sci. Total Environ. 2019, 649, 1452–1466. [Google Scholar] [CrossRef]
- Gao, X.; Cheng, H.; Zheng, H.; Ouyang, Z. Research on the Policy instruments for the value realization of ecological products. Acta Ecol. Sin. 2019, 39, 8746–8754. [Google Scholar]
- Wieder, W.; Boehnert, J.; Bonan, G.; Langseth, M. Regridded Harmonized World Soil Database v1. 2; ORNL DAAC: Oak Ridge, TN, USA, 2014. [Google Scholar]
- Institute of Geographical Sciences and Resources. Resource and Environment Data Cloud Platform. 2019. Available online: http://www.resdc.cn/ (accessed on 11 May 2020).
- Bagstad, K.J.; Johnson, G.W.; Voigt, B.; Villa, F. Spatial dynamics of ecosystem service flows: A comprehensive approach to quantifying actual services. Ecosyst. Serv. 2013, 4, 117–125. [Google Scholar] [CrossRef]
- Gong, S.; Xiao, Y.; Zheng, H.; Xiao, Y.; Ouyang, Z. Spatial patterns of ecosystem water conservation in China and its impact factors analysis. Acta Ecol. Sin. 2017, 37, 2455–2462. [Google Scholar]
- Kong, L.; Zheng, H.; Xiao, Y.; Ouyang, Z.; Li, C.; Zhang, J.; Huang, B. Mapping ecosystem service bundles to detect distinct types of multifunctionality within the diverse landscape of the yangtze river basin, China. Sustainability 2018, 10, 857. [Google Scholar] [CrossRef] [Green Version]
- Ministry of Water Resources of the People’s Republic of China. Specification for Calculation of Environmental Flow in Rivers and Lakers; China Water Conservancy and Hydropower Press: Beijing, China, 2014. (In Chinese) [Google Scholar]
- Department of Water Resources of Jiangxi Province. Agricultural Water Quotas in Jiangxi Province; Quality and Technology Surpervision of Jiangxi Province, Department of Water Resources of Jiangxi Province: Nanchang, China, 2018. [Google Scholar]
- Department of Water Resources of Jiangxi Province. Norm of Urban Domestic Water Intake in Jiangxi Province; Quality and Technology Surpervision of Jiangxi Province, Department of Water Resources of Jiangxi Province: Nanchang, China, 2011. [Google Scholar]
- Department of Water Resources of Jiangxi Province. Norm of Domestic Water Intake in Jiangxi Province; Quality and Technology supervision of Jiangxi Province, Department of Water Resources of Jiangxi Province: Nanchang, China, 2017. [Google Scholar]
- Rao, E.; Xiao, Y.; Ouyang, Z.; Zheng, H. Spatial characteristics of soil conservation service and its impact factors in Hainan Island. Acta Ecol. Sin. 2013, 33, 746–755. [Google Scholar]
- Stone, R.P.; Hilborn, D. Universal Soil Loss Equation, USLE; Ministry of Agriculture, Food & Rural Affairs, Agriculture & Rural: Sejong City, China, 2001. [Google Scholar]
- Ministry of Water Resources of the People’s Republic of China. Standards for Classification and Gradation of soil Erosion; Ministry of Water Resources of the People’s Republic of China: Beijing, China, 2008. [Google Scholar]
- Kemkes, R.J.; Farley, J.; Koliba, C.J. Determining when payments are an effective policy approach to ecosystem service provision. Ecol. Econ. 2010, 69, 2069–2074. [Google Scholar] [CrossRef]
- Ge, F. Modern Ecology, 2nd ed.; Science Press: Beijing, China, 2008. [Google Scholar]
- French, N. The valuation of specialised property: A review of valuation methods. J. Property Investment Finance 2004, 22, 533–541. [Google Scholar] [CrossRef]
- Naeem, S.; Bunker, D.E.; Hector, A.; Loreau, M.; Perrings, C. Biodiversity, Ecosystem Functioning, and Human Wellbeing: An Ecological and Economic Perspective; Oxford University Press: Oxford, UK, 2009. [Google Scholar]
- Ouyang, Z.; Jin, L. Developing Gross Ecosystem Product and Ecological Asset Accounting for Eco-Compensation; Science Press: Beijing, China, 2017. [Google Scholar]
- Wunder, S. Revisiting the concept of payments for environmental services. Ecol. Econ. 2015, 117, 234–243. [Google Scholar] [CrossRef]
- Stewart, L. Market instruments, ecosystem services, and property rights: Assumptions and conditions for sustained social and ecological benefits. Land Use Policy 2013, 31, 90–98. [Google Scholar]
- Vujanac-Borovnica, S. Indicators for planning protection and improvement of the environment as integral part of socio-economic development. Sci. Total Environ. 1986, 56, 325–336. [Google Scholar] [CrossRef]
- Aronson, J.; Clewell, A.F.; Blignaut, J.N.; Milton, S.J. Ecological restoration: A new frontier for nature conservation and economics. J. Nat. Conserv. 2006, 14, 135–139. [Google Scholar] [CrossRef] [Green Version]
- Xiao, Y.; Xie, G.; Lu, C.X.; Xu, J. Involvement of ecosystem service flows in human wellbeing based on the relationship between supply and demand. Acta Ecol. Sin. 2016, 36, 3096–3102. [Google Scholar]


| Type of Services | Service | Final Services | Pure Public Goods | Spatial Characteristics | Final Selection |
|---|---|---|---|---|---|
| Provisioning services | Food | Yes | No | Decoupled flow | No |
| Genetic resources | Yes | Yes | Decoupled flow | No | |
| Fresh water | Yes | No | Directional flow | No | |
| Regulating services | Water quality regulation | Yes | Yes | Directional flow | No |
| Climate regulation | Yes | Yes | Omni-directional flow | No | |
| Water conservation | Yes | Yes | Directional flow | Yes | |
| Soil retention | Yes | Yes | Directional flow | Yes | |
| Pollination | Yes | Yes | In situ | No | |
| Cultural services | Recreation and ecotourism | Yes | No | Decoupled flow | No |
| Aesthetic values | Yes | No | Decoupled flow | No | |
| Supporting services | Soil formation | No | Yes | In situ | No |
| Primary production | No | Yes | In situ | No | |
| Nutrient cycling | No | Yes | In situ | No |
| Data | Data Resolution | Data Source |
|---|---|---|
| Land Use/Land Cover (LULC) | 30 m | Remote sensing survey and assessment project of the Chinese Decade of Ecological Environment (2000–2010) and the five-year changes of the ecological environment (2010–2015) |
| Soil map | — 1 | Harmonized World Soil Database version 1.2 |
| Daily climate data | — | Resource and Environment Data Cloud Platform, Data Center for Resources and Environmental Sciences, Chinese Academy of Sciences |
| Digital Elevation Model (DEM) data | 90 m | National Aeronautics and Space Administration (NASA) |
| Socioeconomic data | county scale | Statistical Yearbook |
| Item | Linchuan | Nancheng | Dongxiang | Jinxi | Chongren | Le’an | Nanfeng | Yihuang | Zixi | Lichuan | Guangchang |
|---|---|---|---|---|---|---|---|---|---|---|---|
| Swr (billion m3) | 1.13 | 1.35 | 0.74 | 0.89 | 0.97 | 1.66 | 1.56 | 1.64 | 1.18 | 1.45 | 1.20 |
| Dwr (billion m3) | 1.84 | 1.00 | 1.03 | 1.01 | 0.98 | 1.20 | 0.97 | 0.89 | 0.51 | 0.85 | 0.68 |
| Compensation payment (billion yuan) | 5.75 | — 1 | 2.35 | 0.97 | 0.09 | — | — | — | — | — | — |
| Compensation funds received (billion yuan) | — | 0.81 | — | — | — | 1.07 | 1.38 | 1.74 | 1.56 | 1.39 | 1.21 |
| Surplus ratio (%) | — | 8.87 | — | — | — | 11.66 | 15.07 | 18.97 | 17.04 | 15.19 | 13.19 |
| Item | Linchuan | Nancheng | Dongxiang | Jinxi | Chongren | Le’an | Nanfeng | Yihuang | Zixi | Lichuan | Guangchang |
|---|---|---|---|---|---|---|---|---|---|---|---|
| Ssr (million t) | 5.00 | 6.00 | 2.00 | 3.00 | 4.00 | 12.00 | 17.00 | 10.00 | 5.00 | 6.00 | 11.00 |
| Dsr (million t) | 4.25 | 3.43 | 2.54 | 2.71 | 3.04 | 4.82 | 3.83 | 3.87 | 2.50 | 3.42 | 3.21 |
| Compensation payment (million yuan) | 9.51 | 32.63 | — 1 | 3.73 | 12.17 | 91.03 | 167.02 | 77.66 | 31.75 | 32.73 | 98.81 |
| Compensation funds received (million yuan) | — | — | 557.03 | — | — | — | — | — | — | — | — |
| Item | Linchuan | Nancheng | Dongxiang | Jinxi | Chongren | Le’an | Nanfeng | Yihuang | Zixi | Lichuan | Guangchang |
|---|---|---|---|---|---|---|---|---|---|---|---|
| Compensation payment (billion yuan) | 5.76 | — 1 | 1.79 | 0.97 | 0.10 | — | — | — | — | — | — |
| Compensation received (billion yuan) | — | 0.78 | — | — | — | 0.98 | 1.21 | 1.66 | 1.53 | 1.36 | 1.11 |
© 2020 by the authors. Licensee MDPI, Basel, Switzerland. This article is an open access article distributed under the terms and conditions of the Creative Commons Attribution (CC BY) license (http://creativecommons.org/licenses/by/4.0/).
Share and Cite
Gao, X.; Huang, B.; Hou, Y.; Xu, W.; Zheng, H.; Ma, D.; Ouyang, Z. Using Ecosystem Service Flows to Inform Ecological Compensation: Theory & Application. Int. J. Environ. Res. Public Health 2020, 17, 3340. https://0-doi-org.brum.beds.ac.uk/10.3390/ijerph17093340
Gao X, Huang B, Hou Y, Xu W, Zheng H, Ma D, Ouyang Z. Using Ecosystem Service Flows to Inform Ecological Compensation: Theory & Application. International Journal of Environmental Research and Public Health. 2020; 17(9):3340. https://0-doi-org.brum.beds.ac.uk/10.3390/ijerph17093340
Chicago/Turabian StyleGao, Xiaolong, Binbin Huang, Ying Hou, Weihua Xu, Hua Zheng, Dongchun Ma, and Zhiyun Ouyang. 2020. "Using Ecosystem Service Flows to Inform Ecological Compensation: Theory & Application" International Journal of Environmental Research and Public Health 17, no. 9: 3340. https://0-doi-org.brum.beds.ac.uk/10.3390/ijerph17093340