Implementing a Diabetes Education Program to Reduce Health Disparities in South Texas: Application of the RE-AIM Framework for Planning and Evaluation

 , , , , and
Abstract
:1. Introduction
2. Materials and Methods
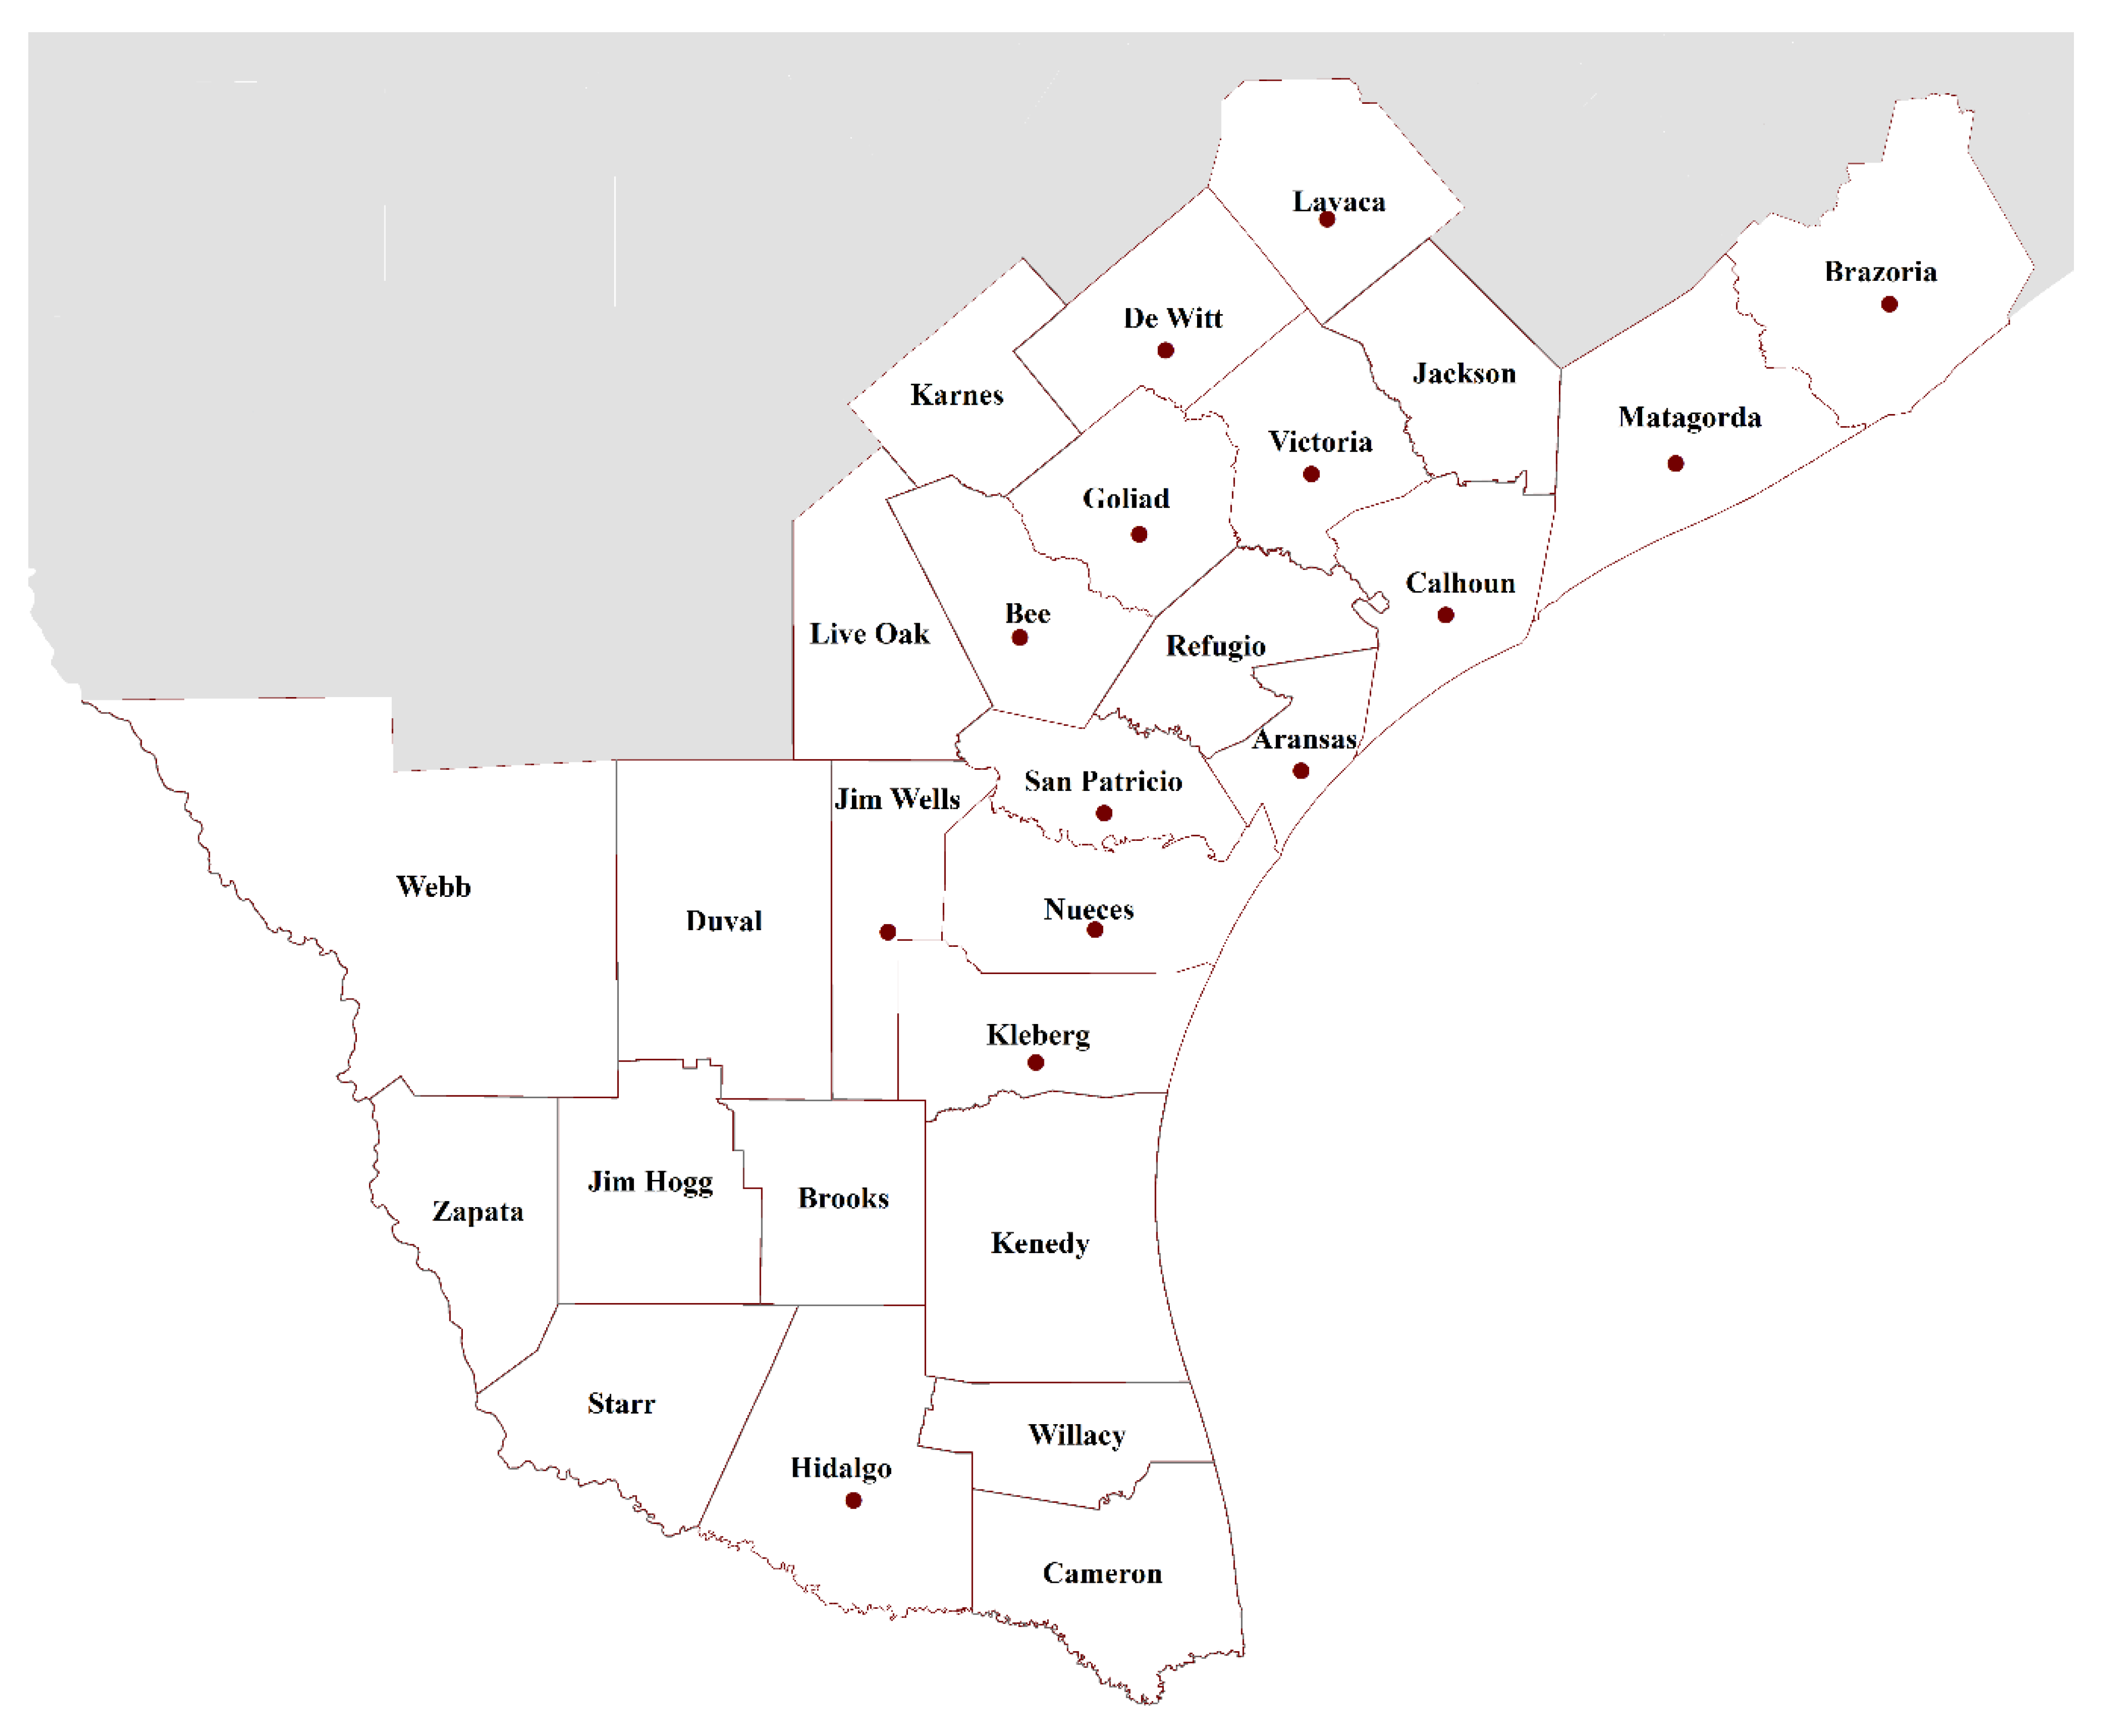
2.1. Population Setting and Targets
2.2. Recruitment
2.3. Intervention
2.4. Data Collection
2.5. Analyses
2.6. Research Ethics
3. Results
3.1. Reach
Retention
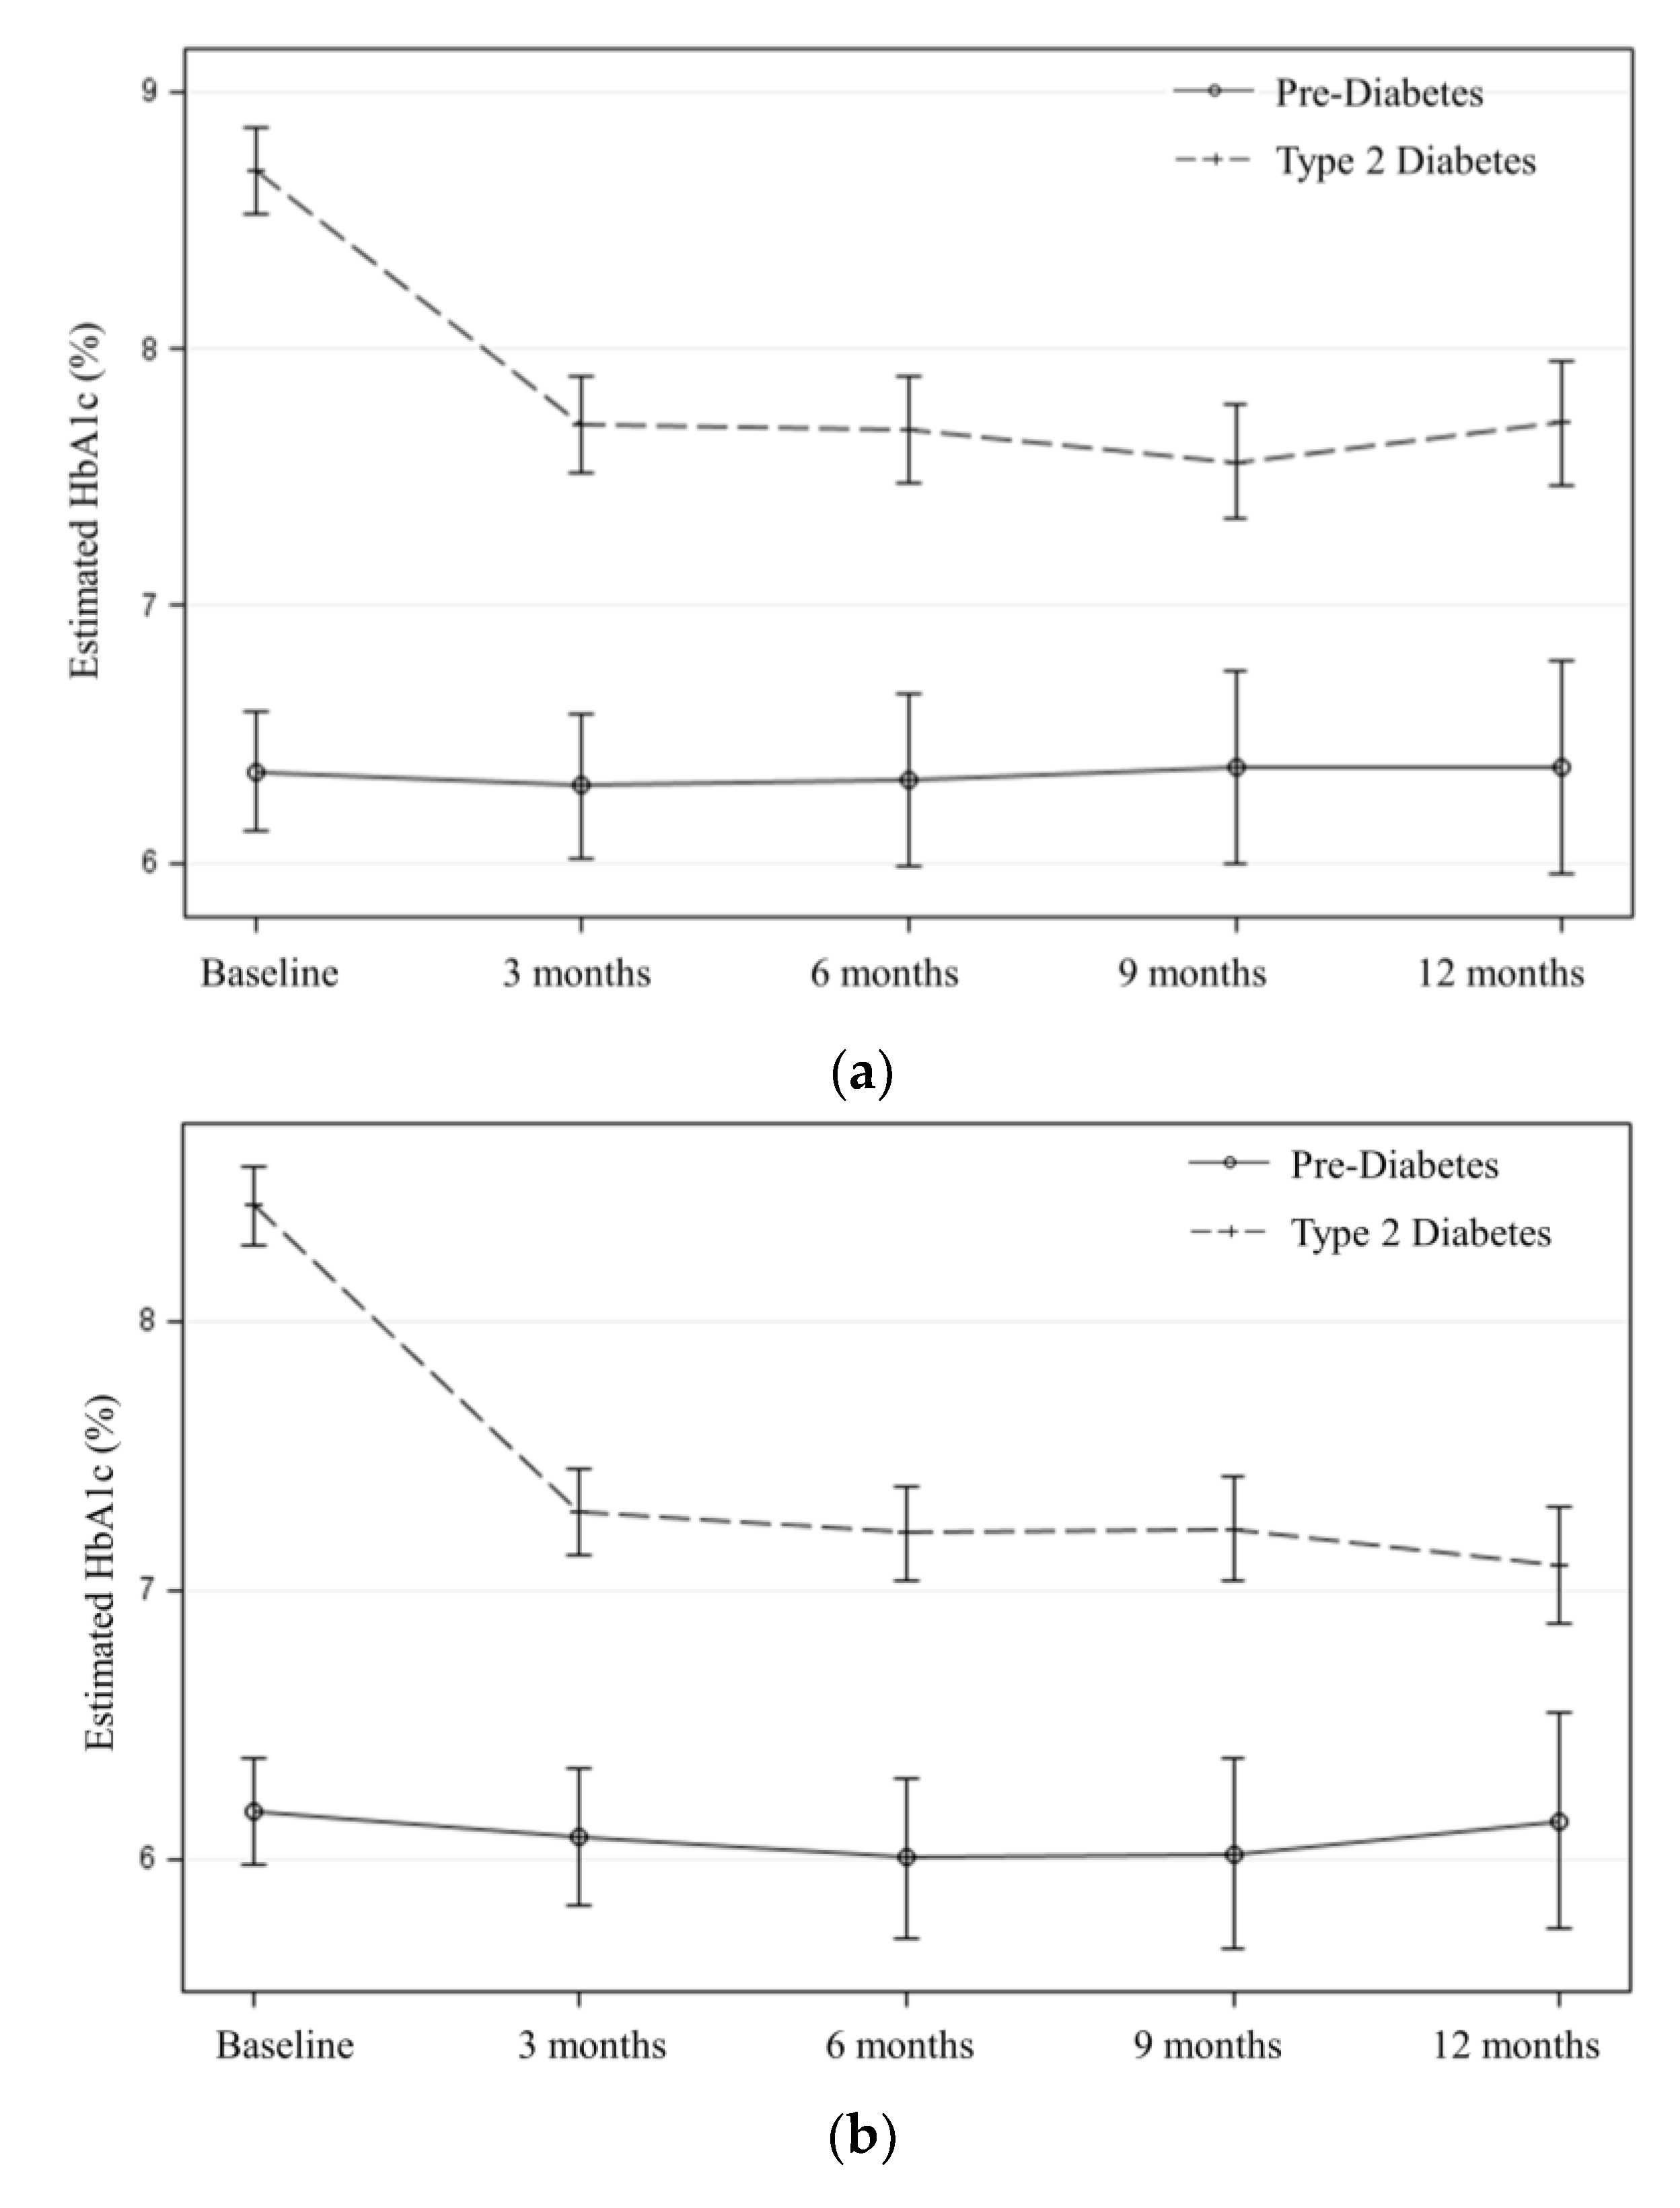
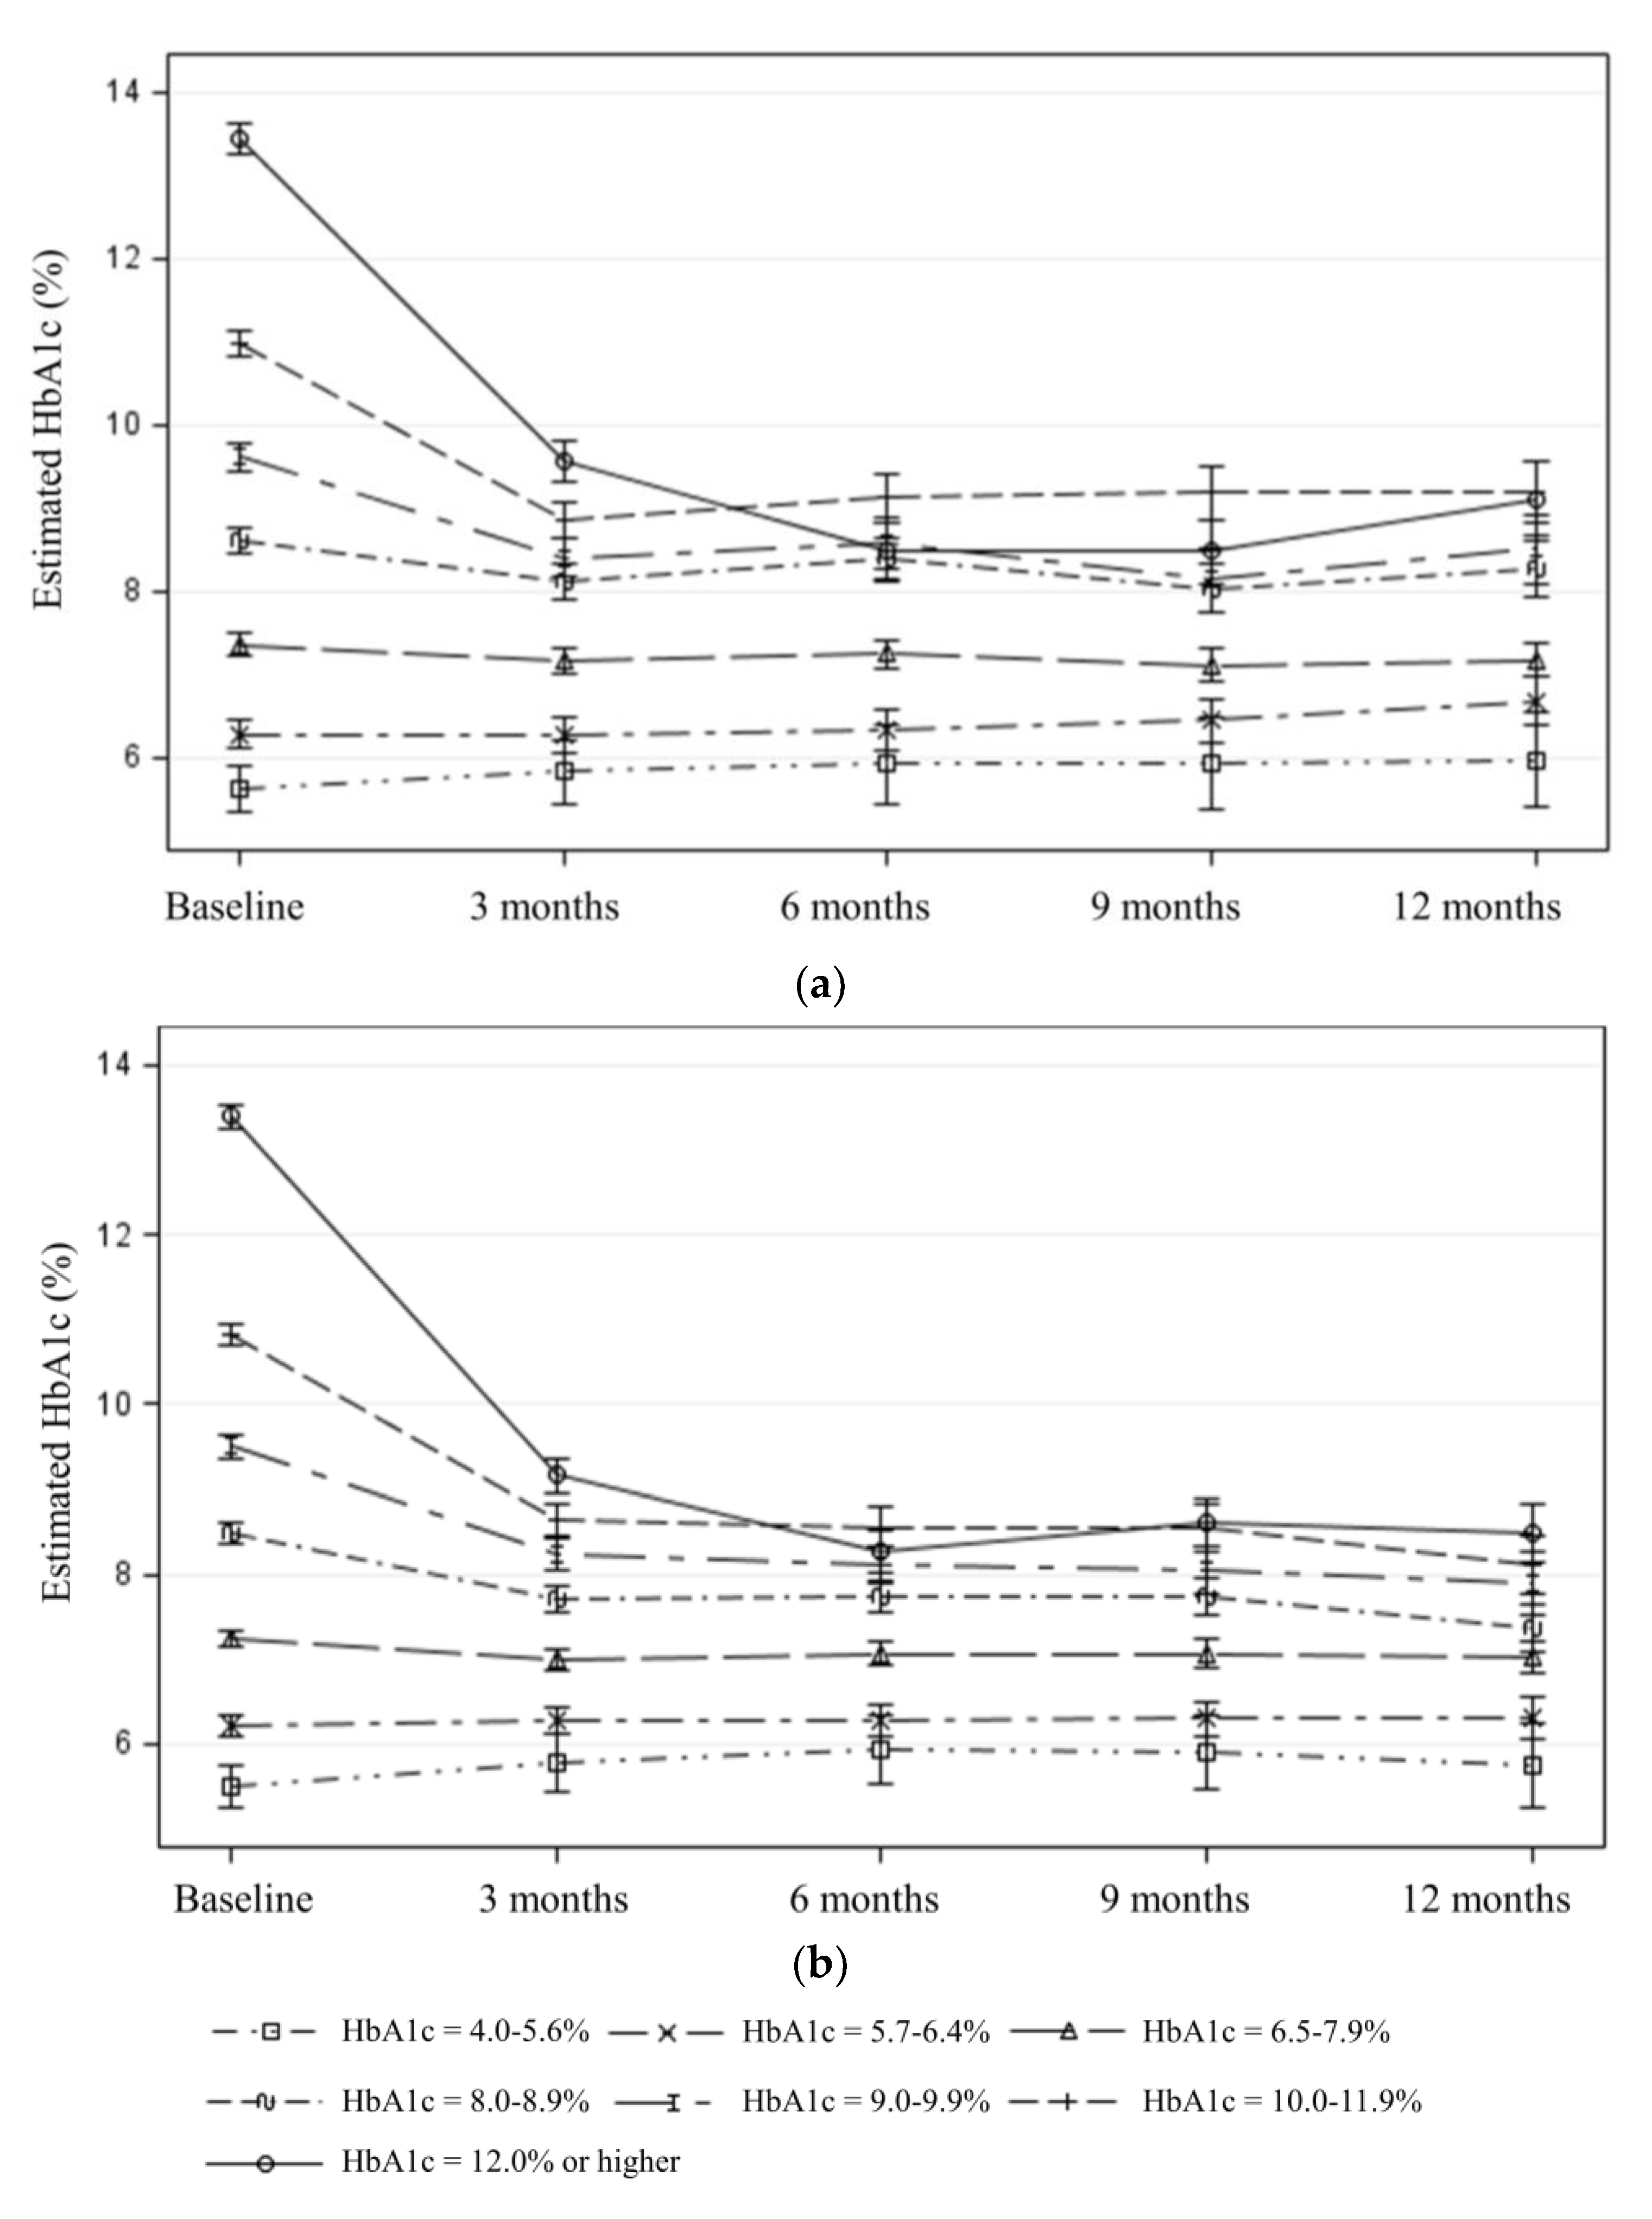
3.2. Effectiveness
3.3. Adoption
3.4. Implementation
3.5. Maintenance
4. Discussion
Study Limitations and Strengths
5. Conclusions
Author Contributions
Funding
Acknowledgments
Conflicts of Interest
References
- Nowakowski, A.C.; Shin, J.; Carretta, H.J. Regional risk: Mapping single and multiple chronic conditions in the United States. SAGE Open 2019, 9. [Google Scholar] [CrossRef] [Green Version]
- Hoffman, A.; Holmes, M. Regional Differences in Rural and Urban Mortality Trends; NC Rural Health Research Program: Chapel Hill, NC, USA, 2017; Available online: https://www.shepscenter.unc.edu/wp-content/uploads/dlm_uploads/2017/08/Regional-Differences-in-Urban-and-Rural-Mortality-Trends.pdf (accessed on 28 July 2020).
- Gershon, A.S.; Hwee, J.; Victor, J.C.; Wilton, A.S.; To, T. Trends in socioeconomic status–related differences in mortality among people with chronic obstructive pulmonary disease. Ann. Am. Thorac. Soc. 2014, 11, 1195–1202. [Google Scholar] [CrossRef] [PubMed]
- Williams, D.R.; Priest, N.; Anderson, N.B. Understanding associations among race, socioeconomic status, and health: Patterns and prospects. Health Psychol. 2016, 35, 407–411. [Google Scholar] [CrossRef] [PubMed]
- U.S.-Mexico Border Health Commission. Healthy Border 2020: A Prevention & Health Promotion Initiative. Available online: https://www.hhs.gov/sites/default/files/res_2805.pdf (accessed on 13 July 2020).
- Rosales, C.B.; Carvajal, S.C.; Zapien, J.E. Emergent Public Health Issues in the US-Mexico Border Region; Frontiers in Public Health: Lausanne, Switzerland, 2016. [Google Scholar] [CrossRef] [Green Version]
- Office of Border Public Health. Available online: https://www.dshs.texas.gov/borderhealth/#:~:text=On%20the%20positive%20side%2C%20there,certain%20contagious%20diseases%20including%20tuberculosis (accessed on 13 July 2020).
- Centers for Diabetes Control and Prevention. Diagnosed Diabetes. Available online: https://gis.cdc.gov/grasp/diabetes/DiabetesAtlas.html# (accessed on 19 August 2020).
- Fisher-Hoch, S.P.; Vatcheva, K.P.; Laing, S.T.; Hossain, M.M.; Rahbar, M.H.; Hanis, C.L.; Brown, H.S., III; Rentfro, A.R.; Reininger, B.M.; McCormick, J.B. Missed opportunities for diagnosis and treatment of diabetes, hypertension, and hypercholesterolemia in Mexican American Population, Cameron County Hispanic Cohort, 2003–2008. Prev. Chron. Dis. 2012, 9, 110298. [Google Scholar] [CrossRef] [PubMed]
- Russell, E.; Oh, K.M.; Zhao, Z. Undiagnosed diabetes among Hispanic and white adults with elevated haemoglobin A1c levels. Diab. Met. Res. Rev. 2019, 35, e3153. [Google Scholar] [CrossRef]
- Casey, R.P.; Rouff, M.A.; Jauregui-Covarrubias, L. Diabetes among Latinos in the Southwestern United States: Border health and binational cooperation. Pan. Am. J. Public Health 2014, 36, 391–395. [Google Scholar]
- United States Census Bureau. Small Area Health Insurance Estimates Interactive Tool. Available online: https://www.census.gov/data-tools/demo/sahie/#/ (accessed on 20 August 2020).
- Ramirez, A.G.; Thompson, I.M.; Vela, L. The South Texas Health Status Review: A Health Disparities Roadmap; Springer Nature: Cham, Switzerland, 2013. [Google Scholar]
- Healthy South Texas. 2016–2017 Bi-annual Report. Available online: https://agrilife.org/healthytexas/files/2018/02/WEB-HSTX-33282-0218_Bi-annual_report.pdf (accessed on 13 July 2020).
- Shive, H. Texas A&M Launches ‘Health South Texas,’ Empowers Texans to Live Healthier Lives. Available online: https://vitalrecord.tamhsc.edu/texas-am-launches-healthy-south-texas-empowers-texans-to-live-healthier-lives/ (accessed on 13 July 2020).
- Millard, A.V.; Graham, M.A.; Mier, N.; Moralez, J.; Perez-Patron, M.; Wickwire, B.; May, M.L.; Ory, M.G. Diabetes screening and prevention in a high-risk, medically isolated border community. Front. Public Health 2017, 5, 135. [Google Scholar] [CrossRef] [Green Version]
- America’s Health Rankings. Annual Report. Available online: www.americashealthrankings.org (accessed on 13 July 2020).
- American Diabetes Association. Your A1C results: What do they mean? Clin. Diabetes 2006, 24, 9. [Google Scholar] [CrossRef] [Green Version]
- Bansal, M.; Shah, M.; Reilly, B.; Willman, S.; Gill, M.; Kaufman, F. Impact of reducing glycated hemoglobin on healthcare costs among a population with uncontrolled diabetes. Appl. Health Econ. Health Policy 2018, 16, 675–684. [Google Scholar] [CrossRef]
- Self-Management Education: Learn More. Feel Better. Available online: https://www.cdc.gov/learnmorefeelbetter/programs/diabetes.htm (accessed on 13 July 2020).
- Ahn, S.; Basu, R.; Smith, M.L.; Jiang, L.; Lorig, K.; Whitelaw, N.; Ory, M.G. The impact of chronic disease self-management programs: Healthcare savings through a community-based intervention. BMC Public Health 2013, 13, 1141. [Google Scholar] [CrossRef] [Green Version]
- Peña-Purcell, N.; Han, G.; Smith, M.L.; Peterson, R.; Ory, M.G. Impact of diabetes self-management education on psychological distress and health outcomes among African Americans and Hispanics/Latinos with diabetes. Diabetes Spectr. 2019, 32, 368–377. [Google Scholar] [CrossRef] [PubMed]
- Meyers, J.L.; Parasuraman, S.; Bell, K.F.; Graham, J.P.; Candrilli, S.D. The high-cost, type 2 diabetes Pmellitus patient: An analysis of managed care administrative data. Arch. Public Health 2014, 72, 6. [Google Scholar] [CrossRef] [Green Version]
- Nguyen, A.; Mui, K. The Staggering True Cost of Diabetes. 2020. Available online: https://www.goodrx.com/blog/wp-content/uploads/2020/04/Diabetes-Cost-White-Paper.pdf (accessed on 13 July 2020).
- Hirsch, J.D.; Bounthavong, M.; Arjmand, A.; Ha, D.R.; Cadiz, C.L.; Zimmerman, A.; Ourth, H.; Morreale, A.P.; Edelman, S.V.; Morello, C.M. Estimated cost-effectiveness, cost benefit, and risk reduction associated with an endocrinologist-pharmacist diabetes intense medical management “tune-up” clinic. J. Manag. Care Spec. Pharm. 2017, 23, 318–326. [Google Scholar] [CrossRef] [PubMed] [Green Version]
- American Diabetes Association. 6. Glycemic Targets: Standards of Medical Care in Diabetes-2020. Diabetes Care 2020, 43, S66–S76. [Google Scholar] [CrossRef]
- Diabetes Education Program. Available online: https://cbhec.tamhsc.edu/diabetes-education/index.html (accessed on 13 July 2020).
- Kash, B.A.; Lin, S.; Baek, J.; Ohsfeldt, R.L. The diabetes management education program in South Texas: An economic and clinical impact analysis. Front. Public Health 2017, 5, 345. [Google Scholar] [CrossRef] [PubMed]
- Glasgow, R.E.; Harden, S.M.; Gaglio, B.; Rabin, B.; Smith, M.L.; Porter, G.C.; Ory, M.G.; Estabrooks, P.A. RE-AIM Planning and Evaluation Framework: Adapting to new science and practice with a 20-Year review. Front. Public Health 2019, 7. [Google Scholar] [CrossRef] [Green Version]
- Healthy Texas. Available online: https://healthytexas.tamu.edu/ (accessed on 21 July 2020).
- Health Professional Shortage Areas: Primary Care, by County. 2019. Available online: https://www.ruralhealthinfo.org/charts/5 (accessed on 13 July 2020).
- US Census Bureau Quick Facts. Available online: https://www.census.gov/quickfacts/fact/table/US/PST045219 (accessed on 13 July 2020).
- DSMES Accreditation and Recognition Process. Available online: https://www.cdc.gov/diabetes/dsmes-toolkit/accreditation-recognition/index.html (accessed on 13 July 2020).
- Medicare Reimbursement Guidelines for DSMT. Available online: https://www.cdc.gov/diabetes/dsmes-toolkit/reimbursement/medicare.html (accessed on 13 July 2020).
- Diabetes: All about Your A1c. Available online: https://www.cdc.gov/diabetes/managing/managing-blood-sugar/A1c.html#:~:text=Diagnosing%20Prediabetes%20or%20Diabetes&text=A%20normal%20A1C%20level%20is,for%20developing%20type%202%20diabetes (accessed on 13 July 2020).
- Gaglio, B.; Shoup, J.A.; Glasgow, R.E. The RE-AIM framework: A systematic review of use over time. Am. J. Public Health 2013, 103, e38–e46. [Google Scholar] [CrossRef]
- Harden, S.M.; Smith, M.L.; Ory, M.G.; Smith-Ray, R.L.; Estabrooks, P.A.; Glasgow, R.E. RE-AIM in clinical, community, and corporate settings: Perspectives, strategies, and recommendations to enhance public health impact. Front. Public Health 2018, 6, 71. [Google Scholar] [CrossRef]
- Ory, M.G.; Altpeter, M.; Belza, B.; Helduser, J.; Zhang, C.; Smith, M.L. Perceived utility of the RE-AIM framework for health promotion/disease prevention initiatives for older adults: A case study from the U.S. evidence-based disease prevention initiative. Front. Public Health 2015, 2, 143. [Google Scholar] [CrossRef]
- Kwan, B.M.; McGinnes, H.L.; Ory, M.G.; Estabrooks, P.A.; Waxmonsky, J.A.; Glasgow, R.E. RE-AIM in the real world: Use of the RE-AIM Framework for program planning and evaluation in clinical and community settings. Front. Public Health 2019, 7, 345. [Google Scholar] [CrossRef] [Green Version]
- US Census Bureau. County Population by Characteristics: 2010–2019. Available online: https://www.census.gov/data/datasets/time-series/demo/popest/2010s-counties-detail.html (accessed on 20 August 2020).
- Feldstein, A.C.; Glasgow, R.E. A Practical, Robust Implementation and Sustainability Model (PRISM) for Integrating Research Findings into Practice. Jt. Comm. J. Qual. Patient Saf. 2008, 34, 228–243. [Google Scholar] [CrossRef]
- Titus, S.K.; Kataoka-Yahiro, M. A systematic review of barriers to access-to-care in Hispanics with Type 2 Diabetes. J. Transcult. Nurs. 2019, 30, 280–290. [Google Scholar] [CrossRef] [PubMed]
- Resnik, D.B. Bioethical issues in providing financial incentives to research participants. Med. Bioeth. 2015, 5, 35–41. [Google Scholar] [CrossRef] [PubMed] [Green Version]
- Carvalho, M.L.; Honeycutt, S.; Escoffery, C.; Glanz, K.; Sabbs, D.; Kegler, M.C. Balancing fidelity and adaptation: Implementing evidence-based chronic disease prevention programs. J. Public Health Manag. Pract. 2013, 19, 348–356. [Google Scholar] [CrossRef] [PubMed] [Green Version]
- Captieux, M.; Pearce, G.; Parke, H.L.; Epiphaniou, E.; Wild, S.; Taylor, S.J.C.; Pinnock, H. Supported self-management for people with type 2 diabetes: A meta-review of quantitative systematic reviews. BMJ Open 2018, 8, e024262. [Google Scholar] [CrossRef] [Green Version]
- Little, R.R.; Rohlfing, C.L. The long and winding road to optimal HbA1c measurement. Clin. Chim. Acta 2013, 418, 63–71. [Google Scholar] [CrossRef] [Green Version]
- Larsen, L.B.; Sonderlund, A.L.; Sondergaard, J.; Thomsen, J.L.; Halling, A.; Hvidt, N.C.; Hvidt, E.A.; Monsted, T.; Pedersen, L.B.; Roos, E.M.; et al. Targeted prevention in primary care aimed at lifestyle-related diseases: A study protocol for a non-randomised pilot study. BMC Fam. Pract. 2018, 19, 124. [Google Scholar] [CrossRef] [Green Version]
- Estabrooks, P.; Smith-Ray, R.; Dzewaltowski, D.; Dowdy, D.; Lattimore, D.; Rheaume, C.; Ory, M.G.; Bazzarre, T.; Griffin, S.F.; Wilcox, S. Sustainability of evidence-based community-based physical activity programs for older adults: Lessons from Active for Life. Behav. Med. Pract. Policy Res. 2011, 1, 208–215. [Google Scholar] [CrossRef] [Green Version]
- Shelton, R.C.; Chambers, D.A.; Glasgow, R.E. An Extension of RE-AIM to enhance sustainability: Addressing dynamic context and promoting health equity over time. Front. Public Health 2020, 8. [Google Scholar] [CrossRef]
- McCreight, M.S.; Rabin, B.A.; Glasgow, R.E.; Ayele, R.A.; Leonard, C.A.; Gilmartin, H.M.; Frank, J.W.; Hess, P.L.; Burke, R.E.; Bttaglia, C.T. Using the Practical, Robust Implementation and Sustainability Model (PRISM) to qualitatively assess multilevel contextual factors to help plan, implement, evaluate, and disseminate health services programs. Transl. Behav. Med. 2019, 9, 1002–1011. [Google Scholar] [CrossRef]
- Ramsey, R. Analysis: A Fast Drop for the TExas Economy—and for the State Budget. Available online: https://www.texastribune.org/2020/04/08/a-fast-drop-for-the-texas-economy-and-for-the-state-budget/ (accessed on 13 July 2020).
- Texas Demographic Center. Diabetes in Texas. Available online: https://demographics.texas.gov/Resources/publications/2018/2018_12_17_DiabetesProfile.pdf (accessed on 13 July 2020).
- The Community Guide. Diabetes Prevention and Control: Evidence-Based Interventions for Your Community. Available online: https://www.thecommunityguide.org/sites/default/files/assets/What-Works-Factsheet-Diabetes.pdf (accessed on 13 July 2020).
- Shah, M.; Kaselitz, E.; Heisler, M. The role of community health workers in diabetes: Update on current literature. Curr. Diab. Rep. 2013, 13, 163–171. [Google Scholar] [CrossRef] [PubMed]
- Health Champions. Available online: https://cbhec.tamhsc.edu/A1c-champs/index.html (accessed on 13 July 2020).
- Shaghaghi, A.; Bhopal, R.S.; Sheikh, A. Approaches to recruiting ‘hard-to-reach’ populations into re-search: A review of the literature. Health Promot. Perspect. 2011, 1, 86–94. [Google Scholar] [CrossRef] [PubMed]
- Diabetes. Available online: https://www.healthypeople.gov/2020/topics-objectives/topic/diabetes (accessed on 13 July 2020).


| Characteristics | Overall (n = 8664) | First Biennium (n = 3514) | Second Biennium (n = 5150) | p-Value a |
|---|---|---|---|---|
| Age | <0.001 ** | |||
| 18–44 years old | 1720 (20.0%) | 594 (17.1%) | 1126 (22.0%) | |
| 45–64 years old | 4757 (55.3%) | 2002 (57.5%) | 2755 (53.8%) | |
| 65 years or older | 2120 (24.7%) | 883 (25.4%) | 1237 (24.2%) | |
| Sex | 0.030 | |||
| Female | 5325 (61.6%) | 2204 (63.0%) | 3121 (60.6%) | |
| Male | 3323 (38.4%) | 1297 (37.0%) | 2026 (39.4%) | |
| Race/Ethnicity | 0.148 | |||
| Non-Hispanic White | 2215 (25.9%) | 930 (26.7%) | 1285 (25.4%) | |
| Non-Hispanic Black | 298 (3.5%) | 111 (3.2%) | 187 (3.7%) | |
| Non-Hispanic Other races | 175 (2.0%) | 80 (2.3%) | 95 (1.9%) | |
| Hispanic | 5859 (68.6%) | 2357 (67.8%) | 3502 (69.1%) | |
| Education | 0.421 | |||
| High school or less | 5553 (72.2%) | 2237 (71.7%) | 3316 (72.5%) | |
| More than high school | 2141 (27.8%) | 884 (28.3%) | 1257 (27.5%) | |
| Primary language | 0.277 b | |||
| English | 7746 (89.5%) | 3153 (90.0%) | 4593 (89.2%) | |
| Spanish | 904 (10.4%) | 351 (10.0%) | 553 (10.7%) | |
| Other | 5 (0.1%) | 1 (0.03%) | 4 (0.1%) | |
| BMI categories | 0.007 * | |||
| Underweight | 432 (5.0%) | 198 (5.6%) | 234 (4.5%) | |
| Normal | 777 (9.0%) | 285 (8.1%) | 492 (9.6%) | |
| Overweight | 1928 (22.3%) | 755 (21.5%) | 1173 (22.8%) | |
| Obese | 5527 (63.8%) | 2276 (64.8%) | 3251 (63.1%) | |
| Diabetes type c | <0.001 ** | |||
| Pre-diabetes | 999 (14.7%) | 425 (15.4%) | 574 (14.3%) | |
| Type 1 | 221 (3.3%) | 81 (2.9%) | 140 (3.5%) | |
| Type 2 | 5463 (80.5%) | 2238 (81.1%) | 3225 (80.1%) | |
| Gestational | 12 (0.2%) | 5 (0.2%) | 7 (0.2%) | |
| Do not know | 93 (1.4%) | 12 (0.4%) | 81 (2.0%) | |
| Baseline A1c (%) (mean (standard deviation)) d | ||||
| Pre-diabetes | 6.2 (0.97) | 6.1 (0.85) | 6.2 (1.05) | 0.024 |
| Type 1 | 8.7 (2.17) | 8.4 (2.00) | 8.9 (2.25) | 0.120 |
| Type 2 | 8.6 (2.25) | 8.5 (2.23) | 8.7 (2.27) | 0.616 |
| Characteristics | 3 Months (n = 8664) | 6 Months (n = 8234) a | 9 Months (n = 7534) b | 12 Months (n = 6798) c | ||||||||
|---|---|---|---|---|---|---|---|---|---|---|---|---|
| Attended (n = 4147) | Not Attended (n = 4517) | p-Value d | Attended (n = 2509) | Did Not Attend (n = 5725) | p-Value d | Attended (n = 1736) | Did Not Attend (n = 5798) | p-Value d | Attended (n = 1252) | Did Not Attend (n = 5546) | p-Value d | |
| Age | <0.001 ** | <0.001 ** | <0.001 ** | <0.001 ** | ||||||||
| 18–44 years old | 614 (35.7%) | 1106 (64.3%) | 296 (18.0%) | 1349 (82.0%) | 188 (12.5%) | 1318 (87.5%) | 120 (9.0%) | 1212 (91.0%) | ||||
| 45–64 years old | 2334 (49.1%) | 2423 (50.9%) | 1410 (31.2%) | 3113 (68.8%) | 962 (23.1%) | 3200 (76.9%) | 703 (18.6%) | 3085 (81.4%) | ||||
| 65 years or older | 1177 (55.5%) | 943 (44.5%) | 791 (39.6%) | 1208 (60.4%) | 575 (31.9%) | 1225 (68.1%) | 423 (25.9%) | 1210 (74.1%) | ||||
| Sex | 0.005 * | 0.003 * | 0.006 * | 0.014 * | ||||||||
| Female | 2611 (49.0%) | 2714 (51.0%) | 1598 (31.7%) | 3447 (68.3%) | 1119 (24.1%) | 3526 (75.9%) | 816 (19.3%) | 3408 (80.7%) | ||||
| Male | 1527 (46.0%) | 1796 (54.0%) | 905 (28.5%) | 2268 (71.5%) | 613 (21.3%) | 2260 (78.7%) | 433 (16.9%) | 2125 (83.1%) | ||||
| Race/Ethnicity | <0.001 ** | <0.001 ** | <0.001 ** | <0.001 ** | ||||||||
| Non-Hispanic White | 1244 (56.2%) | 971 (43.8%) | 818 (38.9%) | 1284 (61.1%) | 594 (30.5%) | 1353 (69.5%) | 444 (25.3%) | 1309 (74.7%) | ||||
| Non-Hispanic Black | 145 (48.7%) | 153 (51.3%) | 86 (30.4%) | 197 (69.6%) | 58 (22.7%) | 197 (77.3%) | 42 (18.5%) | 185 (81.5%) | ||||
| Non-Hispanic Other races | 81 (46.3%) | 94 (53.7%) | 47 (28.7%) | 117 (71.3%) | 40 (26.0%) | 114 (74.0%) | 33 (23.2%) | 109 (76.8%) | ||||
| Hispanic | 2629 (44.9%) | 3230 (55.1%) | 1532 (27.5%) | 4043 (72.5%) | 1027 (20.2%) | 4046 (79.8%) | 716 (15.7%) | 3859 (84.3%) | ||||
| Education | <0.001 ** | <0.001 ** | <0.001 ** | <0.001 ** | ||||||||
| High school or less | 2467 (44.4%) | 3086 (55.6%) | 1413 (26.6%) | 3892 (73.4%) | 944 (19.5%) | 3889 (80.5%) | 684 (15.7%) | 3665 (84.3%) | ||||
| More than high school | 1101 (51.4%) | 1040 (48.6%) | 710 (35.0%) | 1316 (65.0%) | 512 (27.6%) | 1343 (72.4%) | 363 (21.7%) | 1313 (78.3%) | ||||
| Primary language e | <0.001 ** | <0.001 ** | <0.001 ** | <0.001 ** | ||||||||
| English | 3625 (46.8%) | 4121 (53.2%) | 2166 (29.4%) | 5198 (70.6%) | 1505 (22.4%) | 5220 (77.6%) | 1082 (17.8%) | 5005 (82.2%) | ||||
| Spanish | 519 (57.4%) | 385 (42.6%) | 339 (39.6%) | 517 (60.4%) | 228 (28.6%) | 568 (71.4%) | 168 (24.1%) | 530 (75.9%) | ||||
| BMI categories | <0.001 ** | <0.001 ** | <0.001 ** | <0.001 ** | ||||||||
| Underweight | 157 (36.3%) | 275 (63.7%) | 86 (21.2%) | 320 (78.8%) | 52 (13.6%) | 330 (86.4%) | 25 (7.9%) | 293 (92.1%) | ||||
| Normal | 388 (49.9%) | 389 (50.1%) | 249 (33.3%) | 498 (66.7%) | 186 (27.6%) | 489 (72.4%) | 141 (23.2%) | 467 (76.8%) | ||||
| Overweight | 975 (50.6%) | 953 (49.4%) | 600 (32.6%) | 1241 (67.4%) | 431 (25.7%) | 1244 (74.3%) | 310 (20.7%) | 1191 (79.3%) | ||||
| Obese | 2627 (47.5%) | 2900 (52.5%) | 1574 (30.0%) | 3666 (70.0%) | 1067 (22.2%) | 3735 (77.8%) | 776 (17.8%) | 3595 (82.2%) | ||||
| Diabetes type f,g | <0.001 ** | 0.012 | 0.212 | 0.116 | ||||||||
| Pre-diabetes | 548 (54.9%) | 451 (45.1%) | 347 (37.3%) | 584 (62.7%) | 245 (28.6%) | 611 (71.4%) | 190 (24.3%) | 591 (75.7%) | ||||
| Type 1 | 98 (44.3%) | 123 (55.7%) | 62 (29.7%) | 147 (70.3%) | 46 (24.2%) | 144 (75.8%) | 33 (19.2%) | 139 (80.8%) | ||||
| Type 2 | 2801 (51.3%) | 2662 (48.7%) | 1750 (33.6%) | 3456 (66.4%) | 1235 (25.9%) | 3528 (74.1%) | 893 (20.7%) | 3430 (79.3%) | ||||
| Do not know | 33 (35.5%) | 60 (64.5%) | 11 (20.4%) | 43 (79.6%) | 4 (16.0%) | 21 (84.0%) | 2 (16.7%) | 10 (83.3%) | ||||
| Baseline A1c (%) (mean (standard deviation)) h | ||||||||||||
| Pre-diabetes | 6.2 (1.00) | 6.1 (0.94) | 0.231 | 6.1 (0.74) | 6.2 (1.05) | 0.374 | 6.1 (0.73) | 6.2 (1.01) | 0.299 | 6.1 (0.82) | 6.1 (0.94) | 0.775 |
| Type 1 | 8.5 (1.96) | 8.9 (2.32) | 0.146 | 8.4 (2.11) | 8.8 (2.17) | 0.277 | 8.5 (2.24) | 8.7 (2.13) | 0.539 | 9.00 (2.52) | 8.55 (2.05) | 0.284 |
| Type 2 | 8.3 (2.19) | 8.8 (2.30) | <0.001 ** | 8.2 (2.13) | 8.7 (2.29) | <0.001 ** | 8.2 (2.16) | 8.7 (2.28) | <0.001 ** | 8.1 (2.12) | 8.71 (2.29) | <0.001 ** |
© 2020 by the authors. Licensee MDPI, Basel, Switzerland. This article is an open access article distributed under the terms and conditions of the Creative Commons Attribution (CC BY) license (http://creativecommons.org/licenses/by/4.0/).
Share and Cite
Ory, M.G.; Lee, S.; Towne, S.D., Jr.; Flores, S.; Gabriel, O.; Smith, M.L. Implementing a Diabetes Education Program to Reduce Health Disparities in South Texas: Application of the RE-AIM Framework for Planning and Evaluation. Int. J. Environ. Res. Public Health 2020, 17, 6312. https://0-doi-org.brum.beds.ac.uk/10.3390/ijerph17176312
Ory MG, Lee S, Towne SD Jr., Flores S, Gabriel O, Smith ML. Implementing a Diabetes Education Program to Reduce Health Disparities in South Texas: Application of the RE-AIM Framework for Planning and Evaluation. International Journal of Environmental Research and Public Health. 2020; 17(17):6312. https://0-doi-org.brum.beds.ac.uk/10.3390/ijerph17176312
Chicago/Turabian StyleOry, Marcia G., Shinduk Lee, Samuel D. Towne, Jr., Starr Flores, Olga Gabriel, and Matthew Lee Smith. 2020. "Implementing a Diabetes Education Program to Reduce Health Disparities in South Texas: Application of the RE-AIM Framework for Planning and Evaluation" International Journal of Environmental Research and Public Health 17, no. 17: 6312. https://0-doi-org.brum.beds.ac.uk/10.3390/ijerph17176312