Spatial Analysis of the Neighborhood Risk Factors for Respiratory Health in the Australian Capital Territory (ACT): Implications for Emergency Planning


Abstract
:1. Introduction
1.1. Changing Climate, Increasing Health Risk
1.2. Health Planning and Preparedness
1.3. Respiratory Health
2. Materials and Methods
2.1. Study Area
2.2. Data Sources
2.3. Data Exclusions
2.4. Modelling Methods
+ β4 (ui, vi) Over65i + β5 (ui, vi) IRSADi + log(Popi) + εi
+ log(Popi) + εi
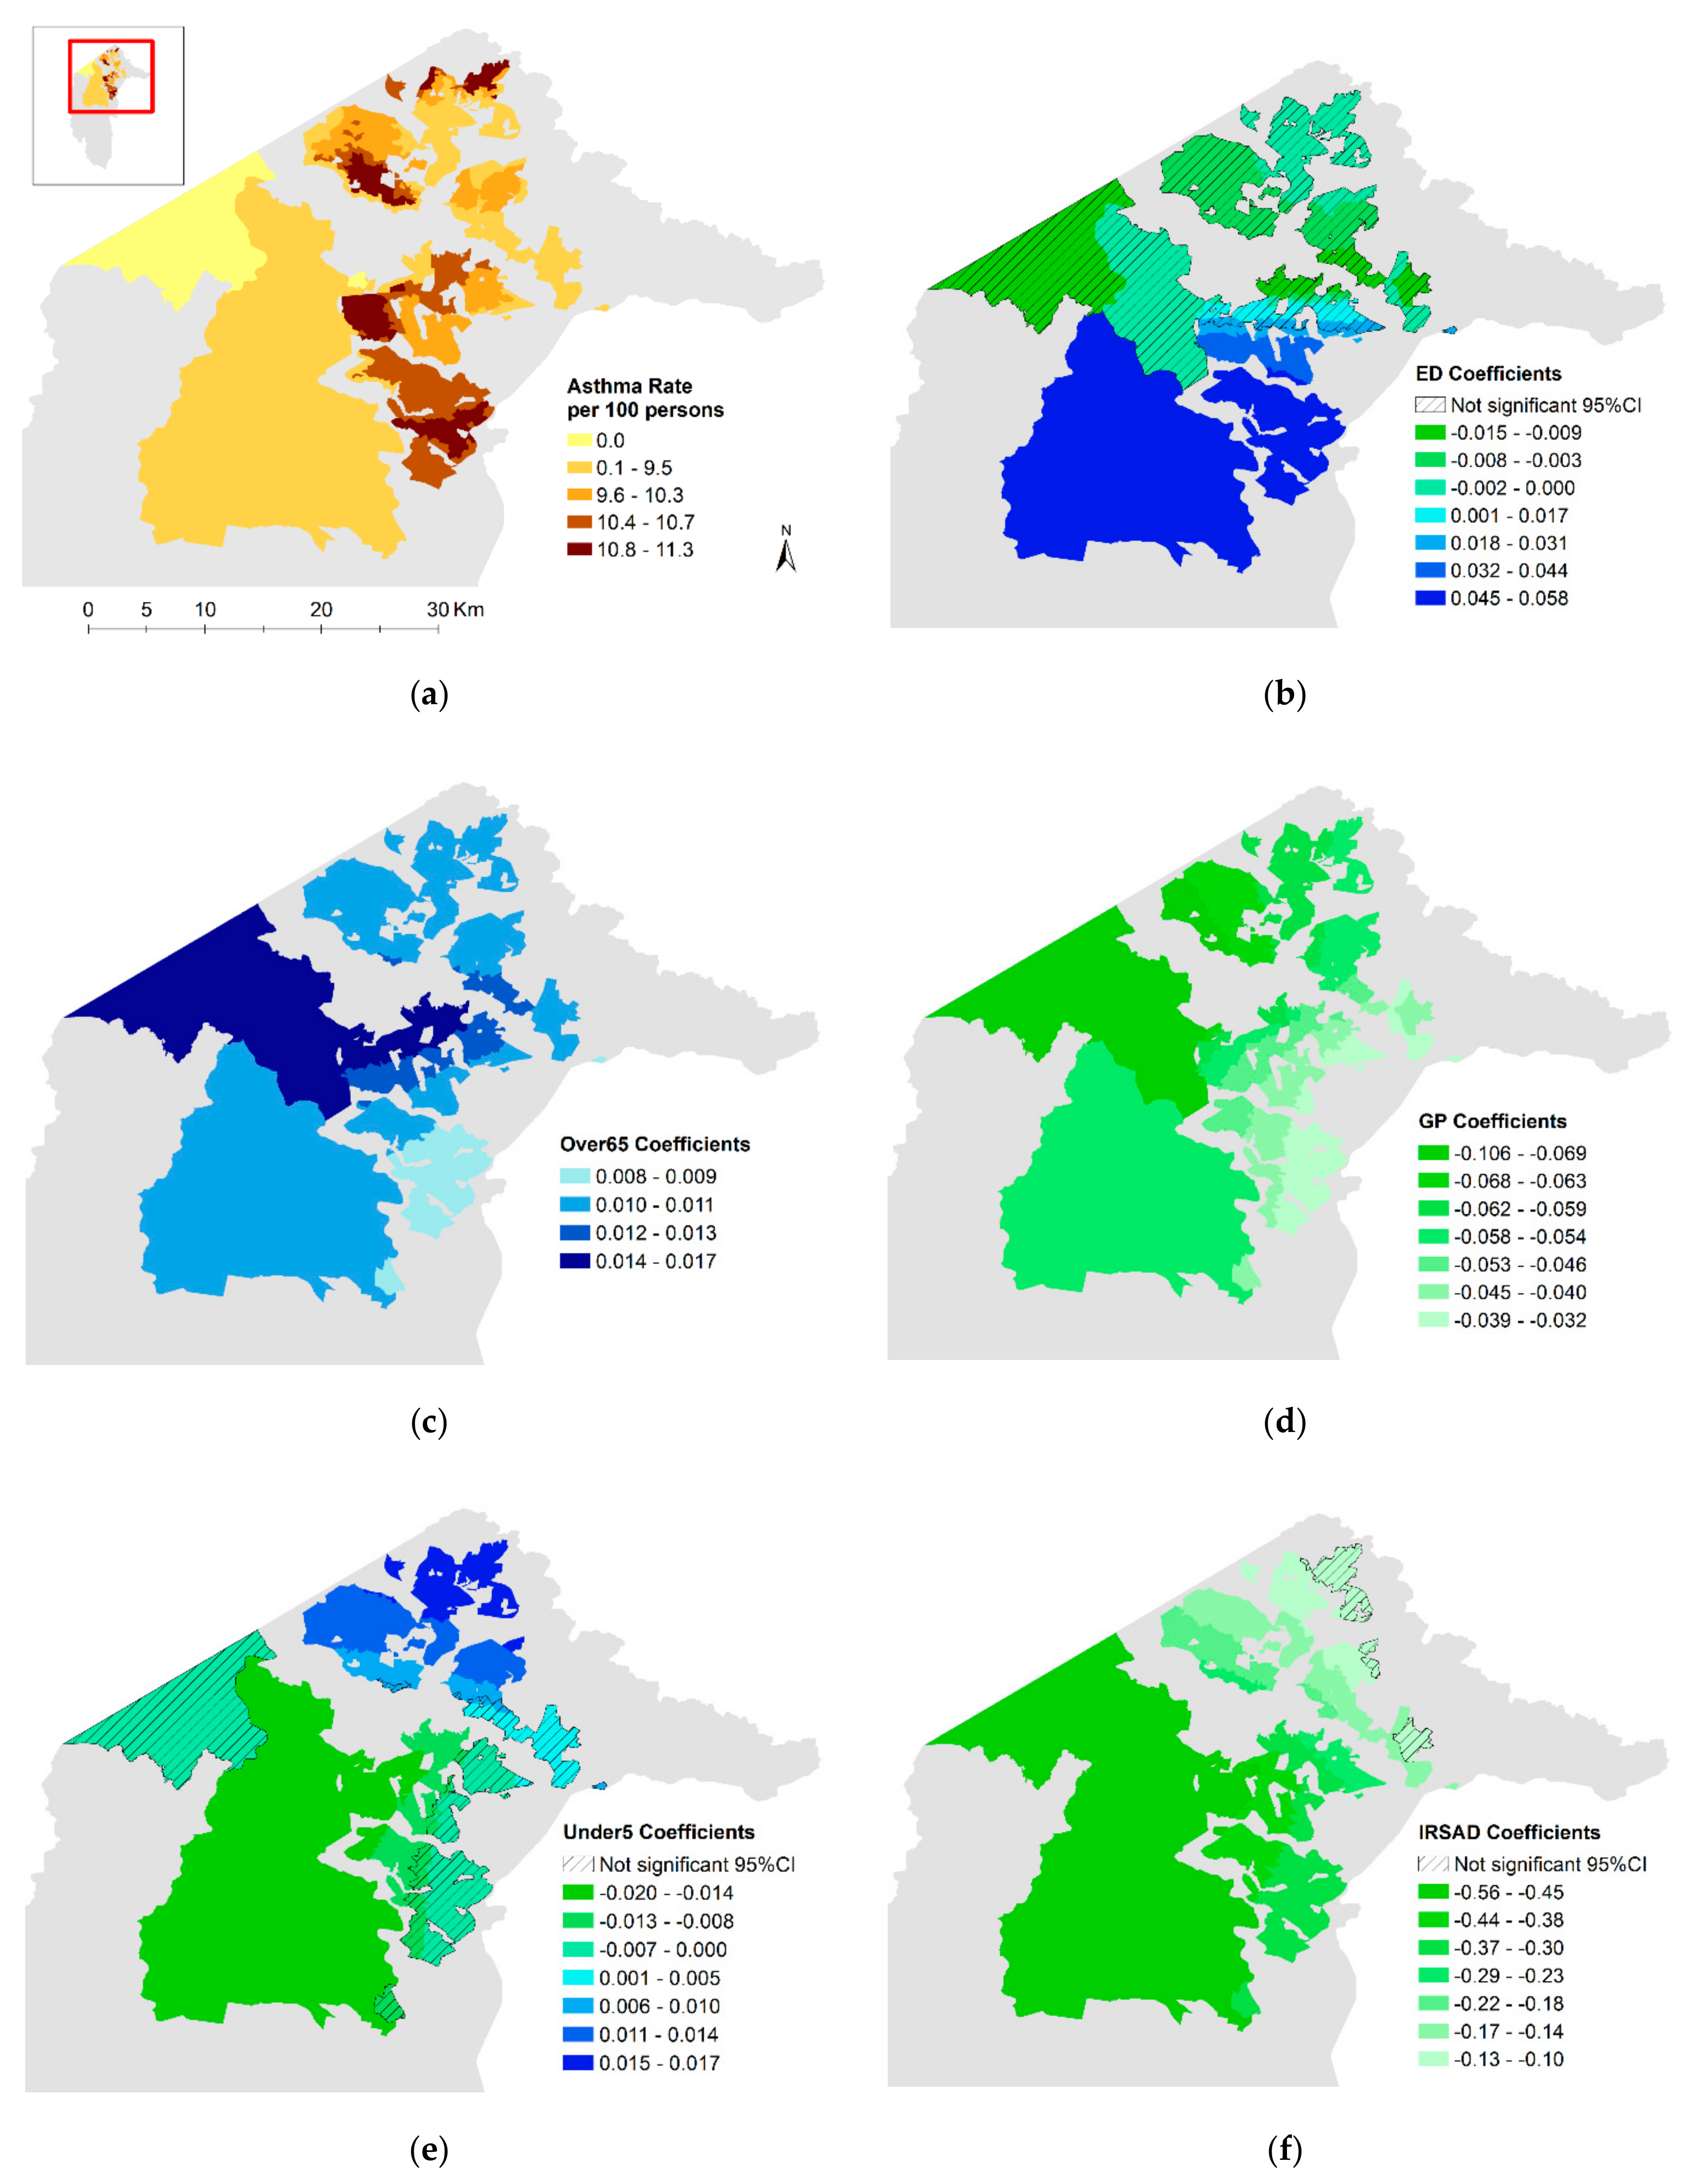
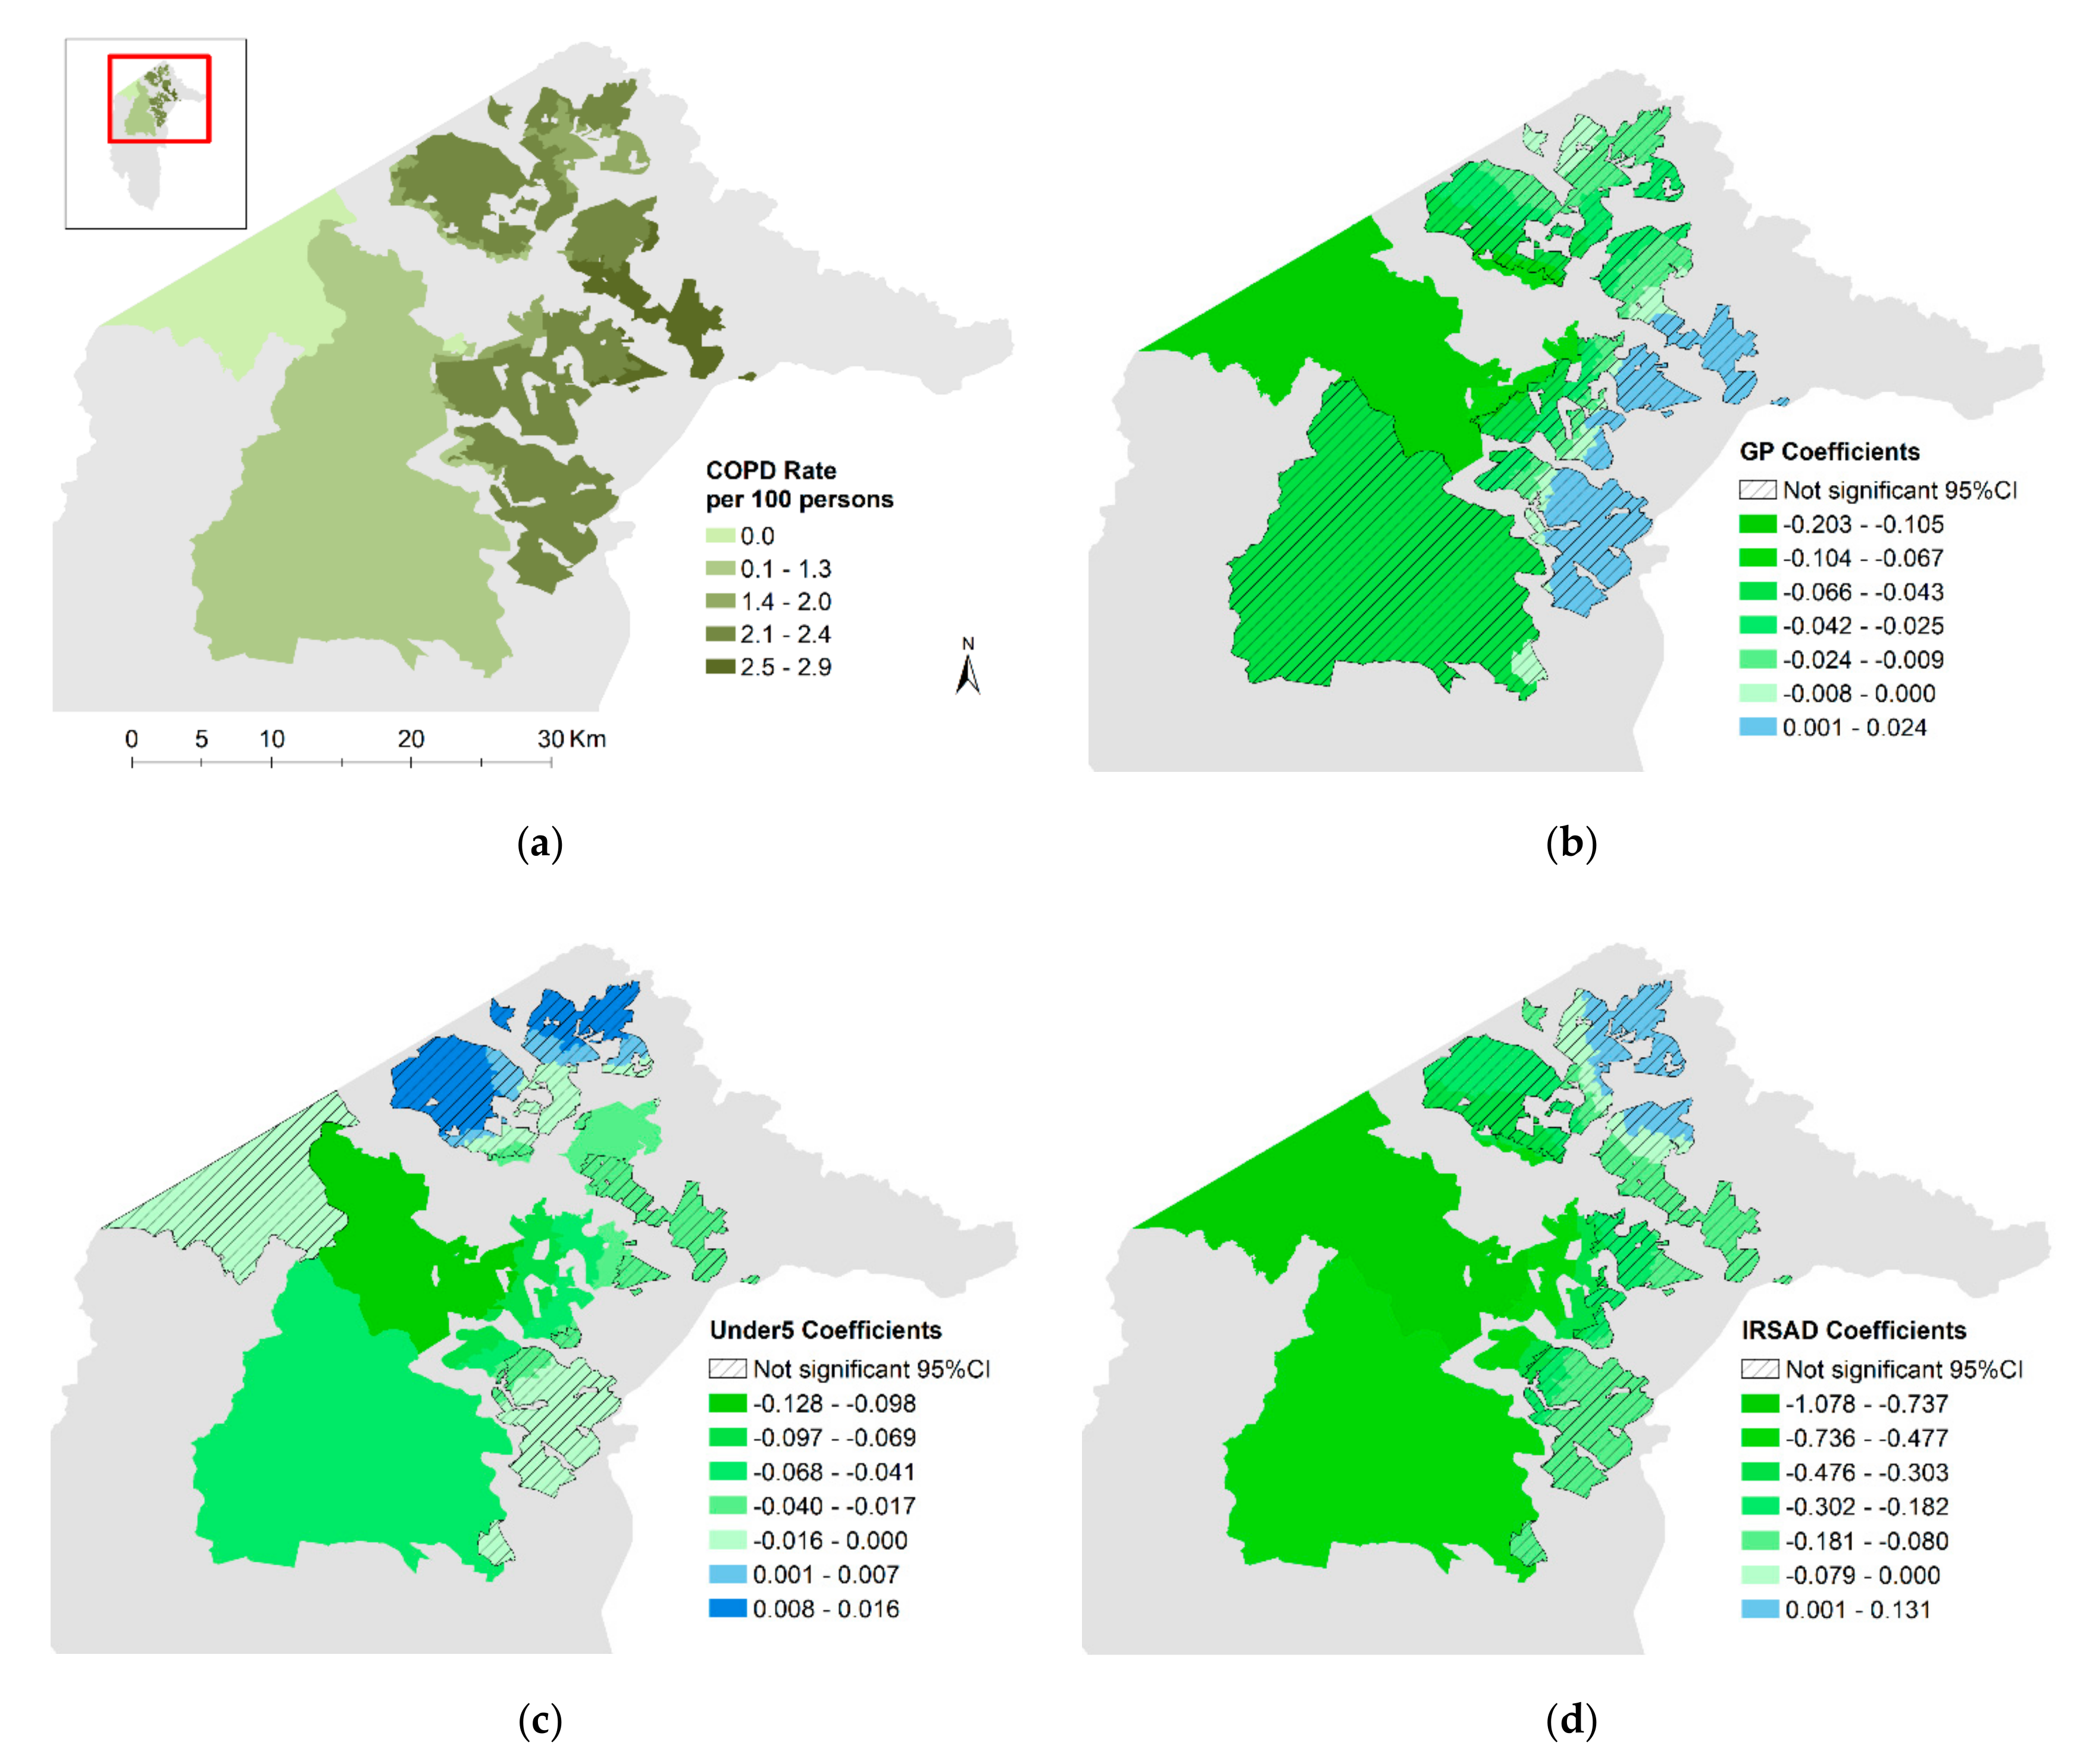
3. Results
3.1. Spatial Distribution of Variables
3.2. Cluster Analysis
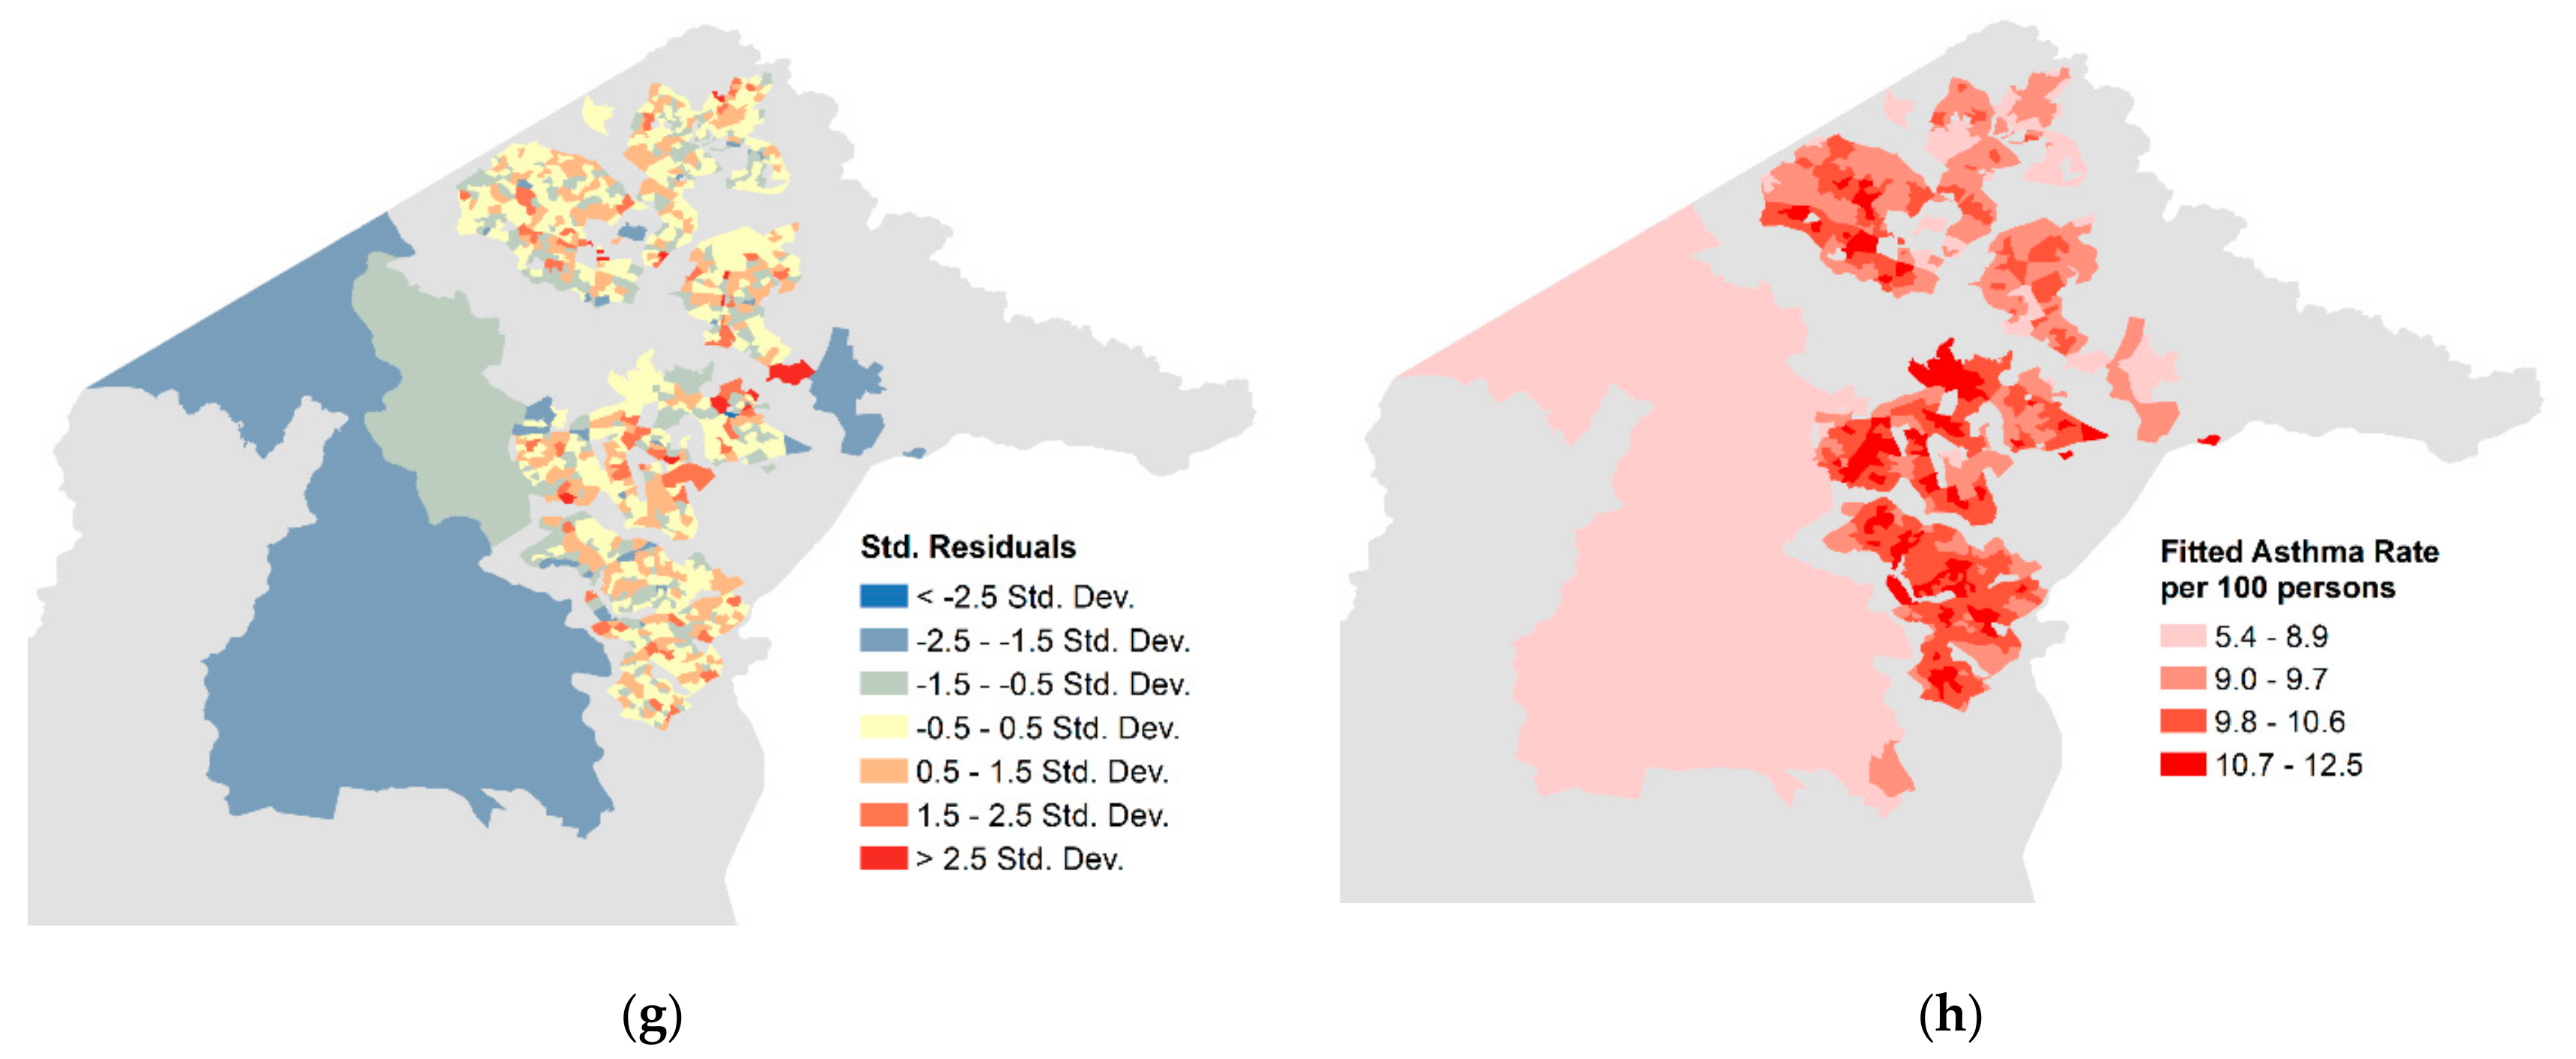
3.3. Modelling Results
3.4. COPD
4. Discussion
4.1. Access to Health Services
4.2. Age
4.3. Socioeconomic Status
4.4. Model Fit
4.5. Limitations, Strengths, and Areas for Future Analysis
4.6. Implications for Health Service Planning
5. Conclusions
Supplementary Materials
Author Contributions
Funding
Acknowledgments
Conflicts of Interest
References
- Costello, A.; Abbas, M.; Allen, A.; Ball, S.; Bell, S.; Bellamy, R.; Friel, S.; Groce, N.; Johnson, A.; Kett, M.; et al. Managing the health effects of climate change: Lancet and university college London Institute for Global Health Commission. Lancet 2009, 373, 1693–1733. [Google Scholar] [CrossRef]
- Beggs, P.J.; Zhang, Y.; Bambrick, H.; Berry, H.L.; Linnenluecke, M.K.; Trueck, S.; Bi, P.; Boylan, S.M.; Green, D.; Guo, Y.; et al. The 2019 Report of the MJA—Lancet Countdown on Health and Climate Change: A turbulent year with mixed progress. Med. J. Aust. 2019, 211, 490–491. [Google Scholar] [CrossRef] [PubMed] [Green Version]
- Watts, N.; Amann, M.; Arnell, N.; Ayeb-Karlsson, S.; Belesova, K.; Boykoff, M.; Byass, P.; Cai, W.; Campbell-Lendrum, D.; Capstick, S.; et al. The 2019 report of the lancet countdown on health and climate change: Ensuring that the health of a child born today is not defined by a changing climate. Lancet 2019, 394, 1836–1878. [Google Scholar] [CrossRef] [Green Version]
- Barros, V.R.; Field, C.B.; Dokken, D.J.; Mastrandrea, M.D.; Mach, K.J.; Bilir, T.E.; Chatterjee, K.L. Climate Change 2014: Impacts, Adaptation, and Vulnerability. Part B: Regional Aspects. Contribution of Working Group II to the Fifth Assessment Report of the Intergovernmental Panel on Climate Change; IPCC: Geneva, Switzerland, 2014. [Google Scholar]
- CSIRO; Bureau of Meteorology; Australian Government. State of the Climate 2018; CSIRO: Canberra, Australia, 2018.
- Borchers Arriagada, N.; Palmer, A.J.; Bowman, D.M.; Morgan, G.G.; Jalaludin, B.B.; Johnston, F.H. Unprecedented Smoke-related Health Burden Associated with the 2019–20 Bushfires in Eastern Australia. Med. J. Aust. 2020, 213. [Google Scholar] [CrossRef]
- Liu, J.C.; Pereira, G.; Uhl, S.A.; Bravo, M.A.; Bell, M.L. A systematic review of the physical health impacts from non-occupational exposure to wildfire smoke. Environ. Res. 2015, 136, 120–132. [Google Scholar] [CrossRef] [Green Version]
- Reid, C.E.; Brauer, M.; Johnston, F.H.; Jerrett, M.; Balmes, J.R.; Elliott, C.T. Critical review of health impacts of wildfire smoke exposure. Environ. Health Perspect. 2016, 124, 1334–1343. [Google Scholar] [CrossRef] [PubMed] [Green Version]
- National Archives of Australia. Natural Disasters. Available online: http://guides.naa.gov.au/records-about-act/part2/chapter12/12.6.aspx (accessed on 19 May 2020).
- CSIRO. The 2019–2020 bushfires: A CSIRO Explainer. Available online: https://www.csiro.au/en/Research/Environment/Extreme-Events/Bushfire/preparing-for-climate-change/2019-20-bushfires-explainer (accessed on 21 May 2020).
- ACT Health. Air quality in the ACT [Data File]. Available online: https://www.health.act.gov.au/about-our-health-system/population-health/environmental-monitoring/monitoring-and-regulating-air (accessed on 21 May 2020).
- Cox, L.; Cordell, M.; Ball, A.; Evershed, N.; Fanner, D. The toxic air we breathe: The Health Crisis from Australia’s Bushfires. The Guardian. Available online: https://www.theguardian.com/environment/ng-interactive/2020/feb/20/the-toxic-air-we-breathe-the-health-crisis-from-australias-bushfires (accessed on 19 May 2020).
- World Health Organization. WHO Air Quality Guidelines for Particulate Matter, Ozone, Nitrogen Dioxide and Sulfur Dioxide, Global Update 2005; WHO/SDE/PHE/OEH/06.02; World Health Organization: Geneva, Switzerland, 2006. [Google Scholar]
- Cousins, S. Bushfires Expose Weaknesses in Australia’s Health System. Lancet 2020, 395, 175–176. [Google Scholar] [CrossRef]
- Global Asthma Network. The Global Asthma Report 2018; Global Asthma Network: Auckland, New Zealand, 2018. [Google Scholar]
- ABS. National Health Survey, First Results, Australia 2017–2018; 4364.0.55.001; ABS: Canberra, Australia, 2018.
- National Asthma Council Australia. Australian Asthma Handbook; Version 2.0; National Asthma Council Australia: Melbourne, Australia, 2019. [Google Scholar]
- Australian Institute of Health and Welfare. Australia’s Health 2018; Australia’s Health Series, No. 16; AIHW: Canberra, Australia, 2018.
- Australian Institute of Health and Welfare. Chronic Obstructive Pulmonary Disease (COPD); Cat. No. ACM 35; AIHW: Canberra, Australia, 2019.
- Salvi, S.S.; Barnes, P.J. Chronic obstructive pulmonary disease in non-smokers. Lancet 2009, 374, 733–743. [Google Scholar] [CrossRef]
- Celli, B.R.; Barnes, P.J. Exacerbations of chronic obstructive pulmonary disease. Eur. Respir. J. 2007, 29, 1224–1238. [Google Scholar] [CrossRef]
- National Capital Authority. Factsheets. Available online: https://www.nca.gov.au/factsheets (accessed on 2 June 2020).
- Torrens University Australia. Public Health Information Development Unit: SA2 Chronic Disease—Modelled Estimate 2011–2013; Torrens University Australia: Adelaide, Australia, 2014. [Google Scholar]
- PSMA. Geocoded National Address File (G-NAF); ©PSMA Australia Limited licensed by the Commonwealth of Australia under the Open Geo-coded National Address File (G-NAF) End User Licence Agreement; PSMA: Canberra, Australia, 2016. [Google Scholar]
- ACTmapi. ACT Feature Names; Environment and Planning Directorate, ACT Government ©Australian Capital Territory. Available online: https://actmapi-actgov.opendata.arggis.com/datasets/act-feature-names (accessed on 26 February 2020).
- ABS. Australian Bureau of Statistics Population by Age and Sex, Regions of Australia, 2016; Data Cube: Excel Spreadsheet Cat. No. 3235.0. Available online: https://abs.gov.au/AUSSTATS/[email protected]/DetailsPage/3235.02016?OpenDocument (accessed on 24 February 2020).
- ABS. Australian Bureau of Statistics Census of Population and Housing: Socio-Economic Indexes for Areas (SEIFA), Australia 2016. Available online: https://www.abs.gov.au/AUSSTATS/[email protected]/DetailsPage/2033.0.55.0012016?OpenDocument (accessed on 26 February 2020).
- ABS. SA1 Aggregated Population & Dwelling Counts 2016 Census for Australia—AURIN Data. 2017. Available online: https://data.aurin.org.au/dataset/au-govt-abs-sa1-aggregated-pop-and-dwelling-counts-census-2016-sa1-2016 (accessed on 3 March 2020).
- Comber, A.J.; Brunsdon, C.; Radburn, R. A spatial analysis of variations in health access: Linking geography, socio-economic status and access perceptions. Int. J. Health Geogr. 2011, 10, 44. [Google Scholar] [CrossRef] [Green Version]
- Australian Institute of Health and Welfare. Geographic Distribution of Asthma and Chronic Obstructive Pulmonary Disease Hospitalisations in Australia: 2007–2008 to 2009–2010; Cat. No. ACM 26; AIHW: Canberra, Australia, 2013.
- Pleasants, R.A.; Riley, I.L.; Mannino, D.M. Defining and Targeting Health Disparities in Chronic Obstructive Pulmonary Disease. Int. J. Chronic Obs. Pulm. Dis. 2016, 11, 2475–2496. [Google Scholar] [CrossRef] [PubMed] [Green Version]
- Ouédraogo, A.M.; Crighton, E.J.; Sawada, M.; To, T.; Brand, K.; Lavigne, E. Exploration of the Spatial Patterns and Determinants of Asthma Prevalence and Health Services Use in Ontario Using a Bayesian Approach. PLoS ONE 2018, 13, e0208205. [Google Scholar] [CrossRef] [PubMed] [Green Version]
- Australian Institute of Health and Welfare. Asthma; Cat. No. ACM 33; AIHW: Canberra, Australia, 2019.
- Levesque, J.-F.; Harris, M.F.; Russell, G. Patient-Centred Access to Health Care: Conceptualising Access at the Interface of Health Systems and Populations. Int. J. Equity Health 2013, 12, 18. [Google Scholar] [CrossRef] [PubMed] [Green Version]
- Corscadden, L.; Levesque, J.-F.; Lewis, V.; Breton, M.; Sutherland, K.; Weenink, J.-W.; Haggerty, J.; Russell, G. Barriers to accessing primary health care: Comparing australian experiences internationally. Aust. J. Prim. Health 2017, 23, 223–228. [Google Scholar] [CrossRef] [PubMed] [Green Version]
- Kelly, C.; Hulme, C.; Farragher, T.; Clarke, G. Are differences in travel time or distance to healthcare for adults in global north countries associated with an impact on health outcomes? A systematic review. BMJ Open 2016, 6, e013059. [Google Scholar] [CrossRef]
- Australian Institute of Health and Welfare. Rural & Remote Health; Cat no. PHE255; AIHW: Canberra, Australia, 2019.
- Australian Government, Department of Health. Health Workforce Data|Calendar Year [Data File]. Available online: https://hwd.health.gov.au/CalendarYear.html (accessed on 14 May 2020).
- Feng, X.; Astell-Burt, T. Is neighborhood green space protective against associations between child asthma, neighborhood traffic volume and perceived lack of area safety? Multilevel analysis of 4447 Australian Children. Int. J. Environ. Res. Public Health 2017, 14, 235. [Google Scholar] [CrossRef] [Green Version]
- Ferrante, G.; Asta, F.; Cilluffo, G.; De Sario, M.; Michelozzi, P.; La Grutta, S. The effect of residential urban greenness on allergic respiratory diseases in youth: A narrative review. World Allergy Organ J. 2020, 13, 100096. [Google Scholar] [CrossRef] [PubMed] [Green Version]
- Sarkar, C.; Zhang, B.; Ni, M.; Kumari, S.; Bauermeister, S.; Gallacher, J.; Webster, C. Environmental correlates of chronic obstructive pulmonary disease in 96 779 participants from the UK Biobank: A cross-sectional, observational study. Lancet Planet Health 2019, 3, e478–e490. [Google Scholar] [CrossRef] [Green Version]
- Ellison-Loschmann, L.; Sunyer, J.; Plana, E.; Pearce, N.; Zock, J.-P.; Jarvis, D.; Janson, C.; Antó, J.M.; Kogevinas, M. Socioeconomic status, asthma and chronic bronchitis in a large community-based study. Eur. Respir. J. 2007, 29, 897–905. [Google Scholar] [CrossRef] [Green Version]
- PHIDU. The Socioeconomic Gradient and Chronic Conditions in Australia: Results from the 2011-13 Australian Health Survey; Public Health Information Development Unit, Torrens University Australia: Adelaide, Australia, 2015. [Google Scholar]
- Prescott, E.; Vestbo, J. Socioeconomic status and chronic obstructive pulmonary disease. Thorax 1999, 54, 737–741. [Google Scholar] [CrossRef] [PubMed] [Green Version]
- Sahni, S.; Talwar, A.; Khanijo, S.; Talwar, A. Socioeconomic status and its relationship to chronic respiratory disease. Adv. Respir. Med. 2017, 85, 97–108. [Google Scholar] [CrossRef] [Green Version]
- Reid, C.E.; Jerrett, M.; Tager, I.B.; Petersen, M.L.; Mann, J.K.; Balmes, J.R. Differential respiratory health effects from the 2008 northern california wildfires: A spatiotemporal approach. Environ. Res. 2016, 150, 227–235. [Google Scholar] [CrossRef] [PubMed] [Green Version]
- Charlton, M.; Fotheringham, A.S. Geographically Weighted Regression Tutorial; National Centre for Geocomputation National University of Ireland Maynooth: Maynooth, Ireland, 2016. [Google Scholar]
- ACT Health. Monitoring and Regulating Air Pollution. Available online: https://www.health.act.gov.au/about-our-health-system/population-health/environmental-monitoring/monitoring-and-regulating-air-5 (accessed on 17 May 2020).
- Martin, K.L.; Hanigan, I.C.; Morgan, G.G.; Henderson, S.B.; Johnston, F.H. Air pollution from bushfires and their association with hospital admissions in Sydney, Newcastle and Wollongong, Australia 1994–2007. Aust. N. Z. J. Public Health 2013, 37, 238–243. [Google Scholar] [CrossRef]
- Yang, T.; Jin, Y.; Yan, L.; Pei, P. Aspirations and realities of polycentric development: Insights from multi-source data into the emerging urban form of Shanghai. Environ. Plan. B Urban Anal. City Sci. 2019, 46, 1264–1280. [Google Scholar] [CrossRef]
- Ellen, I.G.; Mijanovich, T.; Dillman, K.-N. Neighborhood Effects on health: Exploring the links and assessing the evidence. J. Urban Aff. 2001, 23, 391–408. [Google Scholar] [CrossRef]


| Dependent Variables | |||
|---|---|---|---|
| Name | Description | Data Integration | Source |
| Asthma count | Estimated number of people with asthma prevalent over a 2-year period, 2011–2013 | Asthma rate at 2011 SA2 level applied to 2016 SA1 level using a spatial join and averaging the rates for intersecting polygons. Asthma count then calculated as SA1 asthma rate x SA1 population and rounded to nearest whole number | Torrens University Australian Public Health Information Development Unit accessed through the Australian Urban Research Infrastructure Network-AURIN [23] |
| COPD count | Estimated number of people with COPD prevalent over a 2-year period, 2011–2013 | COPD rate at 2011 SA2 level applied to 2016 SA1 level using a spatial join and averaging the rates for intersecting polygons. COPD count then calculated as SA1 asthma rate x SA1 population and rounded to nearest whole number | |
| Explanatory Variables | |||
| Name | Description | Data Integration | Source(s) |
| ED | Average straight-line distance from each residence to nearest hospital emergency department | Euclidian distance between each residence location and nearest ED calculated then averaged over all residences within each SA1 block | Residence locations: Geo-coded National Address File (G-NAF) [24] Hospital locations: ACT Government [25] |
| GP | Average straight-line distance from each residence to the nearest General practice | Euclidian distance between each residence location and nearest GP calculated, then averaged over all residences within each SA1 block | Residence locations: Geo-coded National Address File (G-NAF) [24] GP locations: Datajet licensed marketing database accessed through the Australian National University Research School of Population Health |
| Under5 | Percentage of the population under 5 years of age | Data at SA2 level applied to each SA1 block within it | Australian Bureau of Statistics 2016 census data [26] |
| Over65 | Percentage of the population over 65 years of age | Data at SA2 level applied to each SA1 block within it | |
| IRSAD | Index of Relative Socioeconomic Advantage and Disadvantage. Low values indicate a high proportion of relatively disadvantaged people and a low proportion of relatively advantaged people in an area | Data available at SA1 level | Australian Bureau of Statistics 2016 census data [27] |
| Pop | Total population | Data available at SA1 level | Australian Bureau of Statistics 2016 census data [28] |
| Variables: N = 1013 | Mean | SD | Median | Min | Max |
|---|---|---|---|---|---|
| Asthma Rate (per 100 persons) | 9.7 | 1.6 | 10.1 | 0 | 11.3 |
| COPD Rate (per 100 persons) | 2.2 | 0.3 | 2.3 | 0 | 2.9 |
| Asthma Count | 37.2 | 14.1 | 36.0 | 0 | 166 |
| COPD Count | 8.3 | 3.2 | 8.0 | 0 | 37 |
| Distance to ED (km) | 6.4 | 3.0 | 6.2 | 0.4 | 18.4 |
| Distance to GP (km) | 0.8 | 0.6 | 0.6 | 0.1 | 11.4 |
| Population (N) | 383 | 130 | 368 | 50 | 1564 |
| Population under 5 (%) | 7.1 | 2.3 | 7.1 | 0 | 14.5 |
| Population over 65 (%) | 12.4 | 5.8 | 12.4 | 0.5 | 27.2 |
| IRSAD Score | 1088 | 62 | 1092 | 697 | 1239 |
| Variable | Asthma Count | COPD Count | ||||||||||
|---|---|---|---|---|---|---|---|---|---|---|---|---|
| Poisson | GWR-Poisson | Poisson | GWR-Poisson | |||||||||
| Coeff | Std Error | VIF | Local Coefficients | Coeff | Std Error | VIF | Local Coefficients | |||||
| Mean | Median | Mean | Median | |||||||||
| ED | 0.035 ** | 0.003 | 1.58 | 0.014 | −0.002 | |||||||
| GP | −0.054 *** | 0.008 | 1.22 | −0.054 | −0.057 | −0.039 * | 0.017 | 1.17 | −0.024 | −0.020 | ||
| Under5 | 0.006 * | 0.003 | 1.64 | 0.002 | −0.007 | −0.010 | 0.005 | 1.16 | −0.022 | −0.007 | ||
| Over65 | 0.010 *** | 0.001 | 1.57 | 0.011 | 0.010 | |||||||
| IRSAD | −0.243 *** | 0.048 | 1.08 | −0.255 | −0.215 | −0.221 * | 0.098 | 1.03 | −0.224 | −0.170 | ||
| Morans I residuals | Index | z | p | Index | z | p | Index | z | p | Index | z | p |
| 0.16 | 49.2 | 0.0000 | 0.04 | 7.5 | 0.0000 | 0.179 | 54.5 | 0.0000 | 0.019 | 6.1 | 0.0000 | |
| Deviance explained | 0.128 | 0.279 | 0.063 | 0.437 | ||||||||
| AIC | 6601 | 3153 | 4218 | 774 | ||||||||
© 2020 by the authors. Licensee MDPI, Basel, Switzerland. This article is an open access article distributed under the terms and conditions of the Creative Commons Attribution (CC BY) license (http://creativecommons.org/licenses/by/4.0/).
Share and Cite
Davies, S.; Konings, P.; Lal, A. Spatial Analysis of the Neighborhood Risk Factors for Respiratory Health in the Australian Capital Territory (ACT): Implications for Emergency Planning. Int. J. Environ. Res. Public Health 2020, 17, 6396. https://0-doi-org.brum.beds.ac.uk/10.3390/ijerph17176396
Davies S, Konings P, Lal A. Spatial Analysis of the Neighborhood Risk Factors for Respiratory Health in the Australian Capital Territory (ACT): Implications for Emergency Planning. International Journal of Environmental Research and Public Health. 2020; 17(17):6396. https://0-doi-org.brum.beds.ac.uk/10.3390/ijerph17176396
Chicago/Turabian StyleDavies, Sarah, Paul Konings, and Aparna Lal. 2020. "Spatial Analysis of the Neighborhood Risk Factors for Respiratory Health in the Australian Capital Territory (ACT): Implications for Emergency Planning" International Journal of Environmental Research and Public Health 17, no. 17: 6396. https://0-doi-org.brum.beds.ac.uk/10.3390/ijerph17176396